Article

Spatial Differentiation Effect of Rural Logistics in Urban Agglomerations in China Based on the Fuzzy Neural Network

School of Economics and Management, Chongqing Jiaotong University, Chongqing 400074, China
*
Author to whom correspondence should be addressed.
Sustainability 2022, 14(15), 9268; https://doi.org/10.3390/su14159268
Submission received: 18 June 2022 / Revised: 23 July 2022 / Accepted: 25 July 2022 / Published: 28 July 2022

Abstract

:
Rural logistics is particularly important for the sustainable development of Chinese urban agglomeration, which features the coexistence of urban circles and vast countryside. However, the existing literature generally focuses on urban logistics while ignoring rural logistics. Taking the Chengdu-Chongqing agglomeration as an example, this study constructed a rural logistics index system and proposed a new dynamic assessment model for rural logistics development using a fuzzy neural network, Moran index, and Kernel density estimation. The results are as follows: the development of rural logistics has been enhanced, and gaps among cities have gradually narrowed over the past decade. In particular, the spatial distribution of rural logistics showcases a dual-core structure in the Chengdu-Chongqing agglomeration, which is different from the unipolar structure manifested in other urban agglomerations. Because of administrative barriers, the impact from the dual-core cities is very different: Chengdu has a significant spillover effect on its surrounding cities, which is not the case for Chongqing. The findings are of great significance for local governments to provide decision-making support for the sustainable development of urban agglomerations.

1. Introduction

As a new form of regional spatial organization [1], urban agglomeration has become a global trend in sustainable development [2,3]. Some famous urban agglomerations include the Atlantic coastal urban agglomeration in the northeastern United States [4,5], the Great Lakes urban agglomeration in the United States [6,7], the Pacific coastal urban agglomeration in Japan [8], the urban agglomeration in England with London as its center [9], the Paris-centered northwest Europe urban agglomeration [10], and the Yangtze River Delta urban agglomeration in China [11]. By publishing policies on new urbanization and rural revitalization [12], the Chinese government has focused on developing four urban agglomerations from 2021 to 2025: the Yangtze River Delta, the Pearl River Delta, the Beijing-Tianjin-Hebei regions, and the Chengdu-Chongqing region. Logistics is a key link for the development of urban agglomeration [13,14]. According to data from the China Post Bureau, China’s express deliveries reached 108.3 billion pieces in 2021, exceeding 100 billion for the first time, with the above four urban agglomerations accounting for more than 70%, at a growth rate of 22.9% (Data are from the 2021 China Post Bureau. https://www.spb.gov.cn/, accessed on 13 May 2022). The integration degree of the logistics industry continues to improve for sustainable economic and social development. Compared with other countries, China’s urban agglomerations have shown some special characteristics. Due to low urbanization rates [15], there are still huge rural areas in the urban agglomerations across China. By the end of 2020, in fact, 36.11% of China’s population still lived in rural areas (Data are from the 2021 China Statistical Yearbook. http://www.stats.gov.cn/tjsj/ndsj/2021/indexch.htm, accessed on 13 May 2022). Therefore, rural logistics has become a new problem driving Chinese urban agglomeration.
Most of the existing literature focuses on urban logistics, including evaluation of urban logistics levels [16], exploration of the impact of urban logistics on citizens’ life quality [17,18], and examination of sustainable development of urban economy [19]. In contrast, few studies have been made on rural logistics, with only sporadic research discussing route optimization in managing agricultural logistics supply chains [20,21,22]. Research on how to evaluate the development of rural logistics is scarce. Therefore, it is necessary to further explore how to evaluate rural logistics in the context of urban agglomeration. This paper constructed a rural logistics index system and proposed a new dynamic assessment model for rural logistics development using a fuzzy neural network. The Chengdu-Chongqing agglomeration, the most important urban agglomeration in inland China, was chosen as the case study. The rural logistics comprehensive index of each city in the urban agglomeration from 2010 to 2020 has been calculated, and the spatial distribution of rural logistics in the Chengdu-Chongqing agglomeration has been further analyzed.
The contributions of this paper are: First, the sustainable development of urban agglomeration was analyzed in rural logistics, a perspective different from prior research that generally focused on the logistics among metropolitan areas in urban agglomerations. Second, it constructed a new dynamic assessment method for rural logistics development in urban agglomerations based on fuzzy neural network, Moran’s Index, and Kernel density estimation. This method differs from the qualitative description of rural logistics as shown in the existing literature. The quantitative approach can avoid the shortcomings of subjective assignments in the evaluation process when pinpointing the spatiotemporal evolution characteristics of rural logistics development in urban agglomerations.
According to the Ministry of Transport of the People’s Republic of China, rural logistics directly serves the production, life, and other economic activities of rural residents, thus becoming an important guarantee for the circulation of industrial products and agricultural produce between urban and rural communities. Rural logistics is an important foundation for agricultural modernization as well as an important way to improve the living standards of both urban and rural residents; and developing rural logistics is an effective measure to reduce the logistics cost of the whole society (Ministry of Transport of the People’s Republic of China. https://www.mot.gov.cn/zhengcejiedu/nongcunwuliujkfz/, accessed on 1 June 2022). To measure the development levels of rural logistics in urban agglomerations, this study establishes an urban-rural logistics index system that makes trial calculations of a comprehensive index for urban logistics development based on the existing literature on logistics evaluation in four aspects: rural logistics demand, agricultural production capacity, rural infrastructure, and rural informatization. On this basis, a spatial and temporal evolution of rural logistics in urban agglomerations was conducted.
The structure of this paper is as follows: Section 2 provides a literature review; Section 3 proposes a rural logistics index system for urban agglomerations; Section 4 describes the methodology of this study; Section 5 showcases the results of this study; Section 6 makes some discussions, and Section 7 gives the conclusion.

2. Literature Review

2.1. The Importance of Logistics

The existing literature is mainly focused on the importance of logistics in urban development, given that urban logistics has a great impact on the sustainable development of cities [23]. Taniguchi put forward the concept of urban logistics in 1999, maintaining that urban public logistics nodes could be established to alleviate urban traffic congestion and promote urban economic growth [24]. Based on the implementation experience in the first phase of the C-LIEGE project in Poland, Iwan proposed that urban logistics should adapt to the economic development of cities, while logistics development plans should be formulated according to the actual conditions of each city to improve the overall urban service efficiency [25]. Schliwa identified urban freight and logistics as the core of the British economy and laid out a sustainable urban logistics framework for the operation of the logistics industry and future research [26]. Rześny found that urban logistics was particularly important for local residents and enterprises in Tricity due to its unique geographical advantage [27]. According to Russo, urban logistics forms the cornerstone of social development and has become one of the most important research fields in recent years [28]. Kang and Pang found urban logistics crucial to e-commerce trades of fresh agricultural produce, so it plays a leading role in enhancing the competitiveness of online sales [29].
In summary, strong logistics have very important functions in the social and economic development of urban agglomerations. Nevertheless, the existing literature mainly focuses on urban logistics or the logistics in metropolitan areas while ignoring rural logistics. Accordingly, the existing research rarely analyzes the features of rural logistics in urban agglomerations. In fact, an effective supply of agricultural produce is a foundation for the normal operation of cities, so rural logistics and metropolitan logistics are equally important for the social and economic development of urban agglomerations. Therefore, this study chooses rural logistics in an urban agglomeration as its research object.

2.2. Evaluation of the Logistics Development

When evaluating logistics development, most existing literature focuses on urban logistics in two main categories. One is to evaluate urban logistics development from the perspective of efficiency improvement. For example, Morfoulaki has introduced specific policies and measures to strengthen the development of logistics in small- and medium-sized cities and evaluated the sustainable development of urban logistics in Ceres, Greece, through multi-standard analysis [30]. Viana has established a multi-criteria evaluation based on GIS to seek a balance between the convenience of life brought by urban logistics and the social costs incurred, including traffic congestion and environmental pollution [31]. Juvvala and Sarmah have proposed a model to evaluate the deployment of electric vehicles in urban logistics to reduce the carbon pollution caused by trucks [32]. Zhao has appraised the transit capacity of subway stations in four network centrality indexes, with an evaluation system constructed for urban subway logistics based on the hub-and-spoke network model [33].
Another category is to evaluate urban logistics development from the perspective of risk management. Considering the impact of a flood on urban logistics, Oliveira has introduced an intelligent modeling method for urban logistics in an environment of vulnerability assessment [34]. Based on the social network analysis, Liu has explored the relationship among multiple risk factors in the ecological chain of smart logistics while verifying the proposed research framework and evaluation system by taking the RRS logistics company as an example [35]. Qazi has developed a probabilistic network model to analyze the country’s risk factors that influence logistics performance [36].
Over recent years, some scholars have begun to evaluate the development of urban logistics in terms of urban agglomeration. Zheng has evaluated logistics efficiency and performance in China under the Belt and Road Initiative based on comprehensive DEA and hierarchical regression analysis with carbon constraints [37]. By using the three-stage Super-SBM model to eliminate environmental factors and random errors, Liang introduced the Malmquist index model to measure the low-carbon logistics efficiency of 13 cities in Jiangsu Province, China [38]. Zhuang has established an evaluation system for logistics input and economic output in urban agglomerations based on data-driven analysis to measure the logistics economic benefits in major first-tier cities across China [39].
In summary, as can be obtained from Table 1, the existing literature is concentrated on evaluating the development levels and influencing factors of urban logistics. Recently, urban logistics, especially in metropolitan areas, has attracted increasingly more attention; however, the vast rural areas in urban agglomerations are basically ignored.

2.3. Rural Logistics Related Research

With “rural logistics” and “rural logistics evaluation system” as keywords, this study retrieved the following relevant research efforts from PaperDigest (Paper Digest. http://www.paperdigest.org/, accessed on 5 June 2022) and Connected Papers (Connected Papers. https://www.connectedpapers.com/, accessed on 5 June 2022). On the one hand, Lan has proposed a development strategy for China’s rural logistics market [40]. Yan has proposed a location model for rural logistics centers based on the theory of intuitionistic fuzzy TOPSIS [41]. Jiang has uncovered valuable information for decision-makers to develop proactive strategies and reinforcement policies in improving rural last-mile deliveries, thus promoting the sustainable development of rural logistics [42]. On the other hand, Yuan has analyzed the current situation of logistics enterprises and their development opportunities in the environment of the Internet of Things while presenting a development strategy for rural logistics in Hunan by constructing a common logistics system for rural areas in such an environment [43]. Jiang has applied the rough set theory to analyze the evaluation index system of modern rural logistics by specifically setting up a modern rural logistics system in seven aspects: logistics infrastructure, logistics information, logistics support system, constitution of logistics enterprises, logistics planning, logistics outputs, and logistics costs [44]. Taking the rural e-commerce logistics service as the research object, Luo has constructed an evaluation system for the quality of rural e-commerce logistics services using the AHP and fuzzy comprehensive evaluation method, with an evaluation model established [45].
In summary, few studies have been made on rural logistics, and the existing research mainly focuses on site selections and distribution of rural logistics. Over recent years, scholars have begun to pay attention to the evaluation of rural logistics, but few evaluation systems for rural logistics have been proposed from the perspective of urban agglomeration. To address this issue, this study chooses the evaluation system of rural logistics in urban agglomeration as its research focus.

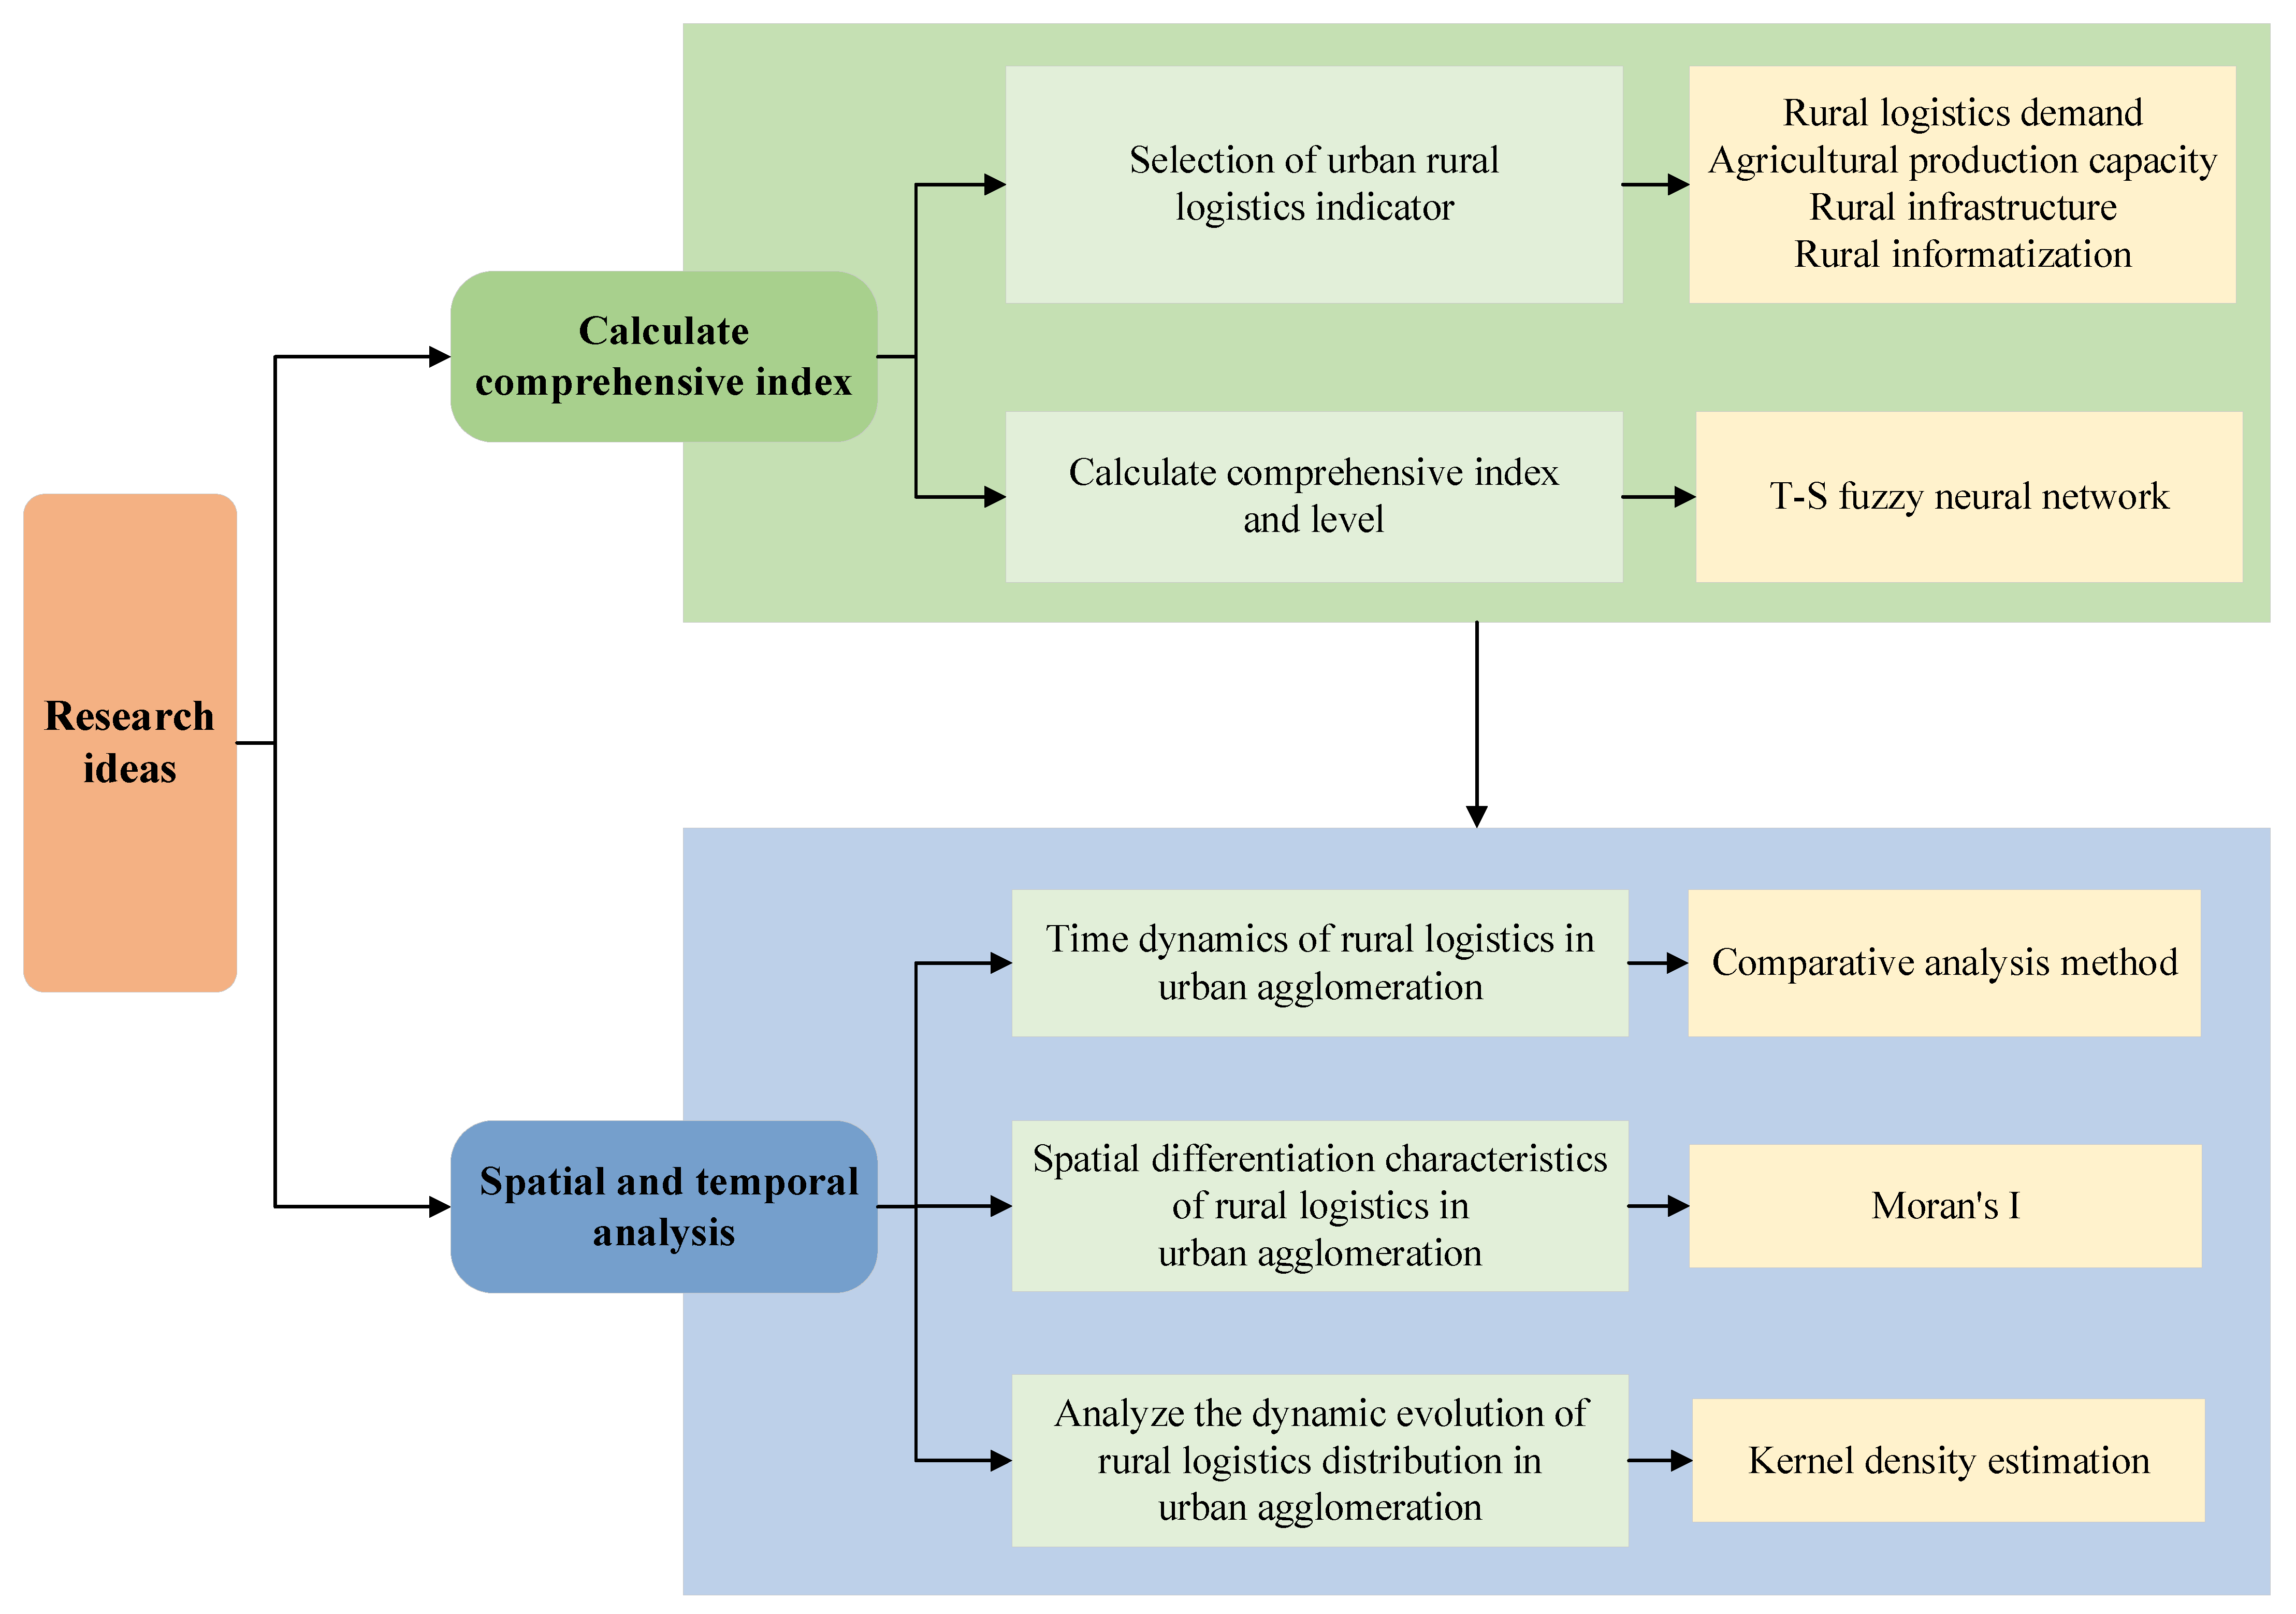
3. The Rural Logistics Index System under the Context of Urban Agglomerations

To measure the development of rural logistics in urban agglomerations, this study constructed an index system in four dimensions. Rural logistics demand can indicate the potential market scale of rural logistics in urban agglomerations. To assess such demand, three indicators are selected: per capita GDP, per capita disposable income of urban residents, and total retail sales of social consumer goods [46,47,48]. Agricultural production capacity can directly measure the overall development level of rural areas, and this study selected two indicators for it: the total sowing area of crops, and the total grain output [49,50]. Rural infrastructure provides the basis for developing rural logistics, and it can be assessed with highway mileage, highway freight turnover, and highway density [51,52,53]. Given the importance of information technology in the development of logistics, this study selected the number of Internet broadband access users to indicate the rural informatization levels [54,55]. The evaluation index system designed by this study for rural logistics development levels in urban agglomerations is shown in Table 2.

4. Methodology

The dynamic assessment model for the assessment of rural logistics development is shown in Figure 1. Firstly, the T-S fuzzy neural network was used to calculate the development index of rural logistics in urban agglomerations. Then, a temporal variation of the rural logistics index was analyzed. Furthermore, Moran’s Index was used to analyze the spatial differentiation characteristics of such rural logistics. Finally, Kernel density estimation was used to explore the dynamic evolution of rural logistics in urban agglomerations. Figure 1 is from graphics software Visio.

4.1. The T-S Fuzzy Neural Network

Machine learning is widely adopted nowadays. For example, using an artificial neural network [56], Moayedi proposed a method to reduce the friction force in transportation pipelines while lowering transportation energy consumption [57]. Nasr presented a novel two-stage fuzzy supplier selection and order allocation model in a CLSC, purposed to minimize waste during the transportation of goods [58]. Hosseini and Vaferi tried to address the problem of gas hydrate formation by using a variety of machine learning algorithms [59]. A fuzzy neural network not only has the ability of neural network optimization and adaptive features, but also has the functions of fuzzy logic to deal with nonlinear and uncertain problems [60,61]. It has been shown that a fuzzy neural network only performs a deep learning algorithm once at the output layer and the rule layer. The blurred layer will directly connect the linear combination of input residuals to the rule layer. Thus, there is no threat of gradient diffusion in a fuzzy neural network [62,63]. In addition, the fuzzy neural network can illustrate the fuzzy relation between input distribution and output distribution through membership degree, making the predicted value smoother and more continuous in the field of time series prediction. Thanks to the advantages of fuzzy neural network methods, they have been widely adopted in the field of time series prediction, including traffic speed prediction [64], wind speed prediction [65], and machine failure prediction [66]. Therefore, to predict the development level of rural logistics in urban agglomeration more accurately, this paper used a fuzzy neural network prediction method in combination with the previous research results.

4.1.1. The Construction of Fuzzy Neural Network

T-S fuzzy system is a fuzzy system with a high adaptive capacity. It cannot only update itself automatically but can also constantly correct the affiliation functions of its fuzzy subsets. T-S fuzzy system is defined in the form of ifthan rules. The principle of fuzzy inference in the case of a rule R i is as follows:
R i :   I f x 1   i s   Q 1 i , x 2   i s   Q 2 i , ... , x k   i s   Q k i ,   t h e n   z i = p 0 i + p 1 i x 1 + ... + p k i x k
where Q j i indicates a fuzzy set, p j i ( j = 1 , 2 , ... , k ) indicates the fuzzy system parameters, and z i indicates the output obtained according to the fuzzy rules. The input part is fuzzy, the output part is deterministic, and the fuzzy inference indicates that the output is a linear combination of the input. T-S fuzzy neural network is a neural network based on a T-S fuzzy system. The network structure is shown in Figure 2.
As seen in Figure 2, the T-S fuzzy neural network is divided into four layers: input layer, blurred layer, fuzzy rule calculation layer, and output layer. The input layer is connected to the input vector x = [ x 1 , x 2 , ... , x k ] , with the same number of nodes as the dimensionality of the input vector. In the blurred layer, the affiliation function of the variable x j is defined as:
μ Q j i = exp ( ( x j c j i ) 2 / b j i )     i = 1 , 2 , ... n ; j = 1 , 2 , ... , k
where c j i and b j i indicate the center and width of the affiliation function of variable x j , respectively; k indicates the number of indicators; and n indicates the number of cities in an urban agglomeration. After fuzzifying x = [ x 1 , x 2 , ... , x k ] , the fuzzy affiliation value can be obtained. Further fuzzy calculation of each affiliation in the fuzzy rule calculation layer.
ω i = u Q j 1 ( x 1 ) u Q j 2 ( x 2 ) ... u Q j k ( x k )     i = 1 , 2 , ... , n
In Equation (2), the fuzzy operator ω i is a concatenated multiplicative operator. Then, the output value z i of the fuzzy neural network is calculated from the fuzzy calculation results.
z i = i = 1 n ω i ( p 0 i + p 1 i x 1 + ... + p k i x k ) / i = 1 n ω i

4.1.2. The Algorithm of T-S Fuzzy Neural Network

To obtain effective training data and better classification results, this study counted the minimum, 20% quantile Q 1 , 40% quantile Q 2 , 60% quantile Q 3 , 80% quantile Q 4 , and the maximum values of the original data. The number of time series data is m. The quantile is calculated as follows.
{ Q 1 = 1 + ( m - 1 ) 0.2 Q 2 = 1 + ( m - 1 ) 0.4 Q 3 = 1 + ( m - 1 ) 0.6 Q 4 = 1 + ( m - 1 ) 0.8
Based on Equation (4), an interval ranking was performed to obtain the classification level of the output layer. Specifically, if the input layer data fall in the interval [ Q min , Q 1 ) , the output variable will be defined as Level I; if in the interval [ Q 1 , Q 2 ) , the output variable as Level II; if in the interval [ Q 2 , Q 3 ) , the output variable as Level III; if in the interval [ Q 3 , Q 4 ) , the output variable as Level IV; and if in the interval [ Q 4 , Q max ) , the output variable as Level V. In addition, the computational error of the fuzzy neural network is defined as:
e = 1 2 ( z d z e ) 2
where z d indicates the desired output of the network, z e indicates the actual output of the network, and e indicates the error between the desired output and the actual output. Furthermore, the network learning rate is valued as α . According to the fuzzy system parameters p j i and the input parameter affiliation ω i , the coefficient correction can be defined as:
p j i ( k ) = p j i ( k 1 ) α e p j i
e p j i = ( z d z e ) ω i / i = 1 m ω i x j
Then, based on the center c j i and width b j i of the affiliation function, the parameter correction can be defined as:
c j i ( k ) = c j i ( k 1 ) β e c j i
b j i ( k ) = b j i ( k 1 ) β e b j i
The algorithm flow for rural logistics in urban agglomerations based on a T-S fuzzy neural network is illustrated in Figure 3 by Visio.
As shown in Figure 3, the fuzzy neural network determines the number of network input and output nodes based on the input and output dimensions of the training patterns. Since the input data have a dimension of 11 and the output data have a dimension of 1, this study set the number of input and output nodes of the network to 11 and 1, respectively. Also, according to the number of network input and output nodes, the number of membership functions is artificially fixed at 22. According to the convention, it is best to set the number as double that of the targets during training [67], so the network structure was constructed as 11-22-1. Besides, the center c , width b , and coefficients P 0 and P 6 of the fuzzy affiliation function were initialized randomly.
The fuzzy neural network was trained with training data. The maximum, 80% quantile, 60% quantile, 40% quantile, 20% quantile, and the minimum of the original data were divided into intervals. Training samples are generated in the linear interpolation method, and the network was trained repetitively 100 times. The trained fuzzy neural network was then used to evaluate the level and comprehensive index of rural logistics in urban agglomerations.

4.2. Moran’s I

Spatial autocorrelation can be used to reveal the spatial clustering and distribution characteristics of certain regions [68]. In this study, Moran’s Index was utilized to analyze the spatial correlation of rural logistics in Chengdu-Chongqing urban agglomeration through the following calculations:
I i = ( C R i C R ¯ ) S 2 i 1 = 1 n A i , i 1 ( C R i 1 C R ¯ )
S 2 = 1 n i = 1 n ( C R i C R ¯ ) 2
where S 2 indicates the variance of the observed sample; n indicates the total number of cities in the urban agglomeration; C R i and C R i 1 indicate the rural logistics comprehensive index of two random cities i and i 1 , respectively; C R ¯ is the average of the rural logistics comprehensive index; A i , i 1 indicates a spatial adjacency matrix: when city i is adjacent to city i 1 , A i , i 1 = 1 ; otherwise A i , i 1 = 0 .

4.3. Kernel Density

Kernel density estimation demonstrates the distribution location, shape, and polarization of random variables. In this study, Kernel density estimation was used to describe the dynamic distribution evolution of rural logistics in the urban agglomeration, with the wave height and width reflecting the magnitude of differences in rural logistics development level and the number of waves reflecting the polarization. The formula of the empirical distribution is [69]:
F ( y ) = 1 n h i = 1 n K ( Y i Y ¯ h )
where n indicates the number of observations (the total number of cities), h indicates the broadband, and K indicates the Kernel density function, subject to the following conditions:
{ lim y K ( y ) y = 0 K ( y ) 0 , + K ( y ) d y = 1 sup K ( y ) < + , + K 2 ( y ) d y < +
In this study, the Gaussian Kernel function was adopted to estimate the dynamic evolution process of the distribution of rural logistics development levels in the urban agglomeration. The function is as follows:
K ( y ) = 1 2 π exp ( y 2 2 )
The research topic of this study is the spatial differentiation characteristics of rural logistics in the Chengdu-Chongqing urban agglomeration. Figure 4 provides a step-by-step summary of the above methods while introducing the software required to make the study more organized.

5. Results

5.1. The Study Area and Data Sources

This study selected the panel data from 16 prefecture-level areas in the Chengdu-Chongqing agglomeration from 2010 to 2020 as the research sample, including Chongqing, Chengdu, Zigong, Luzhou, Deyang, Mianyang, Suining, Neijiang, Leshan, Nanchong, Meishan, Yibin, Guang’an, Dazhou, Ya’an, and Ziyang. The original data were retrieved from the China Statistical Yearbook, China Rural Statistical Yearbook, and statistical yearbooks of various cities from 2011 to 2021. Figure 5 by ArcGIS 10.2. shows the location of the study area.

5.2. Evaluation Criteria of Rural Logistics in Urban Agglomeration

The maximum, 80% quantile, 60% quantile, 40% quantile, 20% quantile, and the minimum value of the original sample data were calculated to divide the intervals of rural logistics development. The rural logistics in the Chengdu-Chongqing agglomeration could be divided into five levels, as shown in Table 3, ranking from low to high.

5.3. The Comprehensive Index of Rural Logistics in Chengdu-Chongqing Agglomeration

The linear interpolation method was used in Table 3 to generate 400 groups of sample data. Among them, 350 groups were selected as the training samples, while the remaining 50 ones as the predicting samples. The proportion of the test data is 12.5%, which conforms to the convention standard—At least 10% of data should be used as test data for neural network training. In the training process of the fuzzy neural network, the learning rate was set at 0.001, the inertia coefficient at 0.05, and the evolutionary number at 100. Matlab2019b was used to train the fuzzy neural network. The prediction results from the training and test data are shown in Figure 6.
The fuzzy neural network was trained with MATLAB2019b software, and the rural logistics comprehensive index of the Chengdu-Chongqing agglomeration from 2010 to 2020 is demonstrated in Table 4.
According to the comprehensive index of rural logistics in the Chengdu-Chongqing agglomeration as shown in Table 4, the rural logistics development index of the 16 cities in the agglomeration increased rapidly from 2010 to 2020. The average of the comprehensive index went up from 0.76 in 2010 to 2.39 in 2015. In 2020, it rose to 4.6. Although the rural logistics development index of the 16 constituent cities had increased over time, the rural logistics in the Chengdu-Chongqing agglomeration developed in a very unbalanced manner. The levels of rural logistics in Chongqing and Chengdu have always been much higher than in other cities. Before 2013, Chongqing ranked first. After 2013, Chengdu had ranked first for seven years, except in 2019. Moreover, differences among the other 14 cities were relatively small. In addition, Deyang, Mianyang, Leshan, and Yibin, all of which are close to Chengdu, have developed well over the past five years. To further illustrate the changing trend of the rural logistics comprehensive index of the urban agglomeration, Origin2019b software was used to draw a dynamic change diagram of the index, as shown in Figure 7.

5.4. Spatial Distribution of Rural Logistics in Chengdu-Chongqing Agglomeration

The map of rural logistics in the Chengdu-Chongqing agglomeration further displays the level of the agglomeration from 2010 to 2020. In ArcGIS 10.2, the following figures are drawn. The base map showcases the Chengdu-Chongqing urban agglomeration, covering Chongqing as well as 15 cities of Sichuan province, acquired from the “National Basic Geographic Information System” of 14 million data entries. As shown in Figure 8, this study set up five levels to evaluate the development of rural logistics in the Chengdu-Chongqing urban agglomeration by using five colors: The darker the color, the higher the level. During the observation period, the city levels of the Chengdu-Chongqing agglomeration increased yearly. In 2010, the highest level of rural logistics was only shown in Chongqing at Level III, followed by Chengdu at Level II, and the other 14 cities were all at Level I (Figure 8a). In 2015, both Chongqing and Chengdu were upgraded to Level V, and the second on the list was Deyang at Level IV, a city near Chengdu, with no cities at Level I (Figure 8b). By 2020, except for Nanchong, Guang’an, Dazhou, and Ziyang, which were still at Level IV, the remaining 12 cities had all reached Level V, indicating that cities around Chengdu were developing rapidly. Except for Ziyang, the surrounding cities of Chengdu all reached Level V in 2020. This showcases an obvious spillover effect of Chengdu in recent years. However, Ziyang, which was supposed to be a bridge between Chongqing and Chengdu, was still at Level IV, further demonstrating the significant siphon effect between Chongqing and Chengdu (Figure 8c). In general, the rural logistics of cities in the Chengdu-Chongqing agglomeration showed a positive development trend, with the gaps between the cities narrowing yearly.
Through analysis and prediction using the fuzzy neural network, it can be concluded that during the observation period from 2010 to 2020, the overall rural logistics in the agglomeration had developed rapidly in terms of both the comprehensive index and the level. Chengdu and Chongqing, as the dual-core cities in the urban agglomeration, drive the overall development of rural logistics in their surrounding cities. Rural logistics is an important approach to improving the lives of urban and rural residents in the agglomeration. Therefore, promoting the prosperity of the rural economy and driving the sustainable and stable development of logistics in the Chengdu-Chongqing urban agglomeration is significant.

6. Discussion

To pinpoint the development characteristics of rural logistics, this study further uses Moran’s Index and Kernel density estimation to analyze the spatial differentiation effect and evolution process of rural logistics in the Chengdu-Chongqing agglomeration.

6.1. Differentiation Characteristics of Rural Logistics in Urban Agglomeration

The Moran’s I scatter diagram of rural logistics in the urban agglomeration in 2010 and 2020 is drawn using GeoDa software, as shown in Figure 8. As shown in this diagram, there is a positive correlation between the levels of rural logistics in the agglomeration. Chengdu and Chongqing form the main double-cores for the development of the urban agglomeration, but other cities failed to provide strong support, and the roles of the urban agglomeration had not been fully played.
By comparing Figure 9a,b, it can be observed that in this agglomeration, Chongqing, Chengdu, Deyang, and Mianyang were always in the “high-high” diffusion effect zone from 2010 to 2020, indicating that these four cities had a higher level of rural logistics than their neighboring cities, with a significant diffusion effect demonstrated to drive the development of the surrounding cities. In other words, a positive correlation was shown. Zigong and Yibin were in the “high-low” siphon effect zone. The rural logistics levels of these two cities were higher than their surrounding cities, with their siphon effect stronger than the radiation effect. Nine cities in the urban agglomeration, namely Luzhou, Suining, Neijiang, Nanchong, Meishan, Guang’an, Dazhou, Ya’an, and Ziyang, were in the “low-low” zone all year round, with relatively low rural logistics level. For Leshan, an important tourist city in the agglomeration, a noteworthy phenomenon is that it was in the “high-high” diffusion effect zone in 2010 but in the “high-low” siphon effect zone in 2020, indicating that with the development of tourism, Leshan’s rural logistics level has been improved compared to its neighboring cities. As a result, the siphoning effect was stronger than the radiation effect, showing a negative correlation.

6.2. Dynamic Evolution of Rural Logistics Distribution in Urban Agglomeration

According to Formulas (12)–(14), the Gaussian Kernel density function is adopted to analyze the dynamic evolution of rural logistics in the urban agglomeration, the analysis software is Matlab2019b, and the results are shown in Figure 10. As seen in Figure 10, in terms of distribution position, the main peak position of the agglomeration moves to the right, indicating an upward trend in the development level of rural logistics in the agglomeration. In terms of distribution form, the height of the main peak in the agglomeration experienced a “decline-rise-decline” process, and the width of the main peak became narrower, indicating a narrowing trend in the dispersion degree of the development level of rural logistics in the agglomeration, while the regional differences were narrowed on the whole. The main peaks represent the situation of the core cities, i.e., Chongqing and Chengdu, while the side peaks represent that of the emerging development cities, such as Deyang and Mianyang. In terms of polarization, the number of peaks in the Chengdu-Chongqing agglomeration gradually increased from a single peak over time, indicating a multi-polarization phenomenon in the urban agglomeration; and the distances between the main peaks and the side peaks gradually decreased, indicating a narrowed regional difference.
In summary, Chongqing, Chengdu, Deyang, and Mianyang, as rapidly developing high-level areas in the urban agglomeration, should give full play to their advantages while promoting the development of their surrounding cities. Leshan should launch more attractive tourism projects to secure its throne as a tourism city, thus driving the growth of the logistics industry. Relevant research has shown that the idea of polycentric city development has been revitalized in many rapidly urbanizing countries [70]. In addition, as pointed out by Marques, the main planning agenda in Europe is to direct the future of territorial organizations to an urban polycentric perspective to improve cohesion within regions [71]. After comparing single-center and multi-center systems in logistics activities, Heitz concluded that urban structures and spatial planning policies are critical to regional logistics development [72]. Moreover, in the Chengdu-Chongqing urban agglomeration, the gaps between development levels of rural logistics are narrowing each year, gradually moving towards regional integration and sustainable development.

6.3. Comparison between the Fuzzy Neural Network and the Traditional BP Neural Network

In this study, a neural network was used to evaluate the rural logistics comprehensive index of the Chengdu-Chongqing agglomeration from 2010 to 2020. As a data-driven methodology, machine learning can relieve subjective biases in the process of weighting while effectively diminishing classification errors. In addition, thanks to a combination of the structural knowledge expression ability of fuzzy logic reasoning with the self-learning ability of neural networks, fuzzy neural networks showcase more advantages than traditional BP neural networks. Matlab2019b software is used in this study to compare a traditional BP neural network and a fuzzy neural network, with a comparative analysis of the error curves shown in Figure 11. The average simulation error of the traditional BP neural network is 0.4460, but the prediction error of the fuzzy neural network is only 0.0746 (Table A1). Therefore, the latter can effectively enhance the accuracy of rural logistics classification and prediction.

7. Conclusions

Rural logistics is a key issue in the further development of Chinese urban agglomerations. By constructing a new dynamic assessment model for rural logistics development based on a fuzzy neural network, Moran’s Index, and Kernel density estimation, and taking the Chengdu-Chongqing agglomeration as a research case, this study delivers the following results: Firstly, this agglomeration exhibited a dual-core dominance structure, while producing a considerable siphon effect, as demonstrated by the empirical test findings. However, over recent years, rural logistics development in the urban agglomeration has been substantially enhanced, and the regional disparities have gradually shrunk, with a growing trend toward regional synergy. Secondly, the comprehensive index and level of rural logistics development in the urban agglomeration are increasing yearly, with the index average hiking from 0.76 in 2010 to 4.60 in 2020. Most cities advanced from Level I in 2010 to Level V in 2020. Thirdly, the cities of Deyang, Mianyang, Leshan, and Yibin experienced rapid development, while Chengdu showcased conspicuous spillover effects on its neighboring cities. Nonetheless, the development of rural logistics in Guang’an and Dazhou, both surrounding Chongqing, must be further improved.
Rural logistics, like logistics in urban regions, is a crucial component of urban agglomeration logistics. In addition, rural revitalization is an important strategy for promoting sustainable development. This study’s findings offer the following administrative insights: First, local governments in the agglomeration should optimize their regional industrial structures, strengthen industrial cluster cooperation, and integrate the industrial chains of Chengdu and Chongqing. Due to the siphoning effect and spillover impact, Chengdu and Chongqing should drive the development of rural logistics in their neighboring cities, such as Guang’an and Dazhou. Second, the integration of transportation between urban and rural regions must be boosted. To realize the integrated development of rural roads, industrial parks, tourist attractions, and key rural tourism sites, the construction of rural transportation infrastructure must be bolstered. Third, the cities should enhance the competitive advantages of their agricultural products; facilitate the integration of rural e-commerce systems; express logistics and distribution systems in counties, and construct convenient and effective two-way channels for industrial products to reach the countryside and for agricultural produce to be exported from the rural areas. In addition, the Chengdu-Chongqing urban agglomeration must weaken the concept of administrative regions but strengthen the concept of economic regions, consciously break administrative and institutional barriers, and promote the sustainable development of smooth and integrated logistics in the agglomeration.
Nonetheless, this study still has some limitations. Firstly, given that evaluation indicators for urban agglomeration logistics are diversified, the evaluation indicators selected in this study may not be the most accurate and perfect ones. In the follow-up research, a more necessary and reasonable index system should be designed from a more comprehensive perspective. Secondly, the Chengdu-Chongqing urban agglomeration was selected as the research object of this study, purposed to provide suggestions for the sustainable development of rural logistics in the agglomeration. Exploration of rural logistics development of urban agglomerations in different regions will be a focus of the follow-up work of this research team.

Author Contributions

Conceptualization, J.B.; methodology, H.L.; software, H.L. and J.B.; validation, H.L.; formal analysis, H.L. and J.B.; investigation, H.L.; data curation, H.L. and J.B.; writing—original draft preparation, J.B.; writing—review and editing, H.L.; visualization, H.L. and J.B.; supervision, H.L.; project administration, H.L.; funding acquisition, H.L. All authors have read and agreed to the published version of the manuscript.

Funding

This research was funded by [the National Natural Science Foundation of China] grant number [71901043], [the Chongqing Municipal Education Commission Project] grant number [KJQN201900739], [Chongqing Social Science Planning Project] grant number [2017PY40], and [the Science and Technology Bureau Foundation and Frontier Project of Chongqing] grant number [cstc2019jcyj-msxmX0629].

Data Availability Statement

In this paper, per capita GDP, per capita disposable income of urban residents, total retail sales of social consumer goods, total sowing area of crops, GDP of agriculture, forestry, animal husbandry and fishery, total power of agricultural machinery, total grain output and Internet broadband access users came from China Statistical Yearbook (http://www.stats.gov.cn/tjsj/ndsj/, accessed on 1 June 2022), China Rural Statistical Yearbook (http://libvpn.cqjtu.edu.cn/, accessed on 1 June 2022) and various urban statistical yearbooks from 2011 to 2021. Such as (http://tjj.cq.gov.cn/, accessed on 4 June 2022). Highway mileage, highway freight turnover, and highway density came from the Sichuan provincial department of transportation (http://jtt.sc.gov.cn/, accessed on 5 June 2022) and The Transport Department of Chongqing (http://jtj.cq.gov.cn/, accessed on 6 June 2022).

Conflicts of Interest

The authors declare no conflict of interest.

Appendix A

Table A1. Prediction error table of BP neural network and fuzzy neural network.
Fuzzy Neural NetworkBP Neural Network
0.1071−0.5548
0.0496−0.4788
−0.037−0.0296
−0.092−0.5013
−0.0534−0.5449
−0.0088−0.4233
0.0722−0.5412
0.0102−0.5409
−0.1002−0.4441
−0.0581−0.5626
0.0681−0.2662
−0.0818−0.4952
−0.0854−0.7700
0.0997−0.4294
−0.0737−0.5409
−0.0072−0.5441
0.1171−0.5681
−0.0458−0.1517
0.0872−0.4917
−0.11660.0002
0.1282−0.4068
−0.1385−0.5474
−0.09020.1285
−0.0392−0.4415
0.14230.1501
−0.0283−0.5636
−0.0952−0.4182
0.076−0.8079
−0.112−0.6168
−0.076−0.7269
0.0947−0.3827
0.1146−0.8120
0.0311−0.4626
0.0597−0.5409
0.0414−0.7154
0.0366−0.5428
−0.0441−0.1885
−0.0264−0.5097
0.0972−0.5462
0.0634−0.4844
−0.0664−0.0779
0.1096−0.4576
−0.0865−0.6770
0.1183−0.5409
−0.03490.1628
−0.0516−0.4653
0.07970.0226
−0.0749−0.5415
−0.0629−0.3301
−0.14010.1511

References

  1. Li, L.; Ma, S.G.; Zheng, Y.L.; Xiao, X.Y. Integrated regional development: Comparison of urban agglomeration policies in China. Land Use Policy 2022, 114, 105939. [Google Scholar] [CrossRef]
  2. Oxford University Press. Our Common Future. In WCED-World Commission on Environment and Development; Oxford University Press: Oxford, UK, 1987. [Google Scholar]
  3. Shen, Z.C.; Xu, X.L.; Xu, S.W.; Sun, D.W. A comparative study of land development patterns and regional thermal environments (RTEs) in typical urban agglomerations of China and America: A case study of Beijing-Tianjin-Hebei (BTH) and Boswash. Sci. Total Environ. 2022, 803, 149735. [Google Scholar] [CrossRef]
  4. Muñoz-Villamizar, A.; Solano-Charris, E.L.; AzadDisfany, M.; Reyes-Rubiano, L. Study of urban-traffic congestion based on Google Maps API: The case of Boston. IFAC-PapersOnLine 2021, 54, 211–216. [Google Scholar] [CrossRef]
  5. Peters, A.; Hernández, D.; Kioumourtzoglou, M.-A.; Johnson, M.A.; Chillrud, S.N.; Hilpert, M. Assessing neighborhood-scale traffic from crowd-sensed traffic data: Findings from an environmental justice community in New York City. Environ. Sci. Policy 2022, 133, 155–163. [Google Scholar] [CrossRef]
  6. Dubie, M.; Kuo, K.C.; Giron-Valderrama, G.; Goodchild, A. An evaluation of logistics sprawl in Chicago and Phoenix. J. Transp. Geogr. 2020, 88, 102298. [Google Scholar] [CrossRef]
  7. Rice, M.; Sorenson, M.; Aversa, J. The geography of lifestyle center growth: The emergence of a retail cluster format in the United States. J. Retail. Consum. Serv. 2022, 65, 102835. [Google Scholar] [CrossRef]
  8. Sakai, T.; Kawamura, K.; Hyodo, T. Spatial reorganization of urban logistics system and its impacts: Case of Tokyo. J. Transp. Geogr. 2017, 60, 110–118. [Google Scholar] [CrossRef]
  9. Bartle, C.; Chatterjee, K. Employer perceptions of the business benefits of sustainable transport: A case study of peri-urban employment areas in South West England. Transp. Res. Part A Policy Pract. 2019, 126, 297–313. [Google Scholar] [CrossRef]
  10. Raimbault, N. From regional planning to port regionalization and urban logistics. The inland port and the governance of logistics development in the Paris region. J. Transp. Geogr. 2019, 78, 205–213. [Google Scholar] [CrossRef]
  11. Song, Y.; Yeung, G.; Zhu, D.L.; Zhang, L.X.; Xu, Y.; Zhang, L.Y. Efficiency of logistics land use: The case of Yangtze River Economic Belt in China, 2000–2017. J. Transp. Geogr. 2020, 88, 102851. [Google Scholar] [CrossRef]
  12. Yang, X.C.; Wang, M.J. Diversification and Spatial Differentiation of Villages’ Functional Types in the New Period of China: Results from Hierarchical Urban-Rural Spatial Relations and Townships Size. Land 2022, 11, 171. [Google Scholar] [CrossRef]
  13. Hauge, J.B.; Birkie, S.E.; Jeong, Y. Developing a holistic decision support framework: From production logistics to sustainable freight transport in an urban environment. Transp. Res. Interdiscip. Perspect. 2021, 12, 100496. [Google Scholar] [CrossRef]
  14. Büyüközkan, G.; Ilıcak, Ö. Smart urban logistics: Literature review and future directions. Socio-Econ. Plan. Sci. 2021, 81, 101197. [Google Scholar] [CrossRef]
  15. Liu, R. Incomplete Urbanization and the Trans-Local Rural-Urban Gradient in China: From a Perspective of New Economics of Labor Migration. Land 2022, 11, 282. [Google Scholar] [CrossRef]
  16. Lan, S.L.; Tseng, M.-L.; Yang, C.; Huisingh, D. Trends in sustainable logistics in major cities in China. Sci. Total Environ. 2020, 712, 136381. [Google Scholar] [CrossRef]
  17. Aydın, G.T. Kent içi lojistik: İstanbul için bir uygulama; Istanbul Technical University: Maslak, Turkey, 2017. [Google Scholar]
  18. Lagorio, A.; Pinto, R.; Golini, R. Urban Logistics Ecosystem: A system of system framework for stakeholders in urban freight transport projects. IFAC-PapersOnLine 2017, 50, 7284–7289. [Google Scholar] [CrossRef]
  19. Strulak-Wójcikiewicz, R.; Wagner, N. Exploring opportunities of using the sharing economy in sustainable urban freight transport. Sustain. Cities Soc. 2021, 68, 102778. [Google Scholar] [CrossRef]
  20. Gong, X.W. Coupling coordinated development model of urban-rural logistics and empirical study. Math. Probl. Eng. 2019, 2019, 1–12. [Google Scholar] [CrossRef] [Green Version]
  21. Filippi, A.C.G.; Guarnieri, P.; Carvalho, J.M.; Reis, S.A.; da Cunha, C.A. New configurations in Brazilian agribusiness: Rural warehouse condominiums. J. Agribus. Dev. Emerg. Econ. 2020, 10, 41–63. [Google Scholar] [CrossRef]
  22. Liu, W. Route optimization for last-mile distribution of rural E-commerce logistics based on ant colony optimization. IEEE Access 2020, 8, 12179–12187. [Google Scholar] [CrossRef]
  23. Morel, M.; Balm, S.; Berden, M.; van Amstel, W.P. Governance models for sustainable urban construction logistics: Barriers for collaboration. Transp. Res. Procedia 2020, 46, 173–180. [Google Scholar] [CrossRef]
  24. Taniguchi, E.; Noritake, M.; Yamada, T.; Izumitani, C. Optimal size and location planning of public logistics terminals. Transp. Res. Part E Logist. Transp. Rev. 1999, 35, 207–222. [Google Scholar] [CrossRef]
  25. Iwan, S.; Kijewska, K. The integrated approach to adaptation of good practices in urban logistics based on the Szczecin example. Procedia-Soc. Behav. Sci. 2014, 125, 212–225. [Google Scholar] [CrossRef] [Green Version]
  26. Schliwa, G.; Armitage, R.; Aziz, S.; Evans, J.; Rhoades, J. Sustainable city logistics—Making cargo cycles viable for urban freight transport. Res. Transp. Bus. Manag. 2015, 15, 50–57. [Google Scholar] [CrossRef] [Green Version]
  27. Rześny-Cieplińska, J.; Szmelter-Jarosz, A.; Moslem, S. Priority-based stakeholders analysis in the view of sustainable city logistics: Evidence for Tricity, Poland. Sustain. Cities Soc. 2021, 67, 102751. [Google Scholar] [CrossRef]
  28. Russo, S.M.; Voegl, J.; Hirsch, P. A multi-method approach to design urban logistics hubs for cooperative use. Sustain. Cities Soc. 2021, 69, 102847. [Google Scholar] [CrossRef]
  29. Kang, X.Y.; Pang, H.Y. City selection for fresh produce e-commerce’s market entry strategy: Based on the perspective of urban logistics competitiveness. Transp. Res. Interdiscip. Perspect. 2022, 13, 100537. [Google Scholar] [CrossRef]
  30. Morfoulaki, M.; Kotoula, K.; Stathacopoulos, A.; Mikiki, F.; Aifadopoulou, G. Evaluation of specific policy measures to promote sustainable urban logistics in small-medium sized cities: The case of Serres, Greece. Transp. Res. Procedia 2016, 12, 667–678. [Google Scholar] [CrossRef] [Green Version]
  31. Viana, M.S.; Delgado, J.P.M. City logistics in historic centers: Multi-criteria evaluation in GIS for city of Salvador (Bahia–Brazil). Case Stud. Transp. Policy 2019, 7, 772–780. [Google Scholar] [CrossRef]
  32. Juvvala, R.; Sarmah, S.P. Evaluation of policy options supporting electric vehicles in city logistics: A case study. Sustain. Cities Soc. 2021, 74, 103209. [Google Scholar] [CrossRef]
  33. Zhao, L.J.; Zhou, J.P.; Li, H.Y.; Yang, P.L.; Zhou, L.X. Optimizing the design of an intra-city metro logistics system based on a hub-and-spoke network model. Tunn. Undergr. Space Technol. 2021, 116, 104086. [Google Scholar] [CrossRef]
  34. de Oliveira, L.K.; Lessa, D.A.; Oliveira, E.; Calazans, B.F.G. Multi-agent modelling approach for evaluating the city logistics dynamic in a vulnerability situation: An exploratory study in Belo Horizonte (Brazil). Transp. Res. Procedia 2017, 25, 1046–1060. [Google Scholar] [CrossRef]
  35. Liu, W.H.; Wei, W.Y.; Yan, X.Y.; Dong, D.; Chen, Z.X. Sustainability risk management in a smart logistics ecological chain: An evaluation framework based on social network analysis. J. Clean. Prod. 2020, 276, 124189. [Google Scholar] [CrossRef]
  36. Qazi, A. Adoption of a probabilistic network model investigating country risk drivers that influence logistics performance indicators. Environ. Impact Assess. Rev. 2022, 94, 106760. [Google Scholar] [CrossRef]
  37. Zheng, W.J.; Xu, X.H.; Wang, H.W. Regional logistics efficiency and performance in China along the Belt and Road Initiative: The analysis of integrated DEA and hierarchical regression with carbon constraint. J. Clean. Prod. 2020, 276, 123649. [Google Scholar] [CrossRef]
  38. Liang, Z.J.; Chiu, Y.-H.; Guo, Q.; Liang, Z. Low-carbon logistics efficiency: Analysis on the statistical data of the logistics industry of 13 cities in Jiangsu Province, China. Res. Transp. Bus. Manag. 2021, 43, 100740. [Google Scholar] [CrossRef]
  39. Zhuang, Z.L.; Fu, S.Q.; Lan, S.L.; Yu, H.; Yang, C.; Huang, G.Q. Research on economic benefits of multi-city logistics development based on data-driven analysis. Adv. Eng. Inform. 2021, 49, 101322. [Google Scholar] [CrossRef]
  40. Lan, X.J. On development strategy of rural logistics market. In Proceedings of the 2014 2nd International Conference on Education Technology and Information System (ICETIS 2014), Jinan, China, 26–27 April 2014; pp. 155–158. [Google Scholar]
  41. Yan, Z.; Zhang, Y.-Y.; Li, Y.F.; Liu, S.; Yang, J.A. A Study of Rural Logistics Center Location Based on Intuitionistic Fuzzy TOPSIS. Math. Probl. Eng. 2017, 2017, 2323057. [Google Scholar] [CrossRef] [Green Version]
  42. Jiang, X.H.; Wang, H.Y.; Guo, X.C.; Gong, X.L. Using the FAHP, ISM, and MICMAC approaches to study the sustainability influencing factors of the last-mile delivery of rural E-commerce logistics. Sustainability 2019, 11, 3937. [Google Scholar] [CrossRef] [Green Version]
  43. Yuan, S.; Chen, J. Research on Rural Logistics Development Strategy and Construction of Common Logistics System in Hunan. In Proceedings of the 5th International Conference on Economics, Management, Law and Education (EMLE 2019), Krasnodar, Russia, 11–12 October 2020; pp. 767–769. [Google Scholar]
  44. Jiang, H.; Yang, J. Applying rough set theory to analyzing the evaluation index system of modern rural logistics construction. In Proceedings of the 2009 International Conference on Test and Measurement, Hong Kong, China, 5–6 December 2009; Volume 2, pp. 418–421. [Google Scholar] [CrossRef]
  45. Luo, Y.; Bai, Y. Evaluation Model Construction and Empirical Analysis of Rural E-Commerce Logistics Service Quality. In Proceedings of the International Conference on Applications and Techniques in Cyber Security and Intelligence, Fuyang, China, 19–21 June 2020; pp. 28–34. [Google Scholar] [CrossRef]
  46. Lin, P.-C.; Cheng, T.C.E. The diffusion and the international context of logistics performance. Int. J. Logist. Res. Appl. 2019, 22, 188–203. [Google Scholar] [CrossRef]
  47. Lu, H.; Lu, X.; Jiao, L.D.; Zhang, Y. Evaluating urban agglomeration resilience to disaster in the Yangtze Delta city group in China. Sustain. Cities Soc. 2022, 76, 103464. [Google Scholar] [CrossRef]
  48. Yang, Z.D. Comparison and empirical analysis of the urban economic development level in the Yangtze River urban agglomeration based on an analogical ecosystem perspective. Ecol. Inform. 2021, 64, 101321. [Google Scholar] [CrossRef]
  49. Ekici, Ş.Ö.; Kabak, Ö.; Ülengin, F. Improving logistics performance by reforming the pillars of Global Competitiveness Index. Transp. Policy 2019, 81, 197–207. [Google Scholar] [CrossRef]
  50. Wang, X. The research on the evaluation index system of livable rural areas in China—by the case of rural areas in Henan Province. Agric. Agric. Sci. Procedia 2010, 1, 456–461. [Google Scholar] [CrossRef] [Green Version]
  51. Qi, G.Q.; Shi, W.M.; Lin, K.-C.; Yuen, K.F.; Xiao, Y. Spatial spillover effects of logistics infrastructure on regional development: Evidence from China. Transp. Res. Part A Policy Pract. 2020, 135, 96–114. [Google Scholar] [CrossRef]
  52. Zhang, W.D.; Lu, J.; Zhang, Y. Comprehensive evaluation index system of low carbon road transport based on fuzzy evaluation method. Procedia Eng. 2016, 137, 659–668. [Google Scholar] [CrossRef] [Green Version]
  53. Xie, B.K.; Zhang, X.X.; Lu, J.L.; Liu, F.; Fan, Y.Q. Research on ecological evaluation of Shanghai port logistics based on emergy ecological footprint models. Ecol. Indic. 2022, 139, 108916. [Google Scholar] [CrossRef]
  54. Wang, T.; Kang, J.W.; Valentine, V.F. A holistic analysis of national e-commerce and logistics development. Marit. Econ. Logist. 2020, 22, 500–513. [Google Scholar] [CrossRef]
  55. Helo, P.; Rouzafzoon, J. Logistics Informatization Systems. Int. Encycl. Transp. Sci. 2021, 105, 76–84. [Google Scholar] [CrossRef]
  56. Lu, H.; Shang, T.; Wei, Y.; Wu, P. Safety assessment of exit advance guide signs in mountainous highway tunnel based on eye-tracking Technology. IEEE Access 2021, 9, 111315. [Google Scholar] [CrossRef]
  57. Moayedi, H.; Aghel, B.; Vaferi, B.; Foong, L.K.; Bui, D.T. The feasibility of Levenberg–Marquardt algorithm combined with imperialist competitive computational method predicting drag reduction in crude oil pipelines. J. Pet. Sci. Eng. 2020, 185, 106634. [Google Scholar] [CrossRef]
  58. Nasr, A.K.; Tavana, M.; Alavi, B.; Mina, H. A novel fuzzy multi-objective circular supplier selection and order allocation model for sustainable closed-loop supply chains. J. Clean. Prod. 2021, 287, 124994. [Google Scholar] [CrossRef]
  59. Hosseini, S.; Vaferi, B. Determination of methanol loss due to vaporization in gas hydrate inhibition process using intelligent connectionist paradigms. Arab. J. Sci. Eng. 2022, 47, 5811–5819. [Google Scholar] [CrossRef]
  60. Mamdani, E.H.; and Assilian, S. An experiment in linguistic synthesis with a fuzzy logic controller. Int. J. Man-Mach. Stud. 1975, 7, 1–13. [Google Scholar] [CrossRef]
  61. Larsen, P.M. Industrial applications of fuzzy logic control. Int. J. Man-Mach. Stud. 1980, 12, 3–10. [Google Scholar] [CrossRef]
  62. Liu, Y.J.; Gao, Y.; Tong, S.; and Li, Y. Fuzzy approximation-based adaptive backstepping optimal control for a class of nonlinear discrete-time systems with dead-zone. IEEE Trans. Fuzzy Syst. 2015, 24, 16–28. [Google Scholar] [CrossRef]
  63. Chen, Y.C.; Teng, C.-C. A model reference control structure using a fuzzy neural network. Fuzzy Sets Syst. 1995, 73, 291–312. [Google Scholar] [CrossRef]
  64. Tang, J.-J.; Liu, F.; Zou, Y.J. An improved fuzzy neural network for traffic speed prediction considering periodic characteristic. IEEE Trans. Intell. Transp. Syst. 2017, 18, 2340–2350. [Google Scholar] [CrossRef]
  65. Barbounis, T.; Theocharis, J.B. A locally recurrent fuzzy neural network with application to the wind speed prediction using spatial correlation. Neurocomputing 2007, 70, 1525–1542. [Google Scholar] [CrossRef]
  66. Pan, Y.; Er, M.J.; Li, X.; Yu, H.; Gouriveau, R. Machine health condition prediction via online dynamic fuzzy neural networks. Eng. Appl. Artif. Intell. 2014, 35, 105–113. [Google Scholar] [CrossRef]
  67. Wang, X.C. Matlab Neural Network Analysis of 43 Cases; Beijing University of Aeronautics and Astronautics Press: Beijing, China, 2013; pp. 288–298. [Google Scholar]
  68. Tepanosyan, G.; Sahakyan, L.; Zhang, C.S.; Saghatelyan, A. The application of Local Moran’s I to identify spatial clusters and hot spots of Pb, Mo and Ti in urban soils of Yerevan. Appl. Geochem. 2019, 104, 116–123. [Google Scholar] [CrossRef]
  69. Huang, J.B.; Ding, A.; Li, Y.; Lu, D. Increasing the risk management effectiveness from higher accuracy: A novel non-parametric method. Pac. Basin Financ. J. 2020, 62, 101373. [Google Scholar] [CrossRef]
  70. Yang, T.; Jin, Y.; Yan, L.; Pei, P. Aspirations and realities of polycentric development: Insights from multi-source data into the emerging urban form of Shanghai. Environ. Plan. B Urban Anal. City Sci. 2019, 46, 1264–1280. [Google Scholar] [CrossRef]
  71. Sá Marques, T.; Saraiva, M.; Ribeiro, D.; Amante, A.; Silva, D.; Melo, P. Accessibility to services of general interest in polycentric urban system planning: The case of Portugal. Eur. Plan. Stud. 2020, 28, 1068–1094. [Google Scholar] [CrossRef]
  72. Heitz, A.; Dablanc, L.; Tavasszy, L.A. Logistics sprawl in monocentric and polycentric metropolitan areas: The cases of Paris, France, and the Randstad, the Netherlands, REGION. Eur. Reg. Sci. Assoc. (ERSA) Louvain-La-Neuve 2017, 4, 93–107. [Google Scholar] [CrossRef] [Green Version]
Figure 1. Research ideas.
Sustainability 14 09268 g001
Figure 2. The topological structure of the T-S fuzzy neural network.
Sustainability 14 09268 g002
Figure 3. Algorithm flow of fuzzy neural network.
Sustainability 14 09268 g003
Figure 4. Step-by-step guide for replicating the method.
Sustainability 14 09268 g004
Figure 5. The study area.
Sustainability 14 09268 g005
Figure 6. Prediction by the fuzzy neural network. (a)Training data prediction (b)Test data prediction.
Sustainability 14 09268 g006
Figure 7. Dynamic changes of rural logistics in Chengdu-Chongqing agglomeration.
Sustainability 14 09268 g007
Figure 8. Distribution of levels of rural logistics in (a) 2010, (b) 2015 and (c) 2020.
Sustainability 14 09268 g008
Figure 9. Scatter diagram of level Moran’s I of urban agglomeration. (a) 2010; (b) 2020.
Sustainability 14 09268 g009
Figure 10. Dynamic evolution of Chengdu-Chongqing agglomeration. (a) 2010–2015 (b) 2016–2020.
Sustainability 14 09268 g010
Figure 11. Prediction error diagram of BP neural network and fuzzy neural network. (a) BP neural network; (b) Fuzzy neural network.
Sustainability 14 09268 g011
Table 1. Comparison between this paper and existing literature.
PerspectiveIndicatorsMethodsSource
Efficiency improvementCost; Implementation time; Specialized technical requirements; Social reaction, a requirement for synergy between all stakeholders; Exploitation of existing infrastructure, policies, and actions.Multi-Criteria AnalysisMorfoulaki et al., 2016 [30]
Frequency of merchandise delivery; Time of loading and unloading of merchandise; Typology/size of the establishments; Type of vehicle used; Location and offer of dedicated spaces for loading/unloading; Street design and geometric characteristics associated with the quality of urban logistics operations; Degree of saturation of the street (service levels) associated with the quality of urban logistics operations.Multi-Criteria Evaaluation in GIS Viana and Delgado, 2019 [31]
Vehicle capacity; Customer demand; Distance between two node points; Fixed cost of the vehicle; Subsidy on the purchasing price of the vehicle; Annual circulation tax of the vehicle; Entrance fee paid by the vehicle; Energy price for the vehicle; Energy tax for the vehicle; Energy efficiency for the vehicle; The amount of carbon emits; Carbon tax on the vehicle; A sufficiently large number; The speed limit of the vehicle.Ant Colony OptimisationJuvvala and Sarmah, 2021 [32]
Degree centrality; Betweenness centrality; Closeness centrality; Network efficiency centrality.Entropy-weighted TOPSISZhao et al., 2021 [33]
Risk managementDemand for daily delivery; Daily route; Opening hours of the establishment; NOx count; Complaint count; Occurrence and duration time; Travel time information; Speed information; Pollutant emission parameters.Multi-Agent ModelingOliveira et al., 2017 [34]
Internal stakeholder risks; External stakeholder risks; Indirect stakeholder risks; The risk of disruptive technology upgrades; The risk of technological route changes; Government management risks; Industry management risks; Intermediary service risks; Industrial policy risks; Legal and regulatory risks.Social Network Analysis;
TOPSIS
Liu et al., 2020 [35]
Business Environment Risk; Corruption Risk; Economic Risk; Environmental Risk; Financial Risk; Health and safety Risk; Political Risk; Customs; Infrastructure; International Shipments; Logistics Competence; Timeliness; Tracking and Tracing.Probabilistic network modelQazi, 2022 [36]
Urban agglomerationInvestment in fixed assets; Length of logistics network; Postal outlets; Terminal energy consumption; Cargo volume; Gross product of logistics industry; Carbon emissions.Data envelopment analysisZheng et al., 2020 [37]
Input and output indexes; Total mileage; Capital stock; Number of employees; Freight volume; Cargo turnover; GDP of the logistics industry; CO2 emission; Environmental variable index; Logistics industry density; Urbanization level; Logistics specialization level.The three-stage Super-SBM modelLiang et al., 2021 [38]
Number of people employed in logistics; Ownership of civil trucks; Total logistics investment in fixed assets; Total of Post business; Road/highway freight turnover; Added-value of the tertiary industry; GDP per capita; Total national investment in fixed assets; Total retail sales of consumer goods; Resident population; Household consumption; Public income.Data envelopment analysisZhuang et al., 2021 [39]
Rural logistics from the perspective of urban agglomerationPer capita GDP; Per capita disposable income of urban residents; Total retail sales of social consumer goods; Total sown area of crops; GDP of agriculture, forestry, animal husbandry, and fishery; Total power of agricultural machinery; Total grain output; Highway mileage; Highway freight turnover; Highway density; Internet broadband access users.Fuzzy neural networkThis paper
Table 2. Index system of rural logistics development in urban agglomeration.
LevelIndexVariableAttributeUnitDescriptionSource
Per capita GDP x 1 +CNYRegional economic scaleYang, 2021 [48]
Rural logistics demandPer capita disposable income of urban residents x 2 +CNYConsumption demand of regional urban residentsYang, 2021 [48]
Total retail sales of social consumer goods x 3 +100 mn CNYRealization degree of social commodity purchasing powerLu et al., 2022 [47]
Total sown area of crops x 4 +HectaresRegional agriculture
production scale
Wang, 2010 [50]
Agricultural production capacityGDP of agriculture, forestry, animal husbandry, and fishery x 5 +100 mn CNYRegional comprehensive agricultural production capacityWang, 2010 [50]
Total power of agricultural machinery x 6 +10,000 kwRegional agriculture
development scale
Wang, 2010 [50]
Total grain output x 7 +10,000 tonsRegional agricultural production capacityWang, 2010 [50]
Highway mileage x 8 +KilometerRegional transportation infrastructureXie et al., 2022 [53]
Rural infrastructureHighway freight turnover x 9 +10,000-ton kilometersFreight transport efficiencyXie et al., 2022 [53]
Highway density x 10 +Km/100 square kilometersRegional logistics circulation capacityZhang et al., 2016 [52]
Rural informatizationInternet broadband access users x 11 +Thousand householdsDevelopment degree of regional InformatizationWang and Kang, 2020 [54]
Table 3. Evaluation criteria of rural logistics in urban agglomeration.
Evaluation indexIIIIIIIVV
Per capita GDP 12,638~23,76923,768~30,80630,905~38,71238,846~49,37649,830~85,679
Per capita disposable income of urban residents12,708~19,38619,451~24,56524,619~28,85128,920~34,37134,549~48,592
Total retail sales of social consumer goods98~283285~420422~580586~10132473~117,872
Total sown area of crops118~340341~448449~525528~778810~3372
GDP of agriculture, forestry, animal husbandry, and fishery93~224225~286287~354356~500528~2749
Total power of agricultural machinery84~152153~193194~230231~28110,591~825,062
Total grain output35~127127~165166~216217~258268~1081
Highway mileage5656~81608201~11,48211,524~14,84614,914~20,29222,298~180,796
Highway freight turnover240,303~423,410424,931~545,112546,691~671,405677,515~1,160,2471,597,072~36,106,277
Highway density38~99100~136136~156157~184185~258
Internet broadband access users88~268270~410413~646653~12661421~13,724
Table 4. Comprehensive index of rural logistics in Chengdu-Chongqing agglomeration.
City20102011201220132014201520162017201820192020
Chongqing2.773.013.392.633.854.133.565.264.595.385.74
Chengdu1.952.633.233.844.324.354.475.426.045.156.50
Zigong0.510.951.381.822.092.542.803.313.834.254.70
Luzhou0.560.961.401.742.132.202.753.223.674.164.52
Deyang0.711.461.952.452.793.333.293.844.354.475.24
Mianyang0.711.181.611.982.372.973.063.644.124.445.00
Suining0.390.580.981.261.621.512.292.733.293.884.18
Neijiang0.480.771.191.451.761.802.482.883.343.924.20
Leshan0.571.051.501.952.312.982.923.393.954.354.93
Nanchong0.620.630.981.171.521.862.162.603.043.713.87
Meishan0.470.791.221.591.931.972.613.063.514.044.31
Yibin0.600.981.431.802.182.462.723.223.904.344.91
Guang’an0.460.781.211.531.831.472.372.773.173.693.91
Dazhou0.540.610.951.121.461.742.162.572.943.543.73
Ya’an0.380.751.181.601.941.882.572.953.383.944.25
Ziyang0.450.781.201.431.731.052.322.653.003.383.65
Publisher’s Note: MDPI stays neutral with regard to jurisdictional claims in published maps and institutional affiliations.

