Article

Optimal Method for Biomass Estimation in a Cladoceran Species, Daphnia Magna (Straus, 1820): Evaluating Length–Weight Regression Equations and Deriving Estimation Equations Using Body Length, Width and Lateral Area

1
Department of Environmental Science and Engineering, Kyung Hee University, Yongin 17104, Korea
2
Fisheries Science Institute, Chonnam National University, Yeosu 59626, Korea
3
Department of Biology, Kyung Hee University, Seoul 02447, Korea
4
Department of Ocean Integrated Science, Chonnam National University, Yeosu 59626, Korea
5
Department of Life Science, Daejin University, Pocheon 11159, Korea
*
Authors to whom correspondence should be addressed.
Sustainability 2022, 14(15), 9216; https://doi.org/10.3390/su14159216
Submission received: 8 June 2022 / Revised: 8 July 2022 / Accepted: 25 July 2022 / Published: 27 July 2022
(This article belongs to the Special Issue Biodiversity in Freshwater)

Abstract

:
Assessing the biomass of zooplankton compensates for the difference between number of individuals and the accumulated body weight of the community, which helps assess aquatic ecosystem food web functions. Daphnia are crustaceans that play an intermediate role in biological interactions within food webs. The morphology and body specification of Daphnia differ during growth; hence, it is essential to apply species-specific equations to estimate biomass. We evaluated the length–weight regression equations used previously to estimate Daphnia magna biomass and conducted regression analyses using various body specifications and biomass measurements taken directly using devices such as a microbalance and microscopic camera. Biomass estimated using an equation from the Environmental Protection Agency was significantly different from the direct measurement: average biomass was lower, indicating that the equation possibly underestimated actual biomass. The biomass of D. magna had a higher multiple R2 value when length was compared with width and area, and a linear regression equation was the most suitable equation for biomass estimation. Because body specifications and biomass are affected by various environmental factors, the development of accurate species-specific biomass estimation equations will contribute to obtaining fundamental data with which the biological responses of zooplankton to aquatic ecosystem changes can be assessed.

1. Introduction

Zooplankton, as phytoplankton predators, affect the diversity and biomass of phytoplankton and play a role in transmitting energy from the lower to higher trophic level when they are predated by benthic macroinvertebrates and/or fish [1]. They vary in size in a species-dependent manner; generally, individual cladocerans and copepods are larger than rotifers, which affects their biomass [2]. The individual density of zooplankton also varies significantly depending on the classification group: large cladocerans and copepods >1 mm in size may occur at a density of <1 individual per liter, whereas small rotifers may occur at tens of thousands of individuals per liter [3]. Hence, when zooplankton communities are analyzed based on the number of individuals, overestimation or underestimation of species’ roles and contributions to ecosystem function can occur [4]. Biomass, on the other hand, is determined based on the size, generally the body length of each species, so it compensates for the gap between the number of individuals and the accumulated body weight of the biological community, which helps evaluate the functioning of zooplankton within the aquatic food web and enables more accurate relative comparison of their community among several water bodies [5,6].
The biomass of plankton communities can be used to calculate the primary and secondary productivities of water bodies [5]. Quantitative estimates of biomass and the consequent productivity of the plankton community underlying the grazing food web are essential for tracking material and energy flows [7]. Through biomass-based productivity comparisons between organisms at different trophic levels (e.g., phytoplankton–zooplankton–fish), it is possible to determine energy transfer efficiency, which represents an appropriate quantitative index of the circulation of matter in the aquatic food web [2,5,6]. Additionally, biomass is used to better reflect the role of zooplankton as a top-down controller for phytoplankton when using plankton community as an evaluation index for the water quality environment in rivers or lakes [8,9,10,11]. The biomass of a plankton community is affected by species composition, the number of individuals and individual size [5,12], and these factors vary depending on environmental changes at a global scale (e.g., climate change) as well as regional and local scales (e.g., habitat connectivity and water quality) [13,14,15,16,17]. Therefore, plankton biomass can be used as fundamental data for the assessment of biological responses to aquatic ecosystem changes. Zooplankton biomass itself is an important indicator of secondary production in marine and coastal ecosystems [5,12]. In freshwater, it has recently been used as a tool to access the ecosystem health [8]. The biomass proportions of zooplankton functional groups are the main components of multiple metrics for the zooplankton biological integrity index (Z-IBI) [10]. In addition, species-specific zooplankton biomass is essential information required for ecological models such as AQUATOX that predict community dynamics and bioaccumulation of heavy metals in food web [18,19,20]. However, despite its importance and possible applicability in both ecology and environmental science fields, it remains a challenge to measure directly or estimate accurately the biomass of plankton per unit volume or unit area in lakes and rivers.
Daphnia is a medium to large cladoceran species (0.5–2.0 mm) commonly found in most freshwater ecosystems worldwide. It is the main predator of phytoplankton, causing the clear water phase phenomenon in spring, as well as a food source for fish, especially visual-dependent predators, because of the large size of individuals. Thus, determining the biomass of Daphnia, located in the intermediate position between phytoplankton and fish communities, is important for understanding the material and energy transfer processes of the grazing food web [21,22,23]. As Daphnia is too small for direct measurements of either wet or dry weight, its biomass is generally estimated indirectly using known regression equations obtained from the relationship between body length and weight [4,24]. In a length–weight regression equation for Daphnia, y = a∙x + b, x represents the total length from the individual’s head except for its apical spine, i.e., the prosome length. Unfortunately, the prosome length of Daphnia is characterized by discontinuous changes during the molting process as the individual grows [25]. However, since the body width of Daphnia (i.e., the carapace width) changes according to individual nutritional status and body mass during the molting process, it can be considered a more stable factor in Daphnia biomass estimation [25]. Additionally, width-based biomass information is available in food chain research because the body width of crustacean species (e.g., cladoceran and copepod species) acts as a controlling factor in predator food selection [26,27].
Previously established length–weight estimation equations used to calculate the biomass of zooplankton, including Daphnia species, continue to be supplemented [28,29,30], and advanced methods, such as taking repeated measurements using a precision balance and image analyses, have been proposed to improve the precision of estimations and measurements [25,29,31]. In the present study, for the aim of suggesting a more accurate biomass estimation method, we evaluated the suitability of the existing biomass estimation equations using a representative species of Daphnia, namely, Daphnia magna (Straus, 1820), by comparing biomass estimated using previously presented length–weight regression equations and biomass measured directly using a microbalance. Additionally, through regression analyses between the measured D. magna biomass and individual body specifications (i.e., prosome length, carapace width and lateral area), we derived and tried to propose a regression equation that is more suitable for estimating the biomass of D. magna.

2. Materials and Methods

2.1. Daphnia Magna as the Subject Species

We selected D. magna, a common species worldwide and a test species of OECD guidelines for testing chemicals (Test Guideline 211 [32]), as the subject of this study. We cultured D. magna individuals provided by the National Institute of Environmental Research of Korea in the laboratory for more than a year prior to the experiment. To secure the number of individuals required for biomass estimation and measurement, egg-bearing females were selected and cultured in 2 L beakers with aerated 21 ℃ tap water under a 16:8 h light:dark cycle and fed 3 mL of Chlorella sp. (3.0 × 10⁵ cell/mL) once a day for two weeks prior to the experiments.

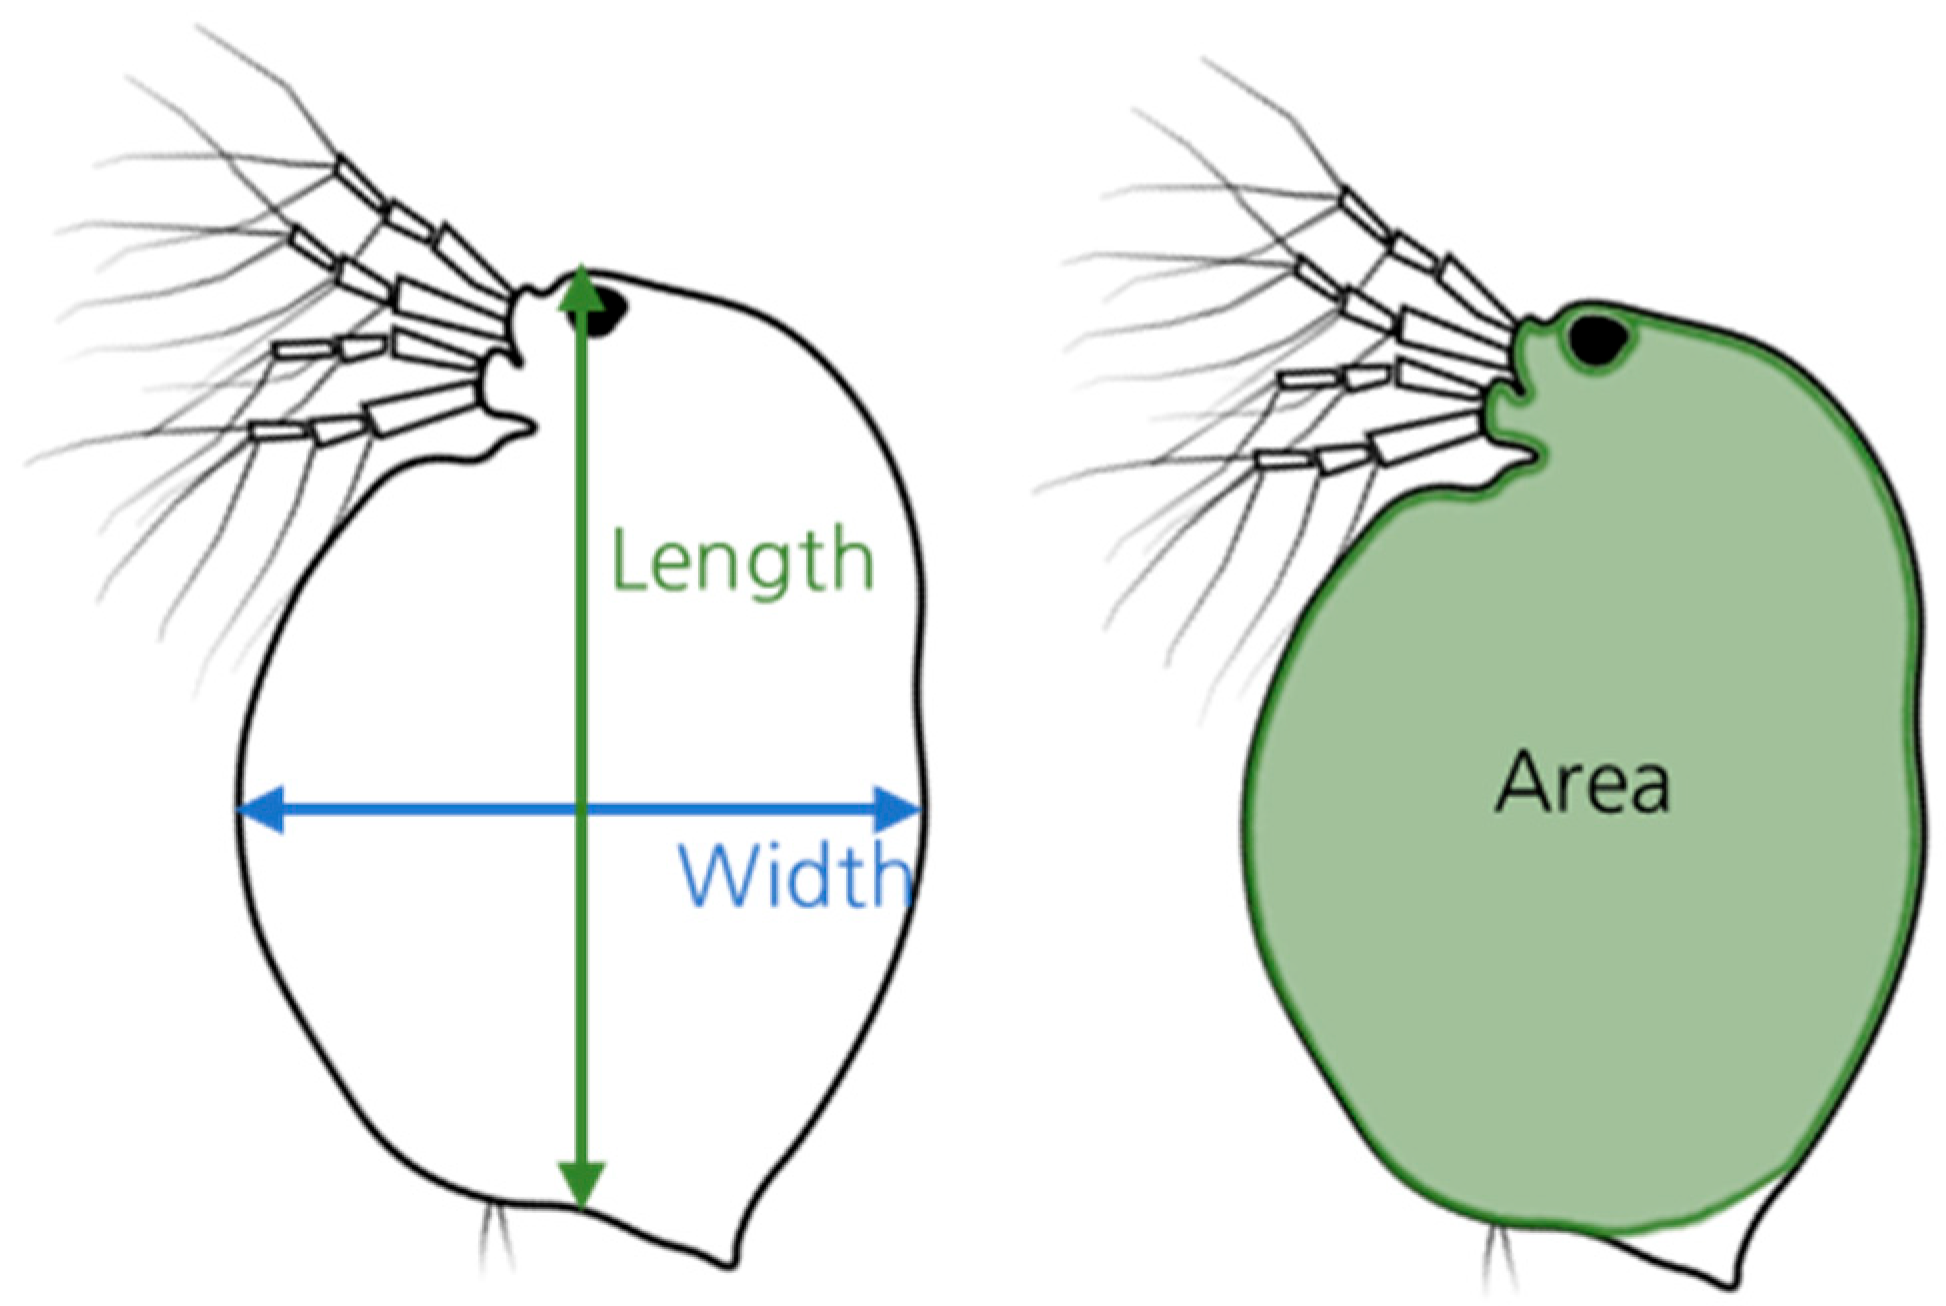
2.2. Estimation and Measurement of D. Magna Biomass

Length–weight regression equations for biomass estimation of D. magna have been proposed by Dumont et al. and Kawabata and Urabe [17,24]. The United States Environmental Protection Agency (US EPA) suggests that zooplankton biomass, including that of D. magna, should be estimated based on the length–weight relationship established by Dumont et al., McCauley and Lawrence et al. in the National Lakes Assessment-Laboratory Operations Manual [4,17,33,34,35]. In the EPA Standard Operating Procedure for Zooplankton Analysis, a D. magna-specific biomass estimation equation is not presented, but it includes an equation for Daphnia spp. established by Dumont et al. using pooled Daphnia species [17,36]. Accordingly, in the present study, the biomass of each D. magna individual was estimated using the length–weight regression equation established by Dumont et al. [17] (Table 1).
To estimate an individual’s biomass, its length (mm) was measured from the tip of the head to the end of the body, excluding the apical spines, under a microscope (CKX41; Olympus, Japan) according to the EPA manual [35] (Figure 1). Additionally, we measured the carapace width (mm) and lateral area (mm2) of each individual. To improve the accuracy of measurements, we used a microscope digital camera (FX-500; Olympus, Japan) and an image viewer program (ImageView).
Individuals for which the length, width and area measurements were taken (n = 90) were placed in a preweighed aluminum tin capsule (a) and dried in an oven at 60 °C. After 24 h, the weight of the dried tin capsule was measured (b) using a microbalance (MYA 2.4Y; RADWAG, Poland). Weight measurements (a) and (b) were taken three times each to minimize the effect of errors during measurement, and the measured biomass of D. magna was calculated as follows:
Measured biomass (dry weight, mg) = (b)avg − (a)avg.

2.3. Statistical Analyses

Statistical analyses were conducted in R [37] to verify the validity of the established length–weight regression equation applied to estimate D. magna biomass and derive a more suitable regression equation for estimating the biomass of this species using directly measured biomass and body size. We compared the average biomass values estimated using the length–weight regression equations of Dumont et al. [17] and measured directly with a microbalance through ANOVA with the Kruskal–Wallis test since our data are not normally distributed (Shapiro–Wilk test, p < 0.05). The post hoc test was conducted with Bonferroni–Dunn correction, and we interpret that there is no statistically significant difference because the null hypothesis (H0) that two groups we compared had the same size rejects when the p-value is larger than the α/2 (α = 0.05). Additionally, we attempted to identify the optimal equation for estimating D. magna biomass using regression analysis that included the measured biomass and individual body specifications (i.e., length, width and area). To visualize the regression analysis results, we used the R packages “ggplot2” and “hrbrthemes” [38,39]. Because reliability is maximized when the multiple R2 value is close to 1, the suitability of the biomass estimation equation derived from the model fitting analysis was determined using the multiple R2 values.

3. Results

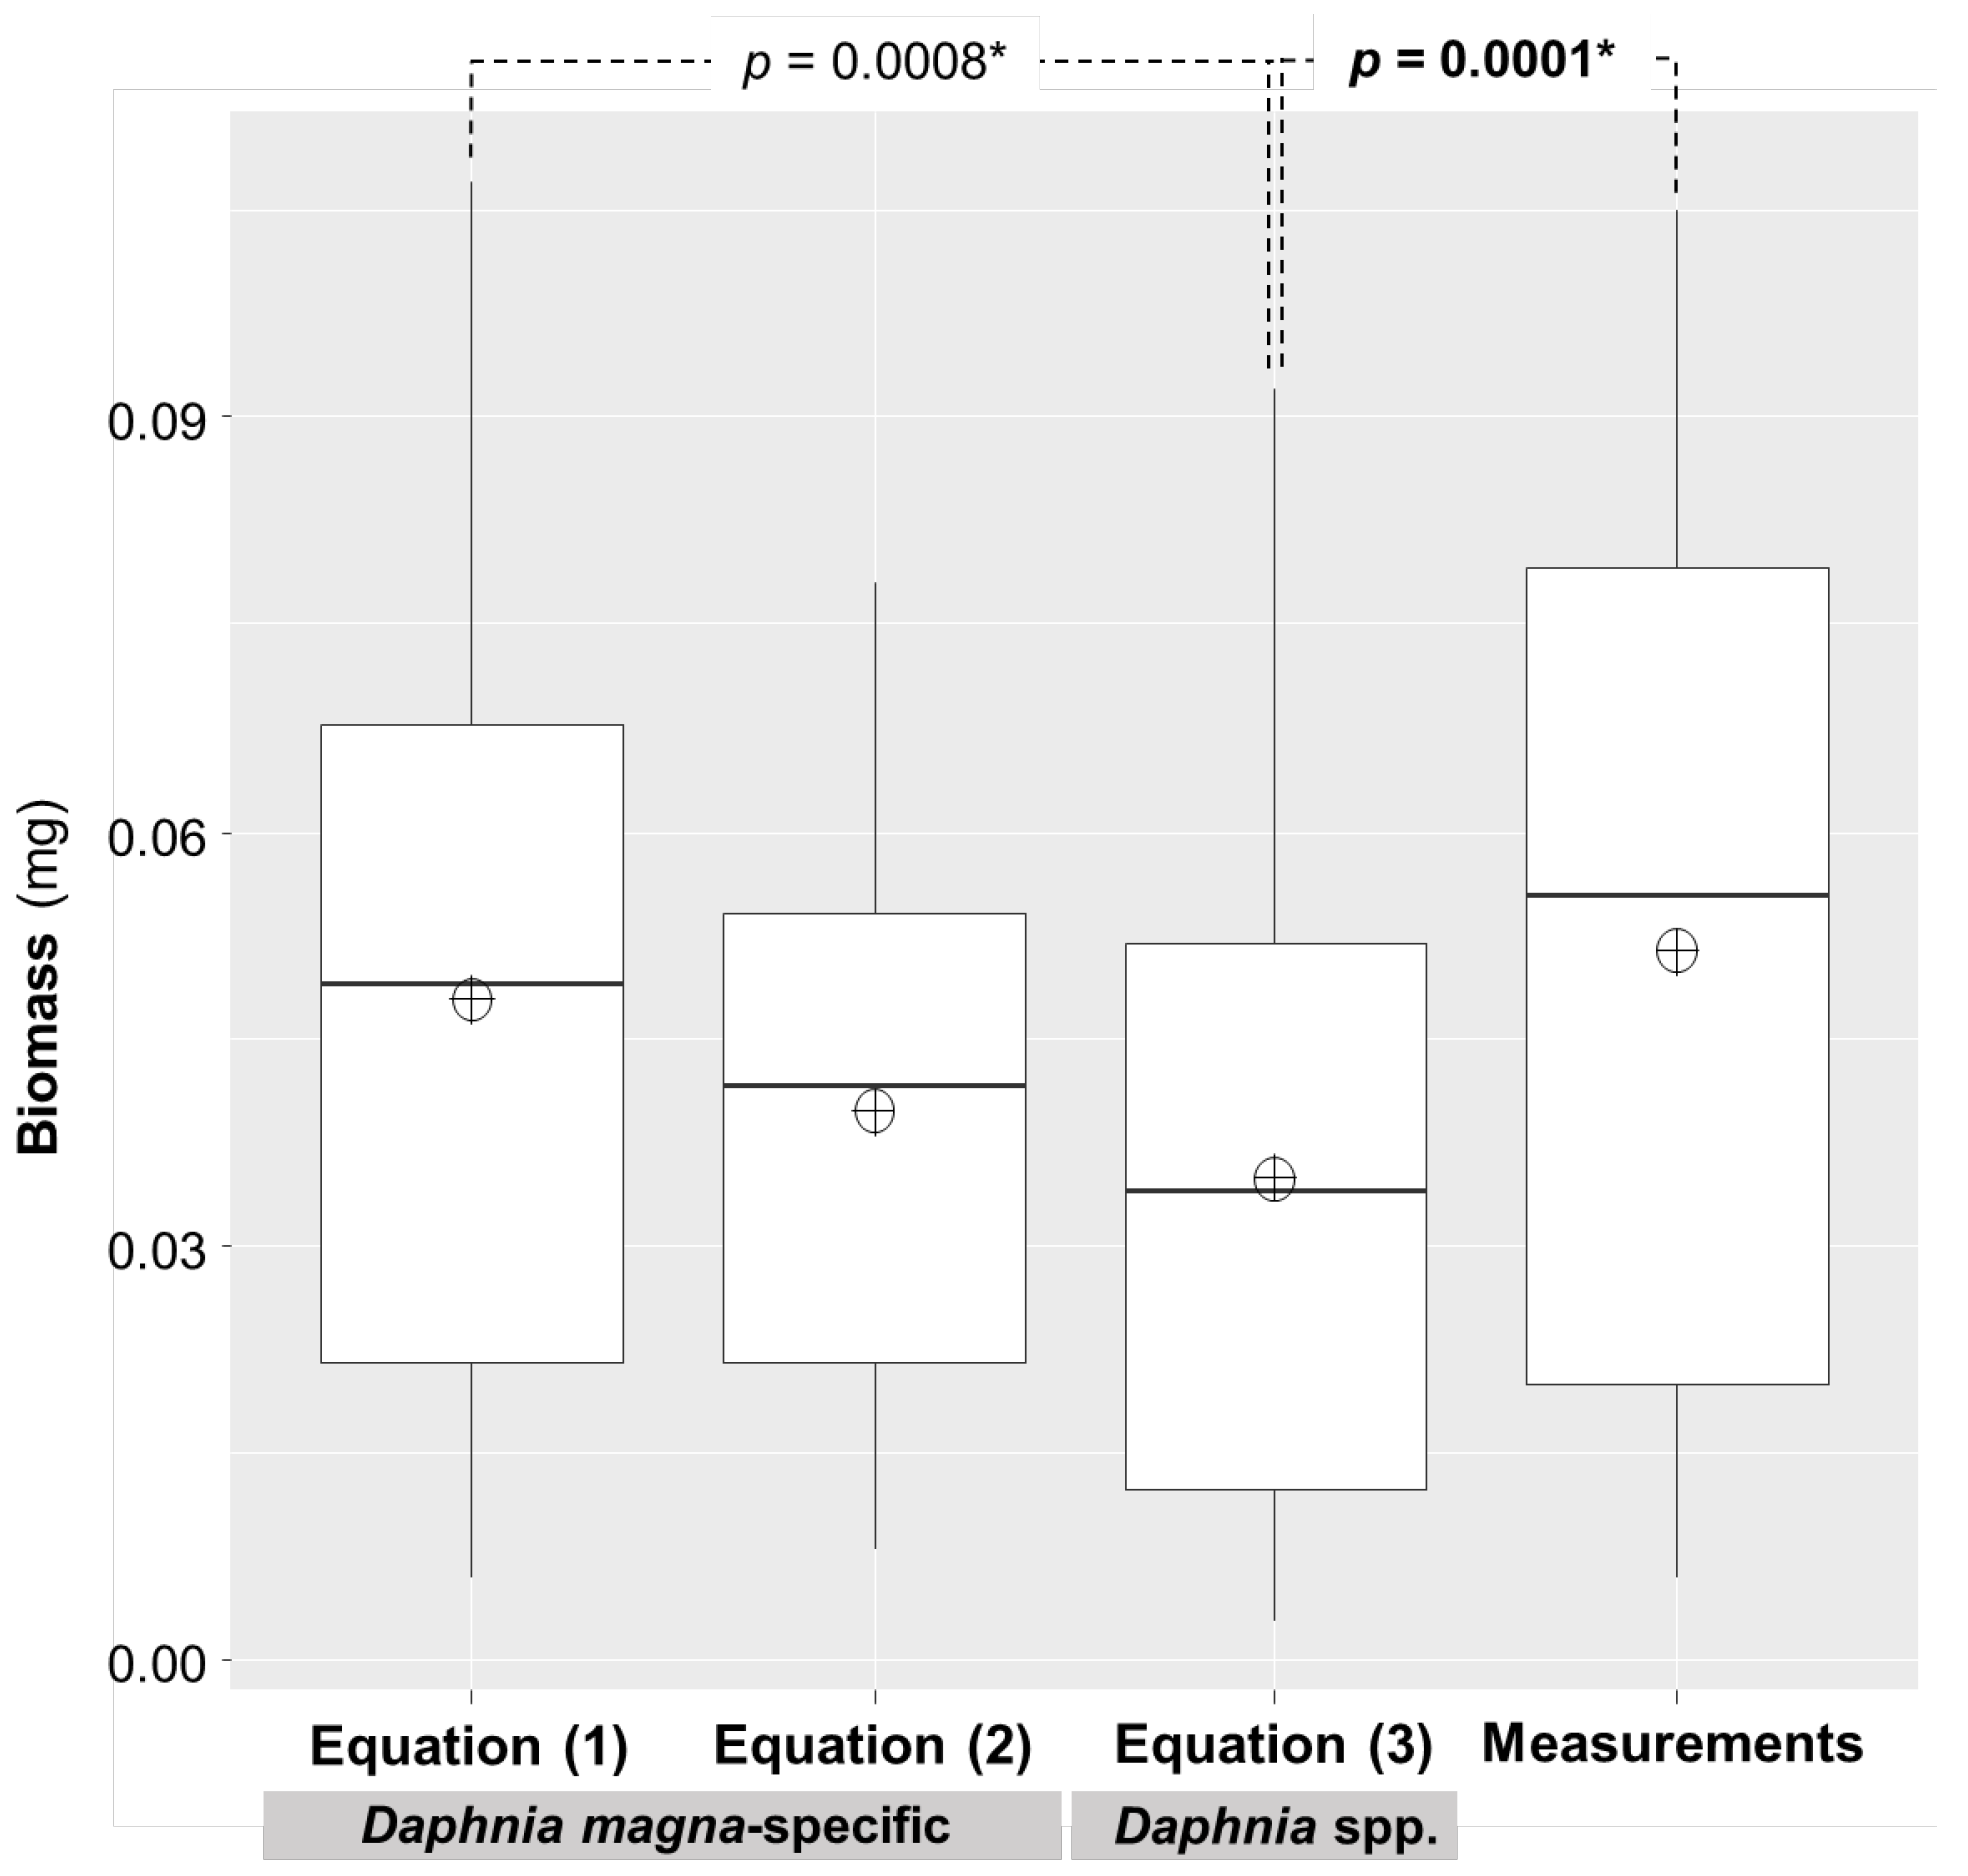
3.1. Comparison of D. Magna Biomass Estimates and Measurements

Figure 2 shows the results of comparisons among the dry weight (biomass) values estimated using the D. magna biomass calculation formulas presented in Table 1 and the values obtained by directly measuring the dry weight using a microbalance. Differences in the biomass estimates obtained according to the equations of Dumont et al. [17] were detected (Table 2). Particularly, significant differences were found between the values calculated using Equation (1), derived from D. magna collected from a lake, and Equation (3), derived from pooled Daphnia spp. (p < 0.025; Figure 2, Table 2). The biomass estimates calculated using Equations (1)–(3) of Dumont et al. [17] differed from the direct biomass measurements (Table 2). Specifically, the biomass measurements differed significantly from the value estimated using Equation (3), derived from pooled Daphnia spp. (p < 0.025; Figure 2, Table 2). Although not statistically significant, the estimates calculated from Equation (2), derived from D. magna collected in a river, showed some difference with the measurements (p = 0.0263). The direct biomass measurements did not differ significantly from the value estimated using Equation (1), based on D. magna from a lake (Figure 2).

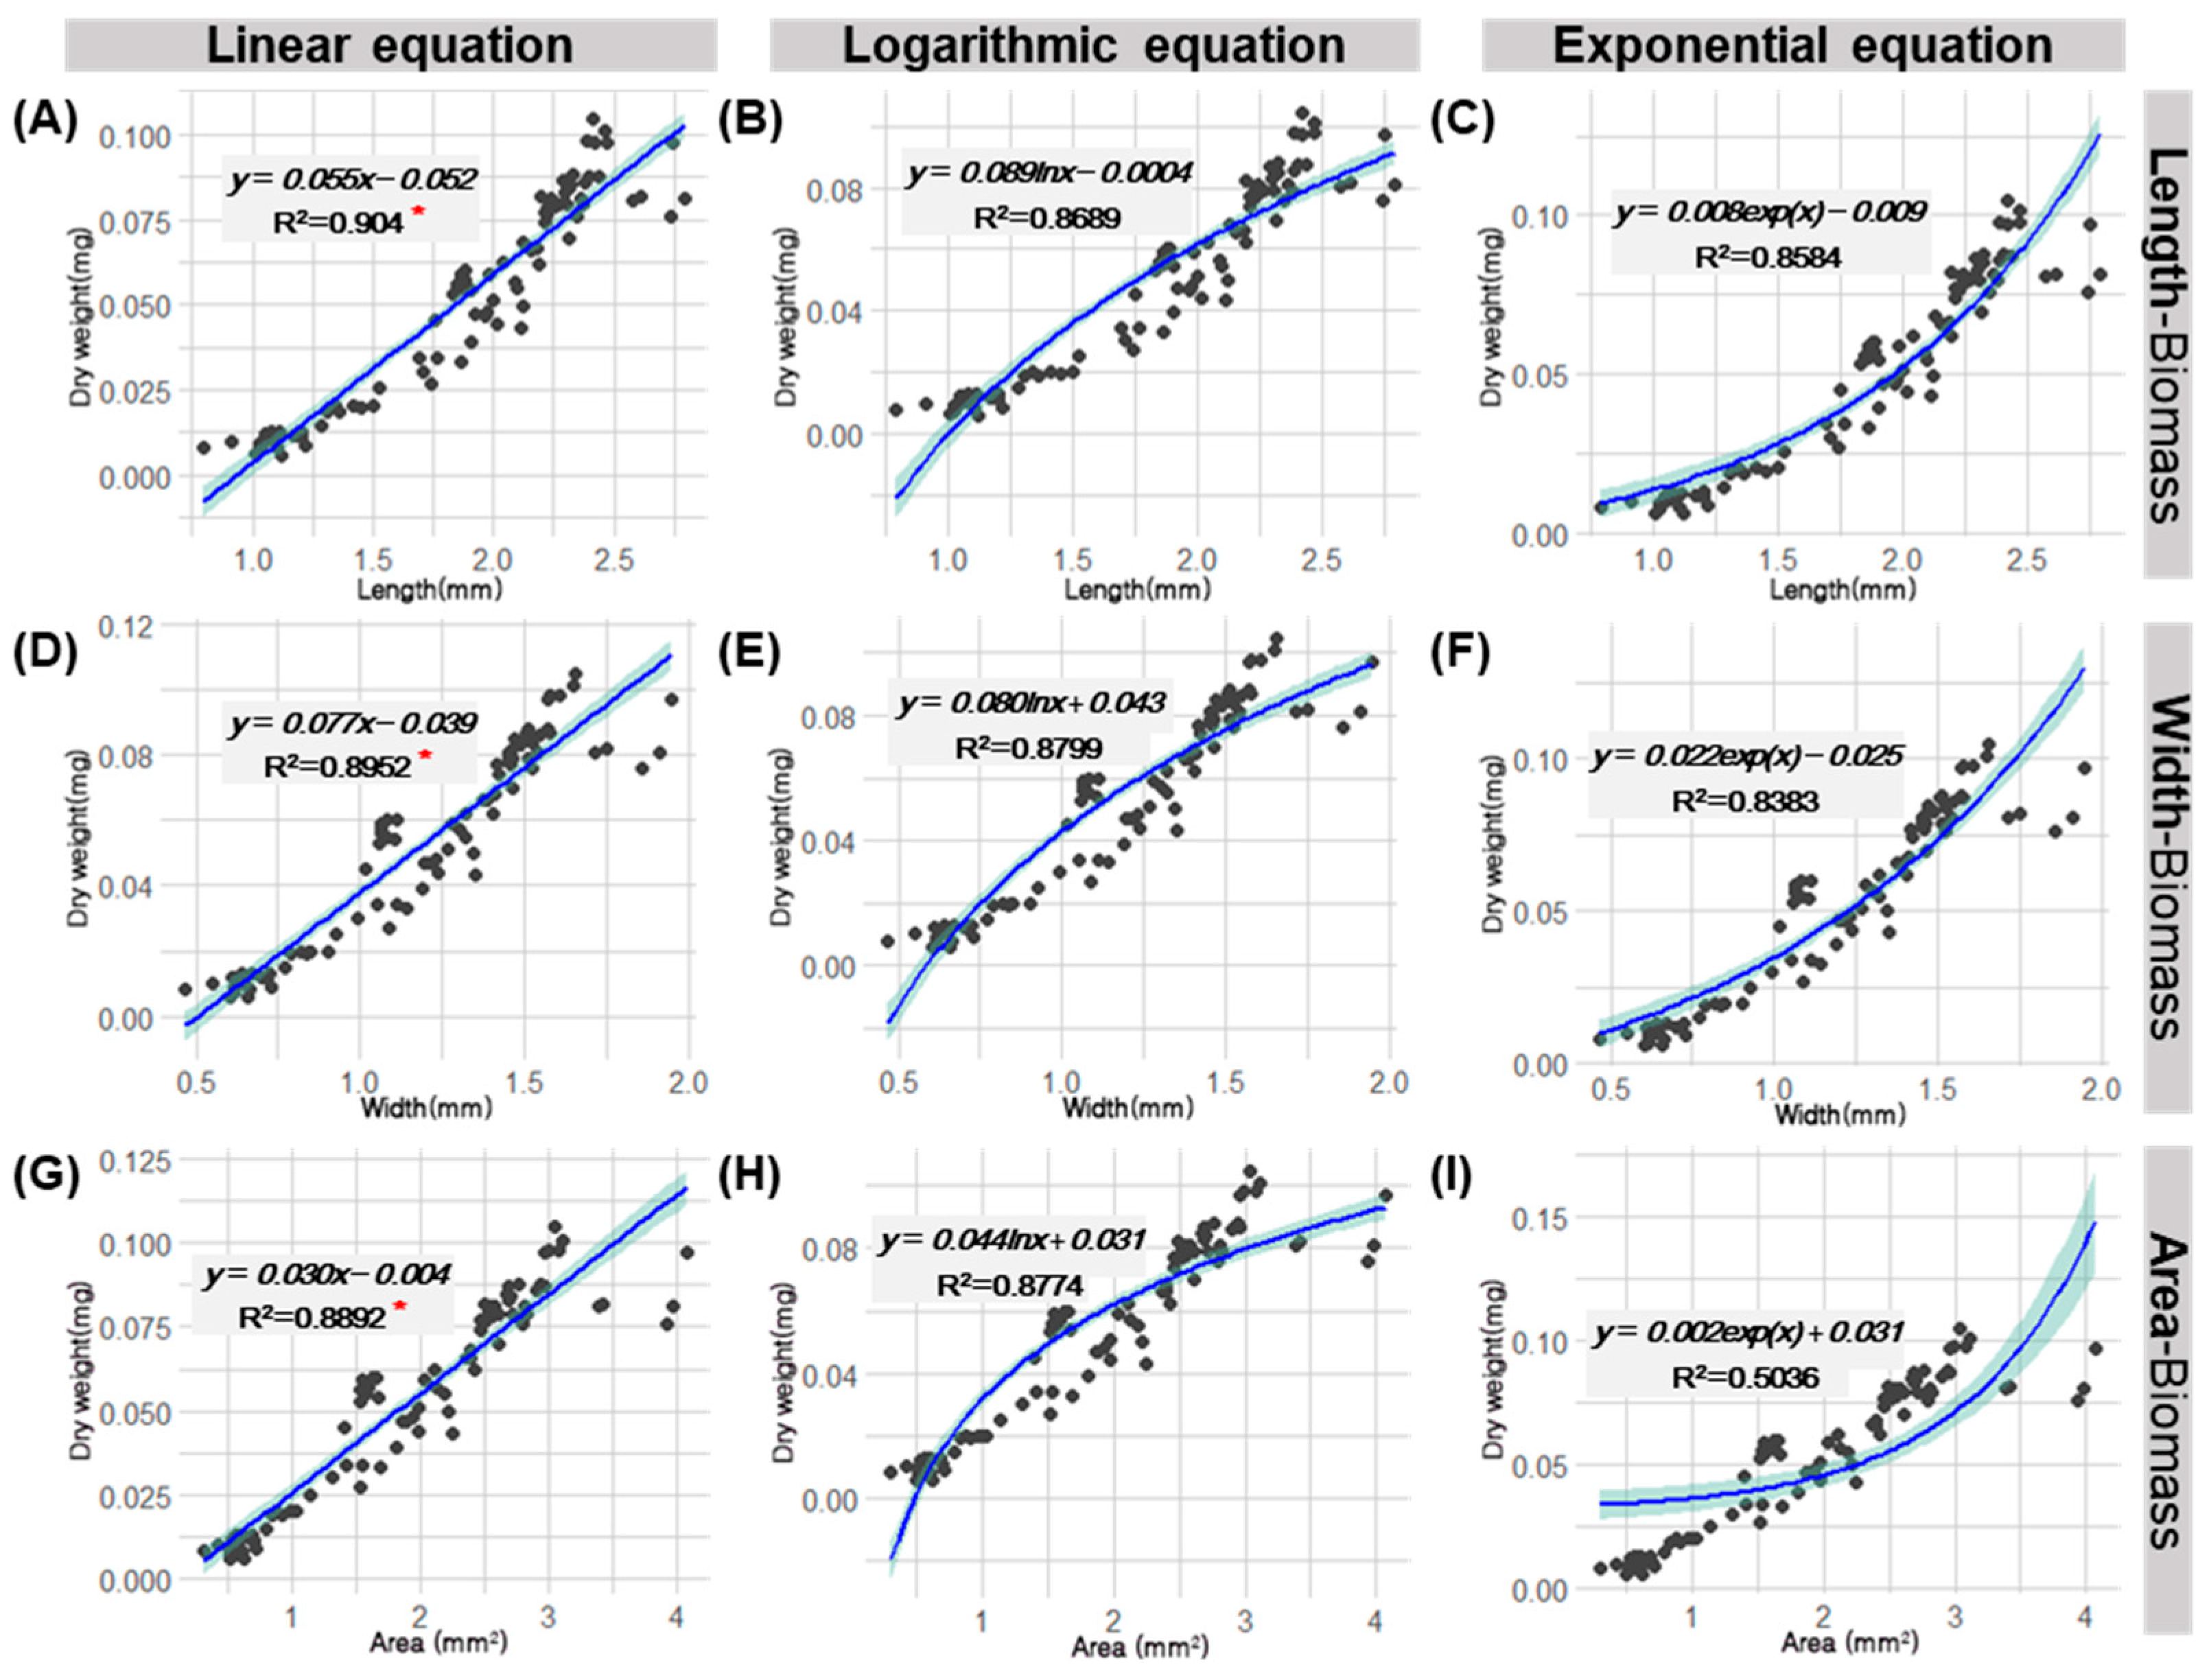
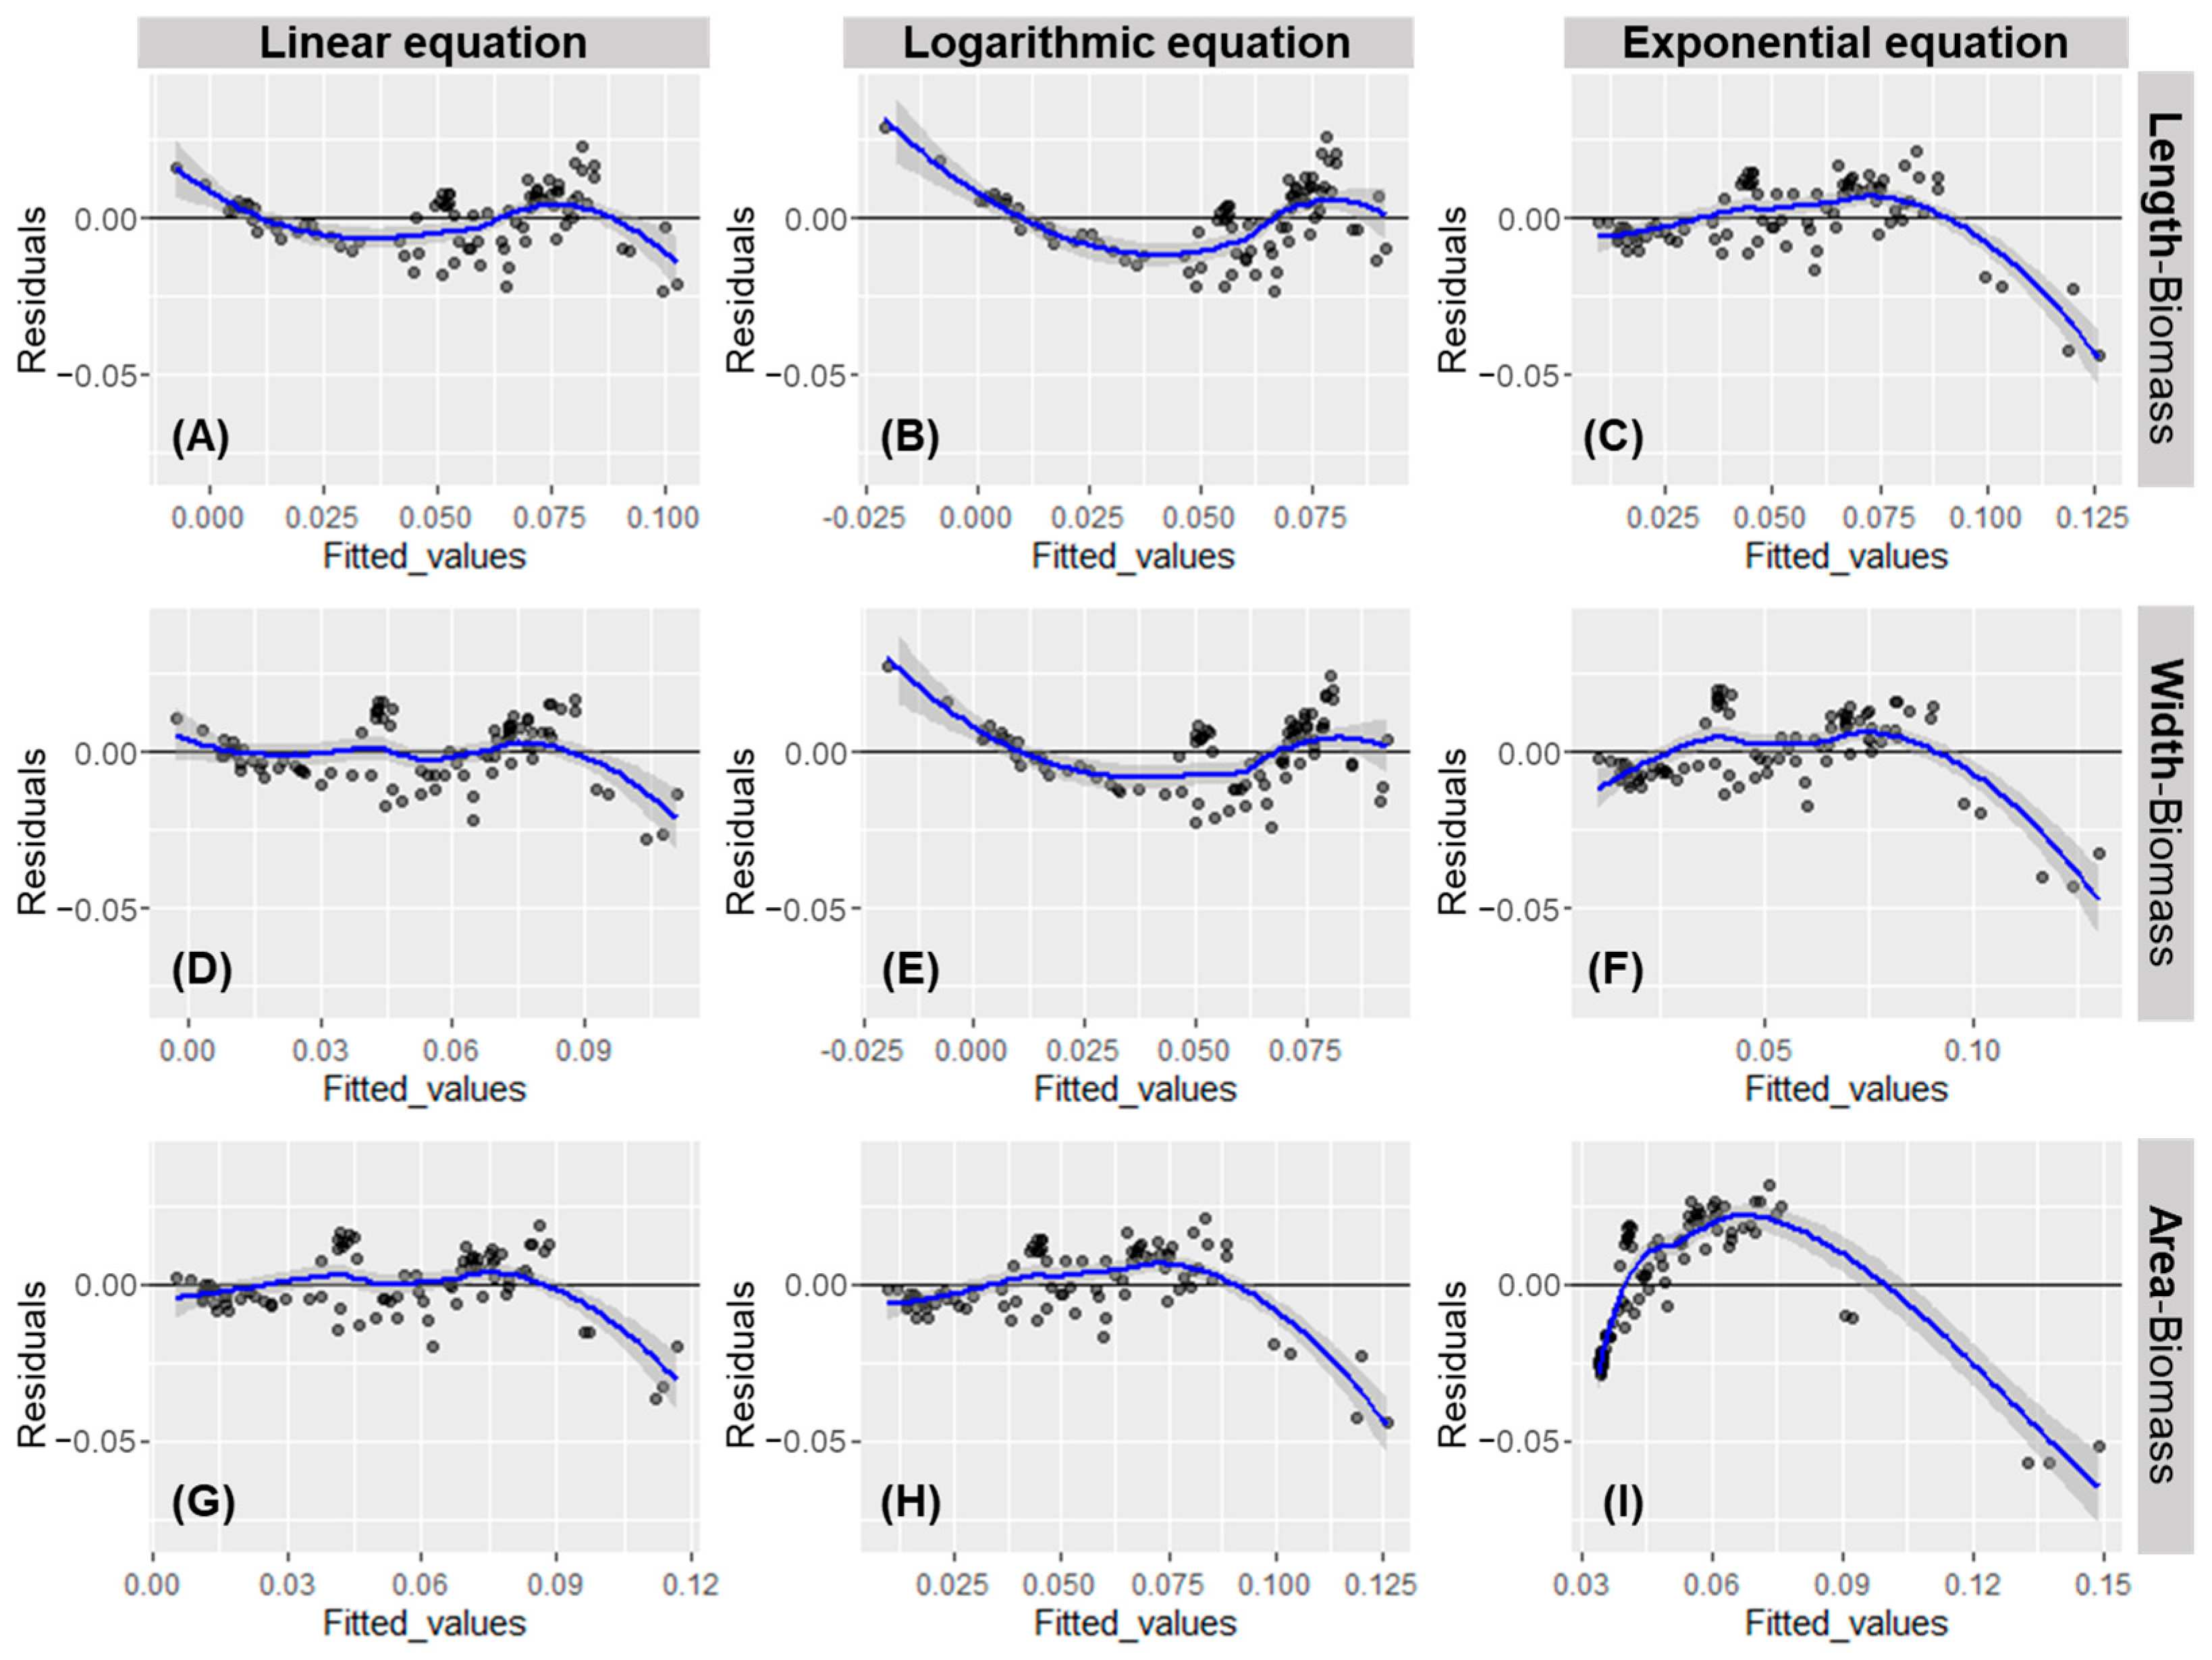
3.2. Derivation of Regression Equations Considering Body Specifications and Biomass Measurements of D. Magna, and a Comparison of the Suitability of the Derived Equations

To derive the most suitable regression equation for estimating D. magna biomass (dry weight, mg), we used width and area as well as length, having measured the relevant body specifications of each individual (Table 3).
Following the regression analysis that included each body specification and biomass measurement of D. magna, the equations shown in Figure 3 were derived for each regression type: linear (y = a∙x + b), logarithmic (y = a∙lnx + b) and exponential (y = a∙ex + b) functions. The derived D. magna length–biomass regression equations were analyzed using the multiple R2 values 0.904, 0.8689 and 0.8584 for the linear, logarithmic and exponential functions, respectively (Figure 3A–C). For the width–biomass regression equation, the multiple R2 values were 0.8952, 0.8799 and 0.8383 for the linear, logarithmic and exponential functions, respectively (Figure 3D–F). In the derived area–biomass regression equation, the multiple R2 values were 0.8892, 0.8774 and 0.5036 for the linear, logarithmic and exponential functions, respectively (Figure 3G–I). Regardless of the body specifications of D. magna, high multiple R2 values were obtained in the following order: linear functions > logarithmic functions > exponential functions. Thus, the linear model was found to be best fitted when body specification–weight regression analyses were conducted (Figure 3). Based on the linear function, the length (prosome length) of D. magna is most suitable for estimating their biomass (Figure 3A,D,G).
When the residuals of the measurements were visualized for the fitted values (estimates) of the regression equations derived between each body size specification and biomass, in the linear functions, the residuals were relatively uniformly distributed, and the increasing trend of residuals according to those of fitted values was less noticeable compared with the logarithmic and exponential functions (Figure 4). Since negative residuals occurred in the section where the fitted values are large, the regression equations could lead to overestimation when estimating the biomass of larger individuals (Figure 4A,D,G). However, deviation of the residuals was smaller than other regression functions. Finally, it was shown that the biomass of D. magna can be most effectively estimated using the length–weight linear regression equation; y = 0.055∙x − 0.052 (Figure 3A and Figure 4A).

4. Discussion

In this study, to develop a more suitable method for estimating the biomass of D. magna, the existing length–weight regression equations were evaluated [17], and new estimation equations were derived using regression analyses with the dry weight of D. magna according to their body specifications.
The biomass of D. magna estimated using the length–weight regression equation proposed by Dumont et al. [17] differed depending on the sampling environment of the individuals used to derive the equation and whether the Daphnia species were pooled. Moreover, a certain equation gave values that differed significantly from the biomass measured directly using a microbalance. The biomass of D. magna was lower on average in estimates compared with direct measurements. Especially, the estimated biomass was lowest when using the equation derived from pooled Daphnia spp., which is currently suggested by the EPA [36] as the equation with which to estimate the biomass of D. magna. Accordingly, there is a concern that this equation might underestimate the actual biomass. Additionally, from the slight difference between biomass values estimated from equations derived from the lake- and river-collected D. magna, it was judged that the effect of the sampling environment of D. magna individuals used to derive the length–weight regression equations must be considered. Therefore, individual collection in various environments will be important in deriving equations that estimate the biomass of target zooplankton species accurately.
Although new regression equations were derived using the lateral area (containing both width and length information) and width (based on research results indicating that body width is a more stable factor in estimating the biomass of Daphnia species than length [25]) of D. magna, the existing approach used to estimate length-based biomass was found to be the most appropriate method. Compared with logarithmic and exponential functions, the highest multiple R2 value was shown in the length–weight linear regression equation, and the residuals between the estimates calculated from the equation and the actually measured biomass using microbalance appeared in a relatively evenly stable distribution. Therefore, the biomass of D. magna is considered to be estimated most accurately by the length–weight linear regression equation using prosome length. This may be because of the relatively simple body morphology of D. magna compared with that of other Daphnia species. Additionally, most of the species in Daphnia develop appendages, such as helmets and apical spines, for defensive functions according to predation pressure [40,41], whereas the D. magna individuals used in the present study showed little appendage development, resulting in a higher correlation between their body length and dry weight (biomass). The degree of appendage development can affect the accuracy of length-based biomass estimation formulas for Daphnia species. For instance, in the case of Daphnia galeata, which varies greatly in its appendage development according to predation pressure and season, biomass tends to decrease as the length of the helmet and apical spines decreases [42]. Additionally, our regression analysis including the weight and length of D. galeata with its apical spines had a better fit compared with that of a similar analysis including the weight and length without the apical spine [unpublished data]. Given the increased length of appendages due to the morphological changes of cladoceran species, including Daphnia, the lateral area, considering both length and width, should be used as a reasonable parameter for estimating biomass [43].
We found that body specification, which is closely related to Daphnia biomass, seemed to differ among species (e.g., Daphnia similoides, width; D. galeata and Daphnia pulex, area), and the tendency for biomass to increase was seemingly different as body specifications increased [unpublished data]. This is likely because of differences in body morphology and the degree to which each body specification develops during the individual growth of Daphnia species [25]. Regression equations for estimating Daphnia biomass derived by pooling various Daphnia species without considering the species-specific relationship between body specifications and biomass may lead to errors when estimating the biomass of particular Daphnia species. Indeed, to develop more suitable biomass calculation methods, the existing species-specific biomass estimation equations must be reviewed, including those for D. magna assessed in this study.

Author Contributions

Conceptualization, H.-J.O. and K.-H.C.; methodology, D.K., H.-J.O. and K.-H.C.; validation, K.-H.C.; formal analysis, D.K., Y.-J.C., Y.C. and H.-J.O.; data curation, D.K., Y.-J.C. and Y.C.; writing—original draft preparation, D.K. and H.-J.O.; writing—review, C.W.J., Y.-S.P., I.-S.K., Y.-J.K. and K.-H.C.; writing—editing, H.-J.O. and K.-H.C.; visualization, D.K. and H.-J.O.; supervision, C.W.J., I.-S.K., Y.-J.K. and K.-H.C.; project administration, Y.-S.P. and H.-J.O.; funding acquisition, Y.-S.P. and H.-J.O. All authors have read and agreed to the published version of the manuscript.

Funding

This research was supported by Basic Science Research Program through the National Research Foundation of Korea (NRF) funded by the Ministry of Education (2021R1A6A3A13039786) and by Korea Environment Industry & Technology Institute (KEITI) through Aquatic Ecosystem Conservation Research Program funded by Korea Ministry of Environment (MOE) (2020003050003).

Institutional Review Board Statement

Not applicable.

Informed Consent Statement

Not applicable.

Data Availability Statement

Not applicable.

Conflicts of Interest

The authors declare no conflict of interest. The funders had no role in the design of the study; in the collection, analyses, or interpretation of data; in the writing of the manuscript; or in the decision to publish the results.

References

  1. Choi, K.H.; Lee, C.R.; Kang, H.K.; Kang, K.A. Characteristics and variation of size-fractionated zooplankton biomass in the Northern East China sea. Ocean Polar Res. 2011, 33, 135–147, [Korean literature]. [Google Scholar] [CrossRef] [Green Version]
  2. Zhang, L.; Cui, J.; Song, T.; Liu, Y. Application of an AQUATOX model for direct toxic effects and indirect ecological effects assessment of Polycyclic aromatic hydrocarbons (PAHs) in a plateau eutrophication lake, China. Ecol. Model. 2018, 388, 31–44. [Google Scholar] [CrossRef]
  3. Oh, H.J.; Seo, D.H.; Choi, M.J.; Jeong, H.G.; Kim, H.W.; Oh, J.M.; Chang, K.H. Calculation and applicability of rotifers biomass (Polyarthra spp.) based on length-weight relationship and spatial distribution of body length. KJEE 2018, 51, 205–211, [Korean literature]. [Google Scholar] [CrossRef]
  4. US Environmental Protection Agency, USEPA. Modeling Environmental Fate and Ecological Effects in Aquatic Ecosystems; United States Environmental Protection Agency Office of Water: Washington, DC, USA, 2014; Volume 1, User’s manual, EPA-820-R-14-005. Available online: nepis.epa.gov (accessed on 17 May 2022).
  5. Kane, D.D.; Gordon, S.I.; Munawar, M.; Charlton, M.N.; Culver, D.A. The planktonic index of biotic integrity (P-IBI): An approach for assessing lake ecosystem health. Ecol. Indic. 2009, 9, 1234–1247. [Google Scholar] [CrossRef]
  6. Beaver, J.R.; Tausz, C.E.; Black, K.M.; Bolam, B.A. Cladoceran body size distributions along temperature and trophic gradients in the conterminous USA. J. Plankton Res. 2020, 42, 613–629. [Google Scholar] [CrossRef]
  7. Brucet, S.; Boix, D.; Quintana, X.D.; Jensen, E.; Nathansen, L.W.; Trochine, C.; Meerhoff, M.; Gasco´n, S.; Jeppesena, E. Factors influencing zooplankton size structure at contrasting temperatures in coastal shallow lakes: Implications for effects of climate change. Limnol. Oceanogr. 2020, 55, 1697–1711. [Google Scholar] [CrossRef] [Green Version]
  8. Stamou, G.; Katsiapi, M.; Moustaka-Gouni, M.; Michaloudi, E. Grazing potential—A functional plankton food web metric for ecological water quality assessment in Mediterranean lakes. Water 2019, 11, 1274. [Google Scholar] [CrossRef] [Green Version]
  9. Zhan, H.; Duan, Z.; Wang, Z.; Zhong, M.; Tian, W.; Wang, H.; Huang, H. Freshwater lake ecosystem health assessment and its response to pollution stresses based on planktonic index of biotic integrity. Environ. Sci. Pollut. Res. 2019, 26, 35240–35252. [Google Scholar] [CrossRef]
  10. Yao, N.; Feng, B.; Zhang, M.; He, L.; Zhang, H.; Liu, Z. Impact of industrial production, dam construction, and agriculture on the Z-IBI in river ecosystems: A case study of the Wanan River Basin in China. Water 2021, 12, 123. [Google Scholar] [CrossRef]
  11. Stamou, G.; Mazaris, A.D.; Moustaka-Gouni, M.; Spoljar, M.; Ternjej, I.; Drazina, T.; Dorak, Z.; Michaloudi, E. Introducing a zooplanktonic index for assessing water quality of natural lakes in the Mediterranean region. Ecol. Inform. 2022, 69, 101616. [Google Scholar] [CrossRef]
  12. Lombardo, A.; Franco, A.; Pivato, A.; Barauss, A. Food web modeling of a river ecosystem for risk assessment of down-the-drain chemicals: A case study with AQUATOX. Sci. Total Environ. 2015, 508, 214–227. [Google Scholar] [CrossRef]
  13. He, H.; Jeppesen, E.; Bruhn, D.; Yde, M.; Hansen, J.K.; Spanggaard, L.; Madsen, N.; Liu, W.; Søndergaard, M.; Lauridsen, T.L. Decadal changes in zooplankton biomass, composition, and body mass in four shallow brackish lakes in Denmark subjected to varying degrees of eutrophication. Inland Waters 2020, 10, 186–196. [Google Scholar] [CrossRef]
  14. Taipale, S.J.; Kuoppamäki, K.; Strandberg, U.; Peltomaa, E.; Vuorio, K. Lake restoration influences nutritional quality of algae and consequently Daphnia biomass. Hydrobiologia 2020, 847, 4539–4557. [Google Scholar] [CrossRef]
  15. Irigoien, X.; Huisman, J.; Harris, R.P. Global biodiversity patterns of marine phytoplankton and zooplankton. Nature 2004, 429, 863–867. [Google Scholar] [CrossRef] [PubMed]
  16. Oh, H.J.; Chang, K.H.; Jeong, H.G.; Go, S.M.; La, G.H.; Kim, H.W. Quantitative zooplankton collection methods for various freshwater ecosystems and their applications. KJEE 2019, 52, 231–244, [Korean literature]. [Google Scholar] [CrossRef]
  17. Dumont, H.J.; Velde, I.V.D.; Dumont, S. The dry weight estimate of biomass in a selection of cladocera, Copepoda and Rotifera from the plankton, periphyton and benthos of continental waters. Oecologia 1975, 19, 75–97. [Google Scholar] [CrossRef]
  18. Park, R.A.; Clough, J.S.; Wellman, M.C. AQUATOX: Modeling environmental fate and ecological effects in aquatic ecosystems. Ecol. Model. 2008, 213, 1–15. [Google Scholar] [CrossRef]
  19. Cremona, F.; Blank, K.; Haberman, J. Effects of environmental stressors and their interactions on zooplankton biomass and abundance in a large eutrophic lake. Hydrobiologia 2021, 848, 4401–4418. [Google Scholar] [CrossRef]
  20. Long, S.X.; Hamilton, P.B.; Yang, Y.; Wang, S.; Chen, C.; Tao, R. Differential bioaccumulation of mercury by zooplankton taxa in a mercury-contaminated reservoir Guizhou China. Environ. Pollut. 2018, 239, 147–160. [Google Scholar] [CrossRef]
  21. Scheffer, M.; Rinaldi, S.; Kuznetsov, Y.A.; Nes, E.H.V. Seasonal dynamics of Daphnia and algae explained as a periodically forced predator-prey system. Oikos 1997, 80, 519–532. [Google Scholar] [CrossRef]
  22. Lampert, W.; Fleckner, W.; Hakumat, R.; Taylor, B.E. Phytoplankton control by grazing zooplankton: A study on the spring clear-water phase. Limnol. Oceanogr. 1986, 31, 478–490. [Google Scholar] [CrossRef]
  23. Wilson, S.M.; Corsi, M.P.; Brandt, D.H.; Stark, E.J. The response of Daphnia to nutrient additions and kokanee abundance in Dworshak Reservoir, Idaho. Can. J. Fish. Aquat. Sci. 2021, 78, 1677–1688. [Google Scholar] [CrossRef]
  24. Kawabata, K.; Urabe, J. Length-weight relationships of eight freshwater planktonic crustacean species in Japan. Freshw. Biol. 1998, 39, 199–205. [Google Scholar] [CrossRef]
  25. Færøvig, P.J.; Andersen, T.; Hessen, D.O. Image analysis of Daphnia populations: Non-destructive determination of demography and biomass in cultures. Freshw. Biol. 2002, 47, 1956–1962. [Google Scholar] [CrossRef]
  26. Pearre, S., Jr. The copepod width–weight relation and its utility in food chain research. Can. J. Zool. 1980, 58, 1884–1891. [Google Scholar] [CrossRef]
  27. Sperfeld, E.; Nilssen, J.P.; Rinehart, S.; Schwenk, K.; Hessen, D.O. Ecology of predator-induced morphological defense traits in Daphnia longispina (Cladocera, Arthropoda). Oecologia 2020, 192, 687–698. [Google Scholar] [CrossRef] [Green Version]
  28. Burgess, S.; Jackson, E.W.; Schwarzman, L.; Gezon, N.; Lehman, J.T. Improved estimates of calanoid copepod biomass in the St. Lawrence Great Lakes. J. Great Lakes Res. 2015, 41, 484–491. [Google Scholar] [CrossRef]
  29. Maia-Barbosa, P.M.; Bozelli, R.L. Length-weight relationships for five cladoceran species in an Amazonian lake. Braz. Arch. Biol. Technol. 2005, 48, 303–308. [Google Scholar] [CrossRef]
  30. Vakkilainen, K.; Kairesalo, T.; Hietala, J.; Balayla, D.M.; Bécares, E.; Van de Bund, W.J.; Van Donk, E.; Fernández-Aláez, M.; Gyllström, M.; Hansson, L.-A.; et al. Response of zooplankton to nutrient enrichment and fish in shallow lakes: A pan-European mesocosm experiment. Freshw. Biol. 2004, 49, 1619–1632. [Google Scholar] [CrossRef] [Green Version]
  31. Alcaraz, M.; Saiz, E.; Calbet, A.; Trepat, I.; Broglio, E. Estimating zooplankton biomass through image analysis. Mar. Biol. 2003, 143, 307–315. [Google Scholar] [CrossRef]
  32. OECD. Daphnia magna reproduction test. In OECD Guidelines for Testing of Chemicals, 211; OECD: Paris, France, 1998. [Google Scholar] [CrossRef] [Green Version]
  33. McCauley, E. The estimation of the abundance and biomass of zooplankton in samples. In A Manual on Methods for the Assessment of Secondary Productivity in Fresh Waters, 2nd ed.; Downing, J.A., Rigler, F.H., Eds.; Blackwell: Oxford, UK, 1984; pp. 228–265. [Google Scholar]
  34. Lawrence, S.G.; Malley, D.F.; Findlay, W.J.; MacIver, M.A.; Delbaere, I.L. Method for estimating dry weight of freshwater planktonic crustaceans from measures of length and shape. Can. J. Fish. Aquat. Sci. 1987, 44, 264–274. [Google Scholar] [CrossRef]
  35. USEPA. National Lakes Assessment 2017. In Laboratory Operations Manual; EPA-841-B11-004; US Environmental Protection Agency: Washington, DC, USA, 2017. Available online: www.epa.gov/national-aquatic-resource-surveys/national-lakes-assessment-2017-laboratory-operations-manual (accessed on 17 May 2022).
  36. GLNPO. LG403, Revision 07; Standard Operating Procedure for Zooplankton Analysis.; U.S. EPA Great Lakes National Program Office: Chicago, IL, USA, 2016. Available online: www.epa.gov/sites/default/files/2017-01/documents/sop-for-zooplankton-analysis-201607-22pp.pdf (accessed on 17 May 2022).
  37. R Core Team. R: A Language and Environment for Statistical Computing; R Foundation for Statistical Computing: Vienna, Austria, 2018; Available online: www.R-project.org (accessed on 17 May 2022).
  38. Wickham, H. ggplot2: Elegant Graphics for Data Analysis; Springer: New York, NY, USA, 2016. [Google Scholar]
  39. Rudis, B. Hrbrthemes: Additional Themes, Theme Components and Utilities for ‘ggplot2’. R Package Version 0.8.0. Available online: CRAN.R-project.org/package=hrbrthemes (accessed on 17 May 2022).
  40. Dodson, S.I. Cyclomorphosis in Daphnia galeata mendotae Birge and D. retrocurva Forbes as a predator-induced response. Freshw. Biol. 1988, 19, 109–114. [Google Scholar] [CrossRef]
  41. Spaak, P.; Boersma, M. Tail spine length in the Daphnia galeata complex: Costs and benefits of induction by fish. Aquat. Ecol. 1997, 31, 89–98. [Google Scholar] [CrossRef]
  42. Smakulska, J.; Górniak, A. Morphological variation in Daphnia cucullata Sars with progressive eutrophication of a polymictic lowland reservoir. Hydrobiologia 2004, 526, 119–127. [Google Scholar] [CrossRef]
  43. Chang, K.H.; Hanazato, T. Seasonal and reciprocal succession and cyclomorphosis of two Bosmina species (Cladocera, Crustacea) co-existing in a lake: Their relationship with invertebrate predators. J. Plankton Res. 2003, 25, 141–150. [Google Scholar] [CrossRef] [Green Version]
Figure 1. Measurements of Daphnia magna individuals’ body specifications. Length: from the head to the end of the body, excluding the apical spines; width: carapace width; area: lateral area, excluding the area of the apical spines.
Sustainability 14 09216 g001
Figure 2. Comparison of the average (n = 90) Daphnia magna biomass estimates and biomass measurements. Estimates were calculated using Equations (1)–(3) of Dumont et al. [17] Equation (1) is based on D. magna from a lake, Equation (2) is based on D. magna from a river and Equation (3) is based on pooled Daphnia spp. Biomass measurements are shown as ⊕ (mean values). p values of < 0.025 were considered statistically significant, and * shows significant differences between biomass values.
Sustainability 14 09216 g002
Figure 3. Regression analysis and fitting results between the body specifications of Daphnia magna individuals (length, (AC); width, (DF); area, (GI)) and their biomass measurements. *, regression equation with the highest multiple R2 value among the linear, logarithmic and exponential functions according to body specification factor.
Sustainability 14 09216 g003
Figure 4. Fitted versus residual value plot of each regression equation derived from the body specifications of Daphnia magna individuals (length, (AC); width, (DF); area, (GI)) and their biomass measurements.
Sustainability 14 09216 g004
Table 1. Length–weight regression equations used to estimate the biomass of Daphnia magna (equations from Dumont et al. [17]).
EquationsCharacteristicsUnit
(1) W = 1.89 × 10 6 × L 2.25 Derived using individuals
from Donk Lake
W: μg
L: μm
(2) W = 4.88 × 10 5 × L 1.80 Derived using individuals
from Sambre River
W: μg
L: μm
(3) Ln W = 1.603 + 2.84 × Ln L Derived using pooled Daphnia speciesW: μg
L: mm
Table 2. Mean ± standard deviation (n = 90) of biomass estimates and measurements taken from Daphnia magna individuals. Biomass estimates were calculated using length–weight regression equations, i.e., Equations (1)–(3) from Dumont et al. [17].
Biomass
(dry weight, mg)
Equation (1)Equation (2)Equation (3)1Measurements
D. magna
in Donk Lake
D. magna
in Sambre River
Pooled
Daphnia spp.
Mean
± Standard deviation
0.048 ± 0.0260.040 ± 0.0180.035 ± 0.0220.051 ± 0.030
1 Equation (3) is the length–weight regression equation proposed by the EPA manual [36] for calculating D. magna biomass.
Table 3. Mean ± standard deviation (with minimum–maximum range) of the body specifications of Daphnia magna individuals (n = 90). Length, width and area were measured in each individual.
Body SpecificationsLength (mm)Width (mm)Area (mm2)
Mean ± standard deviation
(Minimum–Maximum)
1.866 ± 0.519
(0.796–2.791)
1.176 ± 0.372
(0.469–1.948)
1.872 ± 0.962
(0.314–4.073)
Publisher’s Note: MDPI stays neutral with regard to jurisdictional claims in published maps and institutional affiliations.

