
Evaluation of the Suitability of Smart Health Products for Aging Based on the IIVAHP-CRITIC Model: A Case Study of Smart Health Kiosk


Abstract
:1. Introduction
2. Materials and Methods
2.1. SHK Design Proposals
2.2. Constructing an Aging-Suitability Evaluation System
2.2.1. Indicator Description
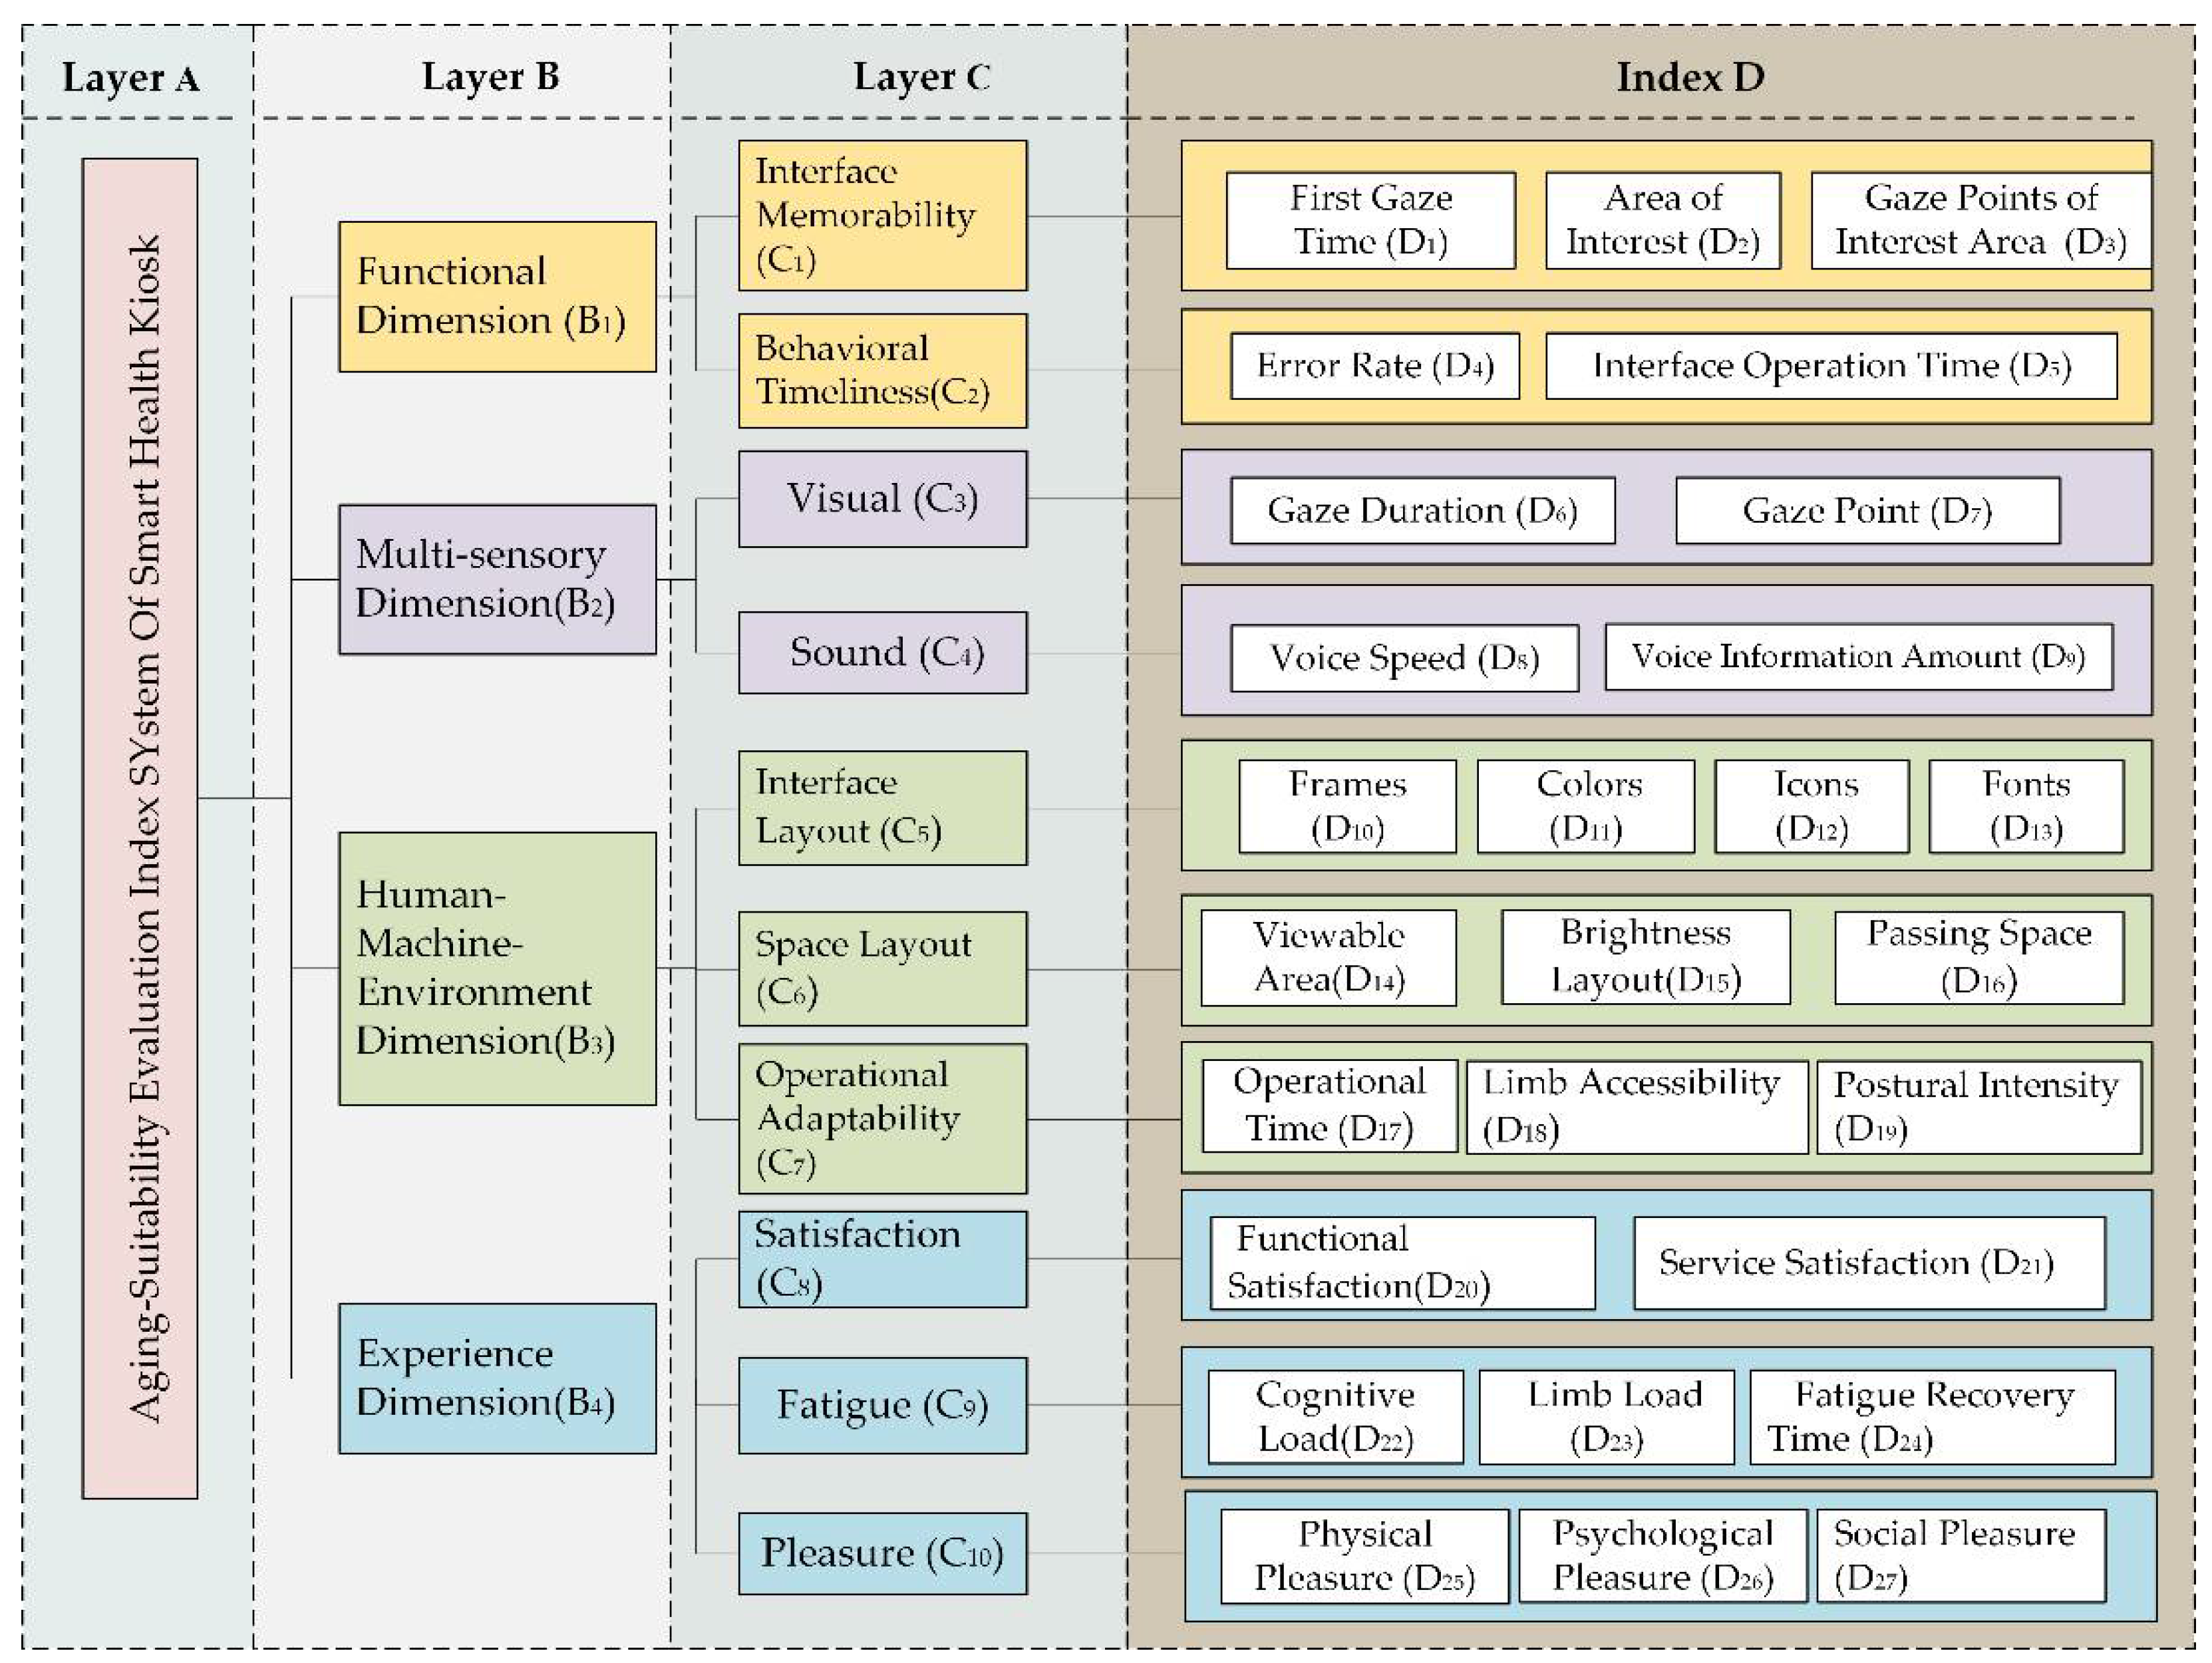
- Functional Dimension.The functional dimension reflects the overall functionality of the product and contains two sub-criteria layers: Interface Memorability (C1) and Behavioral Timeliness (C2). C1 indicates that the user does not use the product for a period of time but still remembers the product. It contains three D-level indicators: First Gaze Time (D1), Area of Interest (D2), and Gaze Points of Interest Area (D3). These three indicators reflect the objective responses of elderly users to different digital interface solutions in the health kiosk, and the data are derived from Eye-Movement-EEG (EME) experiments, as shown in Table 2. C2 reflects the efficiency of users to complete the testing task using the SHK, and it contains two D-level indicators: Error Rate (D4) and Interface Operation Time (D5). D4 and D5 reflect the error situation and operation efficiency when elderly users operate the interface.
- Multi-sensory Dimension.This dimension reflects the multi-channel information transfer capability of the product’s interaction interface and contains two sub-criteria layers: Visual (C3) and Sound (C4). In smart health products, an interface with the ability to integrate visuals and sound to communicate information can make older users’ experience more three-dimensional and memorable. C3 contains three D-level indicators: Gaze Duration (D6) and Gaze Point (D7). The D6 and D7 data are also derived from the EME experiments, as illustrated in Table 2. C4 contains two D-level indicators: Voice Speed (D8) and Voice Information Amount (D9). D8 refers to the operational response of the elderly to the voice prompt information in the physical examination task, and the reaction time is measured by the experimenter. D9 refers to what the voice command contains.
- Human–Machine–Environment Dimension.This dimension integrates the physiological and psychological factors of the elderly, the human–machine rationality of the product, and the environmental suitability factors to evaluate the product [33]. It contains three sub-criteria layers: Interface Layout (C5), Space Layout (C6), and Operational Adaptability (C7). C5 reflects the level of user awareness of digital interface elements and contains four D-level indicators: Frames (D10), Colors (D11), Icons (D12), and Fonts (D13). The index data are obtained by means of the EME experiments and a Seven-Level Likert Scale on the Visual Elements of the Digital Interface, as shown in Table 2. C6 is the layout setting within the health kiosk environment and contains three D-level indicators: Viewable Area (D14), Brightness Layout (D15), and Passing Space (D16). D14 refers to whether the position of the product’s digital screen is in line with the body size of the elderly. D15 refers to whether the lighting values in the SHK environment are suitable for the vision of the elderly. D16 refers to whether the width and height of the entrances and exits of the health kiosk meet the accessibility standards. C7 reflects whether the operational task imposes a limb load on the elderly, and it contains three D-level indicators: Operational Time (D17), Limb Accessibility (D18), and Postural Intensity (D19). D17, D18, and D19 can be measured with the Virtual Simulation Test (VST), as shown in Table 2. A virtual simulation digital model human is constructed based on the physical data of the elderly. The force values of the limbs of the model human are measured while performing the physical examination tasks and whether there is enough time to relieve fatigue.
- Experience Dimension.This dimension of the evaluation feedback of smart health products concerns the perspective of seniors’ user experience, and it contains three sub-criteria layers: Satisfaction (C8), Fatigue (C9), and Pleasure (C10). C8 reflects seniors’ subjective experience of the product, including Functional Satisfaction (D20) and Service Satisfaction (D21). The index data are obtained through a seven-level Likert scale method. C9 contains three D-level indicators: Cognitive Load(D22), Limb Load (D23), and Fatigue Recovery Time (D24). The data for D22 were measured by the EME experiments, which measured brain fatigue in older adults during the detection task. VST was used to analyze the digital model of the human lower back force values when performing inspection tasks, whether there is enough time to relieve fatigue and obtain the index data of D23 and D24. C10 reflects the subjective evaluation of the health kiosk by the elderly and is assessed using the following three D-level indicators: Physical Pleasure (D25), Psychological Pleasure (D26), and Social Pleasure (D27). The indicator data are obtained using a Seven-Level Likert Scale, as shown in Table 2.
2.2.2. Description of Experimental Data Sources
2.2.3. Raw Data for All Indicators
3. Evaluation Process Based on IIVAHP and CRITIC Method
3.1. Subjective Weights Based on IIVAHP Method
3.2. CRITIC Method for Determining Objective Weights’ Figures
3.3. Combined Weights
4. Case Application
5. Results and Discussion
5.1. Results
- As seen in Table 8, based on the comprehensive IIVAHP-CRITIC evaluation of the design scheme of SHK for aging, the index weight scores of the four schemes are [11.6723, 11.9472, 30.1197, 26.4608], respectively. Scheme 3 has the highest score, followed by Scheme 4. Scheme 1 has the lowest scores. Scheme 1 and 2 have similar scores. If we adopt the traditional evaluation method, it is difficult to distinguish the pros and cons of the scheme. In the comprehensive evaluation of impact indicators, the Passing Space, Viewable Area, Limb Accessibility, Limb Load, and Postural Intensity of the SHK have a greater impact on the decision-making of age-suitability design plan and are the key attributes of the evaluation plan.
- Combined with the indicator weights in Table 6 and Table 8, the four dimensions of the impact assessment scheme are ranked as follows: Human–Machine–Environment Dimension > Experience Dimension > Functional Dimension > Multi-Sensory Dimension. For the Human–Machine–Environment Dimension, the Space Layout has the greatest impact on it, which is related to whether the passing space, the brightness of the environment, and the visual field of the digital interface can meet the physiological needs of the elderly. The second is work adaptability. The reachable area and postural strength of the limbs are related to the ergonomic comfort of the equipment. Meanwhile, the physical load was found to have the greatest impact on the Experience dimension. When an elderly person feels very tired, their user experience will be worse. Among these four dimensions, the Multi-Sensory Dimension has the lowest weight, indicating that with the maturity of technology, products are making continuous progress in the interaction of visual and voice information.
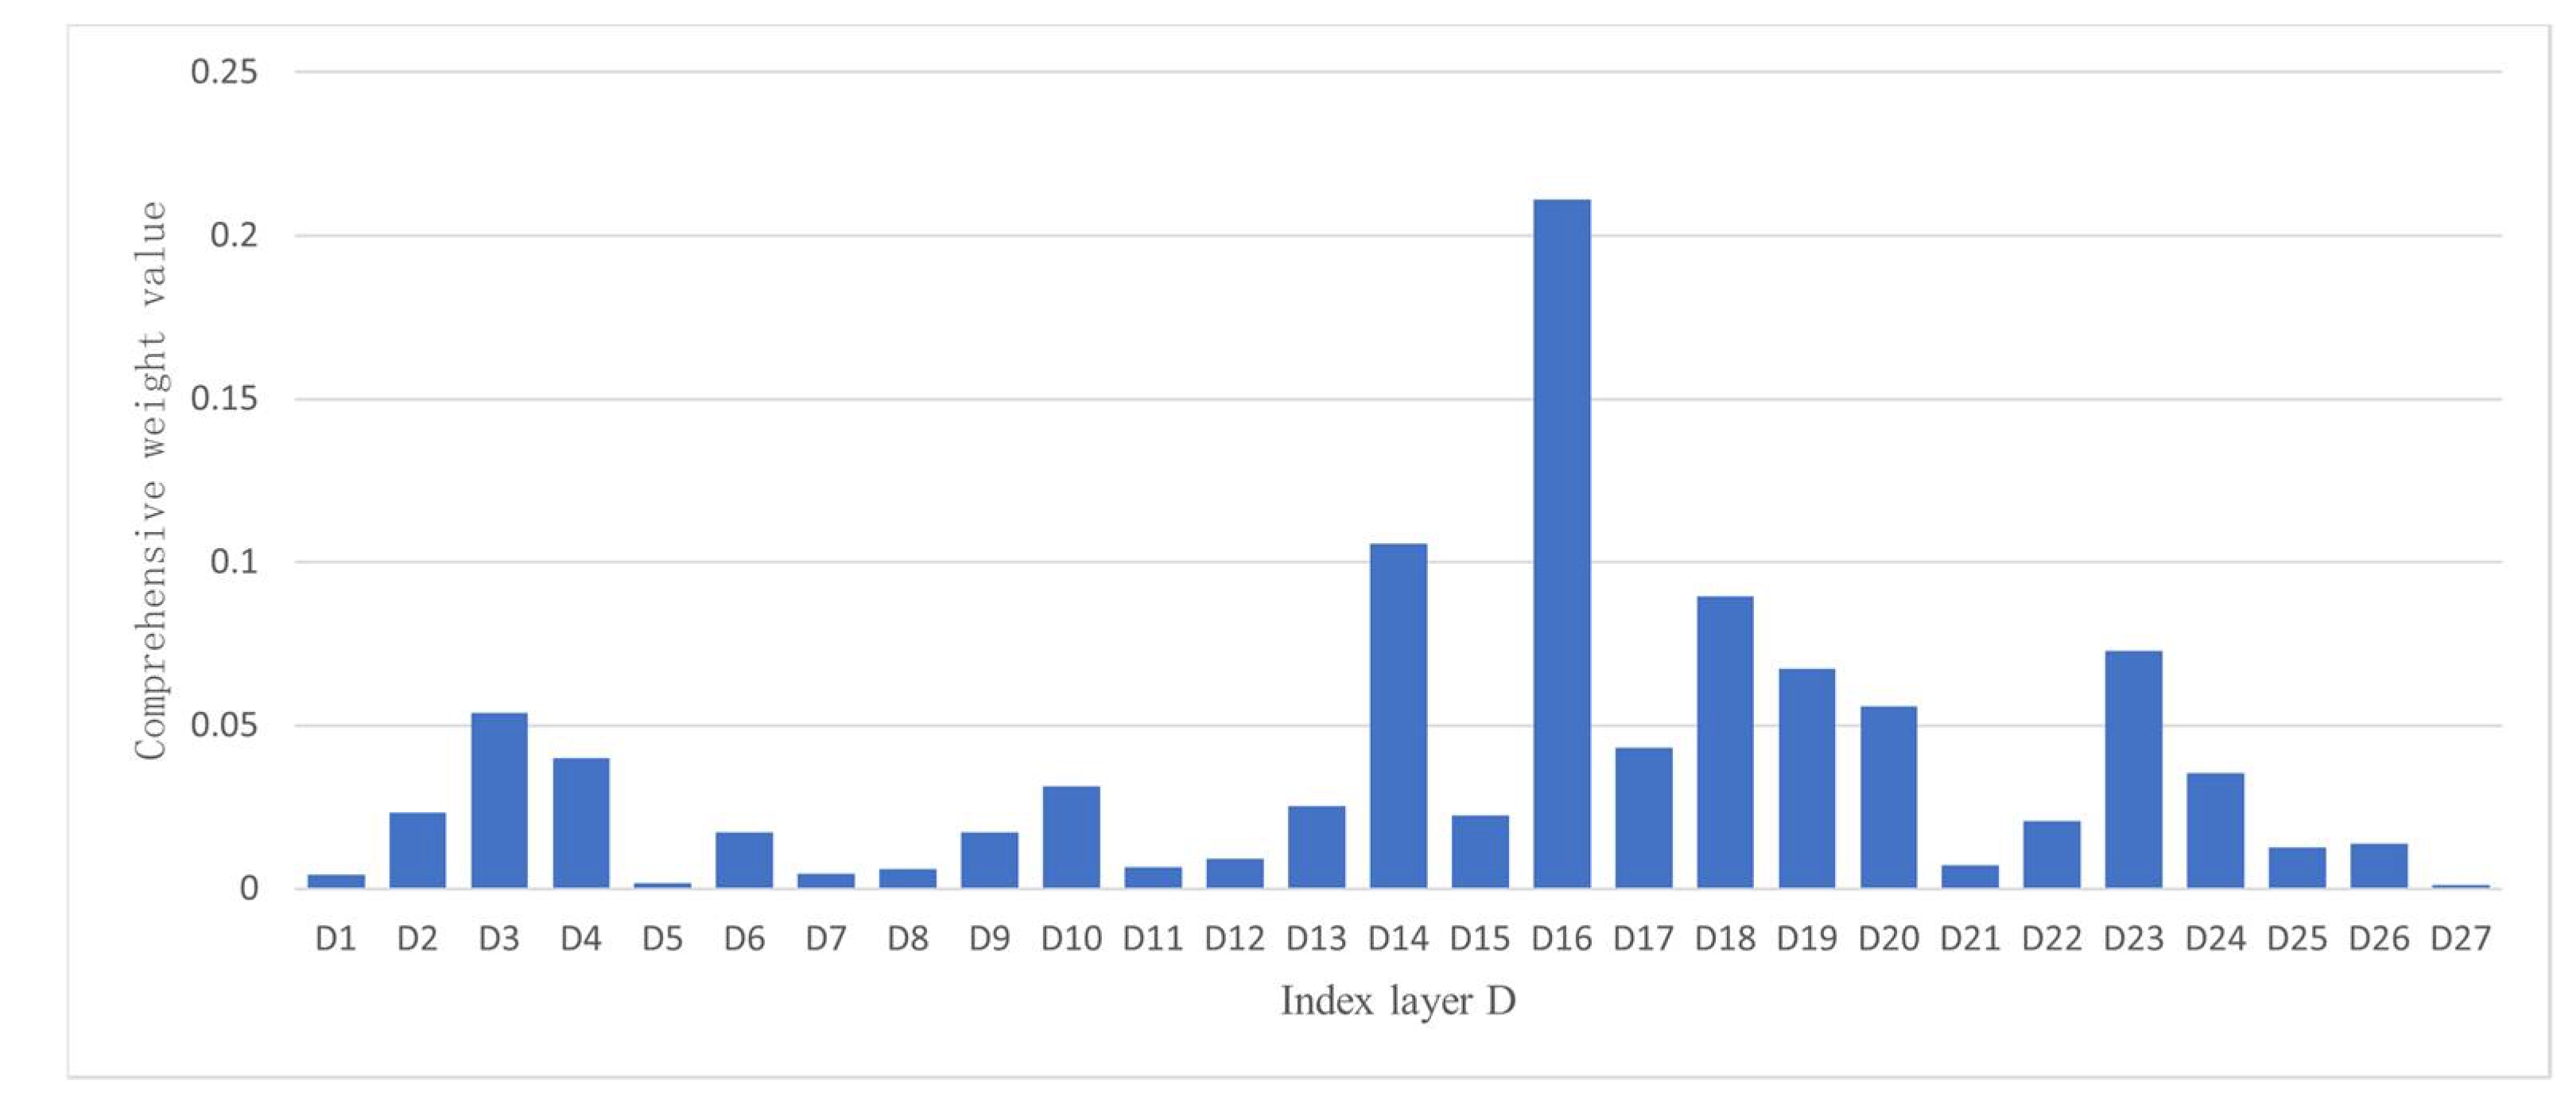
- Based on the histogram shown in Figure 2, we can compare the weights of the indicator layers. The top five groups of indicators representing the most important influencing factors are Passing Space, Viewable Area, Limb Accessibility, Limb Load, and Postural Intensity. Four of these indicators are related to the Human–Machine–Environment Dimension, and the Limb Load belongs to the Experience Dimension. The last place in the index weight ranking is Social Pleasure, indicating that the need to pay attention to the social needs of the elderly did not receive sufficient attention in the design of the SHK.
- As can be seen from the scheme scores in Table 8, Scheme 3 has the best overall score in the evaluation of functions, Multi-Sensory Information interaction, and Human–Machine-Environment indicators, and Scheme 4 has the lowest scores in the Function and Multi-sensory Information dimensions. Scheme 1 has the lowest score in the Human–Machine–Environment indicators. The interface memorability of Scheme 3 obtained a high score, indicating that the design of the digital interface conforms to the aesthetic needs and cognitive habits of the elderly, but further optimization is needed in terms of fatigue and sound.
5.2. Discussion
6. Conclusions
- This paper establishes a product evaluation index system with four dimensions and three levels, and to a certain extent, the experience span of expert scoring is considered. In addition, the combination of experiments, questionnaires, and other methods to obtain subjective and objective data results in complementary effects.
- A comprehensive evaluation method of IIVAHP-CRITIC is proposed that considers the uncertainty of decision-making factors and the difficulty of quantifying various subjective and objective weights in the evaluation process of this type of product design scheme. This method comprehensively considers the influence of subjective and objective weights on the design scheme and avoids the limitations of a single point of view. In addition, it avoids the defect of ignoring the actual relationship between indicators. It effectively uses the data information of each indicator. Overall, it makes evaluation results more objective and reasonable.
- It avoids traditional design methods’ complex and repetitive modeling process and provides a reference for the appropriate design of intelligent health products. It also helps improve the product’s ergonomic comfort and the satisfaction of older users.
Author Contributions
Funding
Institutional Review Board Statement
Informed Consent Statement
Data Availability Statement
Conflicts of Interest
References
- Rudnicka, E.; Napierała, P.; Podfigurna, A.; Męczekalski, B.; Smolarczyk, R.; Grymowicz, M. The World Health Organization (WHO) Approach to Healthy Geing. Maturitas 2020, 139, 6–11. [Google Scholar] [CrossRef] [PubMed]
- Oderanti, F.O.; Li, F.; Cubric, M.; Shi, X. Business Models for Sustainable Commercialisation of Digital Healthcare (eHealth) Innovations for an Increasingly Ageing Population. Technol. Forecast. Soc. Chang. 2021, 171, 120969. [Google Scholar] [CrossRef]
- Dvoryashina, M.; Tarasenko, E. Inclusion, Diversity or Disparity in Telehealth During the Covid-19 Pandemic. IFAC-Pap. OnLine 2021, 54, 323–326. [Google Scholar] [CrossRef]
- Doraiswamy, S.; Jithesh, A.; Mamtani, R.; Abraham, A.; Cheema, S. Telehealth Use in Geriatrics Care during the COVID-19 Pandemic—A Scoping Review and Evidence Synthesis. Int. J. Environ. Res. Public Health 2021, 18, 1755. [Google Scholar] [CrossRef]
- Gitlin, L.N. Conducting Research on Home Environments: Lessons Learned and New Directions. Gerontologist 2003, 43, 628–637. [Google Scholar] [CrossRef] [PubMed] [Green Version]
- Jones, R.B.; Navin, L.M.; Murray, K.J. Use of a Community-Based Touch-Screen Public-Access Health Information System. Health Bull. 1993, 51, 34–42. [Google Scholar]
- Nicholas, D.; Huntington, P.; Williams, P. An Evaluation of the Use of NHS Touch-Screen Health Kiosks: A National Study. Aslib Proc. 2002, 54, 372–384. [Google Scholar] [CrossRef]
- Boudioni, M. Availability and Use of Information Touch-Screen Kiosks (to Facilitate Social Inclusion). Aslib Proc. 2003, 55, 320–333. [Google Scholar] [CrossRef]
- Nicholas, D.; Huntington, P.; Williams, P. The Characteristics of Users and Non-Users of a Kiosk Information System. Aslib Proc. 2004, 56, 48–61. [Google Scholar] [CrossRef]
- Jones, R. The Role of Health Kiosks in 2009: Literature and Informant Review. Int. J. Environ. Res. Public Health 2009, 6, 1818–1855. [Google Scholar] [CrossRef]
- de Maio Nascimento, M.; Gouveia, É.R.; Marques, A.; Gouveia, B.R.; Marconcin, P.; Ihle, A. Gait Speed as a Biomarker of Cognitive Vulnerability: A Population-Based Study with Cognitively Normal Older Adults. Sustainability 2022, 14, 7348. [Google Scholar] [CrossRef]
- Sanghavi, D.M. Taking Well-Child Care Into the 21st Century: A Novel, Effective Method for Improving Parent Knowledge Using Computerized Tutorials. Arch. Pediatr. Adolesc. Med. 2005, 159, 482–485. [Google Scholar] [CrossRef] [Green Version]
- Şuteu Băncilă, A.M.A.; Buzatu, C. Digital Human Modeling in the Development of Assistive Technologies for Elderly Users. Appl. Mech. Mater. 2015, 809–810, 835–840. [Google Scholar] [CrossRef]
- Ramanathan, R. Multicriteria Analysis of Energy. In Encyclopedia of Energy; Cleveland, C.J., Ed.; Elsevier: New York, NY, USA, 2004; pp. 77–88. [Google Scholar]
- Abdi, H.; Williams, L.J. Principal Component Analysis. Wiley Interdiscip. Rev. Comput. Stat. 2010, 2, 433–459. [Google Scholar] [CrossRef]
- Tian, G.; Zhang, H.; Feng, Y.; Wang, D.; Peng, Y.; Jia, H. Green Decoration Materials Selection under Interior Environment Characteristics: A Grey-Correlation Based Hybrid MCDM Method. Renew. Sustain. Energy Rev. 2018, 81, 682–692. [Google Scholar] [CrossRef]
- Wan, S.-P.; Qin, Y.-L.; Dong, J.-Y. A Hesitant Fuzzy Mathematical Programming Method for Hybrid Multi-Criteria Group Decision Making with Hesitant Fuzzy Truth Degrees. Knowl.-Based Syst. 2017, 138, 232–248. [Google Scholar] [CrossRef]
- Bertolini, M.; Esposito, G.; Romagnoli, G. A TOPSIS-Based Approach for the Best Match Between Manufacturing Technologies and Product Specifications. Expert Syst. Appl. 2020, 159, 700–714. [Google Scholar] [CrossRef]
- Xi, X.; Qin, Q. Product Quality Evaluation System Based on AHP Fuzzy Comprehensive Evaluation. J. Ind. Eng. Manag. 2013, 6, 356–366. [Google Scholar] [CrossRef] [Green Version]
- Cheng, Y.; Shou-Qian, S.U.N.; Zheng, L.I.U.; Chun-Lei, C. Decision-Making Model of Product Design Based on Principal Component Analysis. China Mech. Eng. 2011, 22, 2218. [Google Scholar]
- Huseyinov, I.; Tabak, F.S. The Evaluation of Computer Algebra Systems Using Fuzzy Multi-Criteria Decision-Making Models: Fuzzy AHP and Fuzzy TOPSIS. IJSI 2020, 8, 1–16. [Google Scholar] [CrossRef]
- Vinodh, S.; Kamala, V.; Jayakrishna, K. Integration of ECQFD, TRIZ, and AHP for Innovative and Sustainable Product Development. Appl. Math. Model. 2014, 38, 2758–2770. [Google Scholar] [CrossRef]
- Wei, H.; Wang, R.; Guo, Z.; Yang, Z.; Wang, J. Application of Grey Correlation Method in Electronic Information Equipment Evaluation. In Proceedings of the 2021 4th World Conference on Mechanical Engineering and Intelligent Manufacturing (WCMEIM), Shanghai, China, 12–14 November 2021; IEEE: Piscataway, NJ, USA, 2021; pp. 191–194. [Google Scholar]
- Zhou, J.; Xiahou, T.; Liu, Y. Multi-objective Optimization-Based TOPSIS Method for Sustainable Product Design under Epistemic Uncertainty. Appl. Soft Comput. 2021, 98, 106850. [Google Scholar] [CrossRef]
- Odu, G.O. Weighting Methods for Multi-Criteria Decision-Making Technique. J. Appl. Sci. Environ. Manag. 2019, 23, 1449–1457. [Google Scholar] [CrossRef] [Green Version]
- Alinezhad, A.; Khalili, J. CRITIC Method. In New Methods and Applications in Multiple Attribute Decision Making (MADM); Alinezhad, A., Khalili, J., Eds.; Springer International Publishing: Berlin/Heidelberg, Germany, 2019; pp. 199–203. [Google Scholar]
- Diakoulaki, D.; Mavrotas, G.; Papayannakis, L. Determining objective weights in multiple criteria problems: The critic method. Comput. Oper. Res. 1995, 22, 763–770. [Google Scholar] [CrossRef]
- Wang, D.; Zhao, J. Design Optimization of Mechanical Properties of Ceramic Tool Material During Turning of Ultra-High-Strength Steel 300M with AHP and CRITIC Method. Int. J. Adv. Manuf. Technol. 2016, 84, 2381–2390. [Google Scholar] [CrossRef]
- Wang, F.; Zhou, X. Research on Cognitive APP Evaluation of Visually Impaired Users. In Proceedings of the 2020 International Conference on Computer Network, Electronic and Automation (ICCNEA), Xi’an, China, 25–27 September 2020; pp. 133–137. [Google Scholar]
- Zhang, Y.; Zhang, H.; Zhong, Z.; Gao, X.; Ni, Y. Objectively Evaluating Environmental Comprehensive Quality by Improved AHP Method. In Proceedings of the 2008 2nd International Conference on Bioinformatics and Biomedical Engineering, Shanghai, China, 16–18 May 2008; pp. 4645–4649. [Google Scholar]
- Godemann, J. Knowledge Integration: A Key Challenge for Transdisciplinary Cooperation. Environ. Educ. Res. 2008, 14, 625–641. [Google Scholar] [CrossRef]
- Fisk, D.; Charness, N.; Czaja, S.J.; Rogers, W.A.; Sharit, J. Designing for Older Adults, 1st ed.; CRC Press: London, UK, 2014; pp. 111–125. [Google Scholar]
- Wu, X.; Lv, X.; Zhou, C. Research on Evaluation Method of Equipment Human-Machine Environment Adaptability Based on Satisfaction Calculation. In Proceedings of the 2019 2nd International Conference on Safety Produce Informatization (IICSPI), Chongqing, China, 28–30 November 2019; pp. 570–573. [Google Scholar]
- Saaty, R.W. The Analytic Hierarchy Process—What It Is and How It Is Used. Math. Model. 1987, 9, 161–176. [Google Scholar] [CrossRef] [Green Version]
- Bai, Z.; Liu, Q.; Liu, Y. Risk Assessment of Water Inrush from Coal Seam Roof with an AHP–CRITIC Algorithm in Liuzhuang Coal Mine, China. Arab. J. Geosci. 2022, 15, 364. [Google Scholar] [CrossRef]


| Items | Design Scheme | |||
|---|---|---|---|---|
| Number | 1 | 2 | 3 | 4 |
| Scheme |  |  |  |  |
| Items | Experiment | Device/Method | Process | Indicator |
|---|---|---|---|---|
| 1 | Eye-Movement-EEG experiments (EME) | Device: Biofeedback instrument produced by Weiss Company, Tobii eye tracker, Eprime1.1 software, Dell S 2340MC, 27″ LCD monitor. Method: It can record the data changes of the user’s eye movement and EEG simultaneously, obtain the physiological signals generated when the user interacts with the product, and judge the user’s psychological response and preference to the design plans. | A total of 36 elderly people were invited as participants, including 18 males and 18 females aged 55 to 70, who had browsed the web at least once in the past three months. The health of these older adults had been assessed. A total of four sets of digital interface design schemes for SHK were tested. Each scheme had a total of five pages, and each page was randomly presented twice, so the participants browsed a total of 40 pages. A total of four sets of digital interface design schemes for SHK were tested. Each scheme had five pages, and each page was randomly presented twice, so the participants browsed 40 pages, and the experiment time was 480 s. | D1, D2, D3, D6, D7, D22 |
| 2 | Virtual Simulation Test (VST) | Software: Simens Jack 7.1 (JACK) Method: Import a 3D model into JACK to build a simulation environment. Introduce a 3D human body model with biomechanical properties, assign tasks to the digital human, and obtain valuable information through the behavioral simulation of the digital human. | The fifth percentile, 50th percentile, and 95th percentile digital models of the elderly were established in JACK. The task was tested separately for older adults with different percentile body sizes. Data such as the visual field of the elderly facing the operating screen, the passage space of the SHK, the time to measure blood pressure, the reach of the arm, the limb load of the sitting position, and the fatigue recovery time of the entire task were tested. | D14, D15, D16, D18, D19, D23, D24 |
| 3 | Behavioral Efficiency Test (BET) | Device: Dell S 2340MC, 27″ LCD monitor. Method: Measure the time it takes for the participants to complete the task and the error rate. | The participants sat in a comfortable position in a soundproof room with soft light and looked at the computer screen with their eyes about 1 m away from the screen. The participants were presented with four sets of design plans and asked to quickly find the “Self-Measurement” button to enter the testing program after seeing the interface. They need to respond within 10 s. If they find the “Self-Measurement” button, press the “A” button, and if they do not find it, press the “L” button. | D4, D5 |
| 4 | Voice Test | Device: Dell S 2340MC, 27″ LCD monitor. Method: Test participants’ reaction time after voice guidance. | After listening to the voice, the participants could quickly find the “Self-Measurement” button on the interface and pressed the “A” button and recorded the time they took from staring at the interface to completing the action. After the test, the participants were asked to rate the informativeness of each utterance. | D8, D9 |
| 5 | 7-Level Liker Scale | Method: Participants rated their agreement with the test. | The following scales are used: questionnaire for the evaluation of visual elements of digital interfaces; user experience questionnaire for SHK interface under different dimensions. | D10, D11, D12, D13, D20, D21, D25, D26, D27 |
| Index D | Unit | Scheme1 | Scheme2 | Scheme3 | Scheme4 |
|---|---|---|---|---|---|
| First Gaze Time (D1) | ms | 7.2 | 6.3 | 7.4 | 7 |
| Time of Interest Area (D2) | % | 26.17 | 35.56 | 37.3 | 23.99 |
| Gaze Points of Interest Area (D3) | % | 26.15 | 35.58 | 37.5 | 24.31 |
| Error Rate (D4) | % | 8.6 | 5 | 6.2 | 11 |
| Interface Operation Time (D5) | S | 9.74 | 9.08 | 8.4 | 10.12 |
| Gaze Duration (D6) Gaze Point (D7) | s % | 13.32 | 12.19 | 12.05 | 14.77 |
| 25.665 | 23.051 | 23.102 | 26.661 | ||
| Voice Speed (D8) | min | 330 | 160 | 226 | 186 |
| Voice Information Amount (D9) | pcs | 3.1 | 4.2 | 3.5 | 3.9 |
| Frames (D10) Colors (D11) | - | 3.4 | 4 | 4.8 | 3.1 |
| - | 3.2 | 4.2 | 3.4 | 2.5 | |
| Icons (D12) | - | 3.2 | 4.1 | 4 | 3 |
| Fonts (D13) | - | 2.5 | 3.9 | 3.6 | 3 |
| Viewable Area (D14) | cm | 480 | 540 | 680 | 600 |
| Brightness Layout (D15) | lx | 400 | 420 | 560 | 450 |
| Passing Space (D16) | mm | 900 | 1000 | 1200 | 1500 |
| Operational Time (D17) | S | 170 | 230 | 130 | 150 |
| Limb Accessibility (D18) | mm | 510 | 600 | 680 | 540 |
| Postural Intensity (D19) | N·m | 450 | 500 | 350 | 400 |
| Functional Satisfaction(D20) | - | 3.1 | 3.6 | 4.1 | 4.3 |
| Service Satisfaction (D21) | - | 3.4 | 3.7 | 3.5 | 3.1 |
| Cognitive Load (D22) | μV | 18.3993 | 17.3203 | 16.9791 | 18.0673 |
| Limb Load (D23) | N | 1600 | 3400 | 2000 | 2600 |
| Fatigue Recovery Time (D24) | S | 600 | 834 | 1100 | 1300 |
| Physical Pleasure (D25) | - | 4.2 | 3.2 | 4.1 | 3.6 |
| Psychological Pleasure (D26) | - | 3.2 | 3.8 | 3.9 | 2.1 |
| Social Pleasure (D27) | - | 2.1 | 2.3 | 2.2 | 1.9 |
| B1 | B2 | B3 | B4 | |
|---|---|---|---|---|
| B1 | [1, 1, 1] | [3, 4, 5] [2, 3, 4] [2, 3, 5] | [1/6, 1/5, 1/2] [1/5, 1/4, 1] [4, 5, 8] | [1/7, 1/6, 1/2] [1/4, 1/3 1] [3, 4, 5] |
| B2 | [1/5, 1/4, 1/3] [1/4, 1/3, 1/2] [1/5, 1/3, 1/2] | [1, 1, 1] | [6, 7, 8] [1/5, 1/4, 1] [1/8, 1/7, 1/2] | [6, 7, 8] [1/6, 1/5, 1/2] [1/4, 1/3, 1] |
| B3 | [2, 5, 6] [1, 4, 5] [1/8, 1/5, 1/4] | [1/8, 1/7, 1/6] [1, 4, 5] [2, 7, 8] | [1, 1, 1] | [1/8, 1/7, 1] [1/6, 1/5, 1] [6, 7, 8] |
| B4 | [2, 6, 7] [1, 3, 4] [1/5, 1/4, 1/3] | [1/8, 1/7, 1/6] [2, 5, 6] [1, 3, 4] | [1, 7, 8] [1, 5, 6] [1/8, 1/7, 1/6] | [1, 1, 1] |
| 1 | 2 | 3 | 4 | 5 | 6 | 7 | 8 | 9 | |
|---|---|---|---|---|---|---|---|---|---|
| 0 | 0 | 0.58 | 0.96 | 1.12 | 1.24 | 1.32 | 1.41 | 1.45 |
| Layer B | Layer C | ||
|---|---|---|---|
| B1 | 0.1207 | C1 | 0.7500 |
| C2 | 0.2500 | ||
| B2 | 0.0641 | C3 | 0.7500 |
| C4 | 0.2500 | ||
| B3 | 0.5777 | C5 | 0.1429 |
| C6 | 0.4286 | ||
| C7 | 0.4286 | ||
| B4 | 0.2375 | C8 | 0.2583 |
| C9 | 0.6370 | ||
| C10 | 0.1047 |
| Index D | ||||||
|---|---|---|---|---|---|---|
| D1 | 0.0719 | 0.0065 | 94.26 | 5.60 | 138.9352 | 0.0215 |
| D2 | 0.2790 | 0.0253 | 82.45 | 15.44 | 200.5149 | 0.0310 |
| D3 | 0.6491 | 0.0588 | 82.36 | 15.29 | 197.7315 | 0.0306 |
| D4 | 0.8333 | 0.0251 | 71.06 | 20.93 | 343.4324 | 0.0532 |
| D5 | 0.1667 | 0.0050 | 90.44 | 6.49 | 79.2296 | 0.0123 |
| D6 | 0.7500 | 0.0361 | 92.73 | 7.41 | 102.5044 | 0.0159 |
| D7 | 0.2500 | 0.0120 | 94.01 | 6.00 | 82.0168 | 0.0127 |
| D8 | 0.1667 | 0.0027 | 76.33 | 19.11 | 485.5044 | 0.0752 |
| D9 | 0.8333 | 0.0134 | 85.47 | 9.91 | 277.6481 | 0.0430 |
| D10 | 0.4995 | 0.0412 | 79.69 | 13.53 | 165.0359 | 0.0256 |
| D11 | 0.0655 | 0.0054 | 79.17 | 14.42 | 270.0285 | 0.0418 |
| D12 | 0.1465 | 0.0121 | 87.20 | 11.74 | 165.2866 | 0.0256 |
| D13 | 0.2884 | 0.0238 | 83.33 | 13.87 | 229.8383 | 0.0356 |
| D14 | 0.4806 | 0.1190 | 84.56 | 10.88 | 191.7667 | 0.0297 |
| D15 | 0.1140 | 0.0282 | 81.70 | 11.04 | 171.5032 | 0.0266 |
| D16 | 0.4054 | 0.1004 | 76.67 | 15.28 | 454.3062 | 0.0703 |
| D17 | 0.1047 | 0.0259 | 79.91 | 15.88 | 361.1817 | 0.0559 |
| D18 | 0.6370 | 0.1577 | 85.66 | 9.55 | 122.4814 | 0.0190 |
| D19 | 0.2583 | 0.0640 | 83.82 | 11.21 | 227.1599 | 0.0352 |
| D20 | 0.7500 | 0.0460 | 87.79 | 10.83 | 262.4082 | 0.0406 |
| D21 | 0.2500 | 0.0153 | 92.57 | 5.85 | 101.6320 | 0.0157 |
| D22 | 0.7306 | 0.1105 | 96.07 | 3.08 | 40.9307 | 0.0063 |
| D23 | 0.1884 | 0.0285 | 72.15 | 19.87 | 551.9521 | 0.0855 |
| D24 | 0.0810 | 0.0123 | 68.16 | 20.60 | 623.5856 | 0.0965 |
| D25 | 0.4545 | 0.0113 | 89.88 | 9.58 | 241.0123 | 0.0373 |
| D26 | 0.4545 | 0.0113 | 83.33 | 18.36 | 266.4111 | 0.0412 |
| D27 | 0.0909 | 0.0023 | 92.39 | 6.43 | 105.1560 | 0.0163 |
| Layer B | Layer C | Index D | |||||
|---|---|---|---|---|---|---|---|
| B1 | C1 | D1 | 0.0042 | 97.30 | 85.14 | 100.00 | 94.59 |
| D2 | 0.0234 | 70.16 | 95.34 | 100.00 | 64.32 | ||
| D3 | 0.0538 | 69.73 | 94.88 | 100.00 | 64.83 | ||
| C2 | D4 | 0.0399 | 58.14 | 100.00 | 80.65 | 45.45 | |
| D5 | 0.0018 | 86.24 | 92.51 | 100.00 | 83.00 | ||
| B2 | C3 | D6 | 0.0172 | 90.47 | 98.85 | 100.00 | 81.58 |
| D7 | 0.0046 | 89.81 | 100.00 | 99.78 | 86.46 | ||
| C4 | D8 | 0.0061 | 48.48 | 100.00 | 70.80 | 86.02 | |
| D9 | 0.0172 | 100.00 | 73.81 | 88.57 | 79.49 | ||
| B3 | C5 | D10 | 0.0315 | 70.83 | 83.33 | 100.00 | 64.58 |
| D11 | 0.0067 | 76.19 | 100.00 | 80.95 | 59.52 | ||
| D12 | 0.0093 | 78.05 | 100.00 | 97.56 | 73.17 | ||
| D13 | 0.0253 | 64.10 | 100.00 | 92.31 | 76.92 | ||
| C6 | D14 | 0.1056 | 70.59 | 79.41 | 100.00 | 88.24 | |
| D15 | 0.0224 | 71.43 | 75.00 | 100.00 | 80.36 | ||
| D16 | 0.2110 | 60.00 | 66.67 | 80.00 | 100.00 | ||
| C7 | D17 | 0.0433 | 76.47 | 56.52 | 100.00 | 86.67 | |
| D18 | 0.0896 | 75.00 | 88.24 | 100.00 | 79.41 | ||
| D19 | 0.0673 | 77.78 | 70.00 | 100.00 | 87.50 | ||
| B4 | C8 | D20 | 0.0558 | 72.09 | 83.72 | 95.35 | 100.00 |
| D21 | 0.0072 | 91.89 | 100.00 | 94.59 | 83.78 | ||
| C9 | D22 | 0.0208 | 92.28 | 98.03 | 100.00 | 93.98 | |
| D23 | 0.0728 | 100.00 | 47.06 | 80.00 | 61.54 | ||
| D24 | 0.0355 | 100.00 | 71.94 | 54.55 | 46.15 | ||
| C10 | D25 | 0.0126 | 100.00 | 76.19 | 97.62 | 85.71 | |
| D26 | 0.0139 | 82.05 | 97.44 | 100.00 | 53.85 | ||
| D27 | 0.0011 | 91.30 | 100.00 | 95.65 | 82.61 | ||
| 11.6723 | 11.9472 | 30.1197 | 26.4608 |
Publisher’s Note: MDPI stays neutral with regard to jurisdictional claims in published maps and institutional affiliations. |
© 2022 by the authors. Licensee MDPI, Basel, Switzerland. This article is an open access article distributed under the terms and conditions of the Creative Commons Attribution (CC BY) license (https://creativecommons.org/licenses/by/4.0/).
Share and Cite
Lu, N.; Li, Y.; Xu, B. Evaluation of the Suitability of Smart Health Products for Aging Based on the IIVAHP-CRITIC Model: A Case Study of Smart Health Kiosk. Sustainability 2022, 14, 9212. https://doi.org/10.3390/su14159212
Lu N, Li Y, Xu B. Evaluation of the Suitability of Smart Health Products for Aging Based on the IIVAHP-CRITIC Model: A Case Study of Smart Health Kiosk. Sustainability. 2022; 14(15):9212. https://doi.org/10.3390/su14159212
Chicago/Turabian StyleLu, Ning, Yefei Li, and Bochu Xu. 2022. "Evaluation of the Suitability of Smart Health Products for Aging Based on the IIVAHP-CRITIC Model: A Case Study of Smart Health Kiosk" Sustainability 14, no. 15: 9212. https://doi.org/10.3390/su14159212