Article

Has Industrial Upgrading Improved Air Pollution?—Evidence from China’s Digital Economy

College of Geography and Environment, Shandong Normal University, Jinan 250358, China
*
Authors to whom correspondence should be addressed.
Sustainability 2022, 14(14), 8967; https://doi.org/10.3390/su14148967
Submission received: 8 June 2022 / Revised: 12 July 2022 / Accepted: 20 July 2022 / Published: 21 July 2022
(This article belongs to the Section Air, Climate Change and Sustainability)

Abstract

:
Air pollution has seriously hindered China’s sustainable development. The impact mechanism of industrial upgrading on air pollution is still unclear, given the rapid digital economy. It is necessary to analyze the impact of industrial structure upgrading on air pollution through the digital economy. To investigate the impact of industrial upgrading and the digital economy on air pollution, this paper selected the industrial advanced index and the digital economy index to construct a panel regression model to explore the improvement effect of industrial upgrading on air pollution and selected China’s three typical areas to construct a zonal regression model. The concentrations of air pollutants showed a downward trend during 2013–2020. Among them, the SO2 concentration decreased by 63%, which is lower than the PM2.5 and NO2 concentrations. The spatial pattern of air pollutants is heavier in the north than in the south and heavier in the east than in the west, with the North China Plain being the center of gravity. These air pollutants have significant spatial spillover effects, while local spatial correlation is dominated by high-high and low-low clustering. Industrial upgrading has a stronger suppressive effect on the PM2.5 concentration than the suppressive effect on the SO2 and NO2 concentrations, while the digital economy has a stronger improvement effect on the SO2 concentration than its improvement effect on the PM2.5 and NO2 concentrations. Industrial upgrading has a stronger improvement effect on air pollution in the Yangtze River Delta urban agglomeration than in Beijing–Tianjin–Hebei and its surrounding areas, while the improvement in air pollution attributable to the digital economy in Beijing–Tianjin–Hebei and its surrounding areas is stronger than in the Yangtze River Delta urban agglomeration. There are significant differences in the effects of industrial upgrading and the digital economy on the various types of air pollutants.

1. Introduction

Since the beginning of the 21st century, rapid industrialization and informatization have contributed to the rapid growth of the regional economy [1]. However, rapid industrialization has resulted not only in desired outputs, such as economic development but also in undesired outputs, such as ecological pollution, especially air pollution [2]. Air pollution exposure is the primary environmental risk factor for human health [3,4]. High concentrations of air pollutants can be harmful to human health, for example, inducing cardiovascular and cerebrovascular diseases [5] and damaging the human respiratory system [5,6]. Studies have shown that the risks to human health have been increasing with the increase in high concentrations of air pollutants, especially in-car PM2.5 exposure [4,6]. On 22 September 2021, the WHO released the Global Air Quality Guidelines (AQG2021), which have stricter requirements for the concentration of various air pollutants, adjusting the annual average target value of PM2.5 concentration from 10 μg/m3 to 5 μg/m3 and the daily average target value to 15 μg/m3, the annual average target value of NO2 concentration from 40 μg/m3 to 10 μg/m3 and the daily average target value to 25 μg/m3, and the daily average target value of SO2 concentration to 40 μg/m3. While injecting a new impetus for high-quality development, industrial upgrading and the digital economy have also reduced air pollutant emissions, making a prominent contribution to winning the battle for a blue sky and white clouds [7]. However, there may be pollution transfer in some areas due to the transfer of existing heavy polluting enterprises as a result of industrial upgrading [8]. Therefore, the ecological and environmental effects of industrial upgrading need to be further studied. In the context of global carbon peaking and carbon neutrality, accelerating industrial upgrading and promoting cleaner production technologies can make a great contribution to protecting human health and mitigating global climate change [9].
Currently, a great deal of research has been conducted on regional air pollution, with perspectives focusing on spatial-temporal evolution patterns and factors [10,11]. To broadly explore the spatial-temporal evolution of air pollution, the perspectives include emission inventories of air pollutants [12], source analysis of particulate matter [5], and spatial-temporal evolution and prediction of air pollution from differentiated data sources [11,13]. The selected research objects include single air pollutants, such as SO2 [14,15], NO2 [16,17], O3 [18,19], PM10 [20,21], and PM2.5 [22,23], and composite indices, such as API [24] and AQI [25]. The spatial scales of the studies are mainly focused on the national scale [3], provincial scale [26], urban clusters [11], and urban scale [27]. In addition, most of the current studies focus on the factors of air pollution [10,28,29], pollution management, prevention, and control policies [30]. Existing studies have shown that air pollution is formed by a combination of natural environmental factors and socioeconomic factors, whose formation, and transmission mechanisms are complex [29,31]. Natural environmental factors mainly include precipitation [23], wind speed [19], and vegetation [32], directly affecting the transport and degradation of air pollutants. However, socioeconomic factors are the fundamental contributors to air pollution. Economic development [10], urbanization [11], population density [33], FDI [7], energy structure [34], and land use [35] have been investigated in examining air pollution in current studies. Relevant research methods include geographic probes [28], spatial econometric models [3,36], gray correlation models [37], machine learning [13,38], and geographically weighted regression models [30].
In summary, existing studies mostly focus on single air pollutants or the spatial-temporal characteristics of multiple air pollutants in a single year, and there are few comprehensive studies that cover multiple air pollutants over a long period [19,39]. In recent years, most of the relevant studies have focused on PM2.5, with few providing a comparative analysis of the spatial-temporal patterns of multiple air pollutants and their factors [40,41]. Regarding factor analysis, current studies mainly focus on socioeconomic factors, such as economic development and urbanization, while few articles include natural environmental factors [10,11]. Moreover, the impact of industrial structure transformation on air pollution has been explored by selecting the share of secondary industry in GDP or the share of tertiary industry in GDP as the core explanatory variables [42,43]. However, with the rapid development of information technology and digitalization, the digital economy can bring new energy to socioeconomic development, and thereby can promote the evolution of the industrial structure in a more technologically advanced and environmentally friendly way by decreasing the emission of air pollutants. There are few studies investigating the impact of the digital economy on air pollution [7,44]. The digital economy has given rise to new digital industries and enabled traditional industries to accelerate industrial upgrading, thus leading to improved production efficiency and reduced undesired outputs, such as air pollution [32].
As the world’s largest developing country, China’s urbanization and industrialization have led to a shift in its industrial structure from primary industry to secondary and tertiary industry [32]. The digital economy is flourishing in China, and its economic scale has expanded from CNY 2.6 trillion in 2005 to CNY 39.2 trillion in 2020. As the first echelon of China’s digital economy, the digital economy in Beijing and Shanghai already accounts for more than 50% of GDP, reaching 55.9% and 55.1%, respectively. In this context of the rapid growth of the digital economy, the impact of empowering industrial upgrading on air pollution mainly follows two paths, namely, digital industrialization and industrial digitization [45]. Digital industrialization can lead to the proliferation of clean and nonpolluting enterprises through information technology, such as the internet, which can gradually become a new growth pole for the regional economy [34]. Under the pressure of the global COVID-19 pandemic and economic downturn, China’s digital economy, which has become a key driver of emission reduction, grew 3.2 times faster than GDP did in 2020. Under the guidance of emission reduction and high-quality development, industrial upgrading and the digital economy have increasingly deepened in China in recent years. The effectiveness of air pollution control in China is closely related to the future goal of achieving carbon peaking and carbon neutrality [46,47]. By transforming the economic growth mode and increasing the proportion of the digital industry in GDP, the regional industrial structure can be optimized [45]. Industrial digitalization realizes low consumption and low emissions mainly through the digitalization, intelligence, and clean transformation of the original traditional industry, which directly reduces the emission of air pollution and realizes the synergistic control of multiple pollutants in all aspects [48]. Therefore, it is necessary to improve air quality by accelerating industrial upgrading and promoting the digital economy.
To investigate the changes in air pollution in China since the implementation of the Ambient Air Quality Standard (GB3095-2012) and the Air Pollution Prevention and Control Action Plan, this paper selected the remote sensing interpretation data of PM2.5 concentration, SO2 concentration, and NO2 concentration in China from 2013 to 2020 as the research objects to analyze the spatial-temporal differences and spatial correlation evolution characteristics of these pollutants. To explore the ecological effects of industrial upgrading, this paper constructed a panel regression model to analyze the linkage effects and driving mechanisms of industrial upgrading and the digital economy through these air pollutants. Moreover, this paper explored the direction and influence degree of the dominant factors of different air pollutant concentrations in combination with the environmental Kuznets curve (EKC). Hopefully, the results will provide a theoretical reference for the formulation and implementation of regional governance policies, such as the scientific management of air pollution in each region, to achieve the dual goals of regional high-quality development and ecological civilization construction.

2. Data and Methodology

2.1. Study Area and Data Sources

Considering the adjustment and change in administrative divisions and the unavailability of equivalent economic data in some areas, this paper selected 286 cities above the prefecture level in China as the study subjects. It is well known that the differences in spatial-temporal patterns of air pollution are not only influenced by socioeconomic conditions but also have a close relationship with natural conditions. Drawing on existing studies [2,10], this paper chose PM2.5 concentration, SO2 concentration, and NO2 concentration as indicators to characterize air pollution and selected the industrial advancement index (Ind) and the digital economy index (Dige) as core explanatory variables. This paper explored whether air pollution and economic development fit the EKC with GDP per capita and its squared term. In addition, this paper selected human activity intensity (lnHAI), population density (lnPD), population urbanization rate (lnPU), normalized vegetation index (NDVI), average annual rainfall (lnPRCP), and ventilation coefficients (VC) as control variables. The descriptive statistics of each variable are shown in Table 1. To prevent pseudoregression in the regression process and to ensure the validity of the model results, the Harris and Tzavalis (HT) test [49] was used to test the stationarity of the unit root of each panel series. The results showed that the data passed the significance and stationarity tests (Table 1).
The data used for the study were divided into three parts:
(1)
Air pollution data. PM2.5 concentration data for the period 2013–2020 (V4.CH.03) (https://sites.wustl.edu/acag/datasets/surface-pm2–5/#V4.CH.03) (accessed on 7 April 2021) come from the Atmospheric Composition Analysis Group (ACAG) of Washington University in St. Louis, MO, USA. The SO2 concentration data (https://zenodo.org/record/5765553#.YpYPwciEwi0) (accessed on 6 April 2021) and NO2 concentration data (https://zenodo.org/record/5765561#.YpYPwciEwi0) (accessed on 6 April 2021) are derived from the China High Air Pollutants (CHAP) dataset released by the University of Maryland, USA. It is generated from big data (e.g., ground-based measurements, satellite remote sensing products, atmospheric reanalysis, and model simulations) by considering the spatial-temporal heterogeneity of air pollution and using artificial intelligence. It has long-term, full coverage, high-resolution, and high-quality characteristics.
(2)
Socioeconomic data. As core explanatory variables, the index of industrial sophistication (the ratio of tertiary industry to secondary industry) is calculated using the output value of the secondary industry and the output value of the tertiary industry provided in the statistical yearbooks of China’s provinces and cities. Considering the availability of relevant data at the city level, the digital economy index is constructed to measure the comprehensive development level of the digital economy in terms of both internet development and digital financial inclusion. The number of broadband internet access users per 100 persons, the proportion of computer service and software industry employees to urban employees, the total amount of telecommunication services per capita, and the number of cell phone users per 100 persons are selected from the China Urban Statistical Yearbook (2014–2021) to characterize the internet penetration rate, related employment, related output, and cell phone penetration rate, respectively. For digital finance development, the China Digital Inclusive Finance Index, which is jointly compiled by the Digital Finance Research Center of Peking University and Ant Financial Services Group, is used. This paper calculated these five indicators using the entropy value method [50] to obtain a comprehensive digital economy development index [51], denoted as Dige. Data on GDP per capita, population urbanization rate, and population density were obtained from the China Urban Statistical Yearbook (2014–2021). Because of the close relationship between nighttime lighting image data and urban population density, total GDP, energy consumption, and residents’ lifestyles, this paper selected the sum of raster grayscale values within the scope of prefecture-level administrative units to comprehensively measure the intensity of human socioeconomic activities in the studied cities. This paper selected nighttime light data from the global 500 m resolution “NPP-VIIRS-like” nighttime light dataset produced using a deep learning model (https://dataverse.harvard.edu/dataset.xhtml?persistentId=doi:10.7910/DVN/YGIVCD) (accessed on 5 April 2021) [52].
(3)
Natural environmental data. Existing studies show that, in addition to socioeconomic factors, natural environmental factors have significant effects on air quality, especially on PM2.5 concentrations. This paper selected the normalized difference vegetation index (NDVI), annual average precipitation, and airflow coefficient as influencing factors. The NDVI was obtained from the National Aeronautics and Space Administration (NASA) (https://search.earthdata.nasa.gov/search/granules?p=C1621135848-LPDAAC_ECS&pg[0][v]=f&pg[0][gsk]=-start_date&q=Vegetation%20Indices%2016-Day%20L3%20Global%20500m&tl=1651319558!3!!&lat=31.21875&long=50.484375) (accessed on 7 April 2021). The annual precipitation and the mean wind speed and atmospheric boundary data were obtained from the latitude and longitude raster meteorological data published by the ECMWF (https://cds.climate.copernicus.eu/cdsapp#!/dataset/reanalysis-era5-single-levels-monthlymeans?tab=form ) (accessed on 7 April 2021), and the ventilation coefficients (VC) were calculated by referring to the study by Hering [53].

2.2. Research Methodology

2.2.1. Spatial Autocorrelation

Spatial autocorrelation is used to characterize the spatial correlation of an indicator in a region [54] and is divided into global autocorrelation, which is used to study the correlation and dependence of a research unit within a spatial region with research units in neighboring regions, and local autocorrelation, which is used to study the clustering of high and low values within a spatial region and the spatial distribution of hot and cold spots [55]. Global Moran’s I and local Moran’s I were selected to measure the spatial clustering phenomenon of air pollution in China. According to the category of local spatial autocorrelation, all cities can be classified into “high-high”, “low-low”, “high-low”, and “low-high” categories. In the “high-high” cluster, air pollution in the area and neighboring areas is relatively high. In the “low-low” cluster, air pollution in the area and its neighboring areas is relatively low. The “high-low” outlier reflects areas with higher air pollution surrounded by lower areas, while the “low-high” outlier reflects areas with lower air pollution surrounded by higher areas.

2.2.2. Entropy Value Method

The entropy value method is an objective weight calculation method and can effectively overcome information superposition among indicators [50]. After standardizing the number of broadband internet access users, the proportion of urban employees in the computer services and software industry, the total number of telecommunication services per capita, and the number of cell phone subscribers per 100 persons and considering the China Digital Inclusive Finance Index, the entropy value method was used to calculate the weights of each indicator. Then, the calculated index was used to characterize the development level of the digital economy in cities.

2.2.3. Multiple Panel Regression Model

This paper constructed regression models to investigate the differences in the effects of industrial upgrading on different air pollutants with PM2.5 concentration, SO2 concentration, and NO2 concentration as explanatory variables. To enhance the robustness of the regression results, this paper selected the industrial upgrading index (Ind) and the digital economy index (Dige) as the core explanatory variables. This paper also included the squared term of GDP per capita in the econometric model to show whether each type of air pollutant fits the typical Kuznets curve. The respective regression models are as follows.
ln ( P M 2.5 ) i t = { α 1 I n d i t + λ i X i t + β + ε α 2 D i g e i t + λ i X i t + β + ε
ln ( S O 2 ) it = { α 1 I n d i t + λ i X i t + β + ε α 2 D i g e i t + λ i X i t + β + ε
ln ( N O 2 ) it = { α 1 I n d i t + λ i X i t + β + ε α 2 D i g e i t + λ i X i t + β + ε
where (PM2.5)it, (SO2)it, and (NO2)it represent the annual average concentrations of PM2.5, SO2, and NO2 in each city, i denotes the city, t denotes the year, Ind is the industrial advanced index, and Dige is the digital economy index. Xit are the factors affecting PM2.5 concentration, SO2 concentration, and NO2 concentration, such as economic development and population urbanization level, which are the control variables. β is the constant term, and ε is the random error term. α1, α2, and λi are the estimated coefficients of the corresponding independent variables.

3. Results

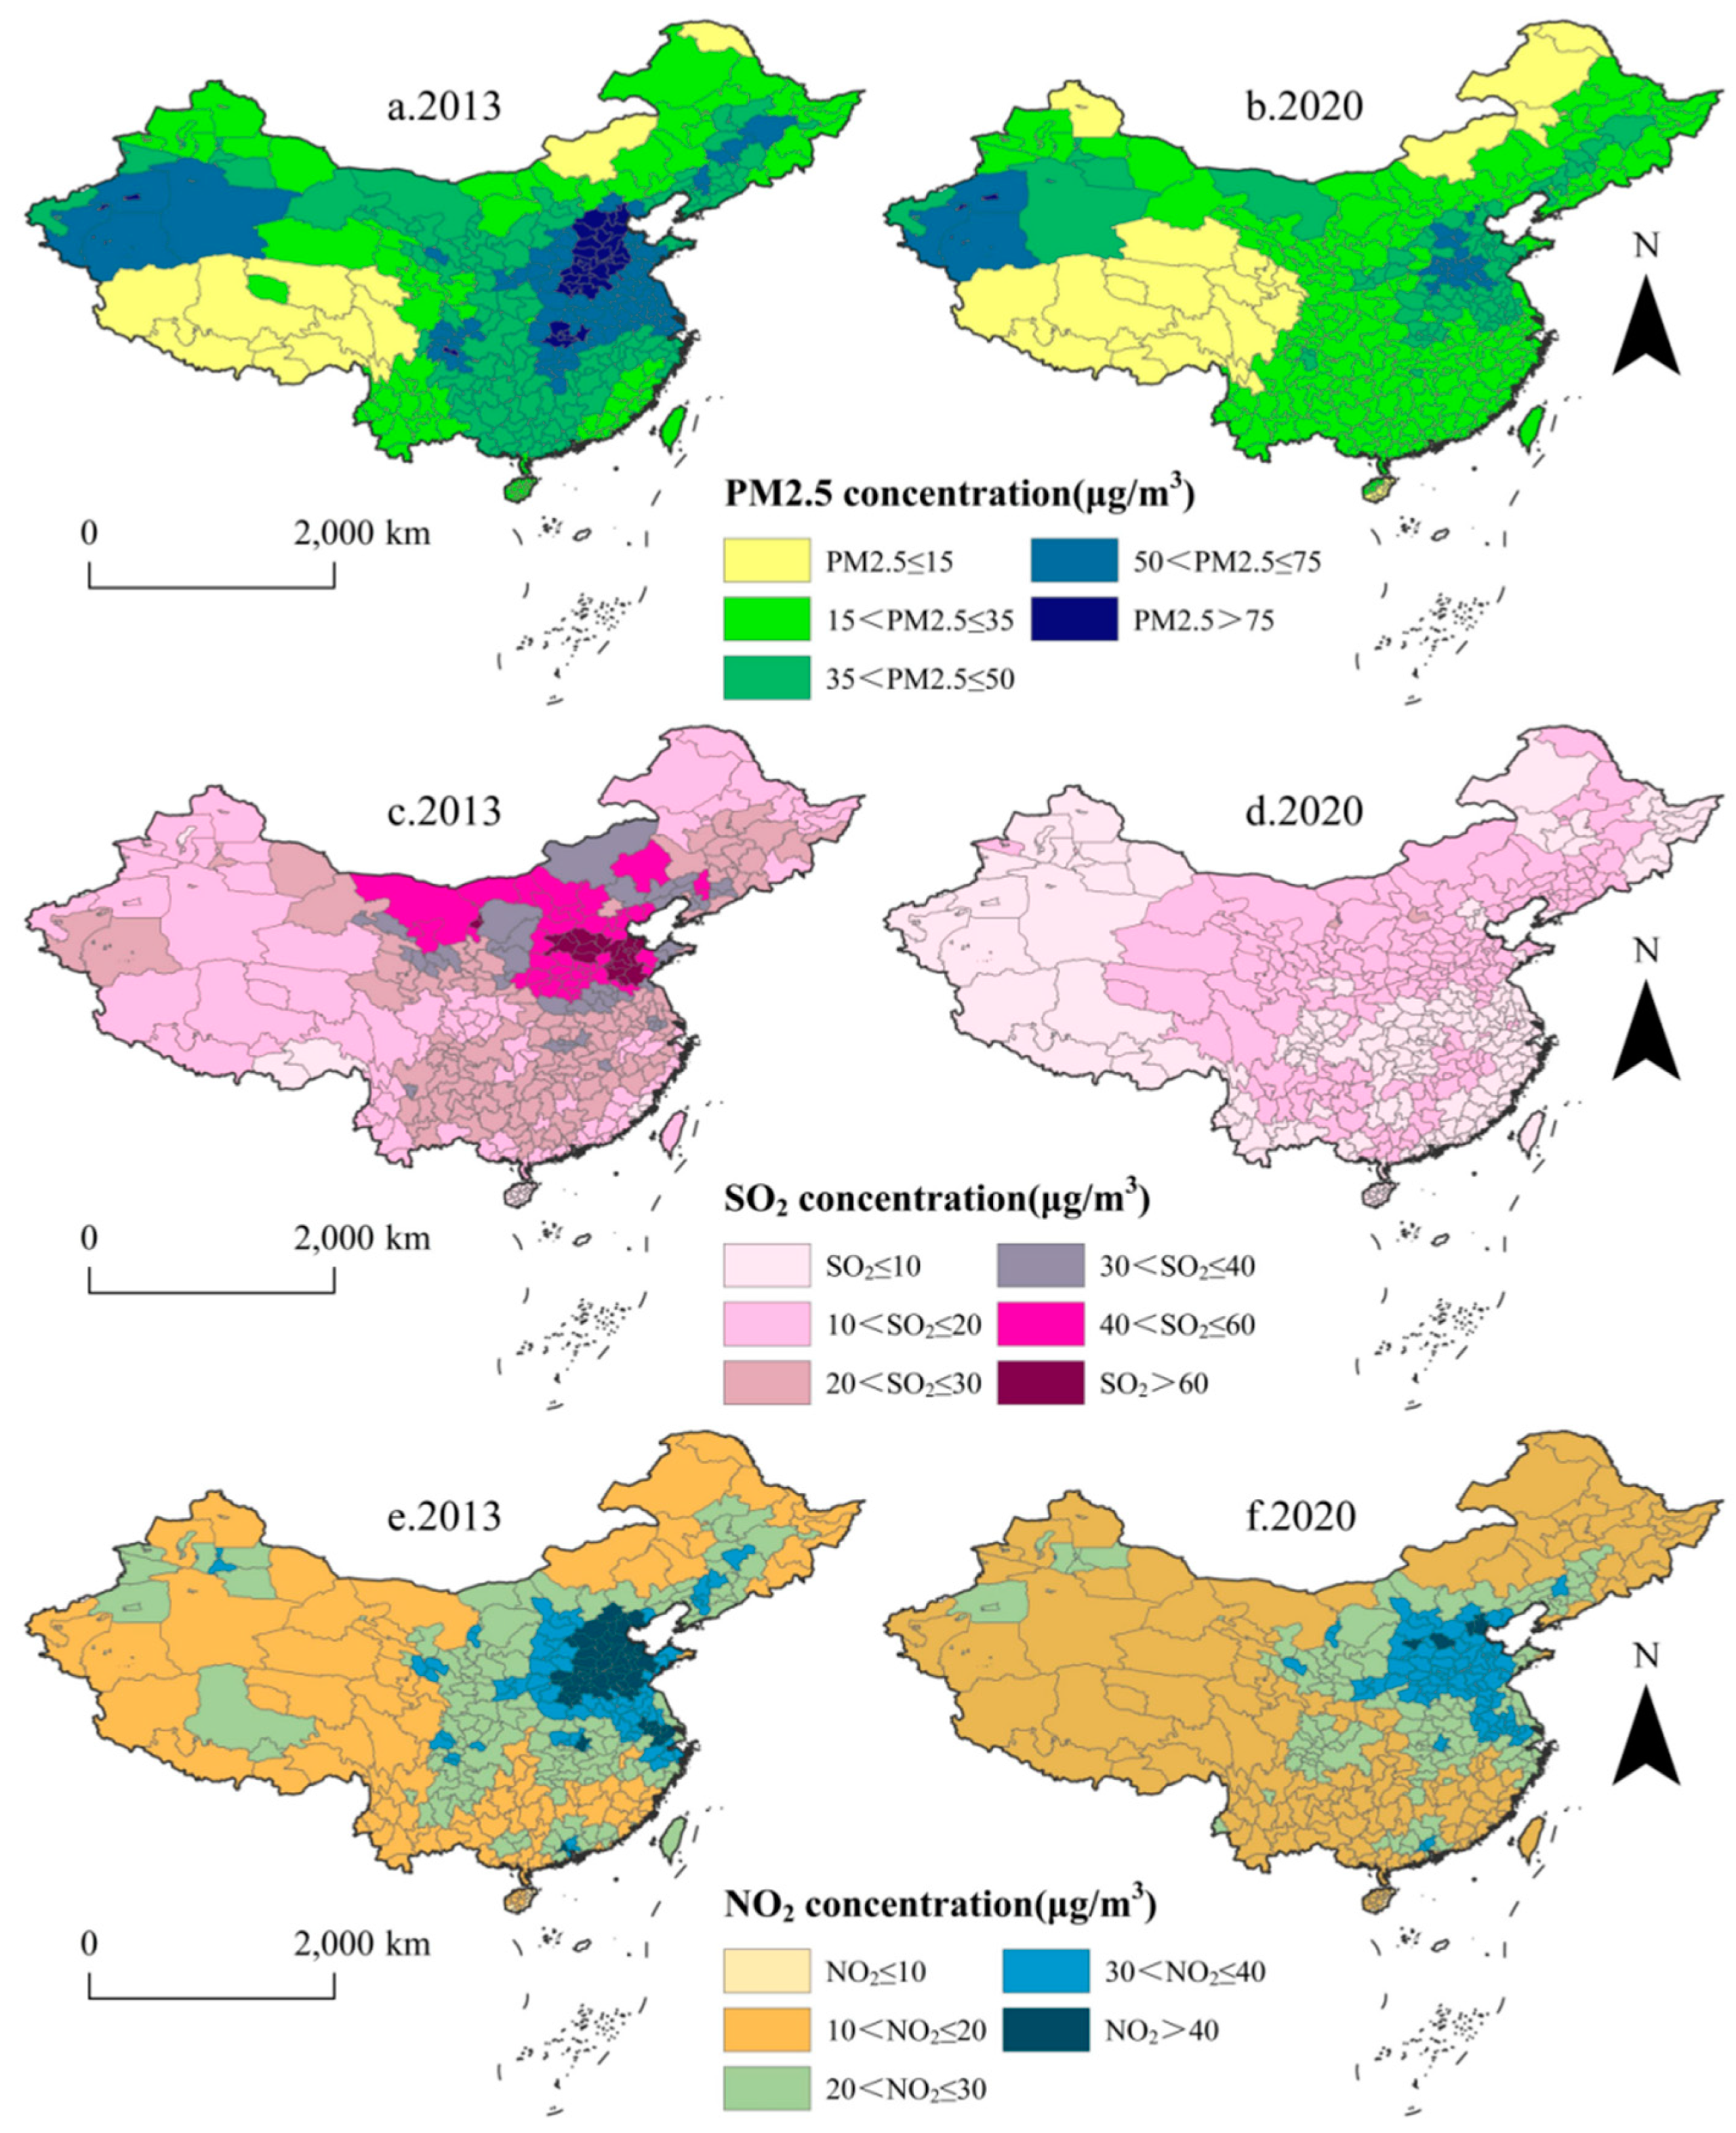
3.1. Spatial-Temporal Distribution of Air Pollution

With the promulgation of the Action Plan for the Prevention and Control of Air Pollution (Atmospheric Ten) in 2013, the Chinese government strengthened the monitoring of various air pollutants. From 2013 to 2020, the concentrations of PM2.5, SO2, and NO2 in China’s cities showed a decreasing trend (Figure 1). Among them, the annual average concentration of SO2 decreased by approximately 62.18%, showing the most significant decrease, and for the first time in 2016, the annual average concentration of SO2 was lower than the annual average primary limit value (20 μg/m3) of SO2 concentration in the Ambient Air Quality Standards (GB3095-2012). The PM2.5 concentration also showed a decreasing trend, with a decrease of 35.97% after 2018, which was lower than the secondary limit value (35 μg/m3) of the PM2.5 concentration in the Ambient Air Quality Standard (GB3095-2012) but was still higher than the primary limit value (15 μg/m3). Compared with the first two air pollutants, the NO2 concentration remained relatively stable, in the range of 22.27–25.82 μg/m3, showing a small fluctuating decrease.
To explore the differences in the spatial-temporal patterns of different air pollutants, this paper used ArcGIS10.8 to spatially visualize the spatial-temporal distribution patterns of the mean PM2.5 concentration, SO2 concentration, and NO2 concentration in China during 2013–2020. This paper found that there were significant differences in the patterns of different air pollutants in various regions (Figure 2). Overall, the concentrations of all three air pollutants were significantly reduced. The spatial pattern of these three pollutants is heavier in the north than in the south and heavier in the east than in the west, with the North China Plain as the center of gravity. In particular, the spatial distribution pattern of the three types of pollutants in the “2 + 26” cities in Beijing–Tianjin–Hebei and the surrounding areas has a certain coupling. The national PM2.5 concentration has improved, especially in China’s southern region. The annual average PM2.5 concentration in 261 cities was over 35 μg/m3 in 2013, while only 103 cities presented concentrations exceeding 35 μg/m3 in 2020, with significantly fewer areas of high concentration. Moreover, the PM2.5 concentration weakened significantly, with the highest annual average pollution concentration (108.87 μg/m3) in Xingtai in 2013 and in Kunyu (83.50 μg/m3) in 2020. The original double-peak pattern of PM2.5 concentration in South China and the Beijing–Tianjin–Hebei region gradually evolved into a sporadic distribution, with individual cities presenting high concentrations. Areas with high SO2 concentrations were mainly distributed in resource-based petrochemical and coal cities, such as Zibo, Zaozhuang, Dongying, Yangquan, and other cities, in 2013. The development and utilization of mineral resources produce a large amount of SO2, resulting in air quality deterioration. The annual average SO2 concentration in 18 cities exceeded the secondary limit (60 μg/m3) in 2013, while that in 243 cities exceeded the primary limit (20 μg/m3). The annual average concentration of SO2 was reduced in 2020, with only three cities, namely, Shuozhou, Wuhai, and Shizuishan, exceeding the primary limit (20 μg/m3). Compared to 2013, an overall decrease in NO2 concentration emerged in 2020, while the overall spatial change in areas with high NO2 concentration was not significant. The areas with relatively high NO2 concentration were mainly located in the Beijing–Tianjin–Hebei urban agglomeration, Shandong Peninsula urban agglomeration, and Central Plains urban agglomeration. In 2020, the NO2 concentration limit (40 μg/m3) was exceeded only in Tianjin, Shijiazhuang, and Taiyuan Langfang, which are densely populated and have a high intensity of socioeconomic activities. With the promulgation of the Atmospheric Ten in 2013, the number of cities with high air pollution gradually decreased, showing a trend of spatial convergence.

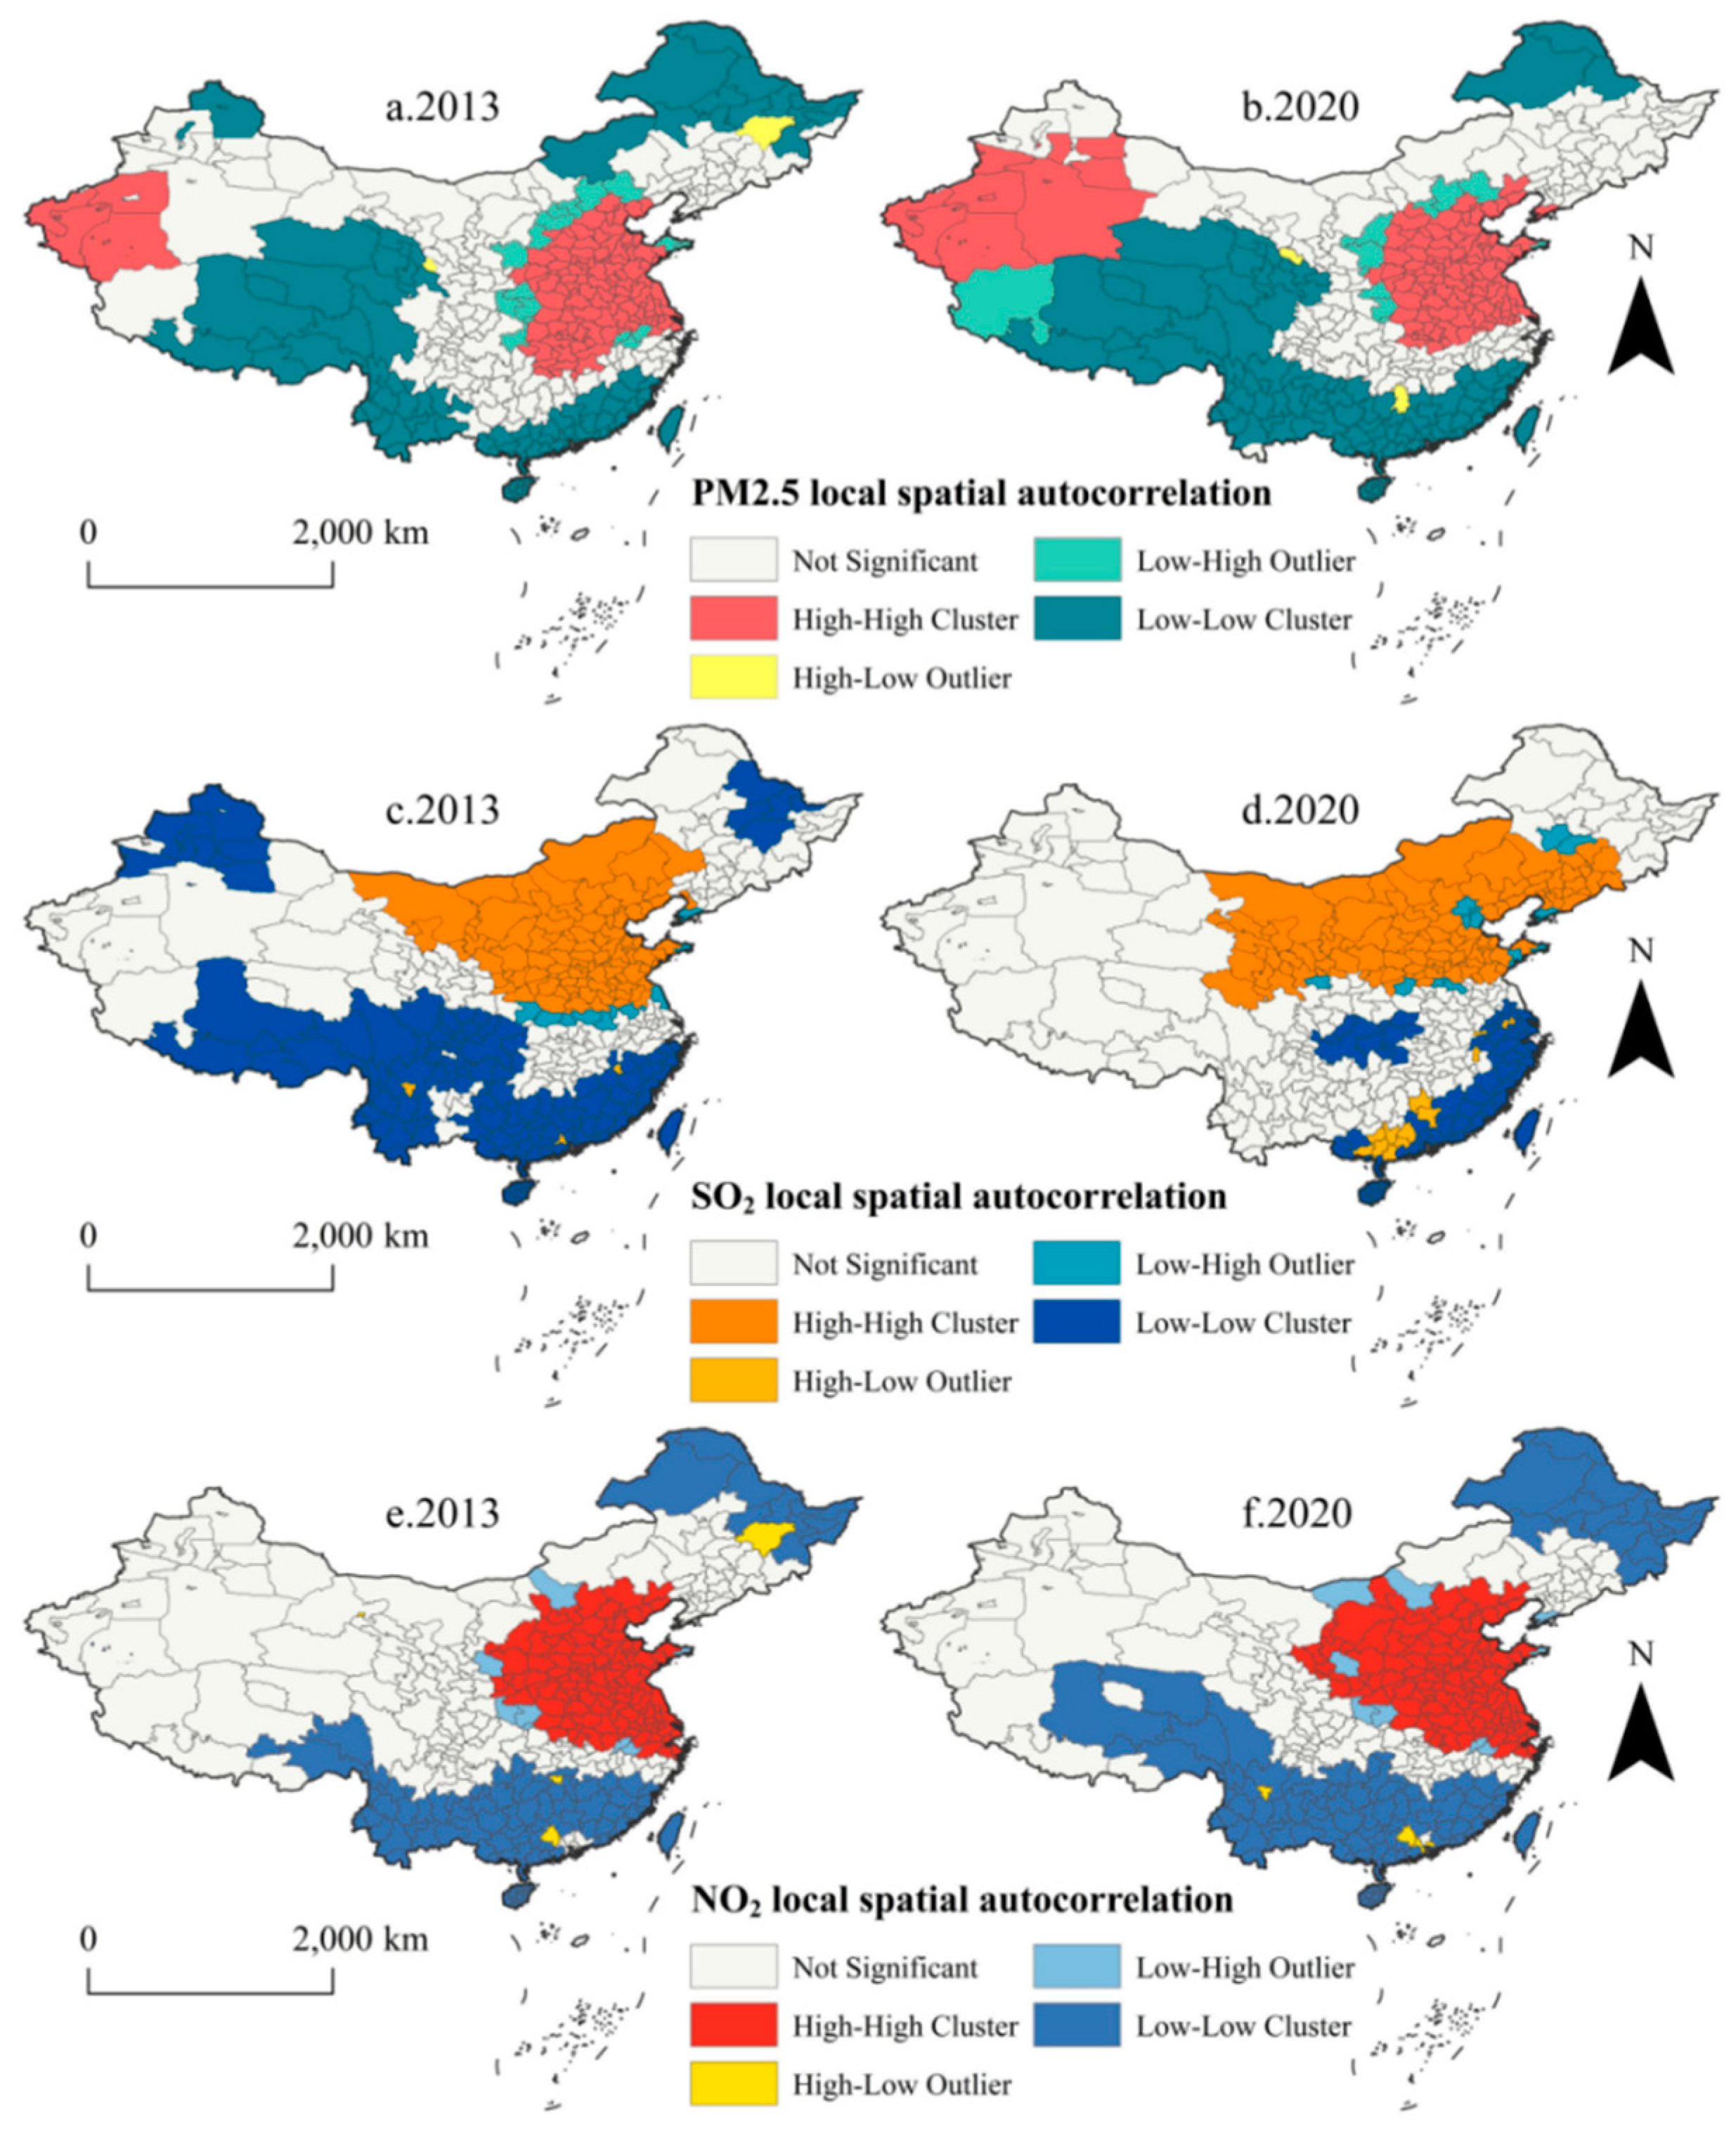
3.2. Spatial Correlation Characteristics of Air Pollution

This paper calculated the global Moran’s I estimates of the average concentration of the three types of air pollutants for each city in China from 2013 to 2020 with GeoDa1.16 (Table 2) and found that the global Moran’s I estimates of the average concentration of the three air pollutants were all greater than 0 at the significance level of 0.1%. Among them, the global Moran’s I of the PM2.5 concentration was between 0.775 and 0.827, with an overall fluctuating decreasing trend, while the global Moran’s I of the SO2 concentration decreased greatly year by year, from 0.878 in 2013 to 0.713 in 2020. The global Moran’s I of the NO2 concentration ranged from 0.798 to 0.815, with a small overall change, and remained relatively stable. Overall, the air pollutant concentration in China had significant positive spatial clustering and dependence characteristics from 2013 to 2020. Compared with PM2.5 and NO2, the SO2 concentration presented weakening clustering characteristics, and the pollution characteristics of high-high clustering and low-low clustering were weaker.
To further study the degree of clustering and spatial distribution of air pollutants in China, LISA maps were selected to characterize four types of local spatial correlations of high-high, low-low, low-high, and high-low PM2.5 concentration, SO2 concentration, and NO2 concentration (Figure 3). Overall, the local spatial correlations of the three types of air pollutants were dominated by high-high and low-low clusters during 2013–2020, whereas the high-low outliers, as well as the low-low clusters, showed sporadic distributions around high-high and low-low clusters. The high-high clusters of PM2.5 concentration were mainly distributed in the North China Plain and the middle and lower reaches of the Yangtze River Plain, and their range gradually expanded over most of Xinjiang. The areas with low-low clustering of PM2.5 concentration were gradually reduced, while the local clustering in areas in Guangxi, Inner Mongolia, and Heilongjiang disappeared.
Compared with the cases of PM2.5 and NO2, the agglomeration range of SO2 concentration has an obvious dividing line and very obvious changes. The high-high agglomeration area of SO2 concentration is mainly distributed in the middle and lower reaches of the Yellow River north of the Qinling–Huaihe line and the Beijing–Tianjin–Hebei area in 2013. By 2020, the high-high agglomeration area of SO2 concentration gradually expanded to most of the Yellow River Basin and the Bohai Sea region, while the low-low agglomeration area of SO2 concentration presented a shrinking trend. The southwestern region, Xinjiang, and Heilongjiang gradually dropped out of the low-low agglomeration area of SO2 concentration. The low-low agglomeration area of SO2 concentration was mainly concentrated in the Yangtze River Delta urban agglomeration and the west coast of the West Taiwan Strait urban agglomeration in 2020. The NO2 concentration and the PM2.5 concentration had a certain coupling in terms of the distribution pattern. The high-high agglomeration areas of the NO2 concentration were relatively stable in the “2 + 26” cities in Beijing–Tianjin–Hebei and its surrounding areas, Yangtze River Delta urban agglomeration, and Fenwei Plain, and China’s other key monitoring areas. The low-low agglomeration range of the NO2 concentration gradually shrank, while areas such as Tibet and Sichuan dropped out.

3.3. Driving Relationship between Industrial Upgrading and Air Pollution

Industrial upgrading involves industrial internal restructuring, industrial transfer, and industrial digitalization and informatization [56]. To fully consider the impact of industrial upgrading on air pollution, this paper selected the advanced index of industrial structure and the development index of the digital economy as the core explanatory variables to explore their influence mechanisms. This paper performed panel regression analysis (Table 3) with a random effect model and a fixed effect model (individual, time, and two-way), respectively, and identified the optimal model using the Hausman test [57]. The Hausman results show that the individual fixed effect model has better explanatory power than other models, so this paper chooses the individual fixed effect model to analyze the influence mechanism of industrial upgrading on air pollution.
Regional industrial upgrading is a fundamental way to combat air pollution [7]. Since the beginning of the 21st century, the accelerated growth of the digital economy has promoted the upgrading and transformation of industrial enterprises, such as those related to digitalization, informatization, and decarbonization. According to the measurement results, this paper found that industrial upgrading has a negative effect on the concentration of all three types of air pollutants, while it has a stronger effect on PM2.5 concentration than on SO2 and NO2. The regression results show that the digital economy has a catalytic effect on the improvement in air pollution, with regression coefficients of −1.362, −3.071, and −0.387, which all pass the 1% significance test (Table 3) and have a significant effect on the improvement in SO2 concentration.
The impact of economic development on air pollution has obvious stage characteristics. The panel regression model shows that GDP per capita and its quadratic pass the 1% significance test, and the coefficient of the quadratic term is negative. The relationship between the three types of air pollutants and the economic development level is also consistent with the classical EKC theory. There is an inverted U-shaped relationship, while there is a difference in the inflection point between the three types of air pollutants and the economic development level. Combined with the regression results, this paper found that the inflection point of the PM2.5 concentration appears when per capita GDP reaches CNY 13,360–13,928, and the inflection point of the SO2 concentration appears when per capita GDP reaches CNY 14,320–15,929. It is obvious that the per capita GDP level of most Chinese cities has exceeded the inflection point, and that the annual average concentration of PM2.5 and SO2 have gradually decreased. This is consistent with the spatial-temporal evolution results in previous findings. However, the inflection point of NO2 concentration appears when per capita GDP reaches CNY 76,880–108,418. At present, most cities still cannot reach this level, so the improvement in NO2 concentration is relatively slow.

3.4. Heterogeneity of Influencing Factors of Air Pollution Based on Industrial Upgrading

As the region with the fastest industrial upgrading and the highest level of digital economy in China, the effect of industrial upgrading on air pollution in the Yangtze River Delta urban agglomeration and the “2 + 26” cities in Beijing–Tianjin–Hebei and its surrounding areas is obvious. Therefore, this paper chooses the PM2.5 concentration as the explanatory variable to characterize air quality and construct regression models for the Yangtze River Delta urban agglomeration and the “2 + 26” cities in Beijing–Tianjin–Hebei and its surrounding areas. Since 2013, the government has successively issued the China New Urbanization Plan, the Overall Plan for the Reform of the Ecological Civilization System, and various local environmental plans to strengthen the control of environmental pollution in China’s key areas. Therefore, this paper also built regression models according to China’s 168 key cities which are identified in the State Council’s “Three-Year Action Plan for Winning the Blue Sky Defense”. Subsequently, this paper compared whether industrial upgrading in key areas with strong environmental regulations has a more significant impact on the improvement in air pollution.
Industrial upgrading in the “2 + 26” cities in Beijing–Tianjin–Hebei and its surrounding areas, the Yangtze River Delta urban agglomeration, and China’s key cities with environmental protection focus has a significant negative impact on air pollution, passing the significance test at the 1% level. The regression coefficients are −0.101, −0.188, and −0.064, respectively (Table 4). The effects of industrial upgrading in all three types of areas are higher than those on the PM2.5 concentration in the overall model. The impact of the digital economy on air pollution in the “2 + 26” cities in Beijing–Tianjin–Hebei and its surrounding areas, the Yangtze River Delta urban agglomeration, and China’s key cities with environmental protection focus is significantly negative, and all coefficients pass the significance test at the 1% level, with the regression coefficients at −1.164, −1.003, and −1.119, respectively (Table 4). This indicates that the digital economy has the strongest improvement effect on air pollution in Beijing–Tianjin–Hebei and its surrounding areas, which is better than the Yangtze River Delta urban agglomeration and China’s key cities with a focus on environmental protection.

4. Discussion

4.1. Mechanism Analysis of the Impact of Industrial Upgrading on Air Pollution

Industrial emissions, which are the main point source of air pollution [58], are full of pollutants, such as SO2 and NO2 [59]. The large amount of industrial pollutant emissions and industrial energy consumption are the main factors contributing to air pollution. Existing studies confirm that industrial upgrading is effective in improving air quality [60,61]. This paper found that there are significant differences in the effects of industrial upgrading on the concentration of various air pollutants in China, with industrial upgrading improving the PM2.5 concentration more strongly than improvement in SO2 and NO2. Since the promulgation of the Atmospheric Ten in 2013, air quality has improved significantly in key regions, achieving air pollution control, especially with regard to the PM2.5 concentration through source emission reduction. Many enterprises with excessive pollution have been shut down and transformed, while the point sources of various types of air pollutants have been gradually reduced [62]. Meanwhile, the Chinese government has strengthened industrial and environmental access standards, accelerated the elimination of backward production capacity, and gradually upgraded high energy-consuming and high-polluting enterprises [61]. According to the Blue Sky Defense Plan and other policies, future efforts in China’s air pollution prevention and control will focus on reducing emissions and preventing pollution directly at the source by adjusting the industrial structure and energy structure [63]. Environmental control emphasizes a strategic shift from total control to quality improvement and from single-pollutant control to multipollutant synergistic control [64]. Therefore, it is urgent to control multiple air pollutants in an integrated manner through industrial upgrading. Since the Reform and Opening-up, China’s manufacturing industry has developed rapidly and achieved a historical transformation [23]. However, China’s manufacturing industry has followed a crude development model characterized by high input, high consumption, and high emissions for a long period [65], which has brought about high energy and resource consumption and pollutant emissions. Resource shortages, environmental pollution, and ecological damage have become bottlenecks to the sustainable development of China’s manufacturing industry [32] and have restricted air environment prevention and control [66]. Coal combustion by industrial enterprises is the main source of SO2 in the atmosphere. In the context of the rapid development of the digital economy, the upgrading of coal combustion technologies and the use of low-sulfur fuels effectively reduces SO2 and NOx emissions [16,58]. Moreover, the digital economy empowers the overall control of clean transportation in terms of exhaust gases and empowers the digitalization, informatization, and intelligence of environmental management, which have a positive impact on pollutant emission monitoring and intelligent point-to-point management [67]. The digital economy has led to digital and intelligent innovation in clean production technologies [62]. Governments and enterprises are paying increasing attention to improving energy conservation and emission reduction and promoting green transformation. Therefore, industrial upgrading and green transformation have become a way to improve air pollution and a necessary path for enterprise development.
After 2013, given the implementation of environmental regulations, such as the Atmospheric Ten, and the urgent requirement to achieve high-quality development, a “push-back” mechanism was formed, resulting in the original high-energy-consuming and high-polluting enterprises’ gradual shutdown and relocation [58]. Moreover, early economic development has led to the accumulation of capital, which provides financial support for the optimization and upgrading of industries [68]. In addition, industrial digitization has been deeply promoted by the digital economy, which made the penetration rate of the digital economy in China’s industries as high as 8.9%, 21.0%, and 40.7% in 2020. The innovation of clean production technology enabled by the digital economy has led to the gradual reduction in air pollutants generated by manufacturing industries and tertiary industries, resulting in a downward trend of various air pollutant concentrations [34].

4.2. The Differential Impacts of Industrial Upgrading on Air Pollution

China’s digital economy, as the core driver of new and old kinetic energy, has already made outstanding contributions to industrial upgrading and air quality improvement [61]. In terms of total volume, the digital economy scale in 13 eastern provinces, including Guangdong, Jiangsu, Shandong, and Zhejiang, exceeded CNY 1 trillion in 2020. There are significant differences in the digital economy and the intensity of industrial upgrading in China’s different regions, so there are similar differences in the improvement in air quality. Currently, using the effective allocation of resources [69], the majority of China’s polluting enterprises are transforming their production models to achieve diversified agglomeration in the industry [70], resulting in an increasing degree of coupling between factor input and output structures. Under the strong impact of environmental policies, the positive externality brought by the rational use of resources is strengthened so that industrial upgrading provides favorable factors for air quality improvement [61]. Enhanced industrial upgrading in cities focusing on the environment can make outstanding contributions to air quality improvement [71]. This paper found that industrial upgrading has a stronger impact on air pollution improvement in key environmental cities than in the country as a whole. This is mainly because the rational implementation of environmental policies can optimize and upgrade regional low-end industries with high pollution, high energy consumption, and high emissions to high-end industries with zero pollution, low energy consumption, and zero emissions [62]. This not only creates space for the cultivation of industries, such as strategic emerging industries and high-end service industries but also achieves the purpose of improving air quality [30]. The regression results show that industrial upgrading in the Yangtze River Delta region improves air pollution significantly more than in Beijing–Tianjin–Hebei and its surrounding areas. With regional economic growth being the main focus, major cities such as Beijing, Shanghai, and Tianjin have given full play to their leading advantages in high-tech industries, gradually eliminating high energy-consuming and high-polluting enterprises and gradually expanding technology exports [72]. At present, Hebei, Jiangsu, and other areas are attracting many high-tech industries, new energy industries, energy conservation, and environmental protection industries through park cooperation, industrial transfer, technical support, and other means, fundamentally reducing the generation of air pollutants [63].
As a converging economy, the digital economy has become a driving force for high-quality development and a new engine to promote industrial structure upgrading [48]. Beijing–Tianjin–Hebei and the Yangtze River Delta are currently the fastest growing digital economy regions in China, where the digital economy has an important impact on promoting industrial upgrading, technological innovation, and improved resource allocation efficiency [72], thus making an important contribution to improving air quality. This paper found that the digital economy has a stronger impact on air pollution in Beijing–Tianjin–Hebei and its surrounding areas than in the Yangtze River Delta. This is mainly because the initial PM2.5 concentration in Beijing–Tianjin–Hebei was much higher than that in the rest of China. The digital economy can promote faster industrial upgrading and transformation and directly reduce pollution point sources [30].
Many new industries, such as big data, cloud computing, the internet of things, and artificial intelligence, have been developed based on previous capital accumulation and technical support in large and medium-sized cities, such as Beijing and Tianjin. These industries have become the economic growth point for a new round of industrial upgrading [73], and most of them are clean and nonpolluting industries, thus reducing the emission of air pollutants [10]. The digital economy effectively promotes the deep integration of information technology and traditional industries [70], which in turn promotes the transformation and upgrading of the original high-energy-consuming and high-polluting enterprises and fundamentally reduces the emission of air pollutants. The main cause of environmental pollution lies in the sloppy development of industrial production and inefficient use of resources [33]. As a green, sustainable, and high-quality economic paradigm, the digital economy optimizes resource allocation and helps reduce undesired output [70], which in turn reduces air pollution.

4.3. Research Limitations and Future Research Directions

The greatest innovation of this paper is a new research perspective on the impact of industrial upgrading on air pollution through the digital economy. These findings can help future scholars better understand the underlying mechanisms of the relationship between industrial upgrading and air pollution, and help local governments better guide their air pollution prevention and control efforts. Despite some achievements, this paper also has various limitations. The digital economy development index coverage is not sufficiently comprehensive due to the limitation of data acquisition from prefecture-level cities. This paper explored industrial upgrading using only the industrial advanced index and the digital economy development index, which may not cover the comprehensive impact on air pollution. In addition, due to the time limitation of remote sensing data, this paper studied the impact of industrial upgrading on air pollution only after the promulgation of the Atmospheric Ten in 2013 and failed to select the pre-promulgation period as a control group for the study. The regression models of Beijing–Tianjin–Hebei, the Yangtze River Delta, and China’s key cities which focus on environmental protection are mainly focused on the developed eastern regions; hence, this paper did not address how to use industrial upgrading in the central and western regions to alleviate air pollution and improve air quality. These aspects need to be further explored. There are significant differences in the leading industries of regional economic development, and they drive economic growth in various ways. The next step is to study the heterogeneity of the impact on air pollution in the upgrading of different leading industries and to tailor the general patterns and driving mechanisms of the impact of industrial upgrading on air pollution to local conditions.

5. Conclusions

To investigate the effects of industrial upgrading on air pollution, China’s different regions were studied. The main conclusions are as follows. All air pollutants in China show a decreasing trend from 2013 to 2020. There are significant differences in the patterns presented by different air pollutants in different regions. In particular, the spatial distribution pattern of these three pollutants in the “2 + 26” cities in Beijing–Tianjin–Hebei and its surrounding areas has a certain coupling. The three air pollutants show significant spillover effects. The local spatial correlation of the three air pollutants is dominated by high-high and low-low clusters, with high-low outliers and low-low clusters showing sporadic distributions around high-high and low-low clustering areas. Industrial upgrading has a negative effect on all three air pollutants, and it has a stronger effect on the PM2.5 concentration than on the SO2 and NO2 concentrations. The digital economy also has a catalytic effect on the improvement in air pollution, and the resulting improvement in SO2 concentration is stronger than the improvement in the PM2.5 and NO2 concentrations. Industrial upgrading and the digital economy have a significant negative effect on air pollution in the “2 + 26” cities in Beijing–Tianjin–Hebei and its surrounding areas, the Yangtze River Delta city cluster, and key cities with environmental protection focus, and the effect of industrial upgrading in all three typical regions is higher than the effect of industrial upgrading on the PM2.5 concentration in the overall model.

Author Contributions

G.Q.: data curation, writing—original draft, software, methodology. Z.W. (Zhibao Wang): conceptualization, methodology, visualization, investigation, writing—review and editing. Z.W. (Zhixiu Wang): supervision. L.W.: writing—review and editing. All authors have read and agreed to the published version of the manuscript.

Funding

This research is supported by funding from the National Natural Science Foundation of China (41901141).

Institutional Review Board Statement

Not applicable.

Informed Consent Statement

Not applicable.

Data Availability Statement

The data used to support the findings of this study are available from the corresponding author upon request.

Conflicts of Interest

The authors declare no conflict of interest.

References

  1. Dong, Q.; Lin, Y.; Huang, J.; Chen, Z. Has urbanization accelerated PM2.5 emissions? An empirical analysis with cross-country data. China Econ. Rev. 2020, 59, 101381. [Google Scholar] [CrossRef]
  2. Wang, S.; Sun, P.; Sun, F.; Jiang, S.; Zhang, Z.; Wei, G. The direct and spillover effect of multi-dimensional urbanization on PM2.5 concentrations: A case study from the Chengdu-Chongqing Urban Agglomeration in China. Int. J. Environ. Res. Public Health 2021, 18, 10609. [Google Scholar] [CrossRef] [PubMed]
  3. Wei, G.; Zhang, Z.; Ouyang, X.; Shen, Y.; Jiang, S.; Liu, B.; He, B.J. Delineating the spatial-temporal variation of air pollution with urbanization in the Belt and Road Initiative area. Environ. Impact Assess. Rev. 2021, 91, 106646. [Google Scholar] [CrossRef]
  4. Kumar, P.; Hama, S.; Nogueira, T.; Abbass, R.A.; Brand, V.S.; de Fatima Andrade, M.; Asfaw, A.; Aziz, K.H.; Cao, S.; El-Gendy, A.; et al. In-car particulate matter exposure across ten global cities. Sci. Total Environ. 2020, 750, 141395. [Google Scholar] [CrossRef] [PubMed]
  5. Huang, R.J.; Zhang, Y.; Bozzetti, C.; Ho, K.F.; Cao, J.J.; Han, Y.; Daellenbach, K.R.; Slowik, J.G.; Platt, S.M.; Canonaco, F.; et al. High secondary aerosol contribution to particulate pollution during haze events in China. Nature 2014, 514, 218–222. [Google Scholar] [CrossRef] [Green Version]
  6. Kumar, P.; Hama, S.; Abbass, R.A.; Nogueira, T.; Brand, V.S.; Abhijith, K.V.; de Fatima Andrade, M.; Asfaw, A.; Aziz, K.H.; Cao, S.; et al. Potential health risks due to in-car aerosol exposure across ten global cities. Environ. Int. 2021, 155, 106688. [Google Scholar] [CrossRef]
  7. Pei, T.; Gao, L.; Yang, C.; Xu, C.; Tian, Y.; Song, W. The impact of FDI on urban PM2.5 pollution in China: The mediating effect of industrial structure transformation. Int. J. Environ. Res. Public Health 2021, 18, 9107. [Google Scholar] [CrossRef]
  8. Xue, W.; Zhang, J.; Zhong, C.; Li, X.; Wei, J. Spatiotemporal PM2.5 variations and its response to the industrial structure from 2000 to 2018 in the Beijing-Tianjin-Hebei region. J. Clean. Prod. 2021, 279, 123742. [Google Scholar] [CrossRef]
  9. Li, X.; Liu, J.; Ni, P. The impact of the digital economy on CO2 emissions: A theoretical and empirical analysis. Sustainability 2021, 13, 7267. [Google Scholar] [CrossRef]
  10. Wang, Y.; Yao, L.; Xu, Y.; Sun, S.; Li, T. Potential heterogeneity in the relationship between urbanization and air pollution, from the perspective of urban agglomeration. J. Clean. Prod. 2021, 298, 126822. [Google Scholar] [CrossRef]
  11. Xu, W.; Wang, Y.; Sun, S.; Yao, L.; Fu, X. Spatiotemporal heterogeneity of PM2.5 and its driving difference comparison associated with urbanization in China’s multiple urban agglomerations. Environ. Sci. Pollut. Res. 2022, 29, 29689–29703. [Google Scholar] [CrossRef] [PubMed]
  12. Wang, T.; Song, H.; Wang, F.; Zhai, S.; Han, Z.; Wang, D.; Li, X.; Zhao, H.; Ma, R.; Zhang, G. Hysteretic effects of meteorological conditions and their interactions on particulate matter in Chinese cities. J. Clean. Prod. 2020, 274, 122926. [Google Scholar] [CrossRef]
  13. Chang, F.J.; Chang, L.C.; Kang, C.C.; Wang, Y.S.; Huang, A. Explore spatio-temporal PM2.5 features in northern Taiwan using machine learning techniques. Sci. Total Environ. 2020, 736, 139656. [Google Scholar] [CrossRef] [PubMed]
  14. Jiang, L.; He, S.; Cui, Y.; Zhou, H.; Kong, H. Effects of the socio-economic influencing factors on SO2 pollution in Chinese cities: A spatial econometric analysis based on satellite observed data. J. Environ. Manag. 2020, 268, 110667. [Google Scholar] [CrossRef]
  15. Yuan, W.; Sun, H.; Chen, Y.; Xia, X. Spatio-temporal evolution and spatial heterogeneity of influencing factors of SO2 emissions in Chinese cities: Fresh evidence from MGWR. Sustainability 2021, 13, 12059. [Google Scholar] [CrossRef]
  16. Ma, C.; Ju, T.; Wang, Q.; Li, F.; Zhang, Y.; Zhang, G. Spatiotemporal variations of tropospheric NO2 in Lanzhou for the period 2009–2018 based on satellite remote sensing. Atmos. Pollut. Res. 2021, 12, 206–216. [Google Scholar] [CrossRef]
  17. Liu, X.; Yi, G.; Zhou, X.; Zhang, T.; Lan, Y.; Yu, D.; Wen, B.; Hu, J. Atmospheric NO2 Distribution Characteristics and Influencing Factors in Yangtze River Economic Belt: Analysis of the NO2 Product of TROPOMI/Sentinel-5P. Atmosphere 2021, 12, 1142. [Google Scholar] [CrossRef]
  18. Chen, Y.; Li, H.; Karimian, H.; Li, M.; Fan, Q.; Xu, Z. Spatio-temporal variation of ozone pollution risk and its influencing factors in China based on Geodetector and Geospatial models. Chemosphere 2022, 302, 134843. [Google Scholar] [CrossRef]
  19. Duan, W.; Wang, X.; Cheng, S.; Wang, R.; Zhu, J. Influencing factors of PM2.5 and O3 from 2016 to 2020 based on DLNM and WRF-CMAQ. Environ. Pollut. 2021, 285, 117512. [Google Scholar] [CrossRef]
  20. Maffia, J.; Balsari, P.; Padoan, E.; Ajmone-Marsan, F.; Aimonino, D.R.; Dinuccio, E. Evaluation of particulate matter (PM10) emissions and its chemical characteristics during rotary harrowing operations at different forward speeds and levelling bar heights. Environ. Pollut. 2020, 265, 115041. [Google Scholar] [CrossRef]
  21. Li, X.; Pan, Y.; Mo, Z. Joint effects of several factors on cloud-to-ground lightning and rainfall in Nanning (China). Atmos. Res. 2018, 212, 23–32. [Google Scholar] [CrossRef]
  22. Wei, G.; Sun, P.; Jiang, S.; Shen, Y.; Liu, B.; Zhang, Z.; Ouyang, X. The driving influence of multi-dimensional urbanization on PM2.5 concentrations in Africa: New evidence from multi-source remote sensing data, 2000–2018. Int. J. Environ. Res. Public Health 2021, 18, 9389. [Google Scholar] [CrossRef] [PubMed]
  23. Fang, C.; Liu, H.; Wang, S. The coupling curve between urbanization and the eco-environment: China’s urban agglomeration as a case study. Ecol. Indic. 2021, 130, 108107. [Google Scholar] [CrossRef]
  24. Zhao, H.; Niu, Z.; Feng, X. Factors influencing improvements in air quality in Guanzhong cities of China, and variations therein for 2014–2020. Urban Clim. 2021, 38, 100877. [Google Scholar] [CrossRef]
  25. Han, X.; Fang, W.; Li, H.; Wang, Y.; Shi, J. Heterogeneity of influential factors across the entire air quality spectrum in Chinese cities: A spatial quantile regression analysis. Environ. Pollut. 2020, 262, 114259. [Google Scholar] [CrossRef]
  26. Li, X.; Yan, C.; Wang, C.; Ma, J.; Li, W.; Liu, J.; Liu, Y. PM2.5-bound elements in Hebei Province, China: Pollution levels, source apportionment and health risks. Sci. Total Environ. 2022, 806, 150440. [Google Scholar] [CrossRef]
  27. Karimi, B.; Shokrinezhad, B. Spatial variation of ambient PM2.5 and PM10 in the industrial city of Arak, Iran: A land-use regression. Atmos. Pollut. Res. 2021, 12, 101235. [Google Scholar] [CrossRef]
  28. Wu, W.; Zhang, M.; Ding, Y. Exploring the effect of economic and environment factors on PM2.5 concentration: A case study of the Beijing-Tianjin-Hebei region. J. Environ. Manag. 2020, 268, 110703. [Google Scholar] [CrossRef]
  29. Yang, X.; Zhang, T.; Zhang, Y.; Chen, H.; Sang, S. Global burden of COPD attributable to ambient PM2.5 in 204 countries and territories, 1990 to 2019: A systematic analysis for the Global Burden of Disease Study 2019. Sci. Total Environ. 2021, 796, 148819. [Google Scholar] [CrossRef] [PubMed]
  30. Zhang, N.; Zhao, K.; Yu, Y. The effect of environmental regulation on air pollution, productivity, and factor structure: A quasi-natural experiment evidence from China. Environ. Sci. Pollut. Res. 2020, 27, 20392–20409. [Google Scholar] [CrossRef]
  31. Marangon, D.; Traversi, D.; D’Agostino, A.M.; Gea, M.; Fontana, M.; Schilirò, T. The North-western Italy air quality monitoring network: Improving experience of PM2.5 assessment with mutagenicity assay. Environ. Res. 2021, 195, 110699. [Google Scholar] [CrossRef] [PubMed]
  32. Liu, H.; Cui, W.; Zhang, M. Exploring the causal relationship between urbanization and air pollution: Evidence from China. Sustain. Cities Soc. 2022, 80, 103783. [Google Scholar] [CrossRef]
  33. She, Q.; Cao, S.; Zhang, S.; Zhang, J.; Zhu, H.; Bao, J.; Meng, X.; Liu, M.; Liu, Y. The impacts of comprehensive urbanization on PM2.5 concentrations in the Yangtze River Delta, China. Ecol. Indic. 2021, 132, 108337. [Google Scholar] [CrossRef]
  34. Li, Y.; Yang, X.; Ran, Q.; Wu, H.; Irfan, M.; Ahmad, M. Energy structure, digital economy, and carbon emissions: Evidence from China. Environ. Sci. Pollut. Res. 2021, 28, 64606–64629. [Google Scholar] [CrossRef] [PubMed]
  35. Mo, Y.; Booker, D.; Zhao, S.; Tang, J.; Jiang, H.; Shen, J.; Chen, D.; Li, J.; Jones, K.; Zhang, G. The application of land use regression model to investigate spatiotemporal variations of PM2.5 in Guangzhou, China: Implications for the public health benefits of PM2.5 reduction. Sci. Total Environ. 2021, 778, 146305. [Google Scholar] [CrossRef] [PubMed]
  36. Liu, H.; Fang, C.; Zhang, X.; Wang, Z.; Bao, C.; Li, F. The effect of natural and anthropogenic factors on haze pollution in Chinese cities: A spatial econometrics approach. J. Clean. Prod. 2017, 165, 323–333. [Google Scholar] [CrossRef]
  37. Zhou, W.; Wu, X.; Ding, S.; Ji, X.; Pan, W. Predictions and mitigation strategies of PM2.5 concentration in the Yangtze River Delta of China based on a novel nonlinear seasonal grey model. Environ. Pollut. 2021, 276, 116614. [Google Scholar] [CrossRef]
  38. Sun, W.; Xu, Z. A novel hourly PM2.5 concentration prediction model based on feature selection, training set screening, and mode decomposition-reorganization. Sustain. Cities Soc. 2021, 75, 103348. [Google Scholar] [CrossRef]
  39. Wyche, K.P.; Cordell, R.L.; Smallbone, K.L.; Lyons, P.; Hama, S.M.L.; Monks, P.S.; Staelens, J.; Hofman, J.; Stroobants, C.; Roekens, E.; et al. The spatio-temporal evolution of black carbon in the North-West European ‘air pollution hotspot’. Atmos. Environ. 2020, 243, 117874. [Google Scholar] [CrossRef]
  40. Wu, J.; Wang, Y.; Liang, J.; Yao, F. Exploring common factors influencing PM2.5 and O3 concentrations in the Pearl River Delta: Tradeoffs and synergies. Environ. Pollut. 2021, 285, 117138. [Google Scholar] [CrossRef]
  41. Fang, X.; Fan, Q.; Liao, Z.; Xie, J.; Xu, X.; Fan, S. Spatial-temporal characteristics of the air quality in the Guangdong−Hong Kong−Macau Greater Bay Area of China during 2015–2017. Atmos. Environ. 2019, 210, 14–34. [Google Scholar] [CrossRef]
  42. Hao, Y.; Zheng, S.; Zhao, M.; Wu, H.; Guo, Y.; Li, Y. Reexamining the relationships among urbanization, industrial structure, and environmental pollution in China−New evidence using the dynamic threshold panel model. Energy Rep. 2020, 6, 28–39. [Google Scholar] [CrossRef]
  43. Liu, X.; Zou, B.; Feng, H.; Liu, N.; Zhang, H. Anthropogenic factors of PM2.5 distributions in China’s major urban agglomerations: A spatial-temporal analysis. J. Clean. Prod. 2020, 264, 121709. [Google Scholar] [CrossRef]
  44. Li, Z.; Li, N.; Wen, H. Digital economy and environmental quality: Evidence from 217 cities in China. Sustainability 2021, 13, 8058. [Google Scholar] [CrossRef]
  45. Jia, L.; Hu, X.; Zhao, Z.; He, B.; Liu, W. How environmental regulation, digital development and technological innovation affect China’s green economy performance: Evidence from dynamic thresholds and system GMM panel data approaches. Energies 2022, 15, 884. [Google Scholar] [CrossRef]
  46. Guo, F.; Wang, Z.; Ji, S.; Lu, Q. Influential nodes identification in the air pollution spatial correlation weighted networks and collaborative governance: Taking China’s three urban agglomerations as examples. Int. J. Environ. Res. Public Health 2022, 19, 4461. [Google Scholar] [CrossRef]
  47. Shi, X.; Zheng, Y.; Lei, Y.; Xue, W.; Yan, G.; Liu, X.; Cai, B.; Tang, D.; Wang, J. Air quality benefits of achieving carbon neutrality in China. Sci. Total Environ. 2021, 795, 148784. [Google Scholar] [CrossRef]
  48. Han, D.; Ding, Y.; Shi, Z.; He, Y. The impact of digital economy on total factor carbon productivity: The threshold effect of technology accumulation. Environ. Sci. Pollut. Res. 2022, 1–16. [Google Scholar] [CrossRef]
  49. Harris, R.; Tzavalis, E. Inference for unit roots in dynamic panels where the time dimension is fixed. J. Econom. 1999, 91, 201–226. [Google Scholar] [CrossRef]
  50. Lin, H.; Pan, T.; Chen, S. Comprehensive evaluation of urban air quality using the relative entropy theory and improved TOPSIS method. Air Qual. Atmos. Health 2021, 14, 251–258. [Google Scholar] [CrossRef]
  51. Wang, X.; Sun, X.; Zhang, H.; Xue, C. Digital economy development and urban green innovation CA-pability: Based on panel data of 274 prefecture-level cities in China. Sustainability 2022, 14, 2921. [Google Scholar] [CrossRef]
  52. Chen, Z.; Yu, B.; Yang, C.; Zhou, Y.; Yao, S.; Qian, X.; Wang, C.; Wu, B.; Wu, J. An extended time series (2000–2018) of global NPP-VIIRS-like nighttime light data from a cross-sensor calibration. Earth Syst. Sci. Data 2021, 13, 889–906. [Google Scholar] [CrossRef]
  53. Hering, L.; Poncet, S. Environmental policy and exports: Evidence from Chinese cities. J. Environ. Econ. Manag. 2014, 68, 296–318. [Google Scholar] [CrossRef]
  54. Getis, A.; Ord, J.K. The Analysis of Spatial Association by Use of Distance Statistics. Perspectives on Spatial Data Analysis; Springer: Berlin/Heidelberg, Germany, 2010; pp. 127–145. [Google Scholar] [CrossRef]
  55. Anselin, L. Local indicators of spatial association—LISA. Geogr. Anal. 1995, 27, 93–115. [Google Scholar] [CrossRef]
  56. Liu, Y.; Yang, Y.; Li, H.; Zhong, K. Digital economy development, industrial structure upgrading and green total factor productivity: Empirical evidence from China’s cities. Int. J. Environ. Res. Public Health 2022, 19, 2414. [Google Scholar] [CrossRef]
  57. Hausman, J. Specification Tests in Econometrics. Econometrica 1978, 46, 1251–1271. [Google Scholar] [CrossRef] [Green Version]
  58. Wei, W.; Li, J.; Chen, B.; Wang, M.; Zhang, P.; Guan, D.; Meng, J.; Qian, H.; Cheng, Y.; Kang, C.; et al. Embodied greenhouse gas emissions from building China’s large-scale power transmission infrastructure. Nat. Sustain. 2021, 4, 739–747. [Google Scholar] [CrossRef]
  59. Tian, Y.; Wang, Y.; Hang, Y.; Wang, Q. The two-stage factors driving changes in China’s industrial SO2 emission intensity: A production-theoretical decomposition analysis. Sci. Total Environ. 2022, 814, 152426. [Google Scholar] [CrossRef]
  60. Wang, H.; Li, J. Dual effects of environmental regulation on PM2.5 pollution: Evidence from 280 cities in China. Environ. Sci. Pollut. Res. 2021, 28, 47213–47226. [Google Scholar] [CrossRef]
  61. Li, M.; Guan, S. Does China’s state-owned sector lead industrial transformation and upgrading? J. Clean. Prod. 2022, 338, 130412. [Google Scholar] [CrossRef]
  62. Song, M.; Zheng, C.; Wang, J. The role of digital economy in China’s sustainable development in a post-pandemic environment. J. Enterp. Inf. Manag. 2022, 35, 58–77. [Google Scholar] [CrossRef]
  63. Xiong, S.; Ma, X.; Ji, J. The impact of industrial structure efficiency on provincial industrial energy efficiency in China. J. Clean. Prod. 2019, 215, 952–962. [Google Scholar] [CrossRef]
  64. Gao, A.; Wang, J.; Poetzscher, J.; Li, S.; Gao, B.; Wang, P.; Luo, J.; Fang, X.; Li, J.; Hu, J.; et al. Coordinated health effects attributable to particulate matter and other pollutants exposures in the North China Plain. Environ. Res. 2022, 208, 112671. [Google Scholar] [CrossRef]
  65. Zheng, H.; Zhou, J.; Gao, X.; Xi, X.; Liu, D.; Zhao, Y. Global impacts of the topological structure of industrial driving networks on energy intensity. Energy 2021, 225, 120192. [Google Scholar] [CrossRef]
  66. Wei, W.; Xin, Z.; Geng, Y.; Li, J.; Yao, M.; Guo, Y.; Zhang, P. The reallocation effect of China’s provincial power transmission and trade on regional heavy metal emissions. IScience 2021, 24, 102529. [Google Scholar] [CrossRef] [PubMed]
  67. Ren, D.; Guo, X.; Li, C. Research on big data analysis model of multi energy power generation considering pollutant emission−Empirical analysis from Shanxi Province. J. Clean. Prod. 2021, 316, 128154. [Google Scholar] [CrossRef]
  68. Li, J.; Lei, J.; Li, S.; Yang, Z.; Tong, Y.; Zhang, S.; Duan, Z. Spatiotemporal analysis of the relationship between urbanization and the eco-environment in the Kashgar metropolitan area, China. Ecol. Indic. 2022, 135, 108524. [Google Scholar] [CrossRef]
  69. Luo, X.; Sun, K.; Li, L.; Wu, S.; Yan, D.; Fu, X.; Luo, H. Impacts of urbanization process on PM2.5 pollution in “2+26” cities. J. Clean. Prod. 2021, 284, 124761. [Google Scholar] [CrossRef]
  70. Li, Z.; Li, C. How industrial upgrading can improve China’s air quality: Empirical analysis based on multilevel growth model. Environ. Sci. Pollut. Res. 2022, 1–11. [Google Scholar] [CrossRef]
  71. Ai, H.; Wang, M.; Zhang, Y.; Zhu, T. How does air pollution affect urban innovation capability? Evidence from 281 cities in China. Struct. Change Econ. Dyn. 2022, 61, 166–178. [Google Scholar] [CrossRef]
  72. Shi, L. Industrial Structure Changes, Spatial spillover and economic growth in the Yangtze River Delta. J. Coast. Res. 2020, 107, 377–382. [Google Scholar] [CrossRef]
  73. Zhang, G.; Zhang, P.; Zhang, Z.; Li, J. Impact of environmental regulations on industrial structure upgrading: An empirical study on Beijing-Tianjin-Hebei region in China. J. Clean. Prod. 2019, 238, 117848. [Google Scholar] [CrossRef]
Figure 1. Temporal evolution of air pollution in China during 1998–2019.
Sustainability 14 08967 g001
Figure 2. The spatial pattern of air pollution in China during 2013–2020. (a) The spatial pattern of China’s PM2.5 concentration in 2013. (b) The spatial pattern of China’s PM2.5 concentration in 2020. (c) The spatial pattern of China’s SO2 concentration in 2013. (d) The spatial pattern of China’s SO2 concentration in 2020. (e) The spatial pattern of China’s NO2 concentration in 2013. (f) The spatial pattern of China’s NO2 concentration in 2020.
Sustainability 14 08967 g002
Figure 3. Local spatial autocorrelation of air pollution in China. (a) Local spatial autocorrelation of China’s PM2.5 concentration in 2013. (b) Local spatial autocorrelation of China’s PM2.5 concentration in 2020. (c) Local spatial autocorrelation of China’s SO2 concentration in 2013. (d) Local spatial autocorrelation of China’s SO2 concentration in 2020. (e) Local spatial autocorrelation of China’s NO2 concentration in 2013. (f) Local spatial autocorrelation of China’s NO2 concentration in 2020.
Sustainability 14 08967 g003
Table 1. Descriptive statistics and stationarity test of variables.
VariablesSamplesMeanStandard
Deviation
MinimumMaximumHT TestConclusion
Statisticp
lnPM2.522883.6410.3651.1534.6900.1670.000smooth
lnSO222882.8120.5720.3334.5040.9250.000smooth
lnNO222883.2190.3720.3393.9860.9760.017smooth
Ind22881.1290.6820.20712.9370.9330.000smooth
Dige22880.1010.0550.0170.820−0.2810.000smooth
lnVGDP228810.8170.5659.03713.0680.8980.000smooth
ln2 VGDP2288117.32012.29981.664170.7610.9010.000smooth
lnPU22884.0010.2583.0324.6050.9270.000smooth
lnHAI228810.1880.9767.71313.1040.1660.000smooth
lnPD22885.7320.9421.7738.2490.0070.000smooth
NDVI22880.7170.1520.0660.905−0.3240.000smooth
lnPRCP22886.8520.4835.2927.9170.9480.000smooth
VC22887.4820.64070.0008.8120.9090.000smooth
Table 2. Global Moran’s I of air pollution during 2013–2020.
YearPM2.5 ConcentrationSO2 ConcentrationNO2 Concentration
Moran’s Iz Valuep ValueMoran’s Iz Valuep ValueMoran’s Iz Valuep Value
20130.82024.0310.0010.87826.1280.0010.81524.0520.001
20140.79223.0960.0010.87225.8870.0010.80623.8550.001
20150.82723.8970.0010.85125.2290.0010.80523.8380.001
20160.80524.0800.0010.83925.1100.0010.80423.5700.001
20170.80923.3470.0010.80924.0800.0010.80523.7260.001
20180.78222.9050.0010.77122.8330.0010.81023.8910.001
20190.81524.9020.0010.75021.7760.0010.79823.7960.001
20200.77523.5710.0010.71320.5040.0010.80923.9310.001
Table 3. Fixed effect regression results of industrial upgrading effects on air pollution.
VariablesInd as a Core Explanatory VariableDige as a Core Explanatory Variable
PM2.5 ConcentrationSO2 ConcentrationNO2 ConcentrationPM2.5 ConcentrationSO2 ConcentrationNO2 Concentration
Ind−0.039 ***
(0.006)
−0.033 ***
(0.013)
−0.014 ***
(0.005)
---
Dige---−1.362 ***
(0.073)
−3.071 ***
(0.167)
−0.387 **
(0.054)
lnVGDP0.458 **
(0.165)
1.045 ***
(0.378)
0.540 ***
(0.150)
0.342 **
(0.154)
0.689 **
(0.350)
0.371 ***
(0.112)
ln2 VGDP−0.024 ***
(0.008)
−0.054 ***
(0.017)
−0.024 ***
(0.007)
−0.018 ***
(0.007)
−0.036 **
(0.016)
−0.016 ***
(0.005)
lnPU−0.374 ***
(0.033)
−1.006 ***
(0.075)
−0.086 ***
(0.023)
−0.323 ***
(0.030)
−0.835 ***
(0.069)
−0.069 ***
(0.022)
lnHAI−0.390 ***
(0.012)
−0.977 ***
(0.028)
−0.073 ***
(0.009)
−0.328 ***
(0.012)
−0.811 ***
(0.028)
−0.058 ***
(0.008)
lnPD−0.036 **
(0.016)
−0.125 ***
(0.036)
0.027 **
(0.012)
−0.001
(0.014)
−0.040
(0.033)
0.039 ***
(0.010)
NDVI0.346 ***
(0.031)
0.491 ***
(0.071)
0.246 ***
(0.022)
0.270 ***
(0.029)
0.269 ***
(0.066)
0.229 ***
(0.021)
lnPRCP−0.203 ***
(0.017)
−0.148 ***
(0.039)
−0.117 ***
(0.012)
−0.206 ***
(0.016)
−0.154 ***
(0.036)
−0.117 ***
(0.012)
VC−0.029 ***
(0.009)
−0.130 ***
(0.021)
−0.036 ***
(0.006)
−0.021 ***
(0.008)
−0.084 ***
(0.019)
−0.030 ***
(0.006)
cons8.645 ***
(0.865)
14.220 ***
(1.982)
1.991 **
(0.851)
8.235 ***
(0.810)
13.193 ***
(1.835)
2.589 ***
(0.592)
R20.7130.7120.2640.7480.7540.282
F statistic44.3228.13127.7848.5431.06137.12
N228822882288228822882288
Note: Standard errors are in parentheses; “**”, and “***” indicate significance at the levels of 0.05, and 0.01, respectively; “-” indicates no item.
Table 4. Fixed effect regression results of the impact of industrial upgrading on air pollution in different regions.
VariablesKey Cities of Environmental ProtectionYangtze River Delta“2 + 26” Cities in Beijing–Tianjin–Hebei and Its Surrounding Areas
Ind as a Core Explanatory VariableDige as a Core Explanatory VariableInd as a Core Explanatory VariableDige as a Core Explanatory VariableInd as a Core Explanatory VariableDige as a Core Explanatory Variable
Ind−0.064 ***
(0.011)
-−0.188 ***
(0.032)
-−0.101 ***
(0.024)
-
Dige-−1.119 ***
(0.082)
-−1.003 ***
(0.163)
-−1.164 ***
(0.054)
lnVGDP0.622 ***
(0.221)
0.563 ***
(0.378)
4.113 ***
(0.411)
3.161 ***
(0.439)
1.085 ***
(0.446)
0.989 **
(0.447)
ln2 VGDP−0.032 ***
(0.010)
−0.029 ***
(0.009)
−0.188 ***
(0.019)
−0.145 ***
(0.020)
−0.050 ***
(0.020)
−0.045 **
(0.020)
lnPU−0.318 ***
(0.049)
−0.332 ***
(0.045)
−0.479 ***
(0.124)
−0.435 ***
(0.124)
−0.507 ***
(0.141)
−0.560 ***
(0.138)
lnHAI−0.422 ***
(0.019)
−0.364 ***
(0.018)
−0.419 ***
(0.043)
−0.420 ***
(0.043)
−0.323 ***
(0.041)
−0.303 ***
(0.042)
lnPD−0.053 ***
(0.019)
−0.025
(0.018)
−0.134 ***
(0.044)
−0.102 **
(0.045)
−0.102
(0.082)
0.013
(0.088)
NDVI0.299 ***
(0.043)
0.220 ***
(0.041)
0.426 ***
(0.099)
0.305 ***
(0.101)
0.505 ***
(0.105)
0.423 ***
(0.021)
lnPRCP−0.210 ***
(0.022)
−0.205 ***
(0.021)
−0.194 ***
(0.043)
−0.205 ***
(0.043)
−0.035
(0.058)
−0.159
(0.057)
VC0.007
(0.010)
−0.020**
(0.010)
−0.087
(0.056)
−0.046
(0.057)
−0.179 ***
(0.033)
−0.142 ***
(0.034)
cons8.177 ***
(1.145)
8.034 ***
(1.064)
−9.337 ***
(0.851)
−4.649 **
(2.254)
5.821 **
(2.557)
5.488 ***
(2.528)
R20.7450.7860.8160.8180.8610.863
F statistic32.9343.9131.2937.5329.6226.14
N13441344328328224224
Note: Standard errors are in parentheses; “**”, and “***” indicate significance at the levels of 0.05, and 0.01, respectively; “-” indicates no item.
Publisher’s Note: MDPI stays neutral with regard to jurisdictional claims in published maps and institutional affiliations.

