1. Introduction
The “carbon peaking and carbon neutrality” goal reflects China’s active responsibilities and feelings of being a major country responsible for promoting the construction of a community with a shared future for mankind. With recent rapid economic growth, environmental problems caused by the excessive emission of carbon dioxide and other greenhouse gases, which has in turn been caused by the massive consumption of traditional energy, have become increasingly serious [
1,
2]. According to statistics, China’s greenhouse gas emissions reached the equivalent of 14 billion tons of carbon dioxide in 2019. The average annual growth rate of China’s total greenhouse gas emissions in the ten years from 2010 to 2019 was about 2.3%, which was higher than the global average, and the total greenhouse gas emissions increased by about 24%, of which carbon dioxide emissions increased by 26%. The World Organization for Sustainable Development put forward the concept of “environmental efficiency” in 1992 to evaluate the environmental costs of economic growth, which has become an effective indicator for the coordinated development of both the economy and the environment [
3,
4]. At the same time, new energy is considered to be an effective means to reduce carbon dioxide emissions and the environmental pollution that is caused by traditional energy [
5]. The development of the related new energy vehicle industry is now a major strategy for China to meet the severe challenge of oil shortage and seize a new source of economic high ground. The high-performance energy storage devices that are applied in this industry have many advantages, such as environmental compatibility, long lives, and lower costs. They are an “important bridge” that the new energy vehicle industry can use to promote environmental efficiency. Therefore, over recent years, China has made efforts to promote the new energy industry and implement the concept of green development in order to realize low-carbon development and the “carbon peaking, carbon neutrality” goal.
Existing research has shown that the new energy industry has begun to agglomerate in some areas of China. By October 2021, the installed capacity of wind power and solar power generation that was connected to the grid in China reached 300 million kilowatts and 282 million kilowatts, respectively. The goal of the “Carbon Peaking Action Plan before 2030” requires the total installed capacity of wind power and solar power generation to reach more than 1.2 billion kilowatts, which means that China’s new energy industry still has huge room for development and potential for agglomeration development. The development of environmental efficiency in China is currently at a bottleneck and lacks growth momentum. The new energy industry has a typical low-carbon characteristic and its agglomeration would inevitably promote improvements in environmental efficiency [
6]. However, in the early stages of the agglomeration of the new energy industry, significant investments in research and development are needed; therefore, there is a certain lag in the technology spillover effects [
7,
8]. In addition, the scale effect plays a dominant role in the expansion of production capacity, resulting in a resource consumption rate that is faster than the speed of resource regeneration and the carrying capacity of the environment, which is not conducive to environmental efficiency [
9]. When the agglomeration of the new energy industry reaches a mature stage, the technology spillover effects become more obvious and promote the development of ecological technology, thereby improving the environment. Therefore, could the agglomeration of China’s new energy industry promote environmental efficiency? If so, are there spatially differentiated features? Is there a nonlinear relationship within the process? What is the mechanism of action? Answering these questions would be significant for the stable development of China’s new energy industry and the realization of the “dual carbon” goal.
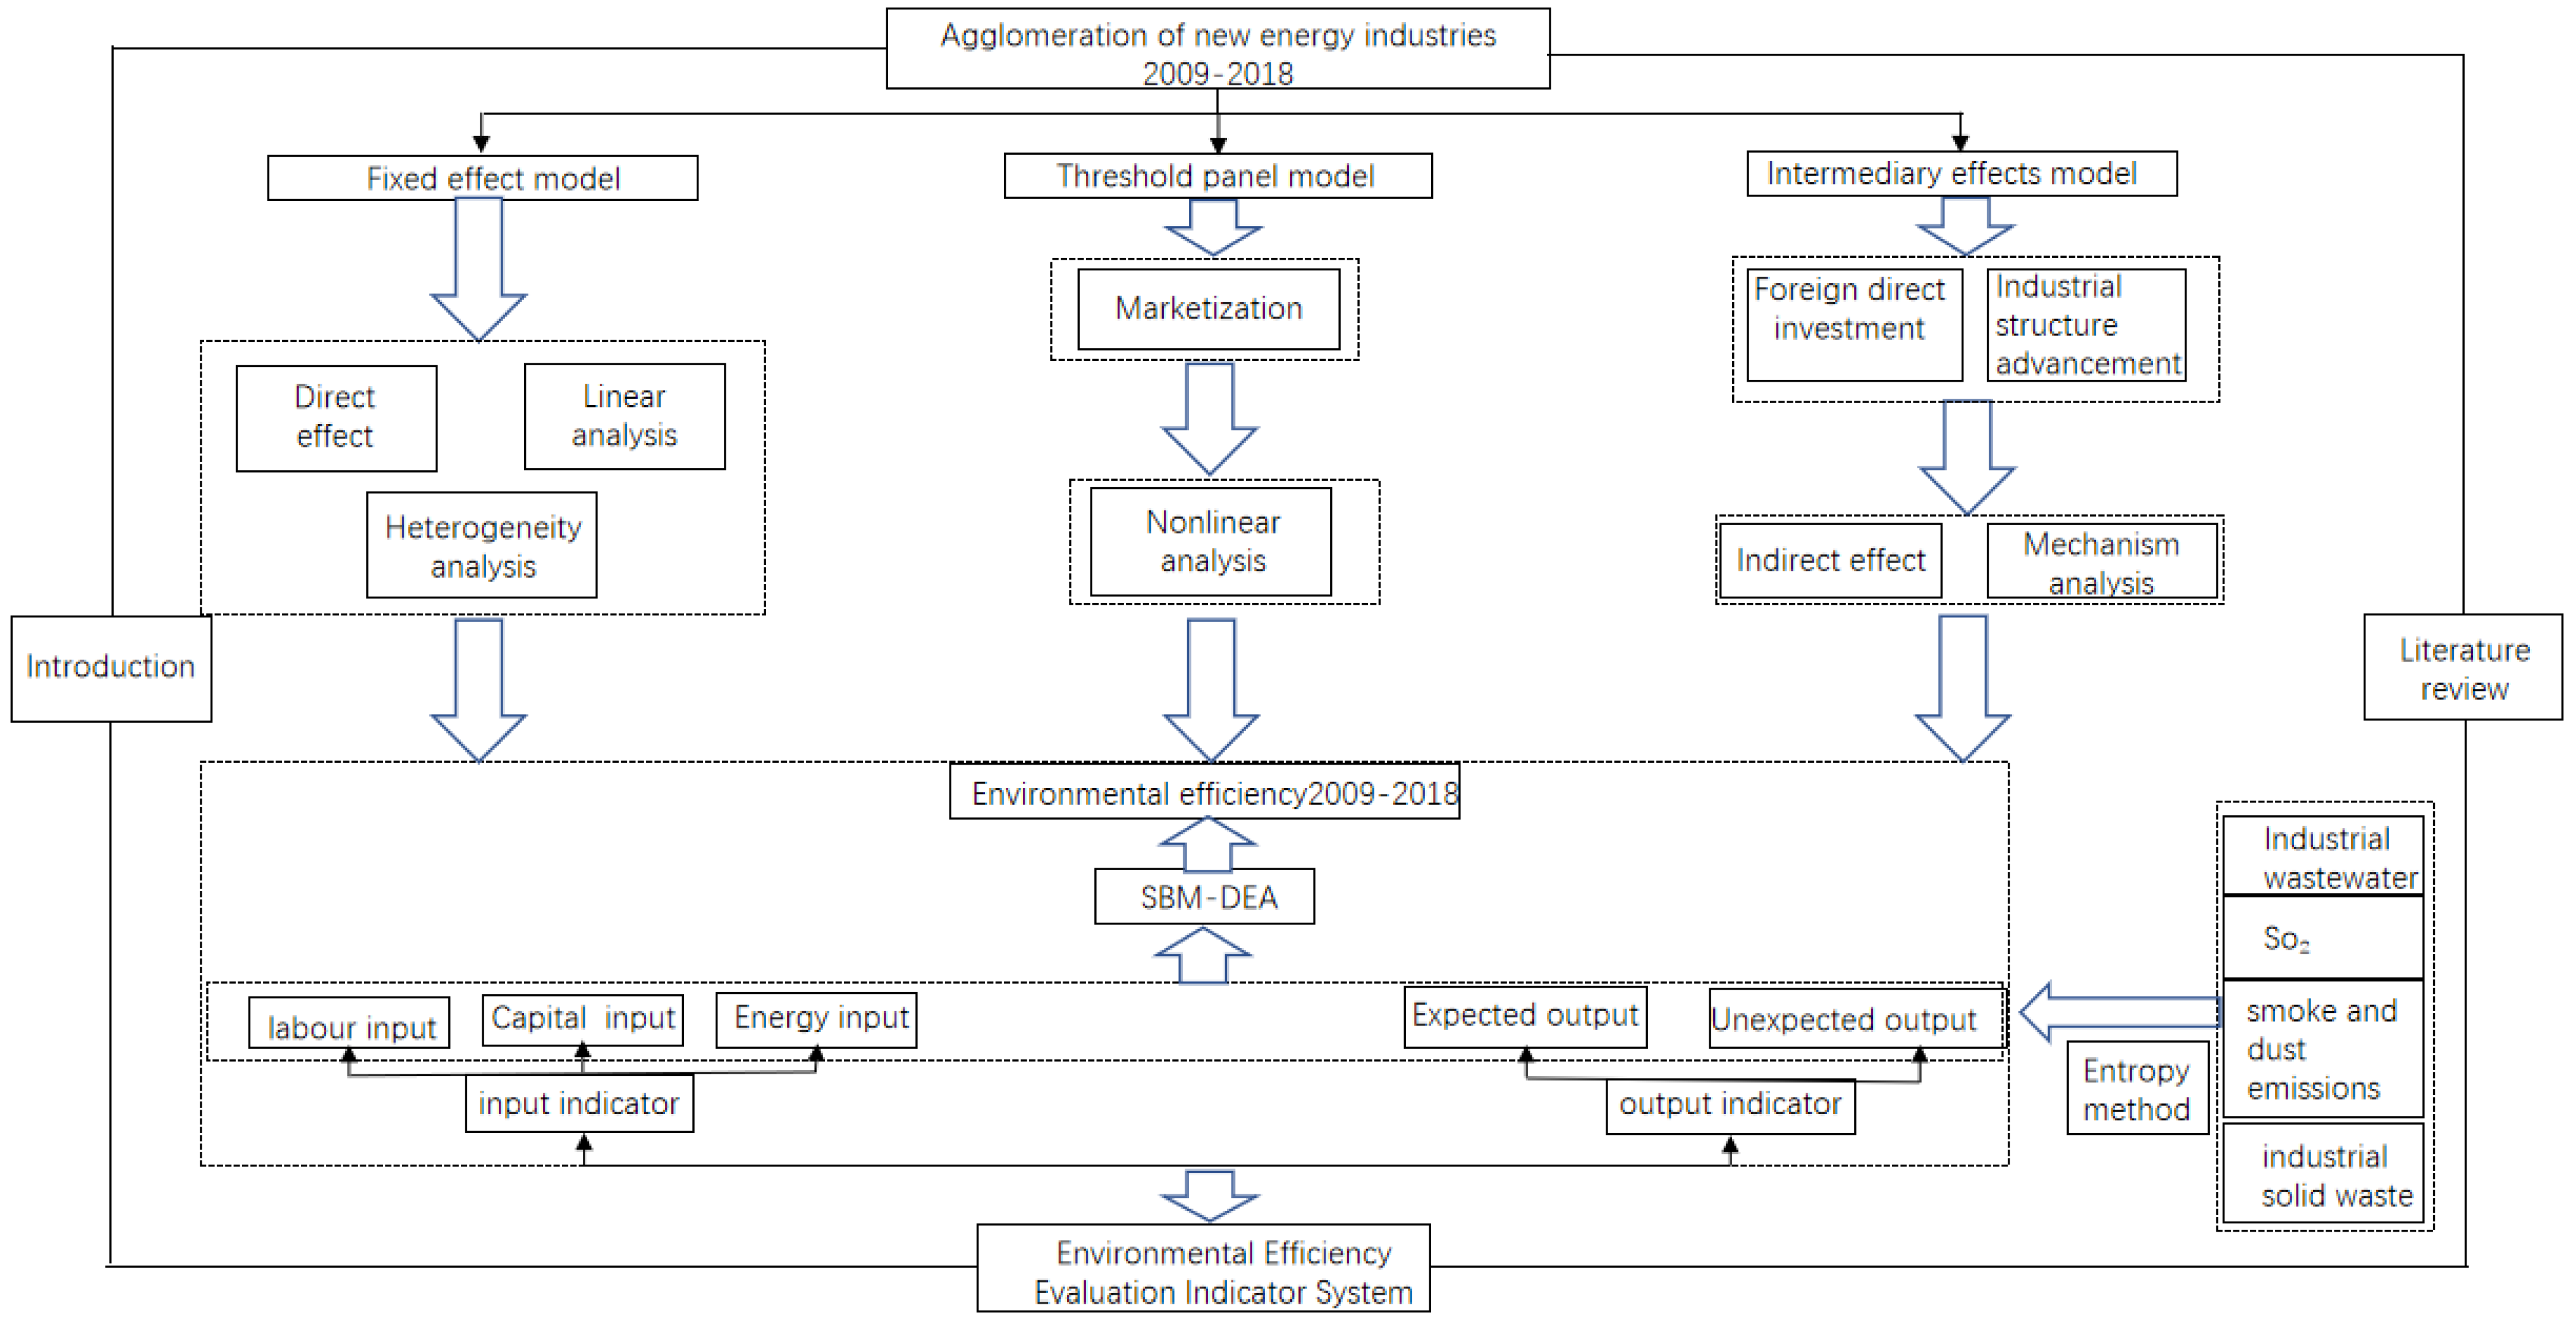
The possible marginal contributions of this paper are as follows: (1) this study adopted the SBM-DEA model to measure environmental efficiency and analyze the spatial distribution characteristics of the agglomeration of the new energy industry; (2) from the perspective of industrial agglomeration, this study explored the linear relationship between the agglomeration of the new energy industry and environmental efficiency; (3) the Hansen model was used to explore the nonlinear relationship, using the marketization level as a threshold variable; (4) from the two perspectives of industrial structure advancement and foreign direct investment, the impact mechanisms were examined using the mediation effect model.
The structure of the rest of the article is arranged as follows: The
Section 2 is a literature review. The
Section 3 theoretically analyzes the level of marketization as an external factor from the two perspectives of foreign direct investment and industrial structure advancement. The
Section 4 is a description of the variables. The
Section 5 presents the empirical results and analysis and
Section 6 presents the results of a robustness test.
Section 7 is a further analysis of the mediation effects and
Section 8 summarizes our conclusions and puts forward corresponding policy recommendations. The specific research framework is shown in
Figure 1.
2. Literature Review
Since China promulgated the “Decision on Accelerating the Cultivation and Development of Strategic Emerging Industries” in 2010, scholars have begun to gradually pay attention to the new energy industry as one of the strategic emerging industries. Research on the agglomeration of the new energy industry and environmental efficiency mainly focuses on the following aspects:
(1) Measurement and influencing factors of the development and agglomeration of the new energy industry.
Early research on the new energy industry mainly focused on the factors affecting the development of the new energy industry. Scholars mainly focused on policy making [
10,
11,
12,
13], financial support [
14] and other aspects [
15,
16,
17]. With the continuous development of the new energy industry, related research has expanded to include the agglomeration of the new energy industry, mainly focusing on measurement methods and influencing factors. Li and Long used the Gini coefficient and location entropy to measure the agglomeration level of China’s new energy industry from 2003 to 2012, and further explored the spatial effect [
18]. Guo and Shen further added the market concentration of the industry, the Herfindahl index and the N index for a more comprehensive analysis and came to the conclusion that the new energy industry has agglomerated in China [
19].
In addition, regarding the influencing factors of industrial agglomeration, existing research considers factors such as regional specialization [
20], and other aspects. A typical example is Qiu et al. taking the EU’s new energy industry as the research object, and the results show that policy coefficients, energy dependence and energy prices will affect the agglomeration of new energy industries [
21]. Wang et al. measured the location entropy and conducted cluster analysis and spatial autocorrelation analysis [
22]. The study found that the spatial differences in the agglomeration level of China’s new energy industry are not randomly generated but depend on the level of economic development and industrial foundation, resource advantages and other factors.
(2) Measurement and influencing factors of environmental efficiency.
The concept of environmental efficiency was first proposed by Fare et al. [
23]. It is one of the important indicators used for measuring the standards for the ecological environment. The related research mainly focuses on the measurement method and influencing factors [
22]. Most scholars use the DEA model to measure environmental efficiency [
24,
25,
26]. The evaluation of environmental efficiency based on the traditional DEA method cannot eliminate the influence of random errors and external environmental factors. Some scholars choose three-stage DEA to solve the random error problem or SBM-DEA to consider undesired output.
In addition, the influencing factors of environmental efficiency are more abundant. Existing research studies use economic scale [
27], population scale [
28], industrial structure [
29,
30], Internet development [
31] and other aspects to explore the influencing factors of environmental efficiency [
32], or green total factor energy efficiency. Yang et al. explored the effect of urban agglomeration on environmental efficiency in northeast China based on the DEA model [
33]. Feng et al. investigated the internal impact mechanism of industrial agglomeration on environmental efficiency [
34]. Mya et al. further concluded that upgrading the industrial structure, urbanization, and environmental pollution control, as well as decreasing the proportion of coal in energy consumption, are all rational solutions for improving China’s environmental efficiency [
35].
(3) The research on the relationship between industrial agglomeration and the environment.
As a kind of regional economic behavior, there are many research studies on the relationship between industrial agglomeration and the environment, which can be roughly divided into the viewpoints discussed below.
Some scholars believe that industrial agglomeration can reduce the deterioration of the environment. New economic geography believes that the external economy is the cause of industrial agglomeration, and the “technology spillover effect” is one of the essences of the external economy, which brings about the improvement of clean technology research and development efficiency and promotes the level of regional pollution control. Xu used a bilateral stochastic frontier model to measure the net effect of industrial agglomeration on the environment on the basis of considering externalities [
36]. The results show that industrial agglomeration can effectively reduce urban pollution. Some scholars have reached similar conclusions [
37,
38].
However, there are scholars who object to this, believing that industrial agglomeration will exacerbate environmental pollution. Wang and Nie took the development zone as the research object and argued that the development zone would significantly deteriorate the water quality of the surrounding rivers [
39]. Wei and Hou believe that the concentration of diversified industries will inhibit the level of green development in the region [
40]. Yin et al. used the spatial Durbin model to analyze how agricultural industrial agglomeration has a significant negative impact on agricultural green total factor productivity and has obvious spatial spillover effects [
41].
In addition, some scholars believe that there is a nonlinear or uncertain relationship between industrial agglomeration and environmental pollution. Yan et al. believe that the agglomeration of manufacturing industries in the short term is conducive to reducing environmental pollution, and there is no necessary causal relationship in the long run [
42]. Sun et al. found that the relationship between industrial agglomeration and environmental performance is related to environmental regulation [
43].
With the continuous development of the new energy industry, scholars pay attention to the new energy industry’s improvement effect on the environment [
44]. At present, the researchers generally adopt the model derived from the DEA model to measure the environmental efficiency and use the location entropy to measure the agglomeration level of the new energy industry. They mainly found that whether industrial agglomeration can improve the environment is affected by the development stage of industrial agglomeration. At the same time, China’s new energy industry has begun to agglomerate, and due to its low-carbon characteristics, theoretically, it can effectively improve the environment. However, there are few existing studies to empirically investigate the linear and non-linear relationship between the agglomeration of the new energy industry and environmental efficiency.
In view of this, this paper will explore the linear relationship and nonlinear characteristics of the agglomeration of the new energy industry and environmental efficiency, and will preliminarily explore the mechanism of action.
3. Mechanism Analysis
In this section, we will analyze the direct mechanism of the agglomeration of the new energy industry on environmental efficiency, the indirect mechanism of the agglomeration of the new energy industry on environmental efficiency, and the threshold mechanism on three aspects in turn.
3.1. The Direct Mechanism of the Agglomeration of the New Energy Industry on Environmental Efficiency
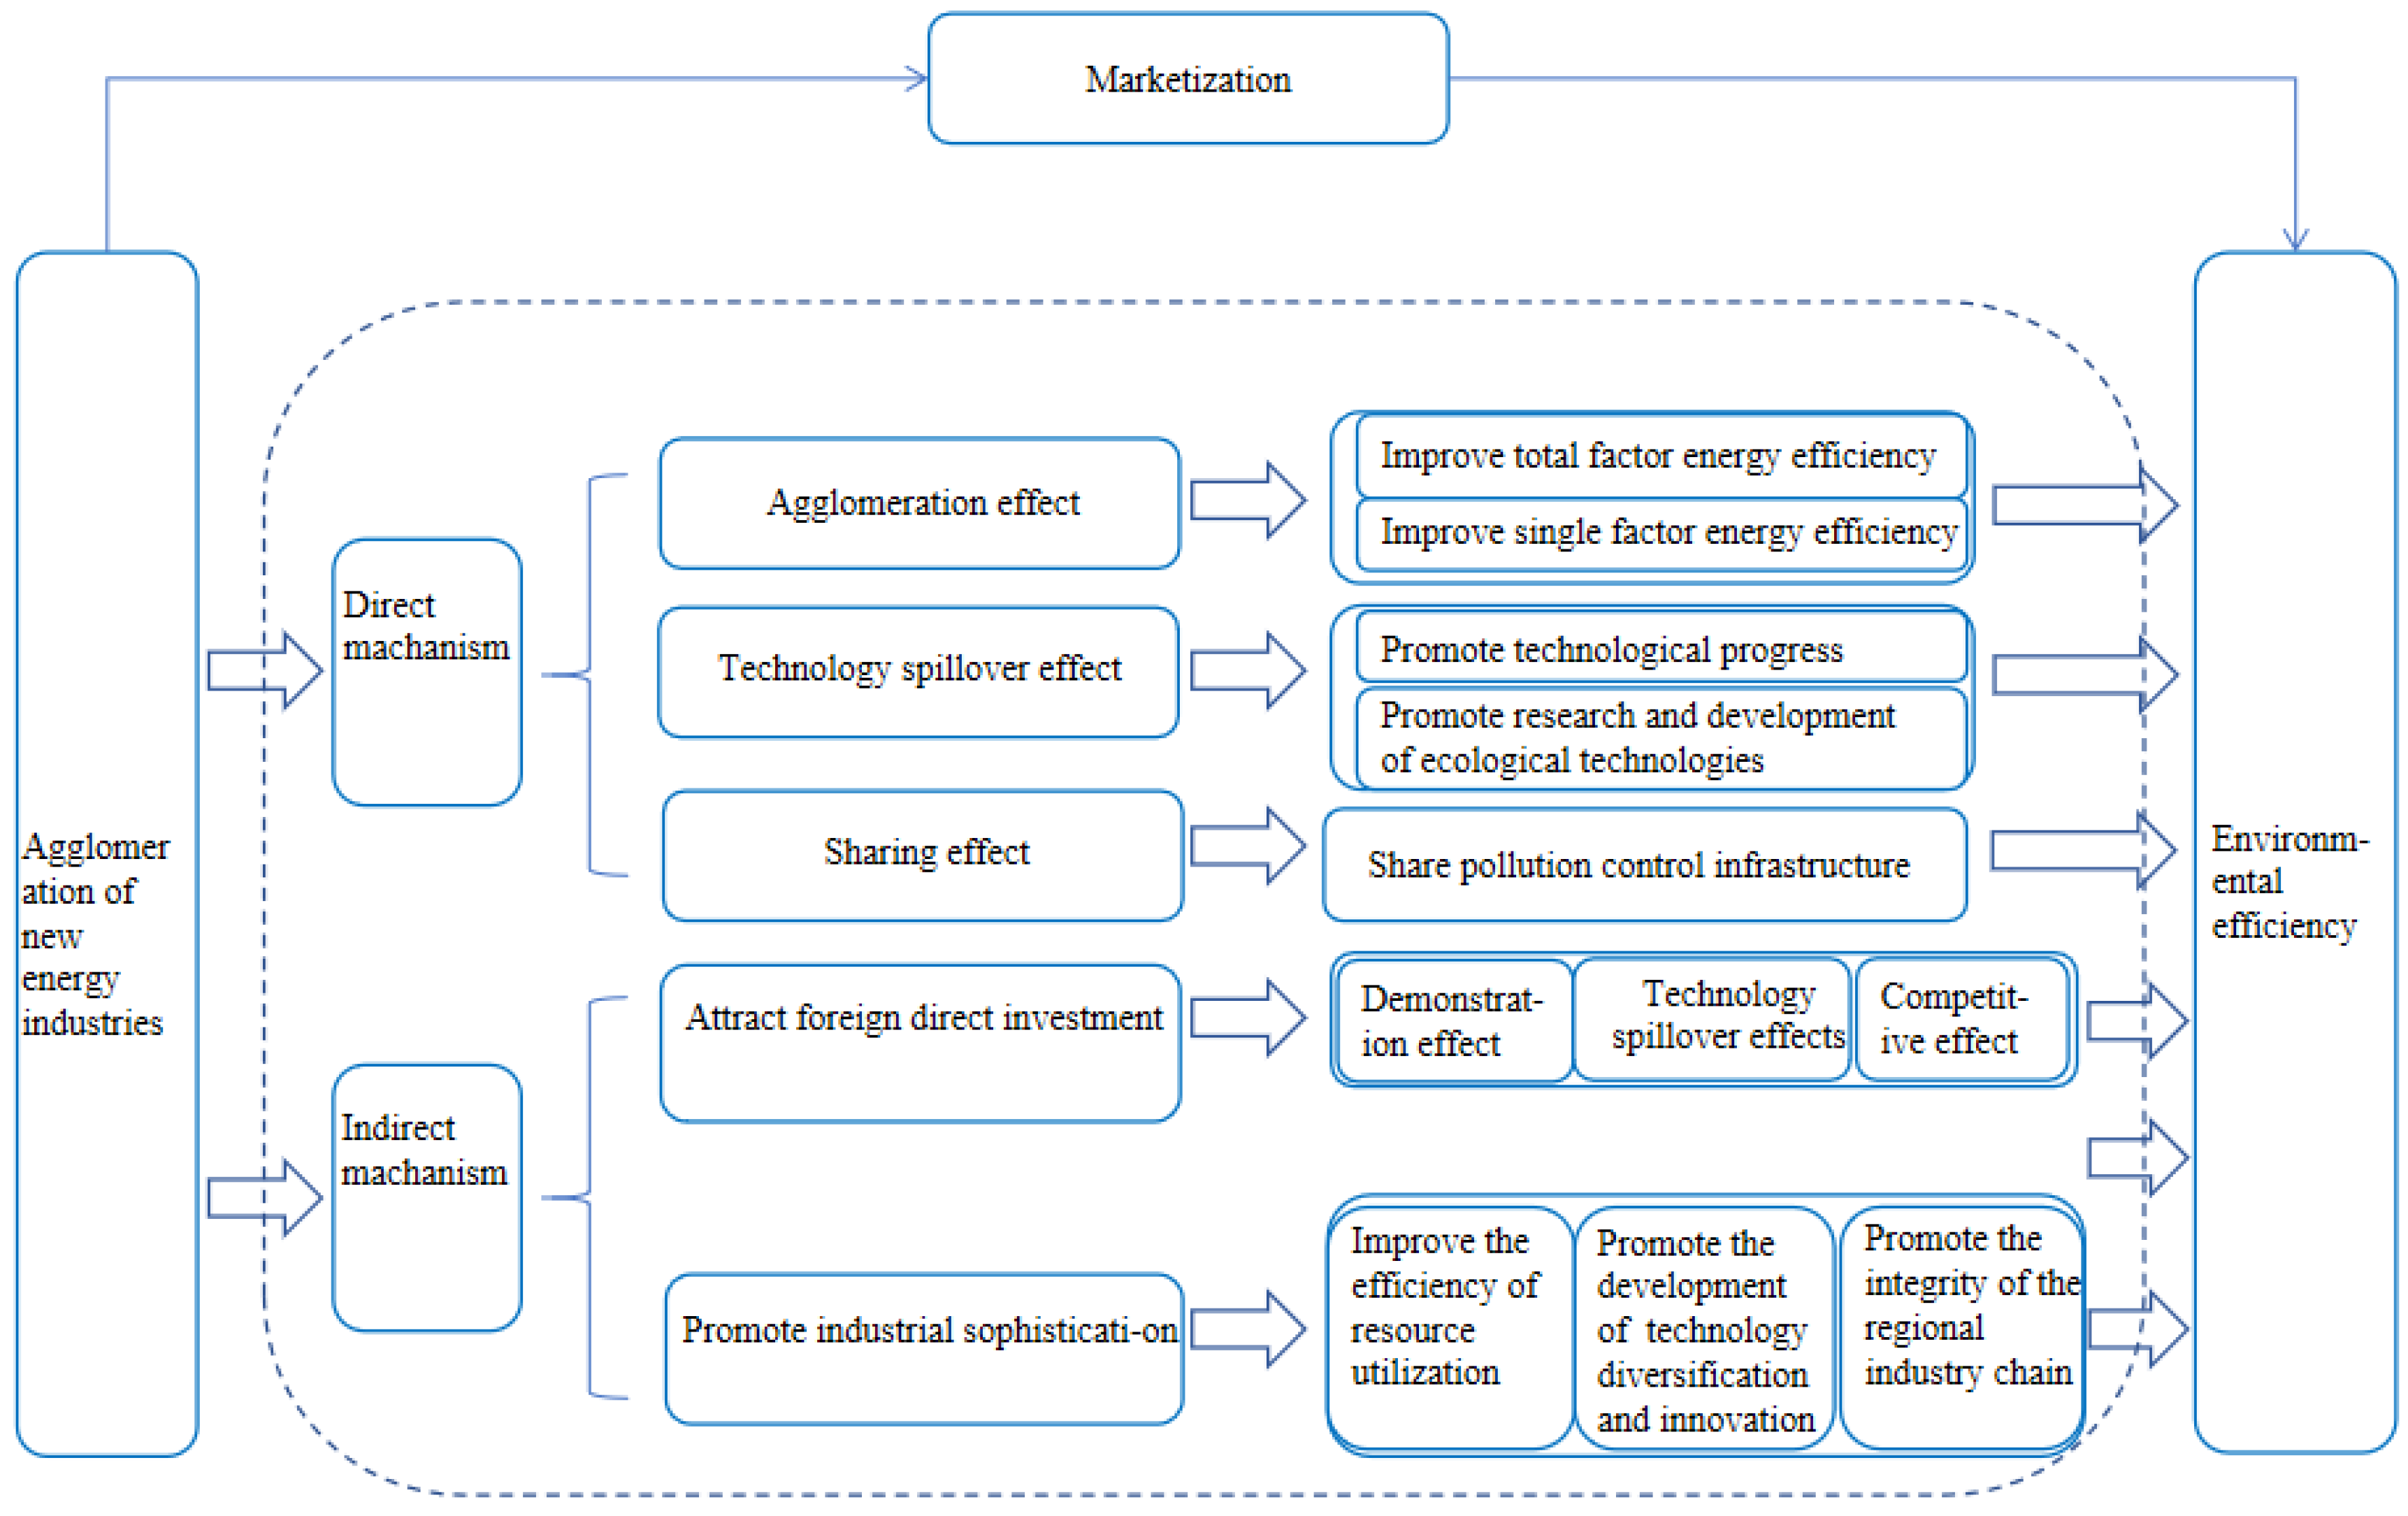
The agglomeration of the new energy industry promotes the improvement of environmental efficiency in three ways. Firstly, the agglomeration of the new energy industry can effectively improve the total-factor energy efficiency and single-factor energy efficiency through the “agglomeration effect”, thus reducing pollutant emissions [
24]. Secondly, it can promote the technological progress of enterprises, improve the utilization efficiency of resources and indirectly improve the environment through the “technology spillover effect”. At the same time, it can also promote the research and development of ecological technology upgrading and improve the environment directly. Finally, enterprises share pollution control infrastructure through the “sharing effect”. In addition, in order to maximize corporate profits and meet the environmental threshold of the local government, they will jointly research and develop ecological technologies to reduce the costs of environmental control and improve the environment.
3.2. The Indirect Mechanism of the Agglomeration of the New Energy Industry on Environmental Efficiency
Industry agglomeration can attract FDI [
45]. Globalization is closely related to industry agglomeration in China. Therefore, theoretically, as an emerging trend, the agglomeration of the new energy industry will bring more FDI flowing into the energy field. Firstly, FDI or OFDI can affect the environment through the “demonstration effect” [
46,
47]. Enterprises in the host country can directly access the advanced management experience, production technology and marketing model of foreign enterprises, and improve the innovation and development capabilities of local enterprises through learning and imitation [
48,
49,
50]. Secondly, they affect the environment through the “technological spillover effect”. The advanced technology brought by foreign enterprises affects carbon productivity [
51], and foreign investment can further strengthen the degree of industry agglomeration and promote technological progress [
52]. Thirdly, foreign direct investment can also affect the environment through the “competitive effect”. After foreign investment enters the host country, it will compete with the host country’s enterprises in the product market for production factors, and at the same time, it will stimulate independent innovation ability, thereby improving the efficiency of factor allocation and the efficiency of resource utilization.
The agglomeration of the new energy industry can also improve environmental efficiency by promoting the advancement of the industrial structure. Firstly, it will promote the development of new industry forms, such as the solar photovoltaic power generation industry and new energy automobile industry. Relying on the advantages of agglomeration, these industries continue to expand their market share, and gradually replace traditional polluting industries. Secondly, the agglomeration of new energy industries promotes the innovative development of new technologies and diversification. In addition, it upgrades the application of traditional industries, such as the new energy automobile industry, and continuously improves the energy consumption, storage and other technologies of new energy vehicles to expand the effect of energy saving and emission reduction. Finally, it will promote the regional industrial chain. Industrial agglomeration expands the demand and scale of the market. Under the market mechanism, there are higher requirements for the specialized division of labor, which will further promote the improvement of the regional industrial chain and improve the utilization efficiency.
3.3. Threshold Mechanism Analysis
Marketization is characterized by “stages", which will affect the external situation of the agglomeration of the new energy industry [
53]. In the early stage of the reform of the market economic system, in order to pursue the scale effect of industrial agglomeration, the importance of protecting the ecological environment was ignored, which eventually led to environmental pollution. Therefore, in this stage, the agglomeration of the new energy industry may not be conducive to environmental efficiency. With the continuous improvement in the level of marketization, on the one hand, the industry endogenously improves the allocation efficiency of production factors; on the other hand, it promotes ecological technology research and development through technological progress and innovation. The impact of the agglomeration of the new energy industry on environment efficiency will emerge and increasingly grow. Therefore, with the continuous improvement in the level of marketization, the relationship between the agglomeration of the new energy industry and environmental efficiency may have nonlinear characteristics. The mechanism analysis diagram is shown in
Figure 2.
4. Research Design
First of all, this section presents the model settings. Moreover, we carry out the variable description and the evaluation index system. The last part discusses the data source.
4.1. Model Settings
In this section, three model settings will be performed, which are the benchmark regression model, the Hansen panel threshold model, and the mediating effect model.
4.1.1. Benchmark Regression Model
In order to examine the direct impact of the agglomeration of the new energy industry on environmental efficiency, the basic model (1) is set to conduct empirical analysis on this topic.
where
represents the environmental efficiency of province
i in year
t,
represents the agglomeration of the new energy industry of province
i in year
t, and
represents a set of control variables that affect environment efficiency, including
,
,
and
.
is the technology investment of province
i in year
j.
is the educational investment of province
i in year
t.
is the government regulation of province
i in year
t.
is the energy consumption structure of province
i in year
t, including
,
,
and
.
represents the individual effect and
represents the random disturbance term.
4.1.2. Hansen Panel Threshold Model
Considering the impact of the marketization level, there may be a nonlinear characteristic relationship between the agglomeration of the new energy industry and environmental efficiency. Therefore, this paper adopts the panel threshold model proposed by Hansen [
54] and takes the marketization level as the threshold variable. The threshold model is set as follows.
where
,
represent the thresholds for different levels that will be estimated.
represents the indicator function and
represents the threshold variable.
include
,
,
and
.
represents the random disturbance term.
4.1.3. Mediating Effect Model
In order to verify the possible indirect impact mechanism of the agglomeration of the new energy industry on environmental efficiency, according to the previous mechanism analysis, tests were conducted to determine whether foreign direct investment and industrial structure advancement are the mediating variables of the two, drawing on Baron and Kenny [
55]. Based on the benchmark regression model, the mediation model is set as follows:
where
is the mediating variable,
is the control variable, including
and
, and other parts are the same as Formula (1).
4.2. Variable Description and Evaluation Index System
In this section, the core variables, threshold variables, mediation variables, and control variables are explained separately.
4.2.1. Core Variables
In this section, we discuss the core explained variable, core explanatory variables and the core variable description.
Core Explained Variable: Environmental Efficiency ()
Environmental efficiency represents the economic value of the unit environmental load. This paper uses the SBM-DEA model to calculate the environmental efficiency in order to consider environmental efficiency’s inputs, expected output and unexpected output.
In this paper, the SBM-DEA model is used to calculate the environmental efficiency. In general, producers want to meet the criteria whereby the inputs and undesired outputs are as small as possible, and the outputs are as large as possible. There are
decision-making units in production activities, and at the same time,
inputs.
expected outputs and
undesired outputs and other elements together form a decision-making unit. The input, expected output and undesired output are represented in a vector form as:
,
,
. Then, the matrices
,
and
can be defined as the following expressions:
Then, the possible set of production is expressed as:
The SBM model is represented as follows:
where
is the amount of input slack, and
and
are the slack in desired and undesired outputs, respectively.
represents the weight vector. When
meets the requirements of
, this proves that the decision unit is located on the production front.
Based on the SBM-DEA model, the input–output table is set. Input indicators include three items: the year-end total employment, the capital stock value and the energy consumption. The expected output index is the regional GDP, and the unexpected output is the environmental pollution index. The input and output of environmental efficiency are shown in
Table 1.
Core Explanatory Variables: The Agglomeration Level of the New Energy Industry ()
This paper uses the location entropy method to calculate the agglomeration level of the new energy industry.
refers to the ratio of the output value of the new energy industry in a province to the total industrial output value of the local area and the percentage of the output value of the new energy industry in the country to the total industrial output value of the country according to the location entropy method.
means that there is an agglomeration phenomenon. The level is proportional; the larger the value is, the more significant the industrial agglomeration phenomenon is.
means that there is no agglomeration phenomenon. The formula is set as follows:
where
represents the output value of the new energy industry in
j province,
represents the total industrial output value of
j province,
represents the national new energy industry’s output value, and
represents the national total industrial output value.
Core Variable Description
(1) The agglomeration level of the new energy industry (
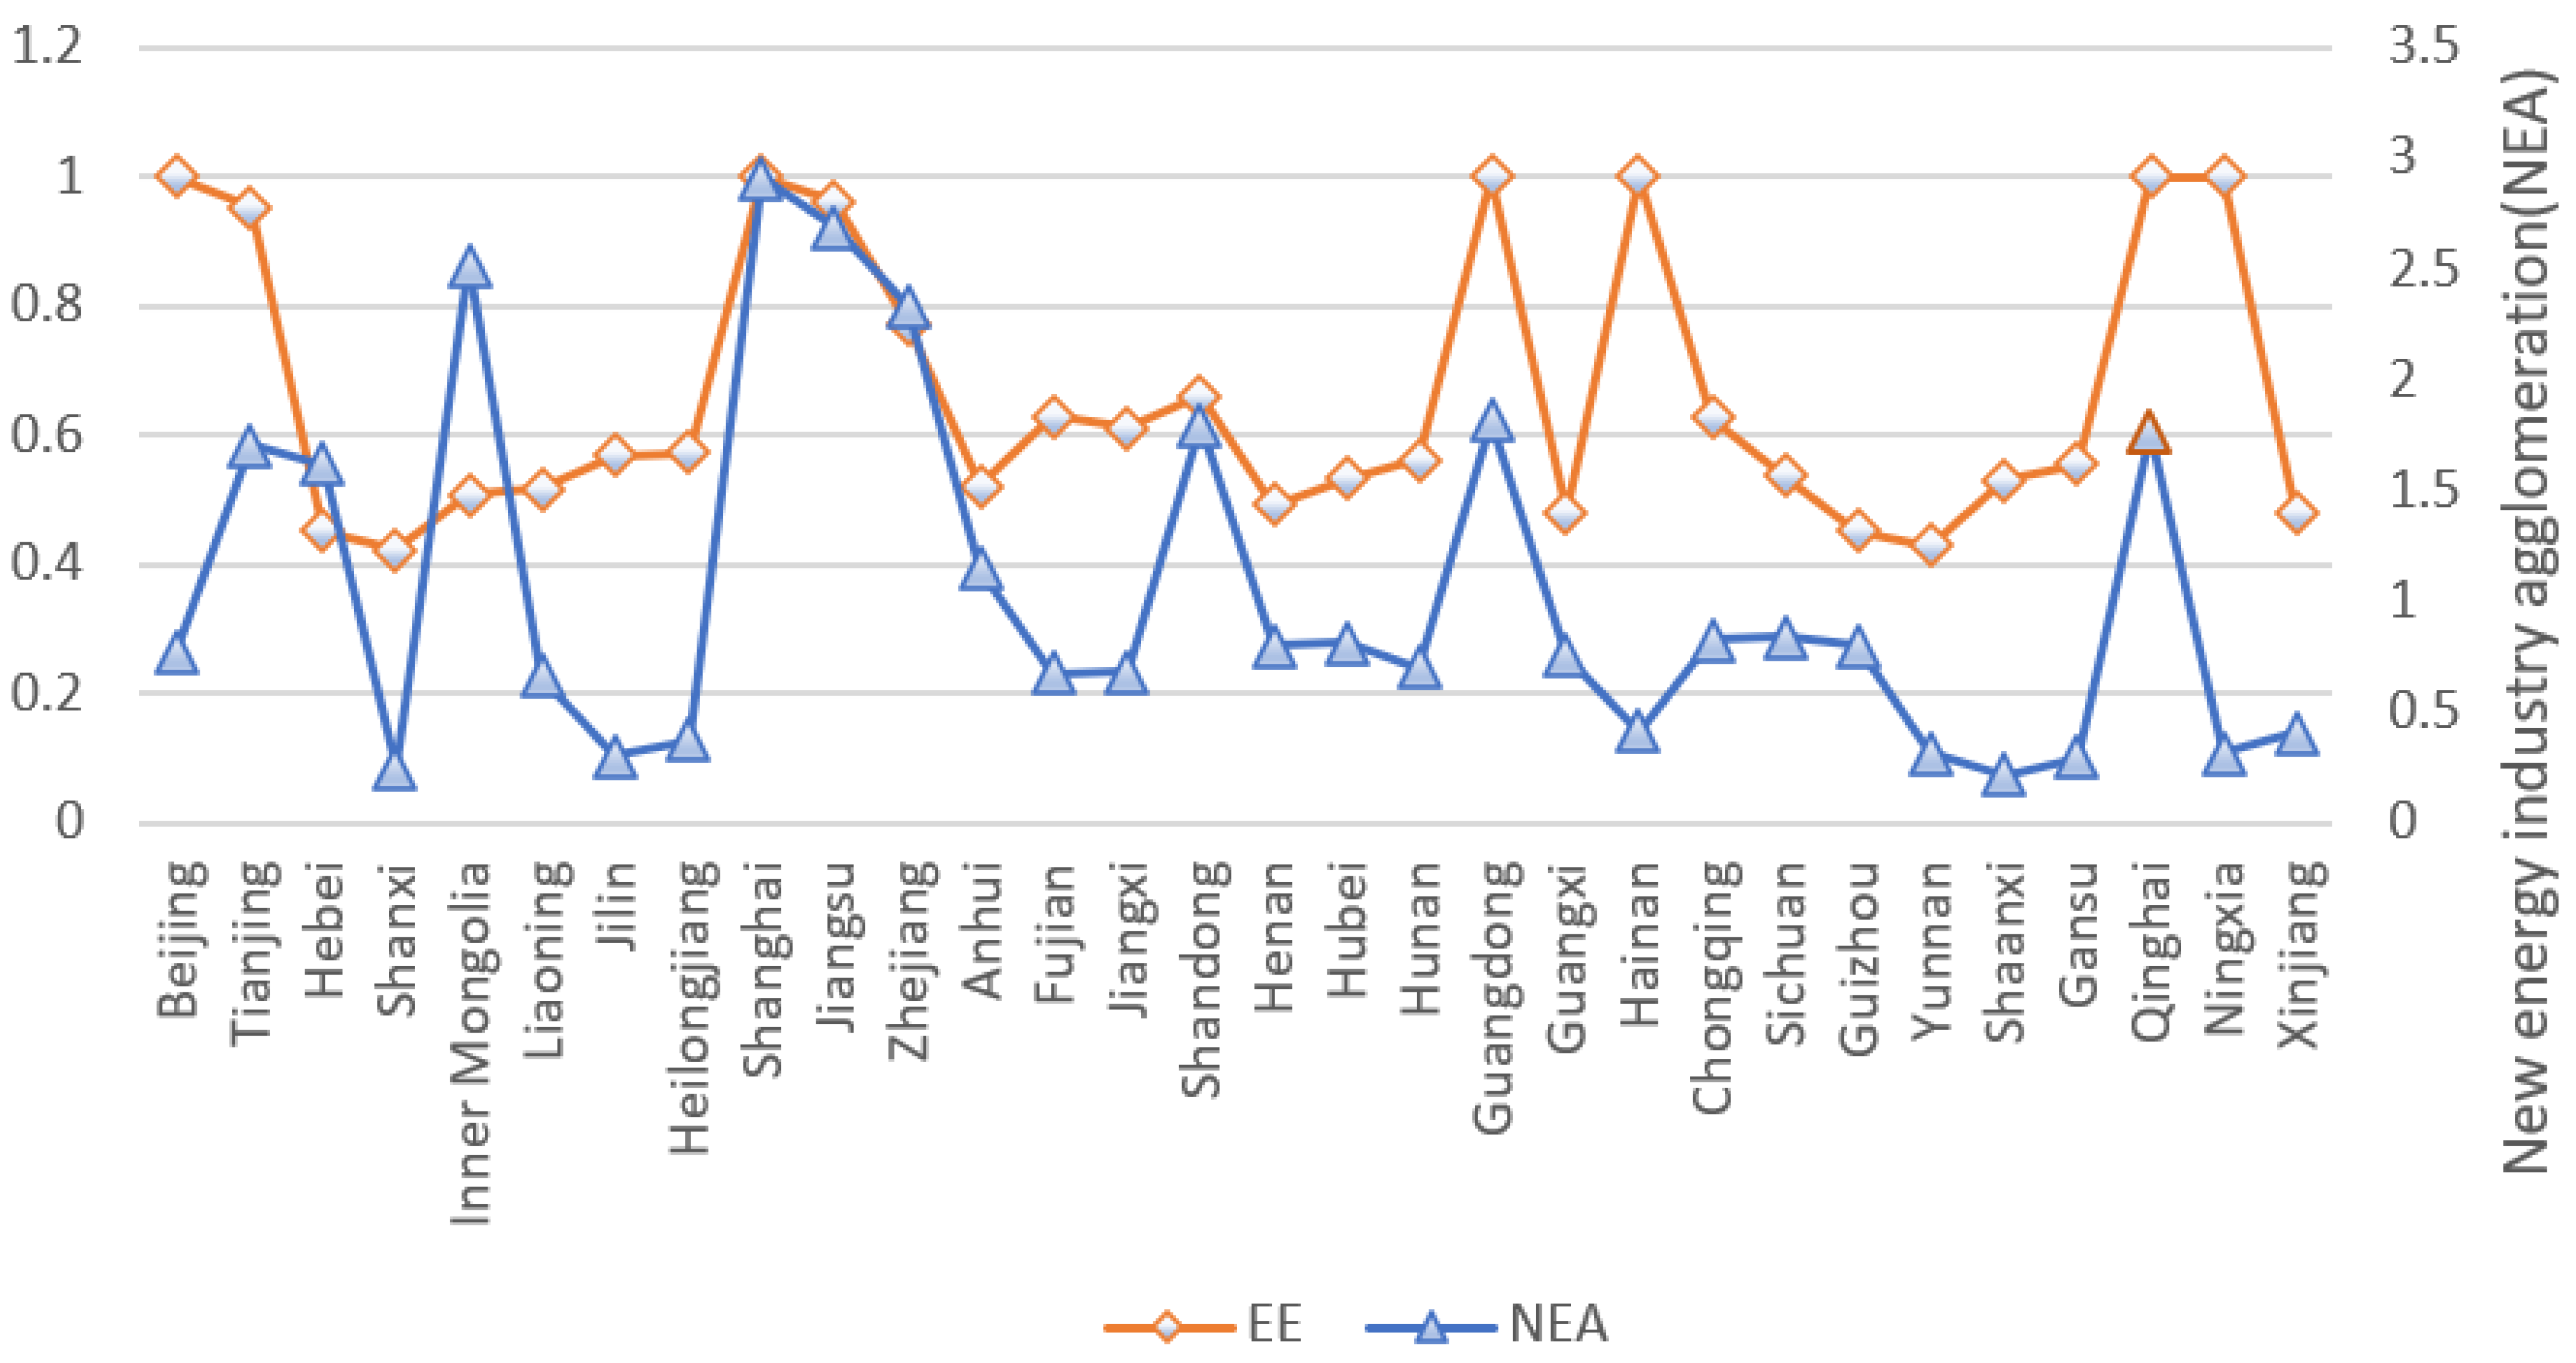
NEA) and environmental efficiency (
EE) in 30 provinces are shown in
Figure 3.
Specifically, there are three situations for NEA. The first is when the agglomeration level of the new energy industry > 2. Among the provinces where this is the case, Shanghai had the highest level at 2.910, followed by Jiangsu and Zhejiang. These provinces all have a high level of economy. However, Inner Mongolia relies on resources. The second situation is when 1 < the agglomeration level of the new energy industry < 2. This is the case in places such as Guangdong, Shandong and Anhui, which form the agglomeration phenomenon as a result of their high level of economy or resource superiority. The third situation is when the agglomeration level of the new energy industry < 1, which is the case in places such as Xinjiang and Ningxia as they have a low level of economic development. The average agglomeration level of new energy in Shaanxi is the lowest at 0.22, followed by Shanxi, Gansu, Jilin, etc. The average agglomeration level of the new energy industry of these four provinces is below 0.3. Through the above analysis, less economically developed areas can also develop new energy industries through comparative advantages.
Regarding EE, notably, Beijing, Shanghai, Guangdong, Hainan, Qinghai, and Ningxia always had a value of one during the sample study period, which means that the environmental efficiency is effective, and the input and output reached the optimal allocation. Shanxi has the lowest environmental efficiency value at 0.42, followed by Yunnan, Guizhou, and Hebei. The environmental efficiency of most provinces is below or near 0.6, and the environmental efficiency still needs to be further improved.
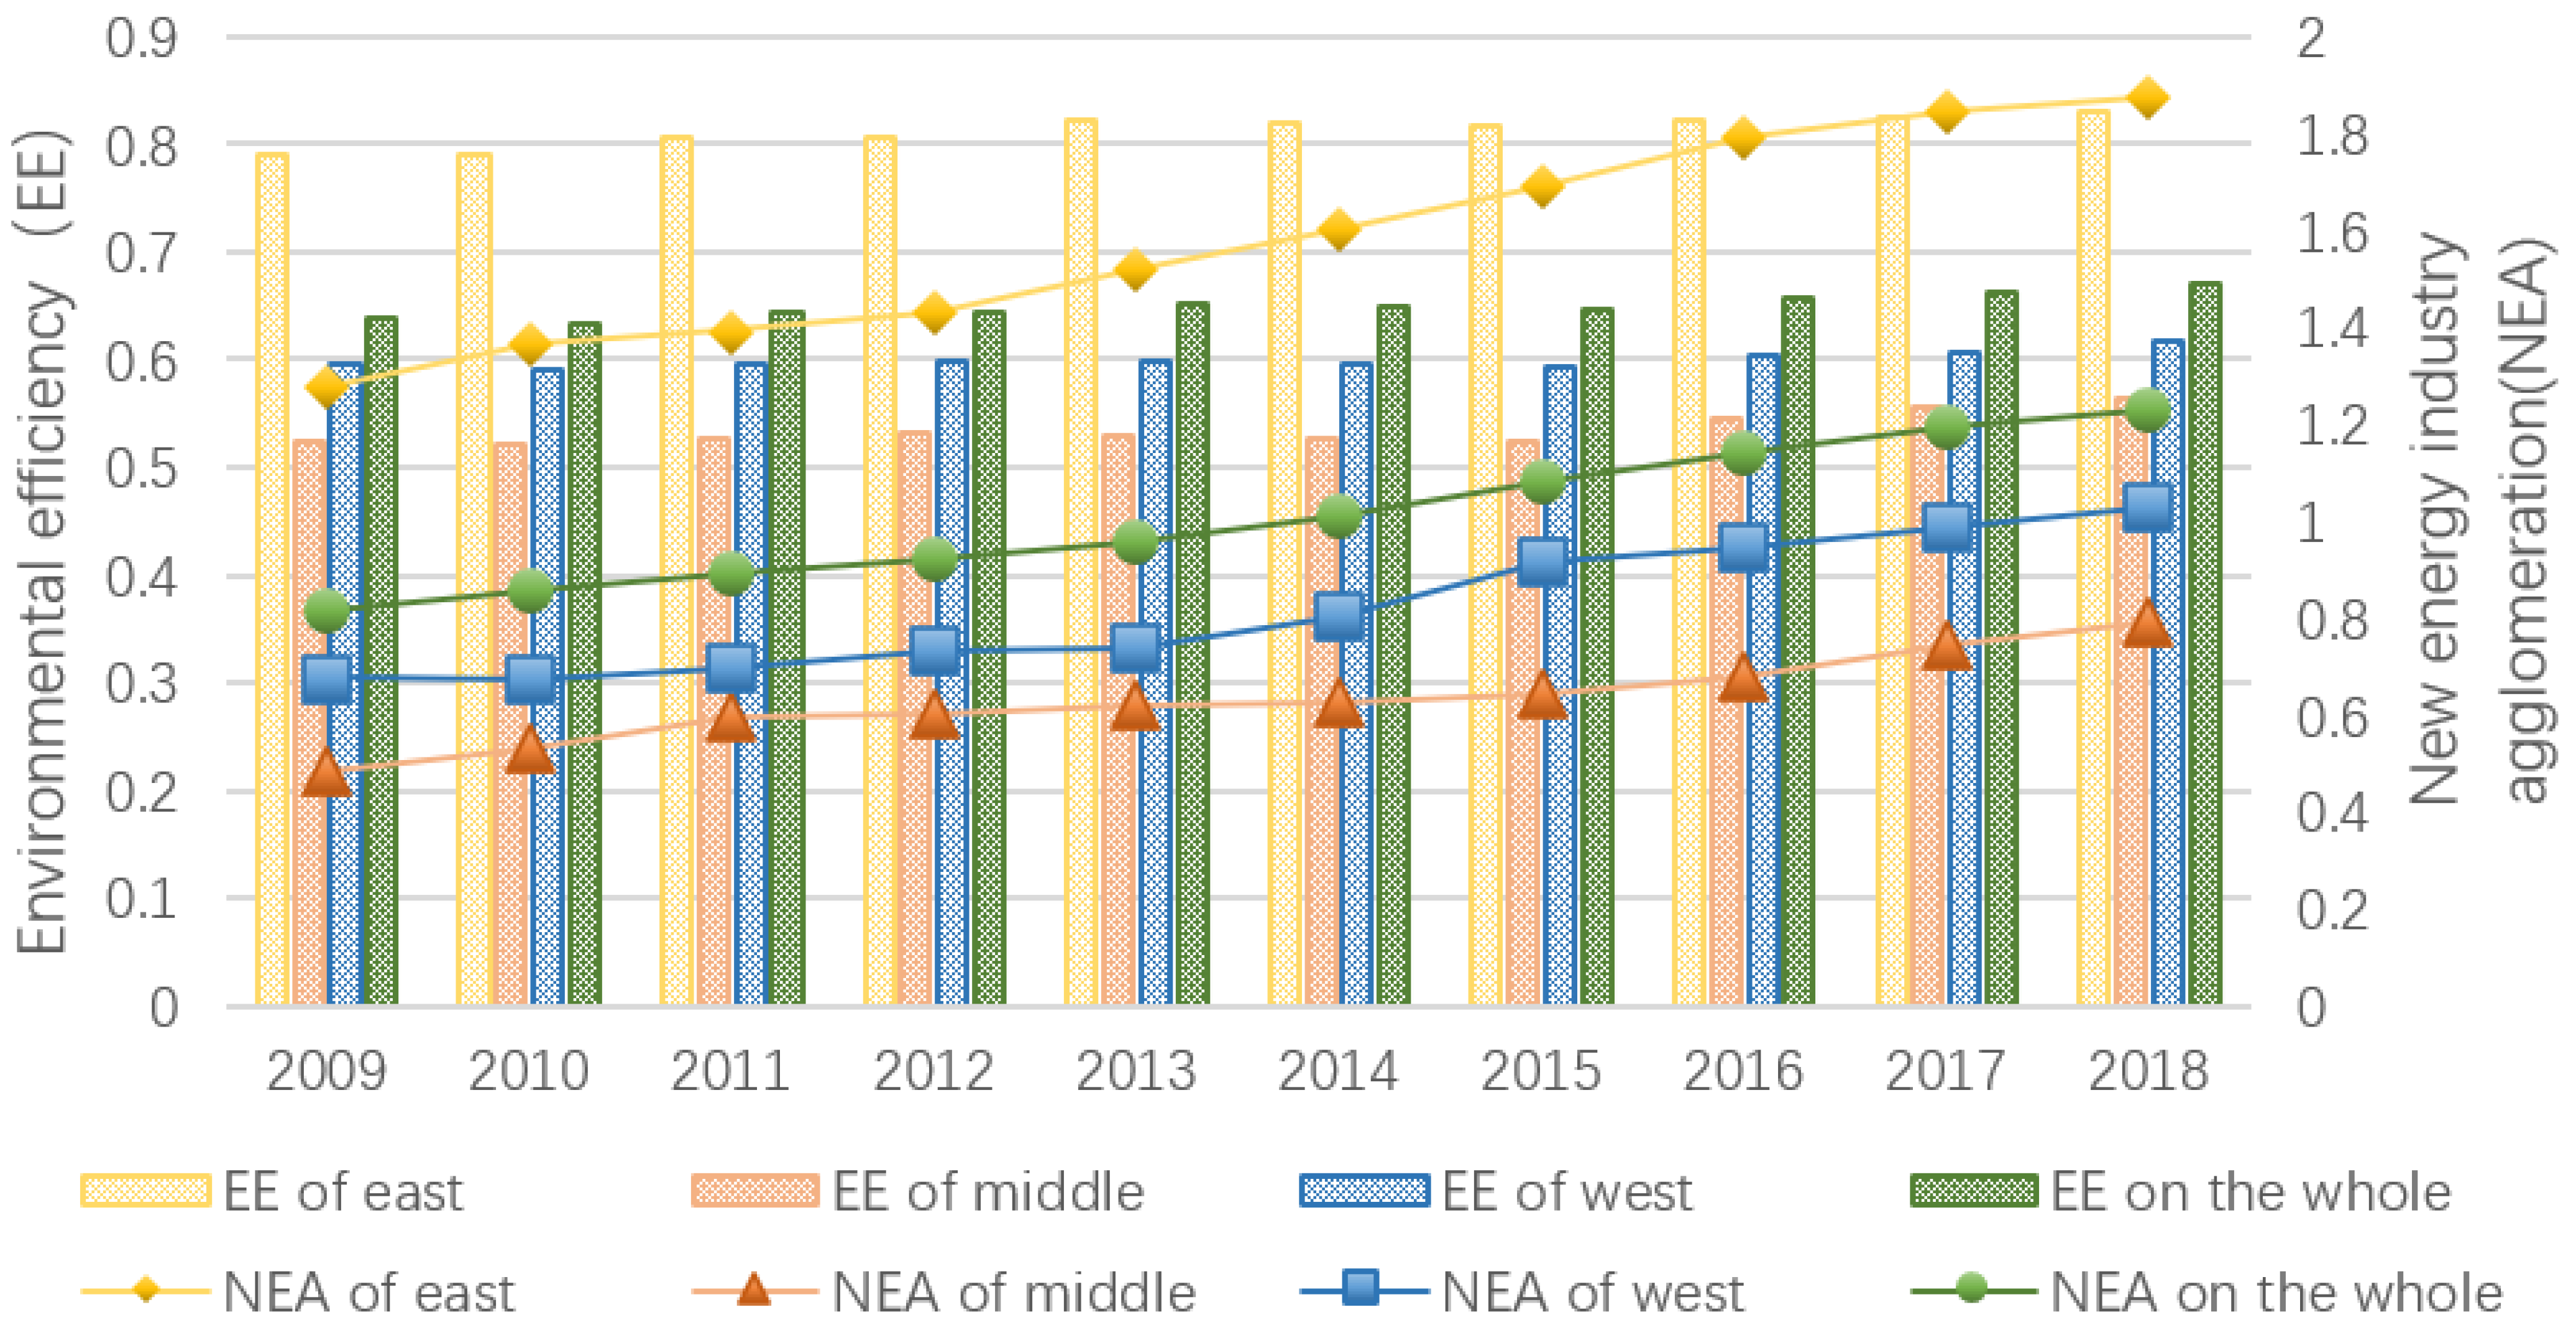
(2) The spatiotemporal evolution characteristics of the
NEA level and
EE in different regions are shown in
Figure 4.
From a regional perspective, the average agglomeration level of the new energy industry as a whole presents a pattern of decreasing from east to west: eastern (1.58) > national (1.01) > western (0.8197) > central (0.6316). The average level of environmental efficiency shows a pattern of decreasing from east to west: eastern (0.8132) > whole country (0.6494) > western (0.5998) > central (0.5252). As a whole, it showed an overall upward trend during the study period. The eastern region was higher than the national average level during the study period, but the central and western regions were lower than the national average level.
In terms of environmental efficiency, the three major regions show wave-shaped fluctuations, and the overall level remains relatively stable, with a slight upward trend, and the development of environmental efficiency is in a bottleneck period. Environmental efficiency also shows a decreasing distribution pattern from east to west every year. The environmental efficiency level in the eastern region still exceeds the national average level, while the central and western regions are lower than the national average level. The distribution of the agglomeration of the new energy industry and environmental efficiency shows a “polar characteristic”.
4.2.2. Threshold Variables
The marketization level (
MI) represents the relative process of every region’s marketization. It has stage characteristics. Therefore, the marketization level is used as the threshold variable to explore the threshold effect between the agglomeration of the new energy industry and environmental efficiency. This article takes the overall marketization index in the “Marketization Index Report by Province in China (2018)” to measure the level of marketization [
56].
4.2.3. Mediation Variables
(1) Foreign direct investment (FDI): The clustering of new energy industries can improve the environment by attracting foreign investment through a “demonstration effect”, “technology spillover effect” and “competition effect”. Therefore, this paper examines the intermediary role of the foreign direct investment variable.
(2) The advancement of the industrial structure (
IS): On the one hand, the agglomeration of the new energy industry can promote the development of new formats, the diversified innovation and development of new technologies, and the specialization and division of labor to improve the regional industrial chain. Therefore, this paper examines the intermediary role of industrial structure advancement. Thus, this paper draws on the practice of Gan et al. to measure industrial structure advancement as follows [
57]:
where
represents the advanced level of the industrial structure of
j province in
i year,
represents the tertiary industry’s production value of
j province in
i year, and
represents the secondary industry’s production value of
j province in
i year.
4.2.4. Control Variables
Description of control variables are shown in
Table 2.
4.3. Data Sources
Considering the availability of data and the consistency of the time range, this paper conducts research on 30 provinces in China (excluding Tibet, Hong Kong, Macao and Taiwan) from 2009 to 2018. All data used in this article are from
the China Statistical Yearbook,
the National Bureau of Statistics,
the China Energy Statistical Yearbook,
the China Environmental Statistical Yearbook,
the Wind Database, and
the EPS Database, as well as provincial statistical yearbooks, provincial statistical bulletins, provincial statistical bureaus, and official websites. In addition, due to the lack of
ZF data in 2018, in order to further improve the accuracy of the data, the average method was used to represent the year 2018 as the average of the proportion of environmental pollution control investment in regional GDP from 2003 to 2017. The marketization level is due to missing data in some years, referring to the extrapolation method of Ma et al.: the average annual growth rate of the data over the years is used to estimate the data for the year with missing information [
62]. The descriptive statistics of related variables are shown in
Table 3. As shown in
Table 3, the maximum and minimum values of the remaining variables are many times different except for
EE and
EDU, and the standard deviation values are also large. This indicates that the developmental differences in these aspects in different regions of China are relatively large.
5. Empirical Results and Discussion
In this section, the estimation results of the basic model, the estimation results of the Hansen threshold model and the threshold effect analysis will be provided in turn.
5.1. Estimation Results of the Basic Model
In order to explore the linear relationship between the agglomeration of the new energy industry and environmental efficiency, the random effect model and fixed effect model were selected for research. According to the Hausman results,
p value = 0.0016 < 0.1, so the regression results were reported using a fixed effect model, and the benchmark regression results are shown in
Table 4.
In
Table 4, without considering the control variables in column 2, the coefficient is 0.0389, which is significantly positive at the 1% level. After adding the control variable in column 3, the coefficient is still significantly positive, which means “the cluster effect > the crowding effect” in the process of China’s new energy industry agglomeration affecting environmental efficiency. Positive externalities (such as technology spillovers, labor sharing, etc.) caused by
NEA outweigh the negative externalities (such as crowding effects). The main reasons for this are that, firstly, the technology spillover effect is conducive to promoting the production technology of enterprises and further improving the utilization of resources. In addition, the specialization effect will also promote the development of ecological technology, thus improving the environment efficiency.
The regional analysis shows that the impact of NEA on EE has obvious heterogeneity. Specifically, due to the different geographical locations, factor endowments, and development levels, there are two situations: (1) As shown in column 4 of
Table 4, in the eastern regions, the coefficient (0.0388), which is positive at the 5% significance level, is higher than the national average, which means that the agglomeration of new energy industries in the eastern region has the “scale effect”, bringing specialized suppliers, labor markets, knowledge spillover effects, and promoting the transformation of enterprises to the production of knowledge-intensive and technology-intensive products. In addition, the agglomerative development in the eastern region has accumulated rich social resources to attract talents, thereby promoting the generation and upgrading of environmental protection technologies and strengthening the knowledge spillover effect. (2) In the central and western regions, the coefficients are 0.0533 and 0.0185, respectively, which are not significant, which means
NEA failed to bring about the improvement of environmental efficiency in these regions. For central regions, in the early developmental stage of the new energy industry, the corresponding infrastructure is not yet perfect, and the allocation of various resources (including the means of production, pollution control resources, etc.) has not reached the optimal state [
63]. Notably, compared with the central regions, the
NEA level in the western regions is higher, but its positive driving effect on
EE is smaller, mainly as they are in the transition period of the development of the new energy industry. After the blind pursuit of the agglomeration effect in the early stage of development, they accept the industrial transfer in the eastern region, with the result that the driving effect is not obvious and is even unable to improve the environment.
In terms of the control variables, the coefficient of TEC is insignificant at −0.8379, which shows that China’s science and technology investment has not played a due role in improving the environment, mainly due to technological innovation having a certain cycle, and the fact that the effect of short-term technological investment cannot be “immediate”. The influence of EDU is insignificant at –0.2272 as, although education is an important human capital investment, the return period of education is long. Government regulation (ZF) has a slight negative effect on EE, which indicates the unreasonable use of government investment in pollution control and factor mismatch. The impact of the energy consumption structure (ECS) is not significant, indicating that the utilization efficiency of energy such as coal has been gradually improved in China.
5.2. Estimation Results of the Hansen Threshold Model
According to the mechanism analysis, marketization was mainly aimed at economic benefits, which will ignore the protection of the environment to some extent. Only with the continuous progress of marketization has the efficiency of resource allocation been greatly improved, which will promote the innovation and development of technology and the emergence of positive environmental externalities of the agglomeration of the new energy industry. Therefore, in order to explore the nonlinear relationship and optimize the positive effect of the agglomeration of the new energy industry, marketization is taken as the threshold and the Hansen threshold model is used.
Existence Test of the Threshold Effect
The existence of the threshold effect of marketization is examined, and the test results are shown in
Table 5.
According to
Table 5, both the single threshold and the double threshold pass the test, and the double threshold can reflect the nonlinear characteristics between the agglomeration of the new energy industry and environmental efficiency in more detail. Therefore, the double threshold is selected for the empirical test.
5.3. Threshold Effect Analysis
The regression results of the Hansen threshold model are shown in
Table 6.
In
Table 6, two obvious marketization level thresholds (7.440 and 9.120) exist in the process of the agglomeration of the new energy industry promoting environmental efficiency. Moreover, marketization plays a positive role in driving the increasing marginal effect. The three situations for the level of marketization are analyzed as follows:
- (1)
When MI < 7.440, the impact of new energy industry agglomeration on environmental efficiency is negative, but not significant. In the early stage of market-oriented reform, economic growth was the top priority, while ecological and environmental protection was neglected. In addition, some areas blindly pursued agglomeration economies, and there was still a situation of “pollution first, governance later”. Moreover, regional governments will formulate relevant policies due to low marketization, in order to set barriers to industry entry and protect the development of local industries, which results in the low efficiency of resource allocation. Therefore, the agglomeration of the new energy industry cannot promote the improvement of environmental efficiency.
- (2)
When 7.440 ≤ MI < 9.120, the influence of the agglomeration of the new energy industry on environmental efficiency is positive, but not significant. With the continuous increase in the level of marketization, marketization reform has an obvious “selection effect”, which will force more low-efficiency enterprises to withdraw from the local market voluntarily. However, due to the low level of marketization, the efficiency of resource allocation cannot be further improved, so the agglomeration of new energy industries cannot play a strong role in improving the environment.
- (3)
When MI ≥ 9.120, the impact coefficient of the agglomeration of the new energy industry on environmental efficiency is significantly positive at the 5% level. On the one hand, with continuous improvement, marketization can resolve the problem of overcapacity caused by the expansion of the scale of the agglomeration of new energy industries and the increase in resource investment. On the other hand, marketization can promote technological progress and innovation, give better play to the technological spillover effect caused by industry agglomeration, directly improve the efficiency of resource utilization, and indirectly improve it through the R&D of ecological technology. Therefore, when the marketization exceeds the second threshold, the agglomeration of new energy industries can achieve a good “resonance” with other industries, share the results of marketization, and exert the positive external effects of the environment.
6. Further Analysis: Impact Mechanism Analysis
Based on the perspective of foreign direct investment and industrial structure advancement, Part 3 theoretically analyzes the transmission mechanism of the impact of the agglomeration of the new energy industry on environmental efficiency. In order to verify whether the mechanism is valid, this paper uses the mediation effect model to conduct an empirical analysis and conducts Sobel and bootstrap tests. The test results are shown in
Table 7.
Model (1) confirms that the agglomeration of the new energy industry has a positive impact on environmental efficiency. Model (2) shows that the agglomeration of the new energy industry can significantly attract FDI. According to Model (3), by adding the intermediate variable of foreign direct investment into model (1), the coefficient of NEA is 0.0264, which is lower than that of model (1), and is still significantly positive at the level of 1%. Specifically, the size of the mediating effect is 0.0083 = 0.0347 − 0.0264, accounting for 23.89% of the total effect, indicating that the NEA promotes EE by attracting foreign investment. The agglomeration of the new energy industry can attract foreign direct investment. Firstly, foreign direct investment can bring advanced management experience and production technology to enterprises in the host country to improve the efficiency of resource use. Moreover, foreign direct investment can expand the technology spillover effect through bringing advanced technology. Finally, foreign direct investment makes the host country’s market competition more intense, creating more enterprises to occupy the market, resulting in an increased environmental load. This would force the local government to raise the environmental threshold of enterprises, so as to improve the environment. Therefore, the agglomeration of new energy industries can further exert a “demonstration effect”, “technology spillover effect” and “competition effect” by attracting foreign investment to improve the environmental efficiency
In model (4), the result indicates that the agglomeration of the new energy industry can promote the advancement of the industrial structure. Compared with model (1), the influence coefficient of the agglomeration level of the new energy industry in model (5) decreased, but is still significantly positive at the 1% level. Specifically, the size of the mediating effect is 0.0118 = 0.0347 − 0.0229, accounting for 33.95%, indicating that the advancement of the industrial structure is a critical intermedia mechanism. The agglomeration of the new energy industry eliminates underdeveloped enterprises by gathering advantages and upgrading new business models through technological development. In addition, agglomeration leads to the expansion of scale and makes the market division of labor more detailed under the market economy system. Therefore, the agglomeration of the new energy industry improves environmental efficiency by advancing the industrial structure, which is related to the new business formats, the innovative development of new technologies and diversification, and the regional industrial chain.
7. The Robustness Test
The following section describes the robustness test of the benchmark regression–temporal lags test, the robustness test of the panel threshold model, the robustness test of regional heterogeneity and the robustness test of the simulation.
7.1. Robustness Test of the Benchmark Regression–Temporal Lags Test
In order to ensure the robustness of the results, the agglomeration level of the new energy industry’s lag one period (
NEA1) and lag two period (
NEA2) were introduced into the original model to obtain models (1), (2), (3) and (4) in
Table 8. After correcting the endogeneity, the regression results are consistent with the benchmark regression model, indicating that the conclusion is robust.
7.2. Robustness Test of the Panel Threshold Model
In order to test the robustness of the panel threshold, in model (1), we add the degree of openness (
Op) to the original model; in model (2), we add the degree of government intervention (
Gover) to the original model; and in model (3), we add the two together to the original model. The panel threshold test was performed again, and the results are shown in
Table 9. It can be seen from
Table 9 that the results of the models (1), (2) and (3) all maintain a high consistency with the original threshold model, so the results of the panel threshold model are robust.
7.3. Robustness Test of the Regional Heterogeneity
In order to test the robustness of the regional heterogeneity, 30 provinces are divided into coastal and inland regions. The results still have the characteristics of regional heterogeneity as shown in
Table 10, verifying that the conclusion is robust.
7.4. Robustness Test of the Simulation
The maximum, minimum and mean values of the core explanatory variables for each province are forecasted for the next seven years, and the best, average and worst recorded results are shown in
Table 11.
8. Conclusions and Recommendations
In order to achieve the “double carbon” goal and get out of the “downturn” period of the development of environmental efficiency, the question of how to use the agglomeration and development of the new energy industry, which is an emerging industry, has become one of key importance. Based on the panel data of 30 provinces and cities from 2009 to 2018, this paper comprehensively uses the SBM-DEA model, the location entropy method, the panel threshold model, and the mediation effect model to conduct research. The following conclusions are drawn: (1) The levels of NEA and EE have generally increased with obvious “regional heterogeneity” and a “polar characteristic”; (2) NEA can promote EE, and the marginal effect is 0.0347, but a strong positive driving effect only exists in the eastern region at present, which is higher than the national average level; (3) There is a double threshold effect in the process. The marketization’s threshold values are 7.44 and 9.12, and the driving trend is “weak negative → weak positive → strong positive”; (4) The advancement of the industrial structure and foreign direct investment are the critical intermedia. Among them, the size of the mediation effect of foreign direct investment is 0.0083, accounting for 23.89% of the total effect. The size of the mediation effect of the advanced industrial structure is 0.0118, accounting for 33.95% of the total effect. Based on the findings, the following policy recommendations are put forward.
Firstly, the development of the new energy industry is an important driving force to break through the bottleneck period of the development of environmental efficiency. The development of the new energy industry in some areas is relatively lackluster. Each region should take advantage of its location, production factors and other advantages to narrow the gaps in regional development and prevent the further expansion of polarization, leading to more imbalanced development.
Secondly, according to differences in regional development, different regions should develop based on their own conditions. The central and western regions should strengthen their cooperation with the eastern region and continuously absorb the advanced technologies and management experience of the eastern region. At the same time, they should not blindly accept industrial transfer, so as to prevent low-efficiency enterprises from further hindering the transformation and development of the new energy industries. In addition, different regions should make good use of their respective comparative advantages to develop suitable new energy industries.
Thirdly, it is important to speed up the marketization process. Marketization facilitates the new energy industry to play the positive externalities of the environment. Marketization can solve the problem of overcapacity caused by the expansion of the agglomeration scale and increased resource investment and can accelerate the process of sustainable development. The government should gradually reduce its intervention in the market, and, based on the principle of the continuous improvement of the policy system, strictly supervise the actions of the regional governments to introduce policies and establish barriers to protect the industries in the region.
Fourthly, advanced industrial structures and foreign direct investment must be taken as important measures to promote environmental efficiency. On the one hand, the advancement of the new energy industry can upgrade traditional industries and improve sustainable development capabilities through technological spillover effects, and can also rely on its own advantages to develop new formats and constantly occupy the market, replacing high-polluting enterprises. On the other hand, FDI brings vitality to local economic development, and the government will obtain more tax avenues to give enterprises product subsidies and pollution subsidies to encourage domestic enterprises to participate in competition, and ultimately achieve environmentally sustainable development.
This study provides important evidence on the relationship between the agglomeration of new energy industries and environmental efficiency at the provincial, municipal and autonomous levels. However, there are still some limitations. In particular, this study focused on the static relationship between the agglomeration of new energy industries and environmental efficiency but ignored whether there are other transmission mechanisms between the two over time and the possible spatial effects. In the future, with the continuous promotion of China’s 2060 carbon neutrality target and the continuous development of the new energy industry, systematic GMM, dynamic thresholds, and dynamic spatial Durbin models can be used to explore the dynamic relationship. Moreover, the hydrogen energy industry is another key research direction.


