Article

Impact of Farmers’ Participation in Community-Based Organizations on Adoption of Flood Adaptation Strategies: A Case Study in a Char-Land Area of Sirajganj District Bangladesh

by
Md Omar Faruk
1,2,* and
Keshav Lall Maharjan
1
1
International Economic Development Program, Graduate School of Humanities and Social Sciences, Hiroshima University, Higashihiroshima 739-8529, Japan
2
Department of Agricultural Extension, Ministry of Agriculture, Dhaka 1215, Bangladesh
*
Author to whom correspondence should be addressed.
Sustainability 2022, 14(14), 8959; https://doi.org/10.3390/su14148959
Submission received: 16 June 2022 / Revised: 17 July 2022 / Accepted: 19 July 2022 / Published: 21 July 2022
(This article belongs to the Special Issue Socio-Economic Functions Across Sustainable Farming Systems)

Abstract

:
Community-based organizations (CBOs) are gaining popularity in Bangladesh as a tool for relaying flood risk information and adaptation strategies. However, to our knowledge, no attempts have been made to determine the impact of CBOs on farmers’ adoption of flood adaptation strategies. Therefore, in this paper, we identify the determinants that influence farmers’ decisions to participate in CBOs and how this participation impacts farmers’ adoption of flood adaptation strategies. A multistage sampling procedure was employed to select 359 farmers for the study. An endogenous switching regression model was applied to control for possible selection bias due to unobserved factors, while propensity score matching (PSM) and inverse probability-weighted regression adjustment (IPWRA) were employed to test for the robustness of the results. The results reveal a positive selection bias, indicating that farmers with above-average flood adaptation strategies are more willing to participate in CBOs. Farmers’ flood experience, having children under 10 years, distance to the village center, and access to information mainly determine the participation in CBOs. It is also found that CBO participation significantly increases farmers’ adoption of flood adaptation strategies. ESR results show that farmers who participated in CBOs have 3.76 higher average flood adaptation strategies compared to CBO non-participation, and this finding is also consistent with PSM and IPWRA results. Therefore, policy intervention aimed at further strengthening and institutionalizing CBOs is necessary for successful flood adaptation.

1. Introduction

Bangladesh is one of the world’s most flood-prone countries. Thousands of people are affected by floods every year, claiming lives and causing property damage [1]. More than three-fourths of the country is represented by the floodplains of the Ganga, Brahmaputra, and Meghna (GBM) river basins and some other smaller rivers [2]. The sand and silt landscapes near the rivers are called “char-land” in Bengali [3]. About 4–5% of the Bangladeshi population lives in char-lands, which cover an area of nearly 7200 km2 [4,5]. These char-lands are vulnerable to widespread monsoon flooding that damages settlements, crops, houses, infrastructure, and communication networks. This is because the hydro-morphological characteristics of the char-lands differ significantly from those of the shorelines and other floodplains in Bangladesh [6]. The inhabitants of char-lands rely heavily on agriculture for their livelihood [7], which makes them more vulnerable to flood damage. However, the flood warnings from the Flood Forecasting and Warning Center (FFWC) do not address the needs of char-land residents and sometimes are too technical to be understood and irrelevant to local conditions [6]. Moreover, most of the people in the rural char-lands are illiterate and have no proper knowledge of floods [8]. Rural communities are also not aware of flood early warnings [9], which highlights the gaps in current flood risk communication systems. As a result, potentially vulnerable people do not take flood adaptation measures [10].
The government of Bangladesh has taken steps to institutionalize disaster management at the union level through Union Disaster Management Committees (UDMCs). However, the committees mainly focus on relief, rescue, and rehabilitation activities after floods rather than disseminating flood early warnings (FEWs), and UDMCs cannot reach all villages and communities with FEWs [9]. The government, on the other hand, disseminates flood warnings in a top-down approach through policies, the media, and the internet, which is a one-way passive risk communication because people may or may not read these materials [11]. This one-way message communicates only flood risk but fails to assess the particular risk to the local communities. In contrast, the two-way message informs people of the particular risk, defines the problem, and then identifies appropriate solutions [12]. As a result, top-down approaches need to be replaced with participatory bottom-up approaches that emphasize risk reduction, preparedness, and the role of individuals and communities [13]. Many scholars and stakeholders are concerned about the failure of the top-down approach and argue for a new approach that takes communities at risk directly into the planning and execution of mitigation, readiness, response, and recovery efforts, as communities are best able to assess vulnerability and make decisions about their well-being [14]. The significance of community participation in disaster risk reduction has been well documented in the recent literature [12,14,15]. As the number of disasters and viral epidemics has increased worldwide, the importance of community participation has also increased [16]. Most of the community’s participation occurs through a structure such as a community-based organization (CBO), which is formed to achieve a common goal [17]. CBOs have received significant recognition to increase farmers’ understanding of climate change issues and build their adaptation capacity [18].
In Bangladesh, CBOs have been established by people voluntarily under various non-governmental organizations (NGOs). In the char-lands, CBOs were established under a local NGO called “Manab Mukti Sangstha”. There is a CBO in each village in the study area. Each CBO has a committee consisting of twenty-one members, and the CBO is operated by this committee with the collaboration of that NGO. The CBO’s main goal is to provide flood risk information to raise flood risk awareness among char-land farmers. As the char-lands are far from the mainland, they have limited access to flood risk information, and the local government sometimes fails to provide timely risk information when flooding occurs. In addition, most char-lands do not have electricity, so residents cannot obtain flood risk information from traditional media, such as television. As a result, residents in char-lands rely heavily on CBOs to obtain flood risk information. Flood risk information consists of not only flood early warning but also necessary flood adaptation information [19]. CBO provides essential information on various flood adaptation strategies. Before flood season, farmers are invited to participate in a CBO meeting where they learn by sharing their knowledge and experience. Additionally, farmers have the chance to see the adaptation choices of other CBO members, which may strengthen their faith in adaptation strategies and boost adoption rates [20]. Moreover, experts from different organizations, such as local extension agents, conduct different sessions regarding different flood adaptation measures, especially flood-tolerant agricultural practices, including suitable crop varieties, adjustment of planting and harvesting times, mixed cropping techniques, etc. In these sessions, farmers are provided information on how to save their crops, livestock, and household properties so that they can better adapt to floods. CBOs also play a significant role in flood risk management through some collective actions performed by their different volunteer groups, such as rescuing family members, transferring necessary goods during an emergency, food saving through a food bank for an emergency food crisis, etc.
Sustainable agricultural production is a major concern in char-lands since agriculture is the primary source of livelihood and flooding is a frequent event. Farmers incur a huge loss on their crops and livestock due to flooding. For sustainable farm production, the adoption of effective flood adaptation measures is crucial in the context of the char-lands. Community-based organizations (CBOs) are an ideal platform from which farmers can improve their flood adaptation knowledge. CBOs are thought to increase farmers’ adoption of agricultural flood adaptation by convincing their members to switch from traditional agricultural practices to new practices that are more resilient to climate shocks [20]. Farmers may be able to adapt to the floods by sustaining their agricultural livelihoods because of these adaptation strategies.
However, the literature does not adequately address the impact of these CBOs on farmers’ flood adaptation. Shaw [21] compared the critical issues of community-based flood mitigation in the socio-political context between Bangladesh and Vietnam, focusing on linking the community activities with local government. Huq [14] conducted a literature analysis to examine grassroots community participation in disaster management in Bangladesh. Thompson [22] investigated the sustainability of community-based organizations (CBOs) in Bangladesh, where the author highlighted the prospects of CBOs on floodplain resources and identified the need for a co-management policy for the sustainability of CBOs. Most of the previous studies are qualitative and have focused on the prospects and challenges of community-based approaches. However, no empirical study has established whether farmers’ participation in CBOs improves their flood adaptation strategies. Khanal et al. [20] estimated the impact of CBOs on climate change adaptation in Nepal using propensity score matching (PSM). However, PSM does not account for unobserved characteristics that lead to selection bias, while both observed and unobserved factors can be accounted for using endogenous switching regression (ESR).
Specifically, in this study, we employed an endogenous switching regression (ESR) to evaluate the impact of CBO participation on farmers’ adoption of flood adaptation strategies using survey data from 359 char-land farmers. Propensity score matching (PSM) and inverse probability-weighted regression adjustment (IPWRA) were also applied to verify the robustness of the results. Robust impact evaluation is also necessary for policy decisions [23], such as the development and implementation of appropriate support measures.
Therefore, this study extends the literature in two ways. First, we evaluated the CBO participation impact on farmers’ flood adaptation using ESR with the addition of PSM and IPWRA methods. To our understanding, no empirical study has evaluated the impact of CBO participation on flood adaptation using causal inference. Second, this work is unique because it is the first attempt to analyze the impact of CBO participation on respondents who reside in the remote char-lands that are highly vulnerable to floods. Aside from the introduction, the remainder of this article includes the following. Section 2 describes the methodology, data, and outline of our empirical approach. Section 3 represents the main findings of the study, while Section 4 focuses on discussing the factors affecting CBO participation and the impact of CBO participation on flood adaptation strategy adoption. Section 5 contains the conclusions, policy recommendations, and limitations of the study.

2. Materials and Methods

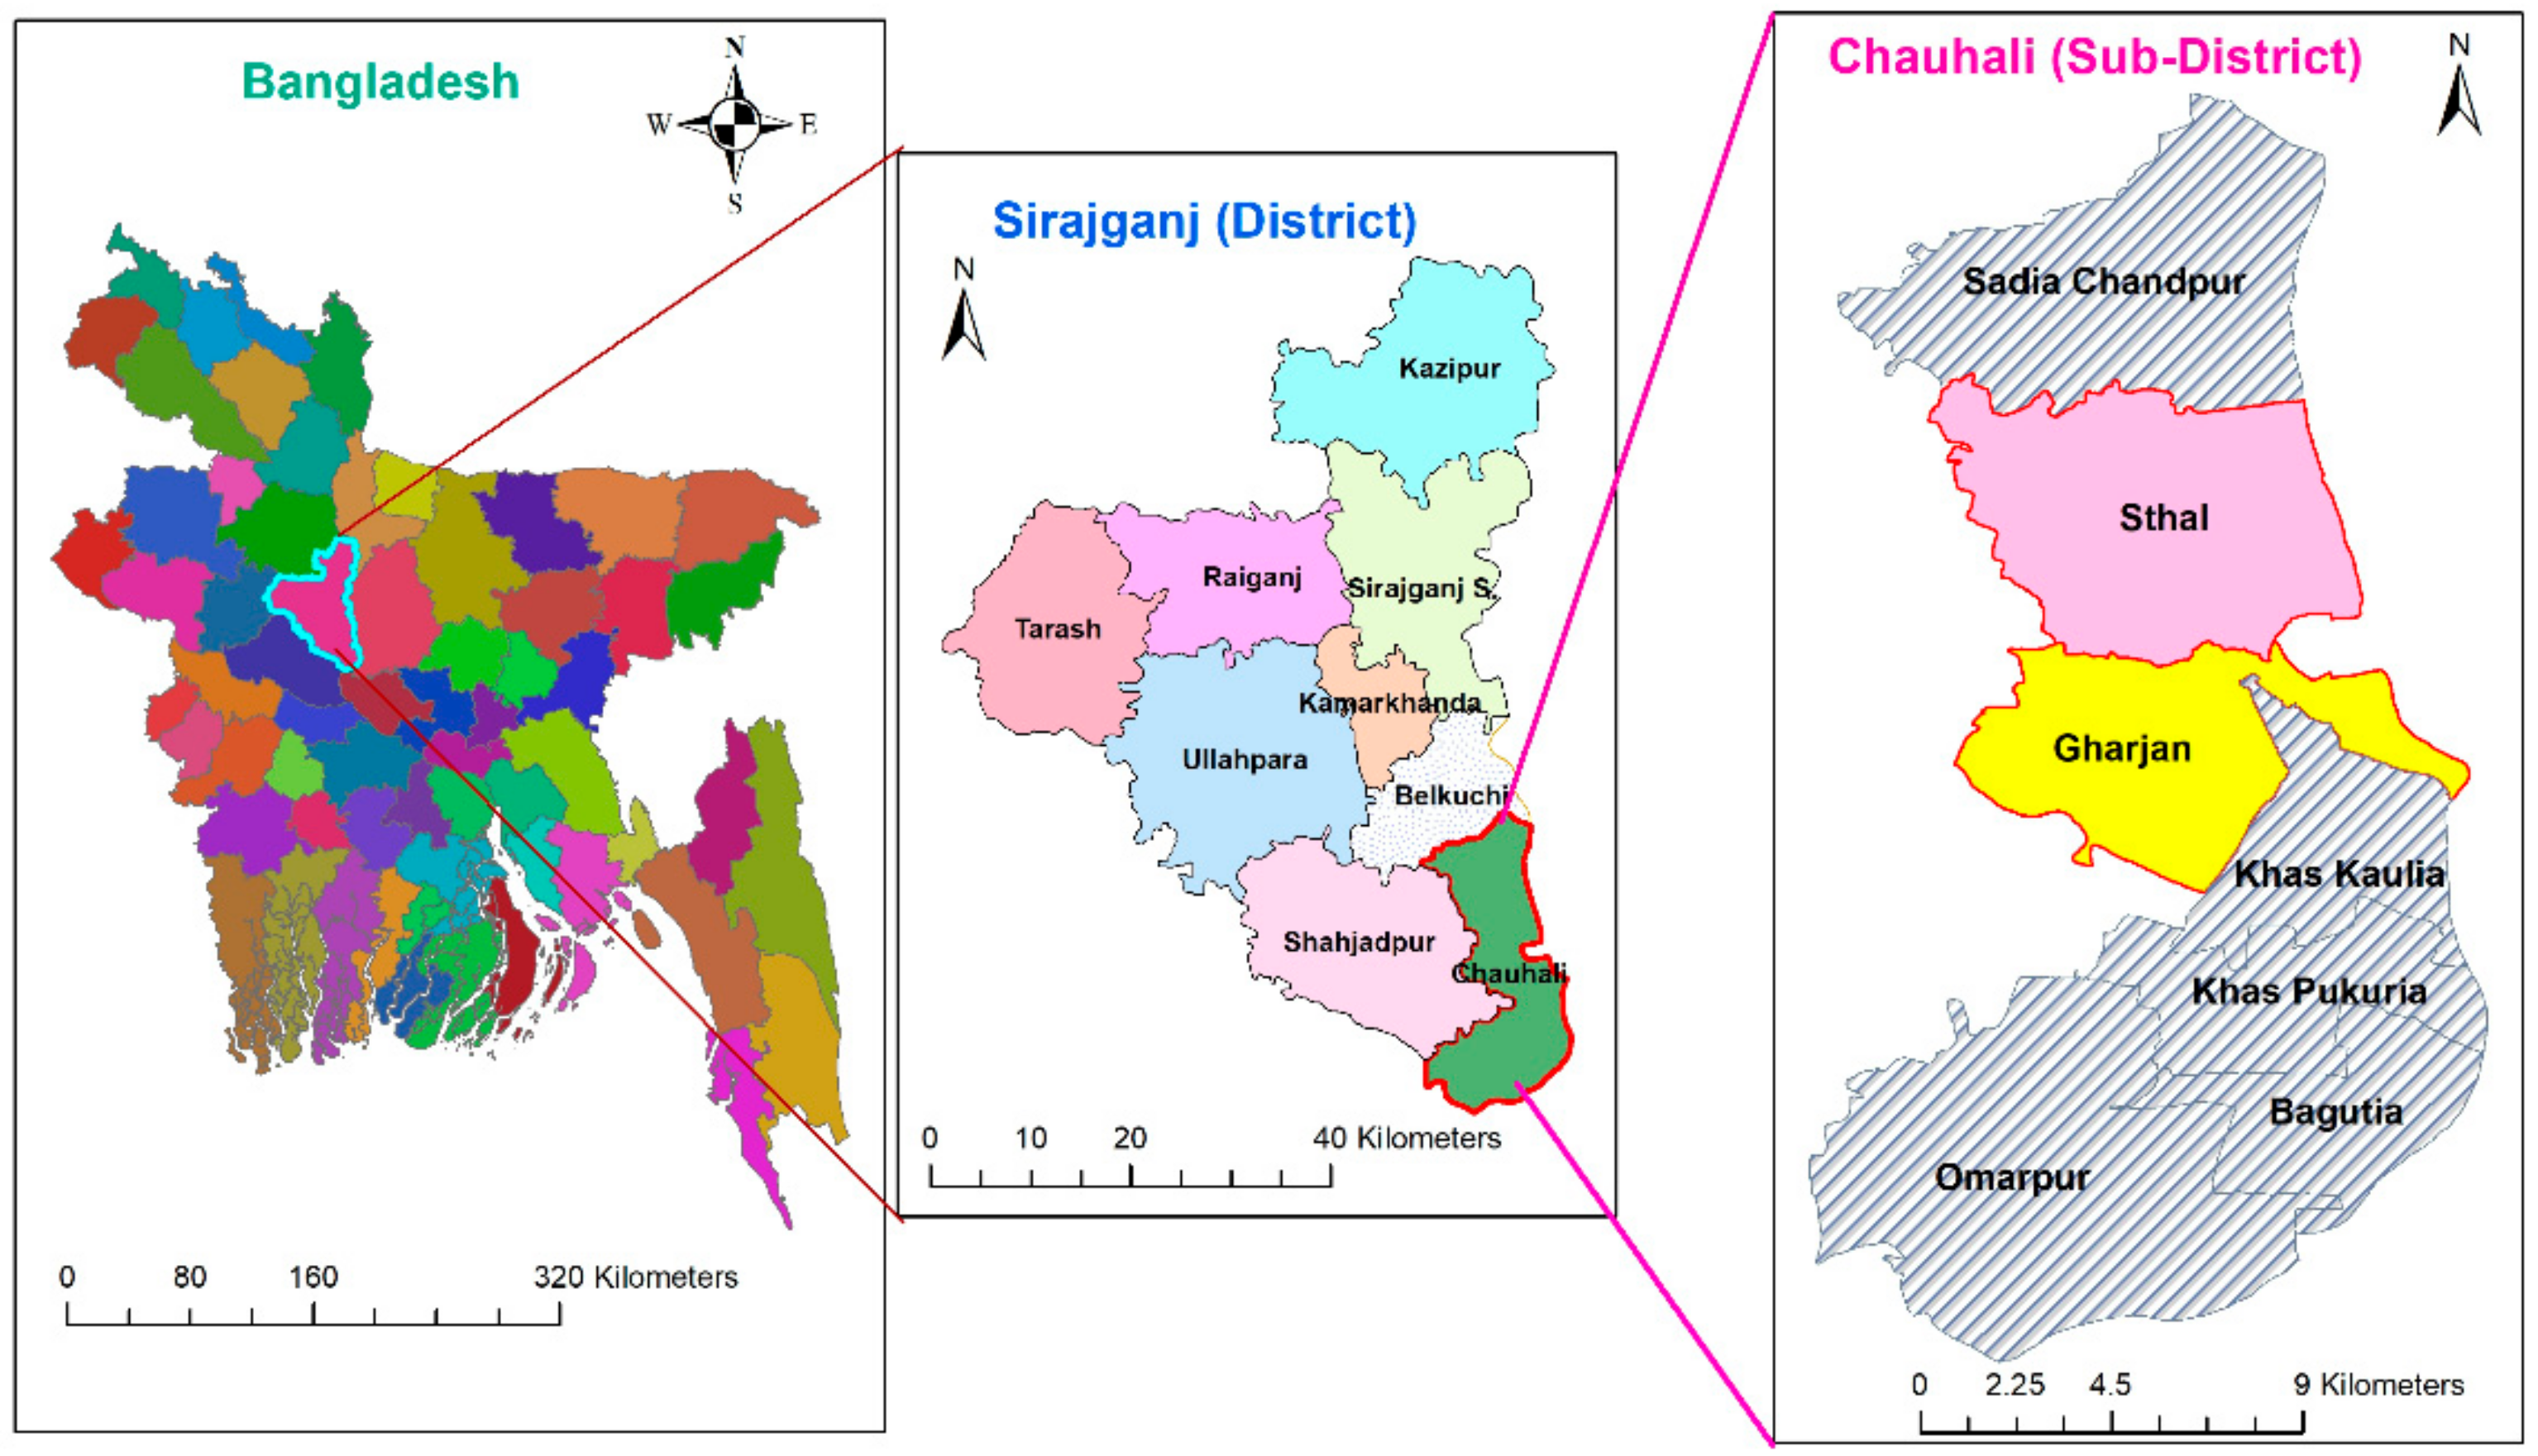
2.1. Description of the Study Area

This study was carried out in the Chowhali sub-district of the Sirajganj district. Sirajganj is a northern district of Bangladesh consisting mainly of char-lands and is regarded to be at high risk of flooding. The region lies on the banks of the Brahmaputra, often referred to as the Jamuna. The monsoon flow of the Jamuna is so great that it often overflows its banks, causing flooding in most of the upazilas (sub-districts) of Sirajganj. The Chowhali sub-district of Sirajganj district was selected for this study (Figure 1).
The Chowhali sub-district is divided into two parts by the Jamuna. The main disasters in this area are river-bank erosion and regular flooding. The land of the sub-district is frequently lost in the river due to the erosion of the Jamuna at different times. Most of the land in this sub-district is river islands, locally known as the char-lands. The dissolution and collapse of the country’s major rivers have created the char-lands.

2.2. Sampling and Data Collection

The sample was chosen by a multi-stage sampling technique. First, the Chowhali sub-district in Sirajganj was purposively selected based on flood intensity and the existence of char-lands. Second, two unions (Ghorjan and Sthal) under the Chowhali sub-district (Figure 1) were selected based on the presence of CBO activities. In the third stage, from the list of villages run by CBOs in each union, three villages were chosen at random. The village-wise list of farmers was collected from the sub-district agriculture office. Finally, farmers were selected by simple random sampling. A total of 359 farmers (about sixty farmers per village on average) were selected for the study. After data collection, it was found that 164 farmers participated in the CBOs, and 195 farmers did not participate in the CBOs. The distribution of the sample size is shown in Table 1.
This study is based on the results of a cross-sectional survey conducted in August 2021. Face-to-face interviews with farmers using a semi-structured questionnaire were performed to collect primary data. The questionnaire was developed to gather information on farmers’ socioeconomic characteristics as well as their adoption of flood adaptation strategies in response to the 2020 flood. Descriptions of all the variables are shown in Table 2. The study ethics committee at the Graduate School of Humanities and Social Sciences, Hiroshima University, authorized the questionnaire for conformity with ethical concerns such as basic human rights, the protection of personal information, and data security before we conducted the final survey. The questions were pre-tested before the final survey.

2.3. Analytical Framework

2.3.1. Impact Analysis and Selection Bias

The differences in average adaptation scores between the two groups can be assessed but assigning merely the differences in adaptation scores between the two groups would be too simplistic and biased. Another way is to use the ordinary least squares method and regress CBO participation as a binary variable. However, this model presupposes that CBO participation is determined exogenously, while it may be determined endogenously.
Propensity score matching (PSM), introduced by [24], is a commonly used econometric model to study the impact of interventions, especially when self-selection is a concern. Propensity score estimation merely attempts to balance the observed distribution of covariates between the groups of CBO participants and non-participants. In this study, an endogenous switching regression (ESR) was used to evaluate the determinants and impact of CBO participation while controlling for both observable and unobservable factors to efficiently address selection bias. However, ESR estimates may be affected by a model assumption, such as the choice of instrumental variable (IV); on the other hand, PSM does not depend on IV [25]. For this, PSM has been employed to check the robustness or sensitivity of the used instrument in the ESR model. In addition, IPWRA has been included in this study for a further robustness check of the former models. If the treatment or outcome variable is not properly specified, it can produce an inconsistent treatment effect. IPWRA has doubly robust characteristics and can produce consistent estimates by considering the possible model misspecification bias [26,27].

2.3.2. Endogenous Switching Regression Model (ESRM)

The choice equation in our scenario, which is based on random utility, is a binary participation model in which farmers decide whether or not to participate in a CBO depending on socio-economic characteristics.
M = + μ
where M is a binary variable that considers 1 for CBO participation and 0 otherwise, Z is a vector of explanatory factors, γ is a vector of coefficient, and μ is an error term with zero mean and constant variance σ2μ. For outcome equations, farmers’ adoption of flood adaptation strategies is in two regimes:
  Y P   =   X β P   +   ɛ P  
  Y N   =   X β N   +   ɛ N  
where Y P and Y N are the flood adaptation strategies adopted by farmers with CBO participation and non-participation, respectively.   β P   and   β N are parameters to be estimated, while   ɛ P and   ɛ N are respective error terms for two regimes. X is a set of explanatory variables, such as socio-economic characteristics. For the error terms μ, ɛ P , and   ɛ N , a trivariate normal distribution with zero mean and a non-singular covariance matrix is assumed.
The error terms for Equations (2) and (3) are expected to be different from zero in the presence of selection bias.
E ( ɛ P   |   M = 1 )   =   σ P μ λ 1
E ( ɛ N   |   M = 0 )   =   σ N μ λ 0
The inverse Mills ratios are λ1 and λ0, respectively, for two regimes, when measured at [28]. To account for selection bias in a two-step estimate technique, λ1 and λ0 can be added into Equations (2) and (3) [29]. The ESR model can be estimated more efficiently and consistently using the full information maximum likelihood (FIML) method [28,30].
FIML also provides ρ P μ ( σ P μ 2   / σ μ σ P )   and ρ N μ ( σ N μ 2   / σ μ σ N ) , which are estimates of the correlation coefficients between the error terms in the outcome and selection equations. The presence of selection bias is indicated by the significance of either ρ P μ or ρ N μ , which emphasizes the importance of the endogenous switching model. When ρ P μ < 0, this implies a positive selection bias; it means that farmers with better-than-average adaption strategies are more inclined to participate in CBOs. On the other hand, ρ P μ > 0 would imply a negative selection bias.
To address the endogeneity problem, access to information has been identified as an instrumental variable in the selection model. Access to information has been selected as an instrument because farmers could be informed regarding CBO participation from the announcement of the leading NGO or from friends or relatives, by which they could be motivated to participate in the CBOs. Farmers who receive information regarding participation in CBO meetings are more likely to participate in CBOs. The validity of this instrument was checked with a simple falsification test [31,32,33]. According to [31], a variable is considered a valid selection instrument when it affects farmers’ decisions to participate in the CBOs but does not directly affect flood adaptation strategies of farmers with CBO non-participation. From the falsification test, it is found that access to information has a significant positive influence on CBO participation but has no significant influence on farmers’ adoption of flood adaptation strategies with CBO non-participation (Table A1).
The overall objective of ESR is to determine the average treatment effect on treated (ATT) and the average treatment effect on untreated (ATU), providing a comparison between flood adaptation with CBO participation and without participation. From the coefficient estimates in the ESR model, the following expected adaptation strategies of farmers under the real and counterfactual scenarios can be estimated.
Farmers with CBO participation (real):
E ( Y P   |   M   =   1 )   =   X β P   +   σ P μ λ 1
Farmers with CBO participation (counterfactual):
E ( Y N   |   M   =   1 )   =   X β N   +   σ N μ λ 1
Farmers with CBO non-participation (counterfactual):
E ( Y P   |   M   =   0 )   =   X β P   +   σ P μ λ 0
Farmers with CBO non-participation (real):
E ( Y N   |   M   =   0 ) =   X β N   +   σ N μ λ 0
As a result, the difference between Equations (6) and (7) computes the average treatment effect on the treated (ATT), while the difference between Equations (8) and (9) computes the average treatment effect on the untreated (ATU). Other research literature has used this strategy [31,32,33].
Using Carter and Milon [34] as a guide, “the effect of base heterogeneity” for CBO participation is defined as the difference between Equations (6) and (8). Similarly, for CBO non-participation, “the effect of base heterogeneity” is the difference between Equations (7) and (9). Finally, transitional heterogeneity (TH) is calculated from the difference between ATT and ATU.

3. Results

3.1. Socio-Economic Characteristics of the Farmers

We conducted a t-test to obtain a better understanding of the differences in characteristics between farmers with and without CBO participation, and the findings are presented in Table 3. The average age difference between the farmers with CBO participation (45.21) and non-participation (47.35) is not statistically significant. However, the age of non-CBO farmers is comparatively higher than that of CBO farmers, which indicates the higher participation of younger farmers in CBOs. Similarly, there is no significant difference between the two groups when it comes to gender. The proportion of gender is almost similar for both CBO and non-CBO farmers. About 71% of farmers with CBO participation and 70% of farmers with non-participation are male, indicating that the proportion of female respondents is comparatively lower in both groups. Farmers who participated in CBOs are not significantly different from farmers who did not participate in CBOs in terms of family size. With respect to the disabled family members, there also appears to be an insignificant difference between the farmers with CBO participation and non-participation. The average number of years of schooling of CBO farmers (3.35) is significantly higher compared to non-CBO farmers (2.62), but the average number of years of schooling in the char-lands is the primary level of education (5 years of schooling). A similar result was found in the Padma floodplain, where the average number of years of schooling was 1.9 years [6]. This is also consistent with the study [35], which found that 45% of the people in the floodplain have only primary education.
Farm size is significantly higher among farmers with CBO participation than among non-participants, indicating that higher CBO participation is associated with larger farm areas. Annual income is also significantly higher for the CBO farmers, implying that farmers with higher incomes participate more in the CBOs. There is no significant difference between the two groups in terms of distance to the village center. CBO farmers experienced significantly more flood severity in the past decade than non-CBO farmers, indicating higher CBO participation for the farmers who experienced higher numbers of flood severity in the past. Farmers who participate in CBOs have significantly greater access to information about CBO participation than farmers who do not participate in CBOs.

3.2. Farmers’ Adoption of Flood Adaptation Strategies

Table 4 shows the difference in the adoption of twenty-one flood adaptation strategies between the farmers with CBO participation and non-participation. After a preliminary survey, twenty-one flood adaptation strategies related to farming and non-farming were found to be mostly adopted by farmers. For each adoption of an adaptation strategy, a score was assigned as 1 if adopted and 0 otherwise. Out of twenty-one adaptation strategies, total flood adaptation scores are considered as an outcome variable. The scores may range from 0 to 21. It is assumed that the higher the score, the better the flood adaptation. A chi-square test for the adoption of each adaptation strategy and a t-test for showing the difference in average scores for flood adaptation represent the difference in adoption of flood adaptation strategies between two groups of farmers (Table 4).
From Table 4, it is observed that farmers with CBO participation have significantly higher average scores in flood adaptation strategies compared to farmers without CBO participation. For each adaptation strategy, the percentage of adoption is higher for the farmers with CBO participation than for non-CBO farmers for both farming and non-farming strategies. As agriculture is the main livelihood strategy in the char-lands, local char farmers have long used various agricultural and livelihood adaptation strategies.
More CBO farmers (50.61 percent) engage in the practice of growing vegetables in pots or sandbags compared to non-CBO farmers (27.69 percent). Farmers collect early growing vegetable seeds and grow them in pots, sandbags, and other containers during floods when their fields are flooded, and they are unable to produce vegetables. After flooding, they transplant the seedlings in the main field and reduce the crop duration in this way. CBO farmers (69.51 percent) are more found to use the strategy of mixed cropping compared to farmers with CBO non-participation (45.13 percent). Farmers in the study area grow sesame with Aman paddy for risk diversification and early planting to reduce damages to crops. The percentage of changing crop varieties is significantly higher for CBO farmers compared to non-CBO. CBO farmers use more flood-tolerant rice varieties, including hybrids, than the farmers with CBO non-participation. To reduce crop damage, adjustment of planting and harvesting times is very crucial. More CBO farmers (60.37 percent) adjust planting and harvesting times compared to non-CBO farmers (46.67 percent). Farmers are especially concerned about the safety of their livestock in char-lands since livestock are as vulnerable to floods as farmers. To rescue livestock, CBO farmers have a much greater adoption percentage for fodder arrangement (87.80 percent), raising livestock place (81.71 percent), and relocating livestock to a safer place (60.37 percent) than non-CBO farmers, with 76.92, 73.85, and 34.36 percent, respectively. More CBO farmers (59.76 percent) use precautionary money savings as a risk management strategy for dealing with floods’ consequences, compared to non-CBO farmers (42.05 percent). Similarly, more CBO farmers receive credit from formal (73.78 percent) and informal (62.80 percent) sources for household income diversification in comparison to non-CBO farmers. Furthermore, CBO farmers are more likely than non-CBO farmers to participate in non-farming activities as an alternative to supplement their income during floods.
Non-farming strategy adoption is also significantly higher for farmers who participate in CBOs compared to non-participants. When compared to non-CBO farmers, CBO farmers have significantly higher adoption rates for constructing or raising the plinth of the house (56.71 percent), fencing the house (49.39 percent), raising tube wells (59.76 percent), flood-proof sanitation (62.80 percent), boat arrangement (47.56 percent), macha (a bamboo-made high stage or bed) preparation (78.05 percent), and dry food collection (64.63 percent). However, there is no significant difference in the adoption of portable stoves between the two groups. CBO farmers’ adoption of emergency strategies such as shifting valuable goods is significantly higher compared to non-CBO farmers, while there is an insignificant adoption difference for shifting family members between CBO and non-CBO farmers.
These differences suggest that farmers’ participation in CBOs plays an important role in improving their adaptive capacity to floods. However, in our study, the treatment was not randomly assigned, so a simple mean difference of average flood adaptation strategies is not conclusive. Moreover, in this case, the unobserved characteristics of farmers cannot be considered, which may lead to a biased estimate of the mean difference. For this reason, in order to provide more solid evidence of the impact of CBO participation on farmers’ flood adaptation, we employed an endogenous switching regression model. In addition, PSM and IPWRA were used to check the robustness of the results.

3.3. ESR Results

Table 5 illustrates the results of the endogenous switching regression model. Column 2 contains the equation for CBO participation, which provides the determinants for CBO participation, while columns 3 and 4 contain the determinants for adopting flood adaptation strategies for CBO participation and non-participation, respectively. Probit estimates are used to interpret the coefficients in the selection equation. Table 5 shows that the likelihood ratio test for joint independence of the ESR specification is significant at the 1 percent level, indicating that the three equations are interdependent and should not be estimated separately. Based on the findings of the likelihood ratio test of independence, the null hypothesis of no correlation between CBO participation and flood adaptation strategies is rejected, showing that CBO participation is correlated with the adoption of flood adaptation strategies. The covariance terms ( ρ P μ and ρ N μ ) reveal that the correlation between the error terms of the selection equation and the outcome equation for CBO participation ( ρ P μ ) is statistically significant, showing that CBO participation was self-selected.
This means that if farmers decide to participate, CBO participation may not have the same impact on farmers as CBO non-participation. Since the sign of ρ P μ is negative, this indicates a positive selection bias, implying that farmers with above-average adaptation strategies are more likely to participate in CBOs. This result is consistent with the studies [33,36], but differs from the results of other previous studies [37,38]. Since ρ P μ < ρ N μ shows that farmers with CBO participation adopt higher adaptation strategies than farmers who do not participate in CBOs, the required conditions for consistency are also met [30]. However, the impact of CBO participation on flood adaptation strategy adoption is estimated in two steps. First, the results for the determinants of CBO participation are presented, and then the factors that influence farmers’ adoption of flood adaptation strategies are discussed.

3.3.1. Determinants of CBO Participation

Table 5 shows that the number of children under 10 years, distance to the village center, flood experience, and access to information are the most important factors that affect farmers’ participation in CBOs. Having a higher number of children under 10 years old has a significant influence on whether farmers participate in CBOs. This suggests that farmers with more children under 10 have a higher probability of participating in CBOs to prepare for an impending flood threat. Flood experience is a positive predictor that significantly influences farmers’ participation in CBOs. That implies that farmers who have previously been exposed to more severe floods tend to have higher participation in CBOs. The distance of farmers’ houses from the village center is negatively associated with CBO participation, suggesting that farmers who live near the village center are more willing to participate in CBOs. The purpose of the selection equation is to account for unobserved heterogeneity that might influence the flood adaptation obtained from the outcome equations, not to perfectly explain participation in CBOs. To this end, one or more valid instruments must be included in the selection equation. Access to information was identified as an instrumental variable that is highly significant in determining participation in CBOs, suggesting that those who receive information about participation in CBOs from leading NGOs, friends, or relatives may be more motivated to participate in CBOs.

3.3.2. Factors Affecting the Adoption of Flood Adaptation Strategies

The positive and significant determinants of flood adaptation strategies are gender, years of schooling, family size, children under 10 years, annual income, distance to the village center, and flood experience. Although male farmers seem to have higher participation in CBOs, gender shows a significant negative correlation with the adoption of flood adaptation strategies for the farmers with CBO participation. Female farmers who participate in CBOs improve their average flood adaptation by 85.1 percent, while those who do not participate in CBOs improve their average adaptation strategies by 47.7 percent. Years of schooling significantly increase adaptation strategies for farmers with CBO participation. Precisely, the results showed that with CBO participation, each year of schooling increases average flood adaptation strategies significantly by 17.4 percent, but with CBO non-participation, they increase by only 5.6 percent. Having children under 10 years is also significant at the 5% level for farmers who participate in CBOs. CBO participation, in particular, has increased average flood adaptation strategies by 35.9 percent among farmers with more children. Family size only increases average flood adaptation strategies for farmers without participation in CBOs but does not appear to significantly increase adaptation strategies for farmers with CBO participation.
For both categories of farmers, annual income is significantly and positively associated with the adoption of flood adaptation strategies, implying that farmers with higher incomes adopt more flood adaptation strategies. Annual income raises average adaptation by 1.8 percent for CBO participation and by 4.4 percent for non-participation in CBOs. Distance to the village center is positive and significantly correlated with farmers’ adoption of flood adaptation strategies for both CBO participation and non-participation, implying that farmers’ living far from the village center increases the probability of adopting higher average flood adaptation strategies. Flood experiences for both CBO and non-CBO farmers are highly significant and positively correlated with the adoption of flood adaptation strategies, indicating that farmers who have experienced higher numbers of severe floods tend to adopt more flood adaptation strategies. Some variables, such as age, children under 10 years, and disabled family members vary with the sign of the coefficients for CBO and non-CBO due to heterogeneity.

3.3.3. Estimation of Treatment and Heterogeneity Effects

The impact of CBO participation on the adoption of flood adaptation strategies can be shown by estimating the average treatment effect on the treated (ATT), the average treatment effect on the untreated (ATU), and the heterogeneity effect (HE), which are presented in Table 6. The ESR estimates ATT and ATU, considering the selection bias that derives from the fact that CBO and non-CBO farmers may be systematically different, whereas the mean differences in Table 4 may bias the impact of CBO participation on farmers’ adoption of flood adaptation strategies.
Table 6 shows the expected value of the average flood adaptation strategies scores in the counterfactual analysis for CBO participants and non-participants. Cases (a) and (d) are the observed expected average adaptation scores, which is 13.47 for CBO participants and 9.68 for non-participants. A t-test analysis between the two groups reveals that CBO farmers have significantly higher adoption of flood adaptation strategies compared to non-CBO. However, it cannot be attributed to CBO participation alone. Table 6 also reports the treatment effect of CBO participation. In counterfactual case (b), the CBO farmers would have adopted 3.76 fewer adaptation scores if they had not participated in the CBOs.
On the other hand, if the actual non-CBO farmers had participated (counterfactual case (c)), they would have produced 4.82 more flood adaptation scores. The difference between ATT and ATU shows that the transitional heterogeneity effect is negative (TH −1.06), implying that the impact of CBO participation is significantly higher for the actual non-CBO farmers than for the real CBO farmers. The actual non-CBO farmers would have gained 1.06 more adaptation strategies scores compared to the actual CBO farmers if they had participated. The base heterogeneity effects reveal that the non-CBO farmers would have adopted more strategies than the CBO farmers in the counterfactual case (c) but fewer in the counterfactual case (b).

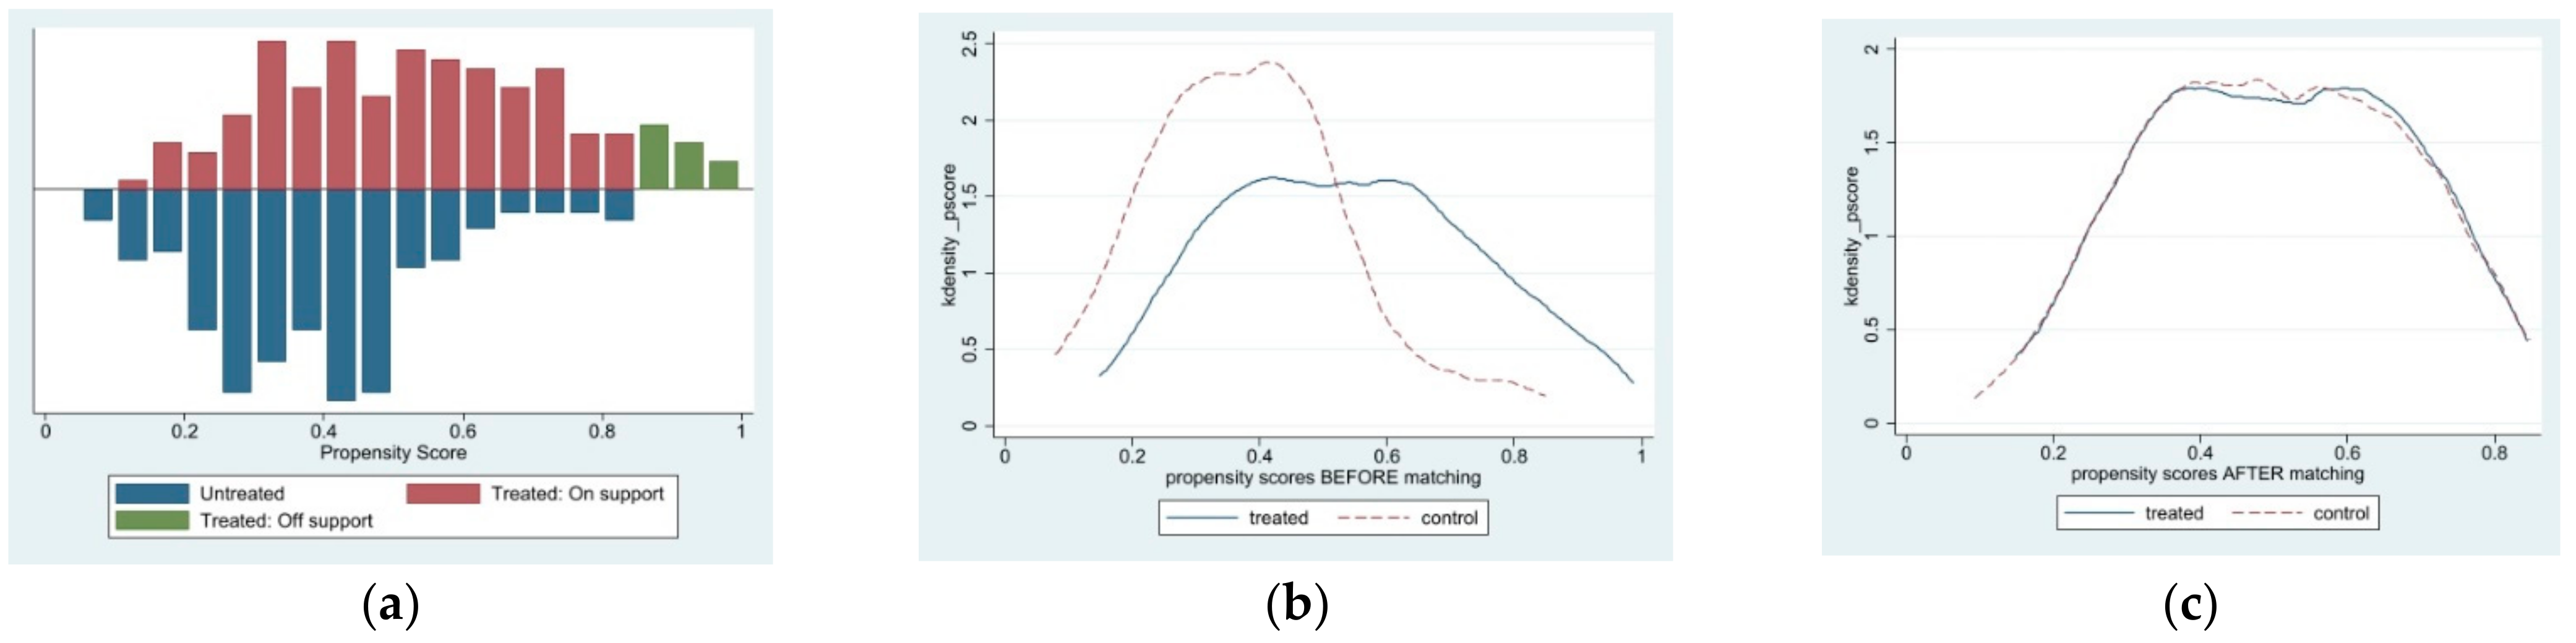
3.4. Robustness Check with PSM and IPWRA

The findings of the ESR model may be limited due to model assumptions, such as the use of instrumental variables to identify the selection process [25]. A robustness test was performed using PSM approaches with two algorithms, nearest neighbor matching (NNM) and kernel-based matching (KBM). From Figure A1, it is found that the probit estimates guarantee a substantial overlap in the propensity score distributions between farmers’ CBO participation and non-participation. This finding indicates that propensity scores of farmers with and without CBO participation are in good overlap, which highlights the necessity of proper matching and the application of the common support requirement to prevent poor matches. Following that, a test of balance checking was run to determine if the covariates are balanced as well as to see if the group differences (farmers who participated in the CBO and those who did not) have been removed. The mean standardized bias decreases from 27.0 percent before matching to 7.7 percent (NNM) and 6.1 percent (KBM) after matching, as shown in Table A2. The test also shows that before matching, all regressors’ joint significance on treatment status cannot be rejected before matching but can be rejected after matching. Similarly, the pseudo-R2, which measures how well the regressors explain the CBO participation probability, falls from 12.2 percent to 1.3 percent (NNM) and 0.8 percent (KBM) at the end of matching. The propensity score estimation is acceptable and indicates no systematic difference after matching in the covariates’ distribution between the treatment and control group since the p-value from the likelihood ratio test is insignificant, and the values of pseudo-R2 and standardized mean bias are low. Table A3 reveals the balance checking of selected covariates between CBO and non-CBO before and after matching. The results show that covariates between CBO participation and non-participation were imbalanced before matching, but the overall balance increased after matching.
When it comes to ATT from robustness tests with PSM and IPWRA (Table 7), we found that farmers’ participation in CBO has a positive and significant influence on their adoption of flood adaptation strategies regardless of the matching technique. Specifically, the impact of CBO participation is 3.36 in NNM and 3.44 in KBM, indicating that the overall adoption of flood adaptation strategies increases by 3.36 and 3.44 for the NNM and KBM, respectively, when farmers participate in CBOs.
The ATT estimation from IPWRA shows that participation in CBOs increases the adoption of flood adaptation strategies by 3.23 compared to non-participation. The IPWRA result is consistent with the PSM results, suggesting that PSM was not misspecified. Most noticeably, as compared to the ESR findings, the PSM and IPWRA results are comparatively low, likely due to considering unobservable characteristics in ESR that are not possible to control when using the PSM technique [39] as well as in the IPWRA method.

4. Discussion

From the descriptive analysis, the test of the mean difference in some selected socioeconomic characteristics of farmers reveals significant differences between CBO and non-CBO farmers. This is a sign of sample selection bias, and ESR results also confirm the positive selection bias, indicating that farmers with above-average flood adaptation strategies have more participation in CBOs, which may be due to some unobserved characteristics such as farmers’ inherent ability, i.e., knowledge and awareness, or the extent of motivation to participate in CBOs. The mean difference in the adoption of flood adaptation strategies is significantly higher for CBO farmers. The reason may be that farmers not only receive flood early warnings from the CBOs but also actively participate in identifying their flood adaptation problems and learn how to take appropriate flood adaptation measures. Moreover, experts from different organizations are invited to the CBO meetings, and farmers learn from the sessions about different adaptation techniques. Furthermore, they can also share their ideas to be more adaptive to flood risk. However, this mean difference is not conclusive, as this finding is only based on observed characteristics. To confirm the net impact of CBO participation, we employed ESR, which simultaneously specifies the participation and adaptation equation.
With respect to the participation equation, it is observed that farmers’ flood experience is a vital driver influencing farmers’ participation in CBOs. In char-lands, farmers are frequently affected by flooding, but the experience of flood severity is not the same for all. Farmers who were more affected by flooding in the past are more likely to participate in CBOs. This result was expected, since earlier literature [40,41,42] has shown that previous experiences are important in the learning process of dealing with floods. This result is also consistent with [43] that people who have been previously exposed to hazards are far more aware than those with no experience of hazards. In this study, farmers with more flood experience are likely to have more flood risk awareness, which may motivate them to participate in CBOs to learn about flood adaptation by sharing knowledge and experiences. It is found that there is a positive correlation between farmers’ number of children under 10 years and CBO participation. Because parents are more concerned about their children’s safety and what they will experience during a natural disaster, they may feel compelled to foresee the repercussions and prepare ahead of time to reduce any negative outcomes [44]. This intention to prepare in advance may motivate farmers to participate in CBOs to learn flood adaptation techniques. The negative correlation of farmers’ house distance to the village center implies that long distance discourages the farmers from participating in CBOs, which is consistent with the findings of Arcand and Fafchamps [45]. It is plausible that riverbank erosion and frequent flooding are acute in char-lands, often causing farmers’ houses to be moved from one location to another in the village, which may reduce their participation. Gender is not significant, but the magnitude of the coefficient is larger, indicating higher male participation compared to female farmers. Jaafar et al. [46] reported that gender has a significant effect on community participation, which may be due to the fact that women from socially weaker backgrounds often have low self-confidence, which hinders their participation.
In the second stage, ESR identifies the factors affecting farmers’ adoption of flood adaptation strategies, which is another important aspect of this study. The coefficient estimates for the CBO participation and non-participation regimes differ considerably for several of the variables, showing that the switching regression technique is preferable to a simple treatment effects model. Results find a significant negative correlation of gender with adoption of flood adaptation strategies for CBO farmers that females adopt more compared to males. Several studies examining the relationship between gender and flood preparedness have shown that women are more prepared than men [47], particularly when it comes to making a family emergency plan, keeping family members safe, and carrying out preparedness messages [48]. Women are more concerned about flooding than men and are more likely to take action to adapt to flooding [49]. Ruslanjari et al. [50] also found that the role of women in reducing disaster risk is in the emergency phase, i.e., saving themselves and their family members. Farmers’ years of schooling is also significant for flood adaptation of CBO farmers. Flood adaptation is related to how people perceive and respond to risk information [51]. Because educated individuals are better equipped to interpret risk information, they are more conscious of flood risk. Muttarak and Pothisiri [52] also found that formal education is positively correlated with taking precautionary measures at the individual, family, and societal levels, but numerous studies have shown that the influence of education on precautionary behavior is small or nonexistent [43,53,54]. The number of children under 10 years also significantly affects farmers’ flood adaptation strategies for CBO participation. This is because high numbers of small children and other dependents are associated with increased vulnerability [55]. Children under 10 years old in Bangladesh are dependent on their parents and often cannot swim, making them more vulnerable and causing parents to be more concerned about their safety during floods. This finding is also consistent with farmers’ higher participation in CBOs with more children under 10 years of age. Stojanov et al. [56] also found that individuals with a larger number of children are more inclined to implement additional flood-prevention measures. Family size is a significant predictor only for the farmers with CBO non-participation. The average number of family members in char-lands is high, and many joint families with more elderly people and more resources are found in char-lands, making it easier for them to adopt more adaptation strategies. On the other hand, small households have potentially limited resources [57], and people living alone tend to be less prepared for disasters [58]. Similar results were found by [59,60], according to which family size is positively correlated with flood adaptation behavior.
Annual income significantly increases adaptation strategies for both CBO and non-CBO farmers. Flood adaptation strategies, such as the construction of houses, flood-proof sanitation, raising tube wells for safe drinking water, boat preparation, etc., require adequate financial resources in Bangladesh that are affordable only to farmers with sufficient income. This finding is also consistent with [56,61], that income is largely correlated with the implementation of flood control measures, but some studies still found an insignificant relationship between income and adaptation strategies [43,62]. Farmers’ house distance to the village center was negatively correlated with CBO participation but positively associated with flood adaptation strategies for both CBO and non-CBO farmers. A reasonable explanation for the positive effect may be that people living far from the village center are more vulnerable to flood risk because they are less likely to seek help from others due to their greater distance from larger communities, which may influence their higher adoption. In addition, farmers living in char-lands with higher distances from the village center appear to have comparatively more proximity to the river in the char-lands, which may also influence their adaptation behavior. Flood experience has a significant influence on the adoption of flood adaptation strategies by both CBO participants and non-participants, which is consistent with other results [59,63]. Previous flood experience was associated with increased risk perception and flood preparedness, and individuals who had experienced floods had stronger feelings about future floods and stronger intentions to take adaptation measures than those who had not [54]. According to [64], previous experience with flood damage and future damage projections increases the probability of mitigation.
Results from treatment effect analysis show that CBO participation grants higher adaptation strategy adoption in comparison with non-participation. This result indicates that farmers who participated in CBOs would have gained less if they had not participated, and those who did not participate would have gained more if they had participated in CBOs for flood adaptation adoption. The average treatment effect estimated from PSM and IPWRA is also consistent with ESR results.
This study concentrated on the role of CBOs in response to the 2020 flood. The country experienced 0.3 percent more rainfall than usual during the 2020 monsoon. The Jamuna flowed above the danger level (13.35 m) at Sirajganj point for 37 days during the monsoon. The maximum flooding occurred during the 2020 monsoon season, covering 40% of the country [65], and it was the country’s longest flooding period in 22 years [66]. In some of the areas, notably in the char-lands, there was severe riverbank erosion and flooding. Results show that farmers who participated in CBOs employed significantly more flood adaption strategies than non-CBO farmers. From the farmers’ opinions during the survey, it was noted that CBO participation had enabled them to lessen flood loss in response to the 2020 flood since they had effective adaptation measures, which supports the findings of this study. As a future perspective, CBOs are expected to help the farm communities in the char-lands adapt to future extreme flood events like the 2020 flood or worse.
Based on the evidence of significant contributions by CBOs, it can be assumed that CBOs have the potential to make farm communities resilient to flood shocks. Alhassan [67] also highlighted the importance of farmer-based organizations (FBOs), where FBOs enhance farmers’ resilience to flood effects. In this study, CBOs have been found as an effective tool for disseminating agricultural flood adaptation knowledge, and as a result, they may contribute to sustainable farming through the dissemination of flood-tolerant agricultural technologies. However, the sustainability of these CBOs in the char-lands is a concern. Adequate trust, knowledge, leadership, and funding are the major challenges to the sustainability of these organizations [22]. Datta [68] highlighted the importance of leadership for the sustainability of CBOs in Bangladesh. Government interventions are obvious to sustain the CBO activities for sustainable adaptation to flooding effects.

5. Conclusions and Policy Recommendations

5.1. Summary of Results and Conclusions

Flooding is a frequent disaster in Bangladesh. People living in char-lands are most exposed to floods and rely on community-based organizations (CBOs) for flood adaptation. Based on data obtained from the char-lands of the Sirajganj district, Bangladesh, we explored the potential impact of CBO participation on farmers’ adoption of flood adaption strategies. ESR results reveal evidence of positive selection bias in the covariate distribution between CBO and non-CBO farmers, implying the justification of selection bias consideration. From the ESR estimates in the first stage, it is found that CBO participation favors farmers who have access to information on CBO participation, more children under 10 years old, and those who experienced more severe floods and reside close to the village center. In the second stage of ESR, socio-economic factors such as the number of children under 10 years, years of schooling, family size, annual income, distance to the village center, and flood experience significantly influence the farmers’ adoption of flood adaptation strategies. The ultimate finding from the impact assessment in ESR is that CBO participation has increased average flood adaptation by 3.76, while from PSM estimates, farmers’ average flood adaptation has increased by 3.36 for NNM and by 3.44 for KBM due to CBO participation. The CBO participation impact obtained from IPWRA is 3.23, which is consistent with ESR and PSM approaches. In counterfactual analysis, it is found that CBO participation is also effective for farmers who did not participate in CBOs. This positive and significant impact of CBO participation on farmers’ flood adaptation reaffirms the potential role of CBO participation in raising farmers’ flood adaptation capacity.

5.2. Policy Recommendations

These findings are especially significant in developing strategies for effective community-based flood risk communication to adapt to the potential consequences of flooding. Public policies can play a critical role in assisting farmers in adapting to floods. Though male participation in CBOs seems to be higher, female participation is notable in the adoption of flood adaptation measures. Thus, attention can be drawn to the enhancement of female participation in CBOs. As flood experience drives the farmers’ participation in CBOs, raising awareness and capacity-building programs in rural char-lands can be useful to increase farmers’ flood risk awareness that can increase CBO participation. Since farmers with better access to information on CBOs have more participation in CBOs, the facilitation of access to information regarding CBO participation is important.
The government of Bangladesh has prepared a National Plan for Disaster Management (NPDM) for 2021–2025 under the Ministry of Disaster Management and Relief (MoDMR), which takes a “whole society approach” involving all public and private sectors and communities themselves. However, this plan lacks adequate attention to community involvement through the platform of CBOs for effective flood risk communication in remote rural areas such as char-lands. Therefore, the government can focus on community-based flood risk communication through CBOs with the collaboration of NGOs and local authorities. The most important challenge of CBO performance is its sustainability because it is common to find that most CBOs stop their activities when they become independent from the leading NGOs. Thus, the government should take interventions regarding the strengthening and institutionalization of existing CBOs to promote successful flood adaptation. Empowerment of these CBOs can enhance their sustainability, which will contribute to sustainable farming in char-lands through improving farmers’ flood adaptation capacity. Although the outcome of this research is confined to char-lands, the evidence from this research can guide policymakers to expand CBO activities in other flood-prone areas of Bangladesh.

5.3. Limitations of the Study

The key limitation of this study is that the treatment was not assigned at random; rather, it was given ex post facto, so it is not possible to compare adaptation strategies with and without treatment effects on the same people. Another limitation of this study is that it was difficult to increase our sample size due to the COVID-19 pandemic. This study is limited to one sub-district where CBOs are operated by one local NGO. Future studies considering other CBOs operated by different organizations in other areas are required to elucidate the differential impact of the CBOs so that policy makers can formulate a common policy for the upscaling of existing CBO activities. Moreover, future research should look at the motives for participating in CBOs as well as expectations for outcomes and barriers to participation in CBOs. Furthermore, potential future research could be to provide different dimensions to the present analysis, including actual climate variables such as precipitation, rainfall, temperature, etc.

Author Contributions

Conceptualization, M.O.F. and K.L.M.; methodology, M.O.F.; validation, M.O.F. and K.L.M.; software, M.O.F.; formal analysis, investigation, resources, data curation, M.O.F.; writing original draft preparation, M.O.F.; writing review and editing, M.O.F. and K.L.M.; visualization, M.O.F.; supervision, K.L.M. All authors have read and agreed to the published version of the manuscript.

Funding

There was no external funding for this research.

Institutional Review Board Statement

The study was conducted according to the guidelines and approved by the Ethics Committee of Graduate School for International Development and Cooperation (IDEC), Hiroshima University, Japan, on 31 August 2021.

Informed Consent Statement

All farmers who took part in this study provided their informed consent.

Data Availability Statement

The data presented in this study are available on request from the corresponding author.

Acknowledgments

The authors would like to thank the Project for Human Resource Development Scholarship (JDS) organized by Japan International Cooperation Center (JICE), which facilitated the master’s study of M.O.F. at Hiroshima University, Japan.

Conflicts of Interest

The authors declare no conflict of interest.

Appendix A

Table A1. Validity test of the selection instrument.
Parameter EstimatesModel 1
(CBO Participation, 1 for Participation, 0 for Otherwise)
Model 2
Adoption of Flood Adaptation Strategies
Access to information1.322 *** (0.169)0.30 (0.278)
Constant−1.526 *** (0.411)1.522 * (0.782)
Wald test on instrumentχ2 = 96.30 ***F-stat = 0.01
Observations359195
Note: *** and * denote significance level at 1% and 10%. Standard errors in parentheses. Source: Authors’ own calculation.
Figure A1. Propensity score graph: (a) overlap of the treated vs. untreated (b) before matching, (c) after matching.
Sustainability 14 08959 g0a1
Table A2. Matching quality test.
MatchingPseudo R2LR χ2p-ValueMean BiasMed Bias
BeforeAfterBeforeAfterBeforeAfterBeforeAfterBeforeAfter
NNM0.1220.01360.365.180.0000.87927.07.720.66.8
KBM0.1220.00860.363.240.0000.97527.06.120.66.8
Source: Authors’ own calculation.
Table A3. Balance checking of the covariates for CBO participation and non-participation.
CovariatesBefore MatchingAfter Matching (NNM)After Matching (KBM)
Meanp-ValueMeanp-Value% Bias ReductionMeanp-Value% Bias Reduction
TreatedControlTreatedControlTreatedControl
Age45.2147.340.15545.6246.580.53354.845.6244.320.41239.4
Gender0.710.700.7420.700.730.608−68.00.700.720.743−8.1
Years of schooling3.352.620.0233.052.530.13329.43.052.750.38659.7
Family size5.745.390.1035.605.280.1495.85.605.470.54860.5
Children under 10 years1.531.170.0001.441.360.43379.61.441.350.37777.3
Disabled family member0.200.130.1140.190.200.88589.10.190.190.93594.0
Farm size151.01115.790.000135.60131.180.60687.5135.60129.260.48182.0
Annual income48.6240.380.00044.9843.470.49081.744.9843.500.51482.0
Distance to the village center25.7627.640.12126.5025.710.51957.526.5025.770.57760.8
Flood experience2.732.310.0002.642.650.87396.82.642.640.96199.0
Note: p < 0.01 and p < 0.05 denote 1% and 5% level of significance, respectively. Source: Authors’ own calculations.

References

  1. Hossain, B. Role of organizations in preparedness and emergency response to flood disaster in Bangladesh. Geoenvironmental Disasters 2020, 7, 33. [Google Scholar] [CrossRef]
  2. Brouwer, R.; Akter, S.; Brander, L.; Haque, E. Socioeconomic Vulnerability and Adaptation to Environmental Risk: A Case Study of Climate Change and Flooding in Bangladesh. Risk Anal. 2007, 27, 313–326. [Google Scholar] [CrossRef] [PubMed] [Green Version]
  3. Kelly, C.; Chowdhury, M.H.K. Poverty, Disasters and the Environment in Bangladesh: A Quantitative and Qualitative Assessment of Causal Linkages; Bangladesh Issues Paper; UK Department for International Development: Dhaka, Bangladesh, 2002. [Google Scholar]
  4. Mondal, M.S.; Rahman, M.A.; Mukherjee, N.; Huq, H.; Rahman, R. Hydro-climatic hazards for crops and cropping system in the chars of the Jamuna River and potential adaptation options. Nat. Hazards 2015, 76, 1431–1455. [Google Scholar] [CrossRef]
  5. Paul, S.; Islam, M.R. Ultra-poor char people’s rights to development and accessibility to public services: A case of Bangladesh. Habitat Int. 2015, 48, 113–121. [Google Scholar] [CrossRef]
  6. Islam, M.N. Flood risks for the char community on the Ganges-Padma floodplain in Bangladesh. Int. J. Environ. 2012, 2, 106–116. [Google Scholar]
  7. Alam, M.R.; Malak, M.A.; Quader, M.A. Livelihood Vulnerability of Char Land People in Brahmaputra-Jamuna River System. Jagannath Univ. J. Life Earth Sci. 2018, 4, 54–64. [Google Scholar]
  8. Islam, S. Coping strategies, preparedness and emergency response of char-land peoples in Flood Disaster: A case study in Kurigram, Bangladesh. Int. J. Sci. Eng. Res. 2016, 7, 169–179. [Google Scholar]
  9. Al-Mueed, M.; Chawdhery, M.R.A.; Harera, E.; Alhazmi, R.; Mobrad, A.; Althunayyan, S.; Al-Wathinani, A. Potential of Community Volunteers in Flood Early Warning Dissemination: A Case Study of Bangladesh. Int. J. Environ. Res. Public Health 2021, 18, 3010. [Google Scholar] [CrossRef] [PubMed]
  10. Lo, A. The role of social norms in climate adaptation: Mediating risk perception and flood insurance purchase. Glob. Environ. Chang. 2013, 23, 1249–1257. [Google Scholar] [CrossRef]
  11. Fekete, A. Safety and security target levels: Opportunities and challenges for risk management and risk communication. Int. J. Disaster Risk Reduct. 2012, 2, 67–76. [Google Scholar] [CrossRef]
  12. Haer, T.; Botzen, W.J.W.; Aerts, J.C.J.H. The effectiveness of flood risk communication strategies and the influence of social networks—Insights from an agent-based model. Environ. Sci. Policy 2016, 60, 44–52. [Google Scholar] [CrossRef]
  13. Scolobig, A.; Prior, T.; Schrter, D.; Jrin, J.; Patt, A. Towards people-centred approaches for effective disaster risk management: Balancing rhetoric with reality. Int. J. Disaster Risk Reduct. 2015, 12, 202–212. [Google Scholar] [CrossRef]
  14. Huq, S.M.S. Community based disaster management strategy in Bangladesh: Present status, future prospects and challenges. Eur. J. Res. Soc. Sci. 2016, 4, 2. [Google Scholar]
  15. Cayamanda, K.J.G.; Paunlagui, M.M. Towards a Community-Based Risk Communication Management: The Case of the Flood-Vulnerable Communities of Davao City. 12. 2020. Available online: https://www.researchgate.net/publication/346718706_Towards_a_community-based_risk_communication_management_the_case_of_the_flood-vulnerable_communities_of_Davao_City (accessed on 24 April 2022).
  16. Bland, D.; Aldrich, D.P. Building Resilience: Social Capital in Post-Disaster Recovery; University of Chicago Press: Chicago, IL, USA, 2012; p. 232. [Google Scholar]
  17. Kahssay, H.M.; Oakley, P. Community Involvement in Health Development: A Review of the Concept and Practice. 1999. Available online: https://apps.who.int/iris/handle/10665/42151 (accessed on 12 May 2022).
  18. Fnfgeld, H. Facilitating local climate change adaptation through transnational municipal networks. Curr. Opin. Environ. Sustain 2015, 12, 67–73. [Google Scholar] [CrossRef]
  19. Kellens, W.; Zaalberg, R.; Neutens, T.; Vanneuville, W.; De Maeyer, P. An analysis of the public perception of flood risk on the Belgian coast. Risk Anal. Int. J. 2011, 31, 1055–1068. [Google Scholar] [CrossRef] [PubMed] [Green Version]
  20. Khanal, U.; Wilson, C.; Hoang, V.; Lee, B. Impact of community-based organizations on climate change adaptation in agriculture: Empirical evidence from Nepal. Environ. Dev. Sustain. 2019, 21, 621–635. [Google Scholar] [CrossRef]
  21. Shaw, R. Critical Issues of Community Based Flood Mitigation: Examples From Bangladesh and Vietnam. J. Sci. Cult. Spec. Issue 2006, 72, 62. [Google Scholar]
  22. Thompson, P.M. Sustainability of Community-Based Organizations in Bangladesh. Soc. Nat. Resour. 2013, 26, 778–794. [Google Scholar] [CrossRef]
  23. Winters, P.; Maffioli, A.; Salazar, L. Introduction to the Special Feature: Evaluating the Impact of Agricultural Projects in Developing Countries. J. Agric. Econ. 2011, 62, 393–402. [Google Scholar] [CrossRef]
  24. Rosenbaum, P.; Rubin, D. The Central Role of the Propensity Score in Observational Studies For Causal Effects. Biometrika 1983, 70, 41–55. [Google Scholar] [CrossRef]
  25. Abdallah, A.; Ayamga, M.; Awuni, J.A. Impact of agricultural credit on farm income under the Savanna and Transitional zones of Ghana. Agric. Financ. Rev. 2018, 79, 60–84. [Google Scholar] [CrossRef]
  26. Rana, M.; Maharjan, K.L. Participation of Brinjal Farmers in Large and Small Wholesale Markets: Factors Influencing Farmers’ Decisions and Impact on Producers’ Prices. Sustainability 2022, 14, 2357. [Google Scholar] [CrossRef]
  27. Moahid, M.; Khan, G.D.; Yoshida, Y.; Joshi, N.P.; Maharjan, K.L. Agricultural Credit and Extension Services: Does Their Synergy Augment Farmers’ Economic Outcomes? Sustainability 2021, 13, 3758. [Google Scholar] [CrossRef]
  28. Greene, W.H. Econometric Analysis; Prentice Hall: Hoboken, NJ, USA, 2008. [Google Scholar]
  29. Wooldridge, J.M. Inverse probability weighted M-estimators for sample selection, attrition, and stratification. Port. Econ. J. 2002, 1, 117–139. [Google Scholar] [CrossRef]
  30. Lokshin, M.; Sajaia, Z. Maximum Likelihood Estimation of Endogenous Switching Regression Models. Stata J. 2004, 4, 282–289. [Google Scholar] [CrossRef] [Green Version]
  31. Di Falco, S.; Veronesi, M.; Yesuf, M. Does Adaptation to Climate Change Provide Food Security? A Micro-Perspective from Ethiopia. Am. J. Agric. Econ. 2011, 93, 829–846. [Google Scholar] [CrossRef] [Green Version]
  32. Kumar, A.; Saroj, S.; Joshi, P.K.; Takeshima, H. Does cooperative membership improve household welfare? Evidence from a panel data analysis of smallholder dairy farmers in Bihar, India. Food Policy 2018, 75, 24–36. [Google Scholar] [CrossRef] [Green Version]
  33. Adego, T.; Simane, B.; Getachew, A.W. The impact of adaptation practices on crop productivity in northwest Ethiopia: An endogenous switching estimation. Dev. Stud. Res. 2019, 6, 129–141. [Google Scholar] [CrossRef] [Green Version]
  34. Carter, D.W.; Milon, J.W. Price knowledge in household demand for utility services. Land Econ. 2005, 81, 265–283. [Google Scholar] [CrossRef]
  35. Rahman, M.; Siddik, M. Livelihood Analysis of the Char Dwellers Using Capital Asset Framework. J. Environ. Sci. Nat. Resour. 2018, 11, 27–36. [Google Scholar] [CrossRef]
  36. Bidzakin, J.K.; Fialor, S.C.; Awunyo-Vitor, D.; Yahaya, I. Impact of contract farming on rice farm performance: Endogenous switching regression. Cogent Econ. Financ. 2019, 7, 8229. [Google Scholar] [CrossRef]
  37. Kabunga, N.S.; Dubois, T.; Qaim, M. Yield Effects of Tissue Culture Bananas in Kenya: Accounting for Selection Bias and the Role of Complementary Inputs. J. Agric. Econ. 2012, 63, 444–464. [Google Scholar] [CrossRef] [Green Version]
  38. Fitawek, W.; Hendriks, S.L. Evaluating the Impact of Large-Scale Agricultural Investments on Household Food Security Using an Endogenous Switching Regression Model. Land 2021, 10, 323. [Google Scholar] [CrossRef]
  39. Khandker, S.R.; Koolwal, G.B.; Samad, H.A. Handbook on Impact Evaluation: Quantitative Methods and Practices. 2009. Available online: https://openknowledge.worldbank.org/handle/10986/2693 (accessed on 30 April 2022).
  40. Burningham, K.; Fielding, J.; Thrush, D. ‘It’ll never happen to me’: Understanding public awareness of local flood risk. Disasters 2008, 32, 216–238. [Google Scholar] [CrossRef] [PubMed] [Green Version]
  41. Miceli, R.; Sotgiu, I.; Settanni, M. Disaster preparedness and perception of flood risk: A study in an alpine valley in Italy. J. Environ. Psychol. 2008, 28, 164–173. [Google Scholar] [CrossRef]
  42. Pagneux, E.; Gísladóttir, G.; Jonsdottir, S. Public Perception of Flood Hazard and Flood Risk in Iceland: A Case Study in a Watershed Prone to Ice-jam Floods. Nat. Hazards 2011, 58, 269–287. [Google Scholar] [CrossRef]
  43. Lindell, M.K.; Hwang, S.N. Households’ Perceived Personal Risk and Responses in a Multihazard Environment. Risk Anal. 2008, 28, 539–556. [Google Scholar] [CrossRef]
  44. Pfefferbaum, B.; North, C.S. Children and families in the context of disasters: Implications for preparedness and response. Fam. Psychol. Bull. Div. Fam. Psychol. 2008, 24, 6–10. [Google Scholar] [CrossRef]
  45. Arcand, J.; Fafchamps, M. Matching in community-based organizations. J. Dev. Econ. 2012, 98, 203–219. [Google Scholar] [CrossRef]
  46. Jaafar, M.; Rasoolimanesh, S.M.; Ismail, S. Perceived sociocultural impacts of tourism and community participation: A case study of Langkawi Island. Tour. Hosp. Res. 2015, 17, 123–134. [Google Scholar] [CrossRef]
  47. Onuma, H.; Shin, K.J.; Managi, S. Household preparedness for natural disasters: Impact of disaster experience and implications for future disaster risks in Japan. Int. J. Disaster Risk Reduct. 2017, 21, 148–158. [Google Scholar] [CrossRef] [Green Version]
  48. Mulilis, J. Gender and earthquake preparedness: A research study of gender issues in disaster management: Differences in earthquake preparedness due to traditional stereotyping or cognitive appraisal of threat? Aust. J. Emerg. Manag. 1999, 14, 41–50. [Google Scholar]
  49. Hu, D.; Pai, J.; Chen, Y. A Study of Flood Disaster Risk Communication Model and Adaptive Behaviours for River-Watershed residents in Taiwan. Int. Rev. Spat. Plan. Sustain Dev. 2018, 6, 128–147. [Google Scholar] [CrossRef] [Green Version]
  50. Ruslanjari, D.; Wahyunita, D.I.; Permana, R.S. Peran Gender pada Siklus Manajemen Bencana di Sektor Sosial Ekonomi Rumah Tangga Tani (Bencana Alam Gempabumi dan Letusan Gunungapi). J. Kawistara 2017, 7, 78–93. [Google Scholar] [CrossRef] [Green Version]
  51. Perry, R.W.; Lindell, M.K.; Tierney, K.J. Facing the Unexpected: Disaster Preparedness and Response in the United States. 2001. Available online: https://books.google.co.jp/books?hl=en&lr=&id=PsLDQFC7arkC&oi=fnd&pg=PT15&dq=Perry,+R.W.%3B+Lindell,+M.K.%3B+Tierney,+K.J.+Facing+the+unexpected:+Disaster+preparedness+and+response+in+the+United+States%3B+2001.&ots=QwP0qe0ihP&sig=wQTGu7SWGxtvrekrLUbg9srUcO4&redir_esc=y#v=onepage&q&f=false (accessed on 19 May 2022).
  52. Muttarak, R.; Pothisiri, W. The role of education on disaster preparedness: Case study of 2012 Indian Ocean earthquakes on Thailand’s Andaman Coast. Ecol. Soc. 2013, 18, 1–16. [Google Scholar] [CrossRef] [Green Version]
  53. Grothmann, T.; Reusswig, F. People at risk of flooding: Why some residents take precautionary action while others do not. Nat. Hazards 2006, 38, 101–120. [Google Scholar] [CrossRef]
  54. Zaalberg, R.; Midden, C.; Meijnders, A.; McCalley, T. Prevention, Adaptation, and Threat Denial: Flooding Experiences in the Netherlands. Risk Anal. 2009, 29, 1759–1778. [Google Scholar] [CrossRef]
  55. Cutter, S.L.; Boruff, B.J.; Shirley, W.L. Social vulnerability to environmental hazards. Soc. Sci. Q. 2003, 84, 242–261. [Google Scholar] [CrossRef]
  56. Stojanov, R.; Duží, B.; Daněk, T.; Němec, D.; Procházka, D. Adaptation to the impacts of climate extremes in central Europe: A case study in a rural area in the Czech Republic. Sustainability 2015, 7, 12758–12786. [Google Scholar] [CrossRef] [Green Version]
  57. Dziaek, J.; Biernacki, W.; Fiedeń, Ł.; Listwan-Franczak, K.; Franczak, P. Universal or context-specific social vulnerability drivers—Understanding flood preparedness in southern Poland. Int. J. Disaster Risk Reduct. 2016, 19, 212–223. [Google Scholar] [CrossRef]
  58. Fekete, A. Assessment of Social Vulnerability for River-Floods in Germany. 2010. Available online: https://www.researchgate.net/publication/215646258_Assessment_of_Social_Vulnerability_to_River-Floods_in_Germany (accessed on 8 June 2022).
  59. Poussin, J.K.; Botzen, W.J.W.; Aerts, J.C.J.H. Factors of influence on flood damage mitigation behaviour by households. Environ. Sci. Policy 2014, 40, 69–77. [Google Scholar] [CrossRef]
  60. Mishra, S.; Suar, D. Effects of Anxiety, Disaster Education, and Resources on Disaster Preparedness Behavior. J. Appl. Soc. Psychol. 2012, 42, 1069–1087. [Google Scholar] [CrossRef]
  61. Thistlethwaite, J.; Henstra, D.; Brown, C.; Scott, D. How flood experience and risk perception influences protective actions and behaviours among Canadian homeowners. Environ. Manag. 2018, 61, 197–208. [Google Scholar] [CrossRef]
  62. Box, P.; Thomalla, F.; Van den Honert, R. Flood Risk in Australia: Whose Responsibility Is It, Anyway? Water 2013, 5, 1580–1597. [Google Scholar] [CrossRef] [Green Version]
  63. Pathak, S. Determinants of flood adaptation: Parametric and semiparametric assessment. J. Flood Risk Manag. 2021, 14, e12699. [Google Scholar] [CrossRef]
  64. Osberghaus, D. The determinants of private flood mitigation measures in Germany—Evidence from a nationwide survey. Ecol. Econ. 2015, 110, 36–50. [Google Scholar] [CrossRef] [Green Version]
  65. Flood Forecasting and Warning Centre (FFWC). Annual Flood Report 2020. Available online: www.ffwc.gov.bd (accessed on 10 July 2022).
  66. International Federation of Red Cross and Red Crescent Societies (IFRC). Bangladesh: Monsoon Floods. 2021. Available online: https://reliefweb.int/report/bangladesh/bangladesh-monsoon-floods-final-report-n-mdrbd025 (accessed on 10 July 2022).
  67. Alhassan, H. Farm households’ flood adaptation practices, resilience and food security in the Upper East region, Ghana. Heliyon 2020, 6, e04167. [Google Scholar] [CrossRef]
  68. Datta, D. Sustainability of community-based organizations of the rural poor: Learning from Concern’s rural development projects, Bangladesh. Community Dev. J. 2007, 42, 47–62. [Google Scholar] [CrossRef]
Figure 1. Map of the study area. Source: Authors.
Sustainability 14 08959 g001
Table 1. Sample size distribution.
UnionsVillagesTotal FarmersSample Size
CBO FarmersNon-CBO FarmersTotal
GhorjanMuradpur500332760
Har Ghorjan300263460
Boro Ghorjan250253560
SthalSouth Nouhata295283260
North Nouhata223233760
Chaluhara225293059
Total 1793164195359
Source: Survey, 2021.
Table 2. Description of variables.
No.VariablesDefinition and Measurement
1.Outcome variable
Total flood adaptation strategies scores
1 if adopted by farmers, 0 otherwise
2.Treatment variable
CBO participation
1 if farmer participated, 0 otherwise
3.AgeAge of farmers in years
4.Gender1 if male, 0 otherwise
5.Years of schoolingNo. of years of schooling
6.Family sizeNo. of family members
7.Children under 10 yearsNo. of children under 10 years old
8.Disabled family member1 if a disabled member in the family, 0 otherwise
9.Farm sizeLand under cultivation in decimal
10.Annual incomeIncome in thousand BDT
11.Distance to the village centerDistance in minutes
12.Flood experienceNo. of severe floods experienced in the past 10 years
13.Instrumental variable
Access to information
1 if farmers received information regarding CBO participation, 0 otherwise
Source: Authors’ own elaborations.
Table 3. Farmers’ socio-economic characteristics.
VariablesCBO Participation (n = 164)CBO Non-Participation (n = 195)Mean
Difference
p-Value
MeanSDMeanSD
Age45.2114.0047.3514.312.140.155
Gender0.710.450.700.46−0.010.741
Years of schooling3.353.042.623.03−0.73 **0.023
Family size5.742.275.391.77−0.350.103
Children under 10 years1.530.901.170.80−0.36 ***0.000
Disabled family member0.200.400.130.34−0.070.114
Farm size151.01106.71115.7968.27−35.22 ***0.000
Annual income48.6225.1840.3818.38−8.24 ***0.000
Distance to the village center25.7611.4227.6411.281.880.121
Flood experience2.730.722.310.71−0.42 ***0.000
Access to information0.880.320.400.49−0.48 ***0.000
Note: *** and ** denote significance level at 1% and 5%. SD = standard deviation. Source: Authors’ own calculation.
Table 4. Farmers’ flood adaptation strategies adoption by CBO participation status.
VariablesFrequency and Percentage of Adoptionp-Value
CBO Participation (n = 164)CBO Non-Participation (n = 195)
Farming and livelihood adaptation strategies
Growing seedling in pot or sandbag83 (50.61)54 (27.69)0.000 ***
Mixed cropping114 (69.51)88 (45.13)0.000 ***
Changing crop variety87 (53.05)58 (29.74)0.000 ***
Adjustment of planting and harvesting time99 (60.37)91 (46.67)0.010 **
Fodder arrangement144 (87.80)150 (76.92)0.008 **
Raising of livestock place134 (81.71)144 (73.85)0.076 *
Relocating livestock99 (60.37)67 (34.36)0.000 ***
Money savings98 (59.76)82 (42.05)0.001 ***
Informal credit 103 (62.80)119 (61.03)0.730
Formal credit 121(73.78)66 (33.85)0.000 ***
Alternative occupation during flood95 (57.93)65 (33.33)0.000 ***
Non-farming adaptation strategies
Construction or raising the plinth of the house 93 (56.71)57 (29.23)0.000 ***
Fencing house81 (49.39)56 (28.72)0.001 **
Raising tube wells98 (59.76)66 (33.85)0.000 ***
Flood-proof sanitation103 (62.80)59 (30.26)0.000 ***
Portable stoves143 (87.20)160 (82.05)0.181
Arrangement of boat78 (47.56)57 (29.23)0.001 ***
Macha preparation128 (78.05)132 (67.69)0.029 **
Dry food collection106 (64.63)101 (51.79)0.014 **
Shifting family 99 (60.37)110 (56.41)0.449
Shifting valuable goods106 (64.63)106 (54.36)0.049 **
Total adaptation strategies scores (mean + SD)13.49 (2.76)9.68 (3.02)0.000 ***
Note: Significance at *** 1%, ** 5%, * 10%. Percentage in parentheses. Source: Authors’ own calculation.
Table 5. Parameters estimates of CBO participation and flood adaptation equations.
VariablesCBO ParticipationAdoption of Flood Adaptation Strategies
CBO Farmers (n = 164)Non-CBO Farmers (n = 195)
Age−0.004 (0.006)−0.000 (0.010)0.001 (0.011)
Gender0.159 (0.174)−0.851 ** (0.312)−0.477 (0.310)
Years of schooling−0.009 (0.028)0.174 *** (0.053)0.056 (0.046)
Family size−0.049 (0.043)0.043 (0.072)0.211 ** (0.091)
Children under 10 years0.234 ** (0.097)0.359 **(0.169)−0.159 (0.182)
Disabled family member0.135 (0.205)0.121 (0.343)−0.648 (0.397)
Farm size0.001 (0.001)−0.001 (0.002)−0.001 (0.003)
Annual income0.005 (0.006)0.018 ** (0.008)0.048 ***(0.012)
Distance to the village center−0.020 *** (0.007)0.055 ***(0.012)0.116 *** (0.014)
Flood experience0.311 ** (0.120)1.121 ***(0.264)0.974 ***(0.213)
Access to information1.328 *** (0.165)--
Constant−1.517 ***(0.402)8.474 ***(0.815)1.497 **(0.767)
σ P 1.841 *** (0.159)
σ N 1.832 *** (0.100)
ρ P μ −0.819 *** (0.095)
ρ N μ −0.239 (0.201)
Wald chi2(10) = 165.30 Log likelihood = −871.047; Prob > chi2 = 0.000  
LR test of independenceChi2(1) = 15.80   Prob > chi2 = 0.000
Note: *** and ** denote significance level at 1% and 5%. Standard errors in parentheses. Source: Authors’ own calculation.
Table 6. Average expected treatment and heterogeneity effects.
OutcomesParticipation StatusParticipation DecisionCBO Participation
Effect
CBONon-CBO
Flood adaptation strategies scoresATT (CBO)(a)
13.47 (0.18)
(b)
9.71 (0.20)
3.76 *** (0.27)
ATU (non-CBO)(c)
14.50 (0.12)
(d)
9.68 (0.17)
4.82 *** (0.21)
Heterogeneity effect−1.03 *** (0.21)0.03 (0.26)−1.06 *** (0.14)
Note: *** denotes significance level at 1%. Standard errors in parentheses. Source: Authors’ own calculation.
Table 7. Robustness check with PSM and IPWRA.
ItemAverage Treatment Effect on Treated (ATT)
PSM (NNM)PSM (KBM)IPWRA
Flood adaptation strategies score3.36 *** (0.47)3.44 *** (0.37)3.23 *** (0.25)
Note: *** denotes significance level at 1%. Standard errors in parentheses. Source: Authors’ own computation.
Publisher’s Note: MDPI stays neutral with regard to jurisdictional claims in published maps and institutional affiliations.

