Article

Modeling the Assessment of Intersections with Traffic Lights and the Significance Level of the Number of Pedestrians in Microsimulation Models Based on the PTV Vissim Tool

Department of Transport and Logistic, Gdynia Maritime University, 81-225 Gdynia, Poland
*
Author to whom correspondence should be addressed.
Sustainability 2022, 14(14), 8945; https://doi.org/10.3390/su14148945
Submission received: 19 June 2022 / Revised: 15 July 2022 / Accepted: 18 July 2022 / Published: 21 July 2022

Abstract

:
The present article contains a microsimulation analysis of the impact of the number of pedestrians on pedestrian crossings controlled by traffic lights. To analyze the level of freedom of movement using the HCM 2010 method based on the level of service (LOS) implemented in the PTV VISSIM tool, a simulation of two interconnected intersections is performed. These crossings differ in the number of inlets as well as in the intensity of vehicles at each of the inlets. The microsimulation model was based on real data on the intensity of vehicles from an intelligent traffic control system as well as real traffic light programs. Eleven different variants of the same initial conditions were tested in which the number of pedestrians at pedestrian crossings was increased every 50 and the time of the right turn and the LOS of the right turn were compared. The result shows the impact of the number of pedestrians on the assessment of LOS traffic conditions at the entire intersection. The results consider the ranges in which the number of pedestrians has a significant impact and change the assessment of the entire intersection to the next worse level of freedom of movement. The article shows how it can be a mistake to overlook adding the exact number of pedestrians at traffic light intersections with PTV Viswalk in the microsimulation model.

1. Introduction

In today’s road traffic research, it is essential to prepare a traffic simulation before introducing changes to the traffic organization [1,2,3]. The appropriate modeling of the examined road network or intersection section can solve many ambiguities and show the most optimal solution to many transport problems. One possibility is to use microsimulation models to study the capacity of intersections with traffic lights. Intersections that are not equipped with any intelligent solutions to adapt the length of the green light to changing traffic conditions are referred to as fixed time [4]. Depending on the advancement of the signal controller, this intersection may support more than one fixed-time program during the day, and it depends on the time of day. For example, it can be a classic division into the morning, afternoon, and peak-to-peak signal programs. Many microsimulations analyze fail to consider the influence of pedestrians moving around the intersection. Assuming only that the pedestrian moves during the green signal intended for him/her; however, this approach does not always present a realistic picture of the situation at the intersection. Traffic light rules vary from country to country [5]. There are places where pedestrian traffic is so important that a completely non-collision phase of the green signal is distinguished for them. This solution is very advantageous from the point of view of pedestrian traffic safety [6]; however, it causes a considerable loss of time in the signal program [7]. The first reason is to distinguish a separate traffic phase and the second reason is to provide appropriate safety buffers before and after the green signal in the form of an intergreen time [8]. To optimize the loss of time with the connection of pedestrian safety in some countries, such as the Poland [9], it is permitted to set the pedestrian phase with a colliding group, but with allowed simultaneous traffic. An example is a filter arrow (conditional right-turn arrow in right-hand traffic) in a collision with the pedestrian crossing on the right and straight from the stop line for vehicles. Another permitted solution is the simultaneous phase of a general green signal and a phase for pedestrians to the right or left of the vehicle stop line. The impact of pedestrians on the traffic conditions at the intersection is significant and depends on the intensity of the inflow of pedestrians as well as the speed of their movement or, in general, the number of pedestrians using the pedestrian crossing [6]. In the above-described situations, pedestrians crossing the road prevent the maximum possible number of vehicles from passing the green light.
The present article aims to examine the significance of the model of the number of pedestrians at crossings with traffic lights in a microsimulation modeling on the example of the PTV Vissim [10,11,12] tool together with PTV Viswalk [13,14] in the analysis of the capacity of intersections.

2. Materials and Methods

The model was developed with the use of real traffic data obtained either from the road traffic monitoring system or observations. Depending on the measurement area, road traffic was measured manually or automatically using sensors located at the intersection inlets—induction loops [15]. Measurement induction loops are a component of the TRISTAR intelligent traffic control system (see [16]). The model was made and then calibrated using PTV Vissim software, which is a typical method to model road traffic on a micro-scale, and it uses the Wiedemann model, [17] with the leader’s driving model.
For example, the tool has been used in studies on the operational efficiency of two types of improved Displaced Left-Turn (DLT) Intersections [18,19]. Additionally, it has proven to be a useful tool to obtain the most favorable solution to the problem in the case of the dependence of the infrastructure of one intersection on the next (see [20]). However, there is a need to calibrate model elements, such as maximum and desired acceleration functions in the PTV Vissim for trucks, [10,21,22,23], as pointed out in [24], since it remains a significant factor in this study area [25,26]. The figure below (Figure 1) shows the base model building framework in PTV Vissim as a case study.
The following data are required to create a model in PTV Vissim [11,12,22,27]—the geometry of the network–data on the geometry of intersections and interstitial sections is easiest to enter into the PTV Vissim tool based on a previously loaded situational plan or with the use of a map connected to the program (Bing). The map base can be any graphic or vector file (in *dwg or *dxf format).
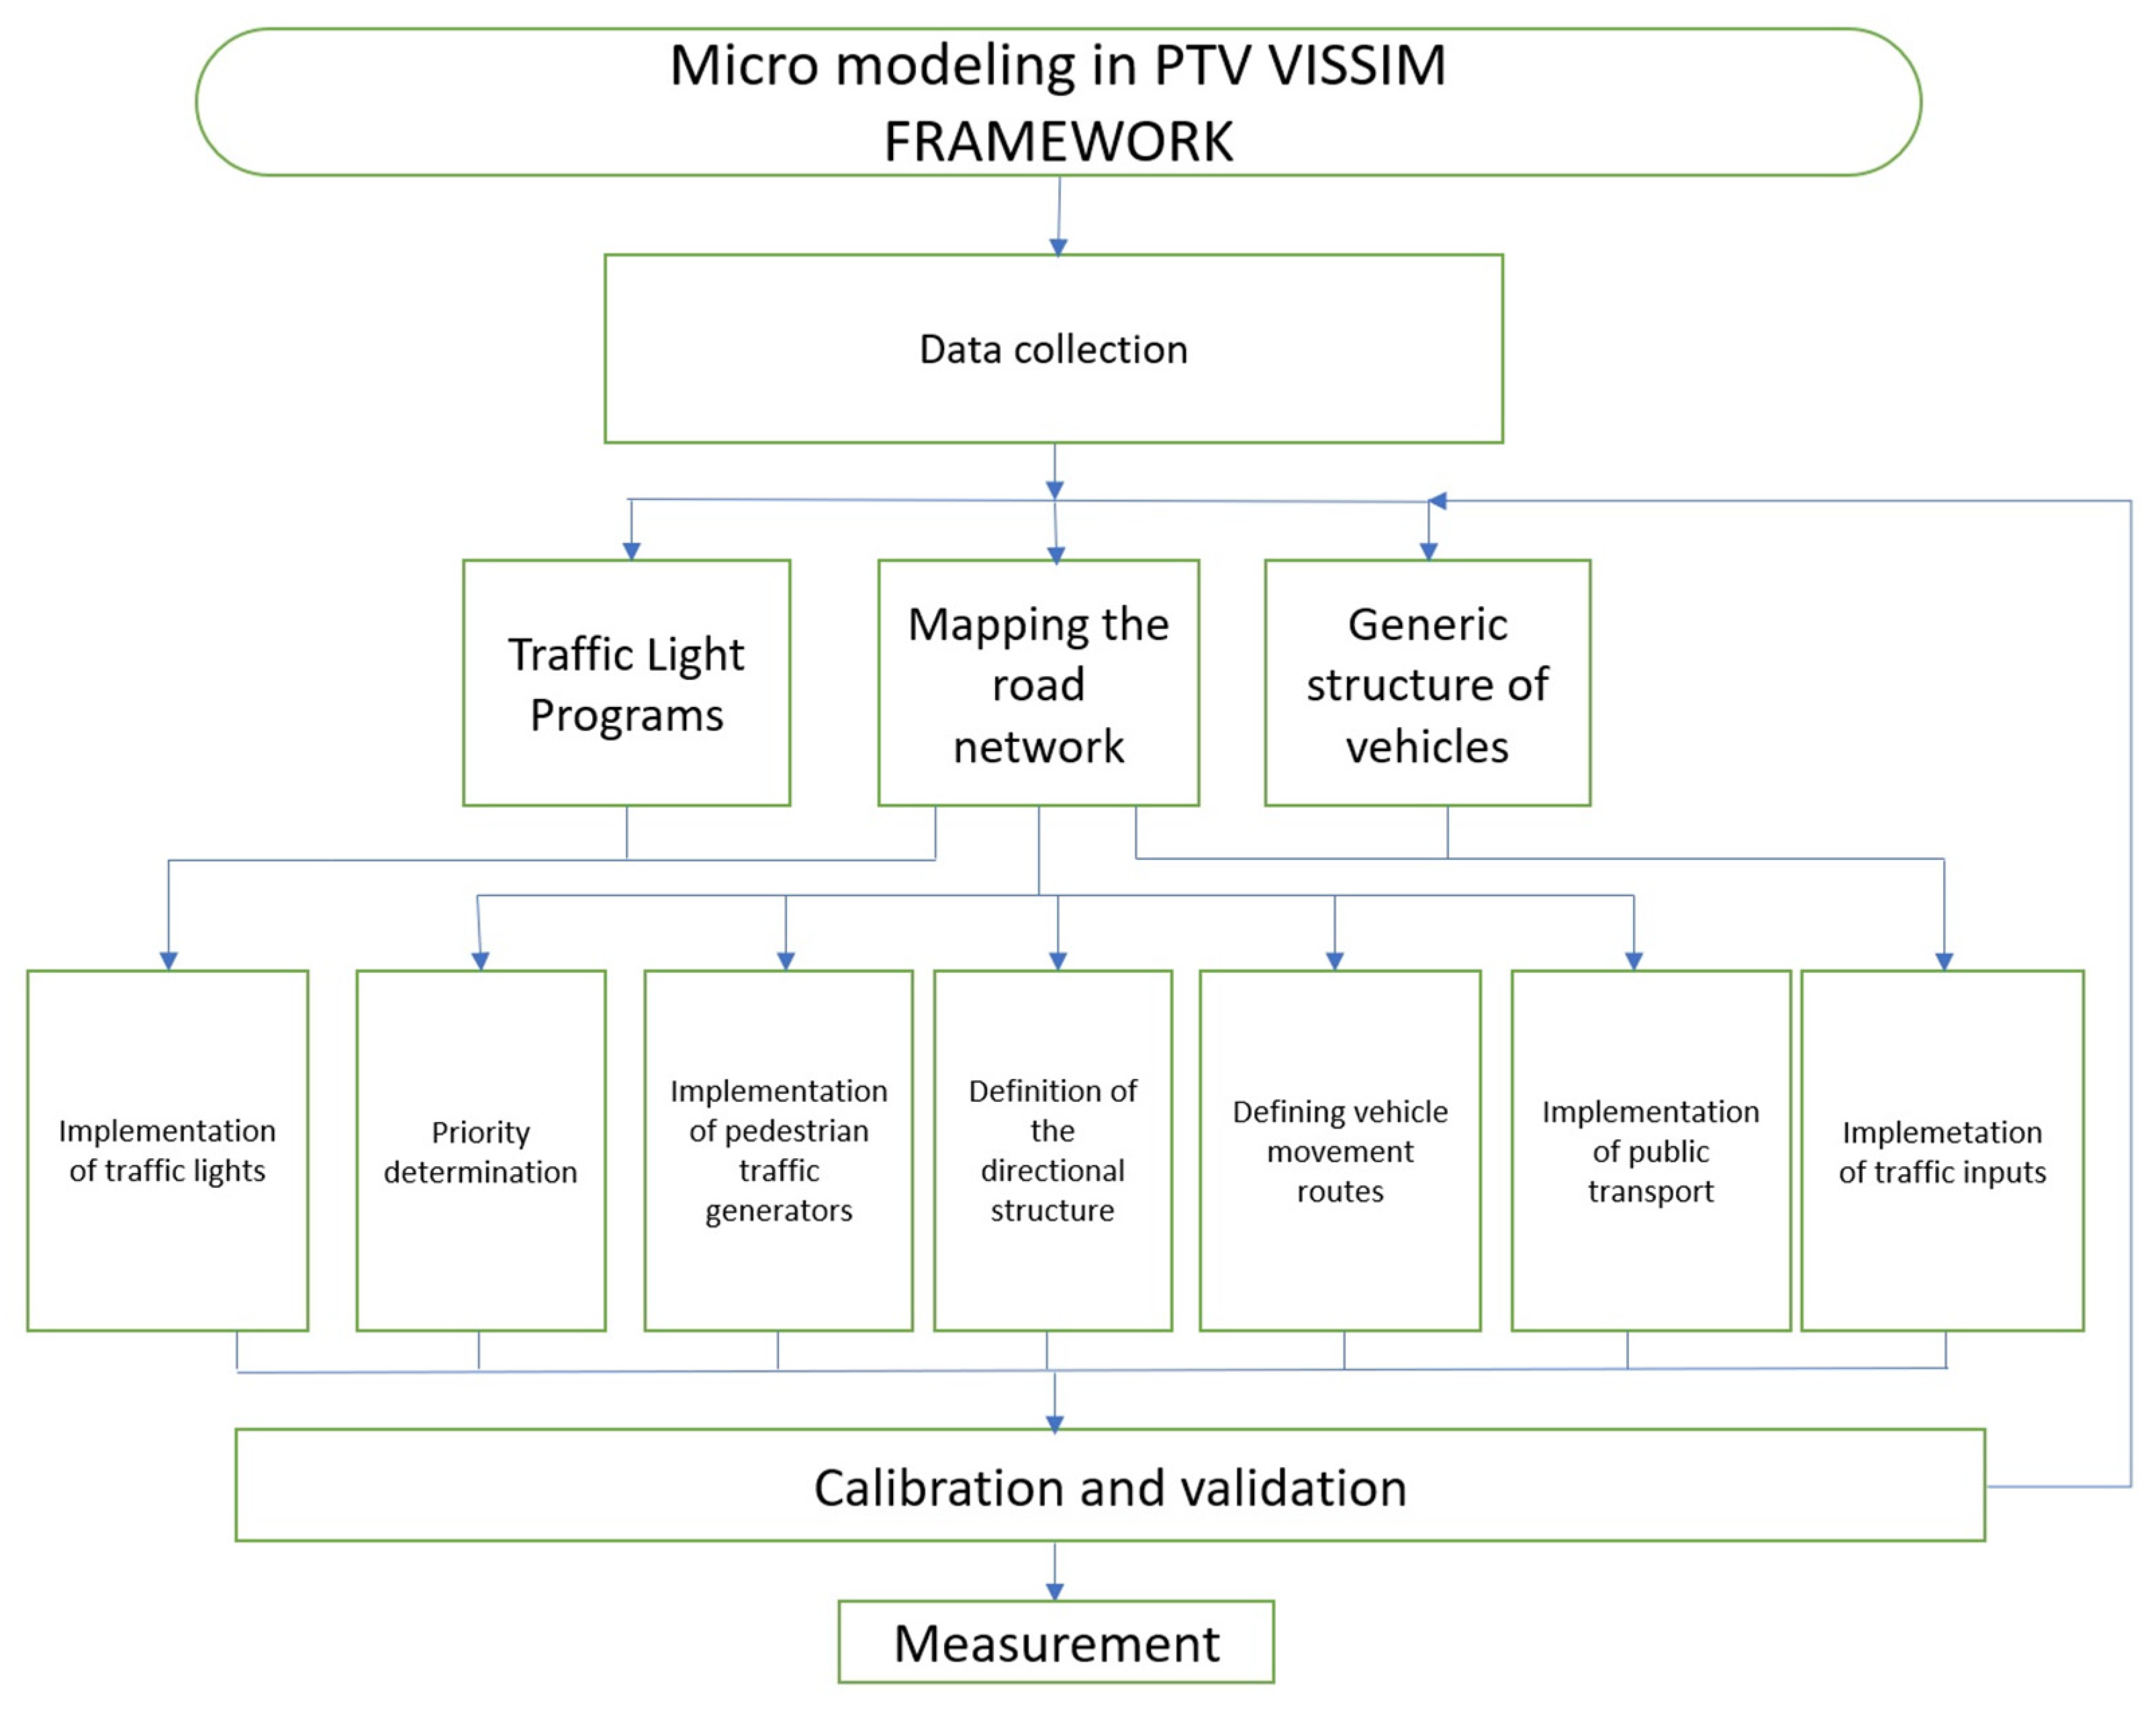
  • Road sections in the tool are built with straight lines and curves, thanks to which the user has full freedom in shaping the geometry of the road network. When drawing successive sections and connectors, the number and width of the lanes should be known, the distance of the stop line from the edge of the transverse road, the length of the separated lanes for turning, and the width of the dividing lines, and the radii of horizontal curves;
  • Vehicle traffic intensity—in the PTV Vissim program, the values are aggregated to the total loads of vehicles at intersections or the edges of the network. Then, the generic structure of vehicles moving on the network should be defined. This structure is expressed as a percentage share of individual types of vehicles. Traffic intensity may vary depending on the adopted hourly time intervals;
  • Routes: it is necessary to define the directional structure of vehicles in a place where the driver has more than one possibility to decide the route—they are intersection inlets. The definition of the route consists of defining the decision points and possible to choose from in these points of the routes, as well as giving directions a percentage share in the stream. This requires the conversion of the proportions of the share of individual relations from a given inlet. The use of routes is only valid when the static route option is used, not the dynamic assignment;
  • Conflict areas [28]—when building a model, you should also remember to produce priority rules or define the collision field spoke [29];
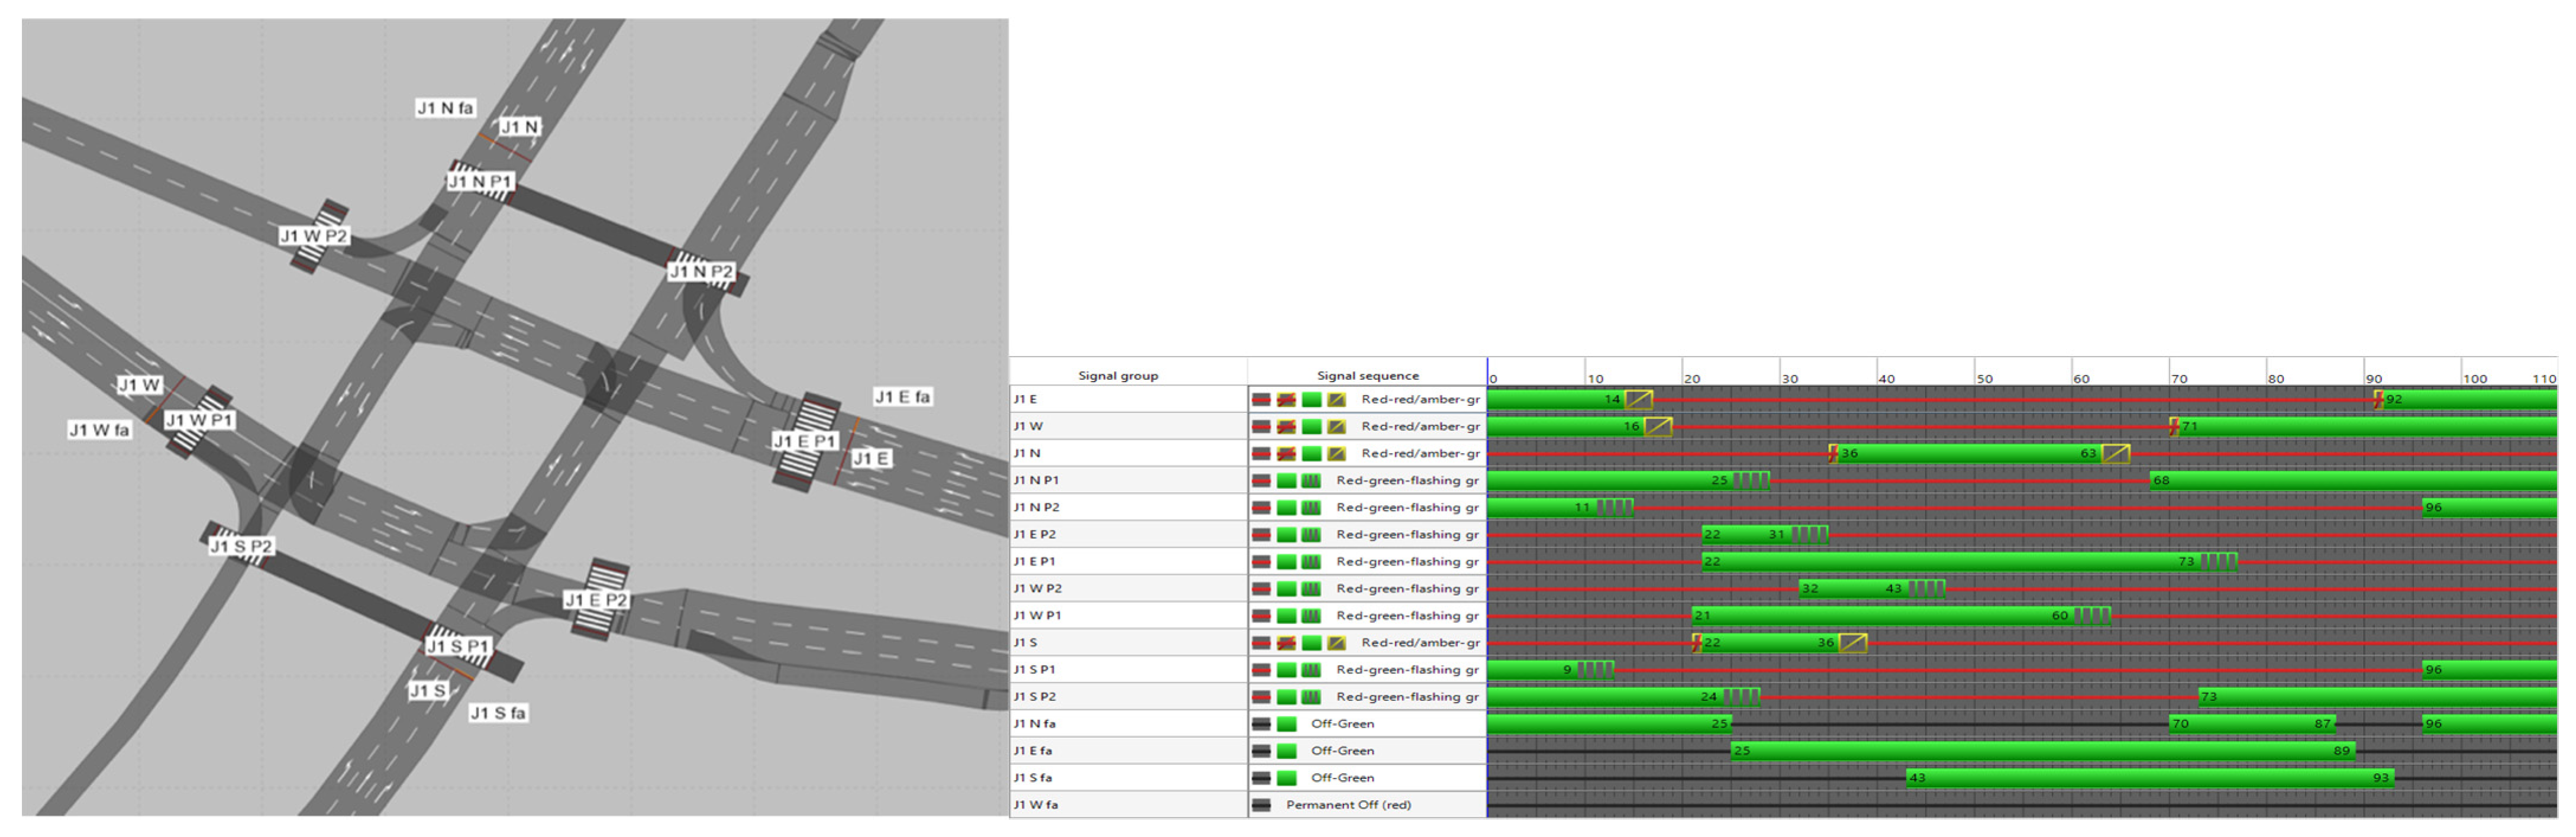
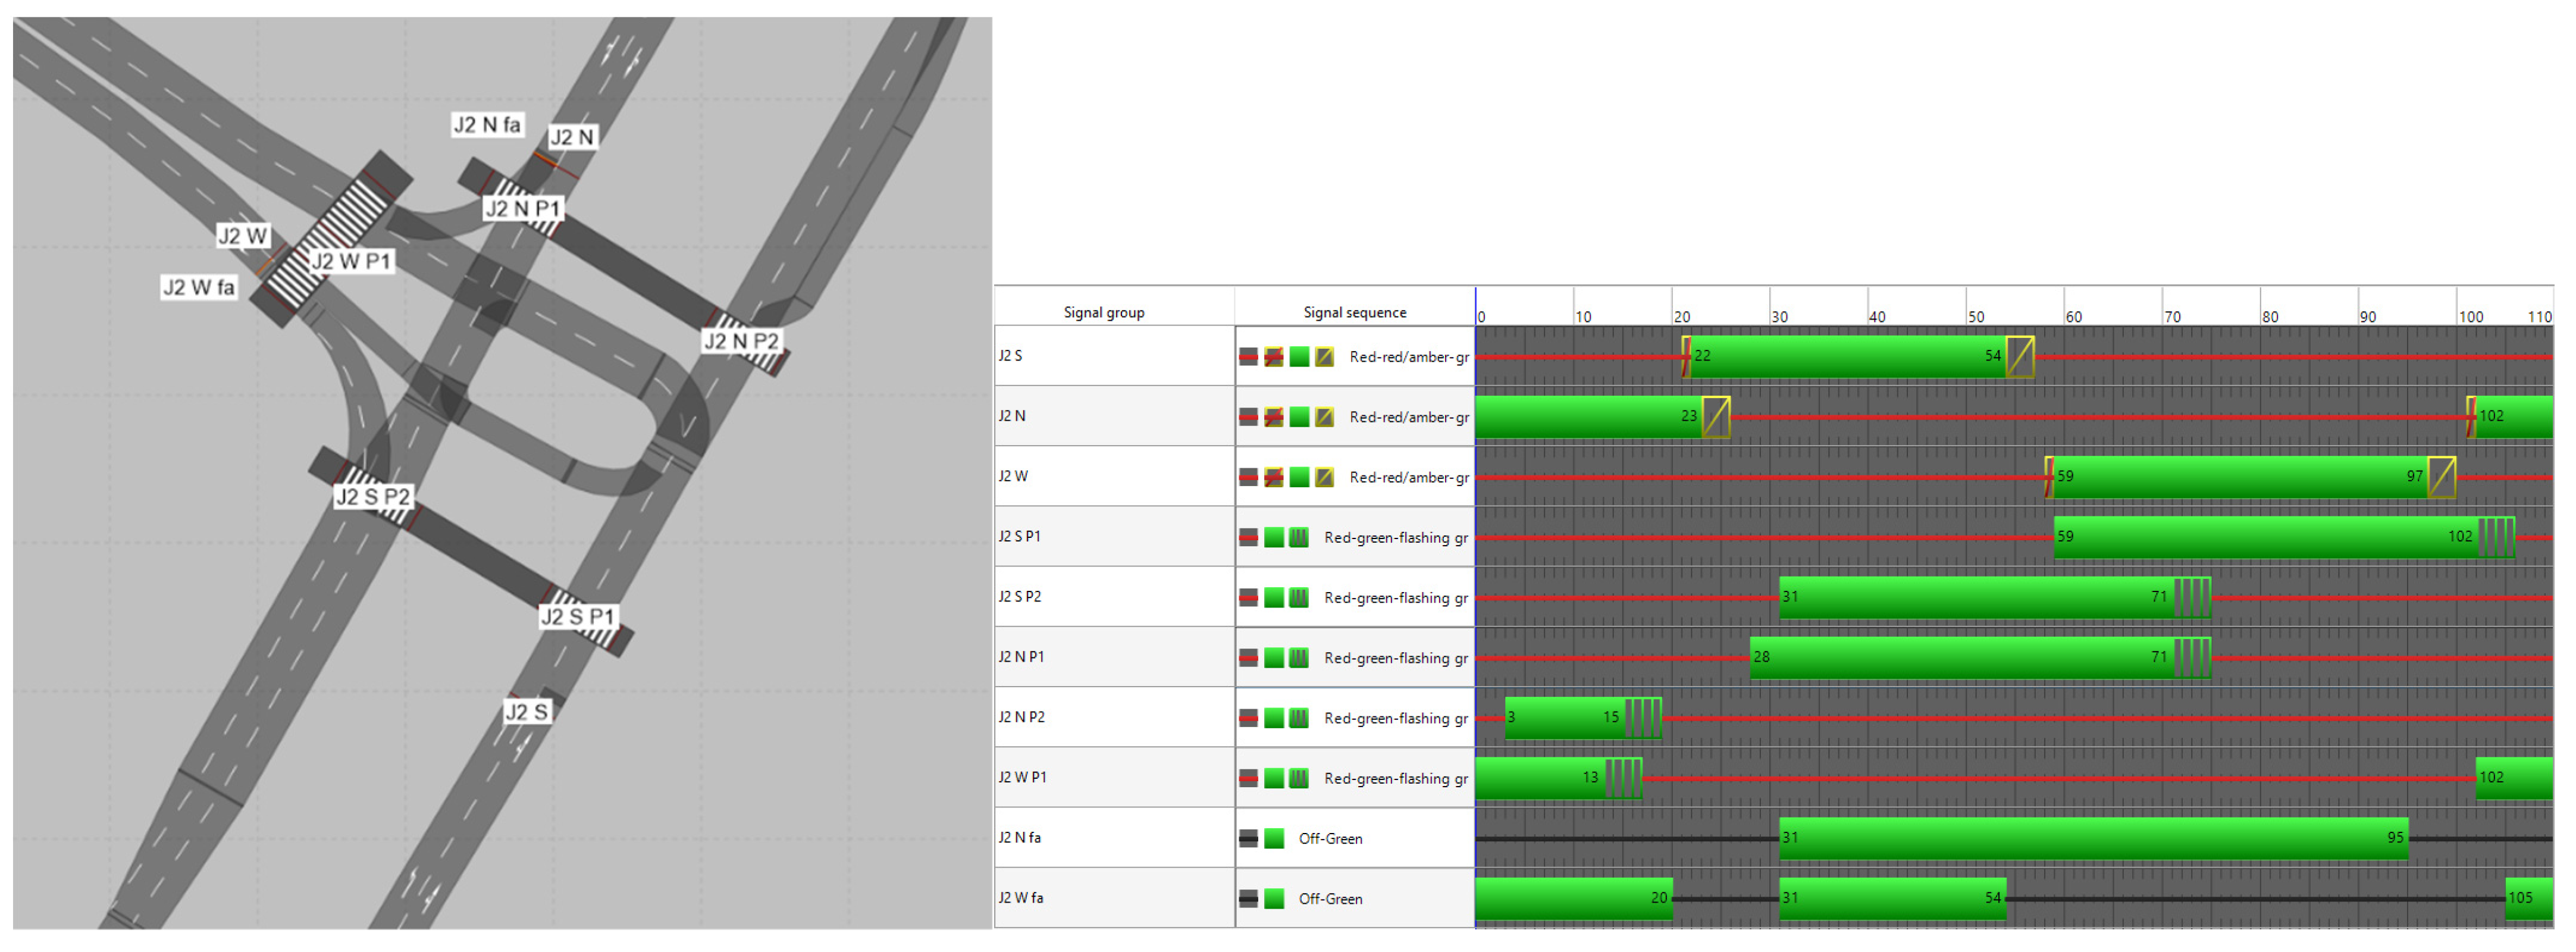
  • Priority rules have the same task as conflict areas. However, they present more freedom in modeling the time and distance between conflicting relationships. In the model, the application of priority rules occurs at the central island intersection. Signal programs are introduced based on programming built into the controller software. To make the model, we need real data, such as the assignment of signal groups to the streams and the traffic light program, and wintergreen time matrices. The model uses the existing fixed-time signal programs distinguishing between the time of day and the occurrence of the morning peak, afternoon peak, or peak-to-peak;
  • Public transport—timetables of buses and trolleybuses running on the modeled section of the network were introduced in the model. Additionally, the Edge and Waiting Area platforms for travelers were also added at each stop. The departure times of the buses from the stop are close to the real one;
  • Pedestrians—since the conditional right-turn signal is used in the traffic lights at intersections made in the model, it is necessary to add pedestrians at the crossings. If pedestrians do not appear in the model, the results of the crossing capacity would be too good. A conditional right turn would not be disturbed in any case. Pedestrian traffic and the necessary infrastructure to move—pavements—in the form of areas, were added to the entire modeled section of the network, reflecting the existing state. Part of the pedestrian simulation is obtained by the PTV Viswalk tool [30,31].
All PTV Vissim microsimulation models must be calibrated at the end (see for example [32]). A model made in this way was calibrated using the GEH statistic. The GEH statistic is an empirical formula that allows for a greater deviation from the measurement for low values and less for high values. The name is not an acronym but comes from the first letters of the method author’s first name and surname. The GEH statistic is the relation between the vehicle intensities that are checked to those obtained from the model. After the calibration, the model obtained a result lower than 5 for the indicator.
G E H = 2 ( M i C i ) 2 M i + C i [ ]
where:
  • M—is the hourly traffic volume from the traffic model (vehicles/hour);
  • C—is the real-world hourly traffic count (vehicles/hour).
In the modeled example, an important role was played by the analysis of the capacity of the intersection using the Highway Capacity Manual 2010 (HCM 2010) method [33,34,35,36]. This method is based on the initial saturation intensity of 1900 contractual vehicles per hour of green light as a representation of the ideal lane, which has the adopted width of 3.6 m, without interferences, such as turning left vehicles, stopping vehicles, and pedestrians or parking vehicles. The output value is then corrected by factors corresponding to the following factors: lane width, the share of truck traffic, road gradient, parking vehicles, buses at stops, location, lane use in the lane group, left-turning vehicles, right-turning vehicles, pedestrians, and cyclists. Traffic conditions are defined on the scale of capacity utilization and time losses by designating the level of freedom of movement from A to F, where A is the best value [36,37].
In the PTV VISSIM tool, it is possible to use node evaluation; you can record data from nodes of microscopic and mesoscopic simulations in the Vissim network. Node evaluation is especially used to determine specific data from intersections without first having to define all sections manually to determine the data. One such assessment is the level of service (LOS). “Level of service (transport quality): The levels of transport quality A to F for movements and edges, a density value (vehicle units/mile/lane). It is based on the result attribute vehicle delay (average). The current value range of vehicle delay depends on the level of service scheme type of the signalized or non-signalized nodes. The LOS in Vissim is comparable to the LOS defined in the American Highway Capacity Manual of 2010” [38]. According to the official source [38], levels of service are divided into 6 levels. The first, “A”, is equivalent to the most efficient vehicle flow and corresponds to a journey delay of fewer than 10 s or no delay for traffic lights. The second level, “B”, is the delay time from 10 to 20 s. The third level, “C”, is the delay time from 20 to 35 s. The fourth level, “D”, is the delay time from 35 to 55 s. The fifth level, “E”, is the delay time from 55 to 80 s. The sixth level, “F”, is the delay time longer than 80 s. To perform the analysis, as a case study of the impact of pedestrians on the signalized junctions in the city network, a model was implemented that reflected the existing state on the example of the part of the network in Gdynia, Poland. The modeled area is mainly characterized by the traffic of cars and HGVs (heavy goods vehicles); public transport vehicles, such as buses; and pedestrians. Bike users were omitted in case we could not obtain enough data about them. An example of a transport network based close to the port area is the city of Gdynia [15,39,40]. Road sections included in the model were a highway (Estakada Kwiatkowskiego) with two junctions (J1 and J2). The map below shows the scope of the modeled section of the municipal transport network of Gdynia city.
The analyzed crossings in the microsimulation are described and illustrated below:
  • J1—four inlets, controlled junction with filter traffic lights (see Figure 2);
  • J2—T junction, controlled junction with filter traffic lights (see Figure 3).
The intersections were selected due to the differences in size, the number of inlets, and road traffic. However, both had the common feature of allowing the simultaneous admission of pedestrians and vehicles in the configuration described above as interfering with simultaneous traffic. In the modeled road network, the most important data at intersections subject to microsimulation analysis were:
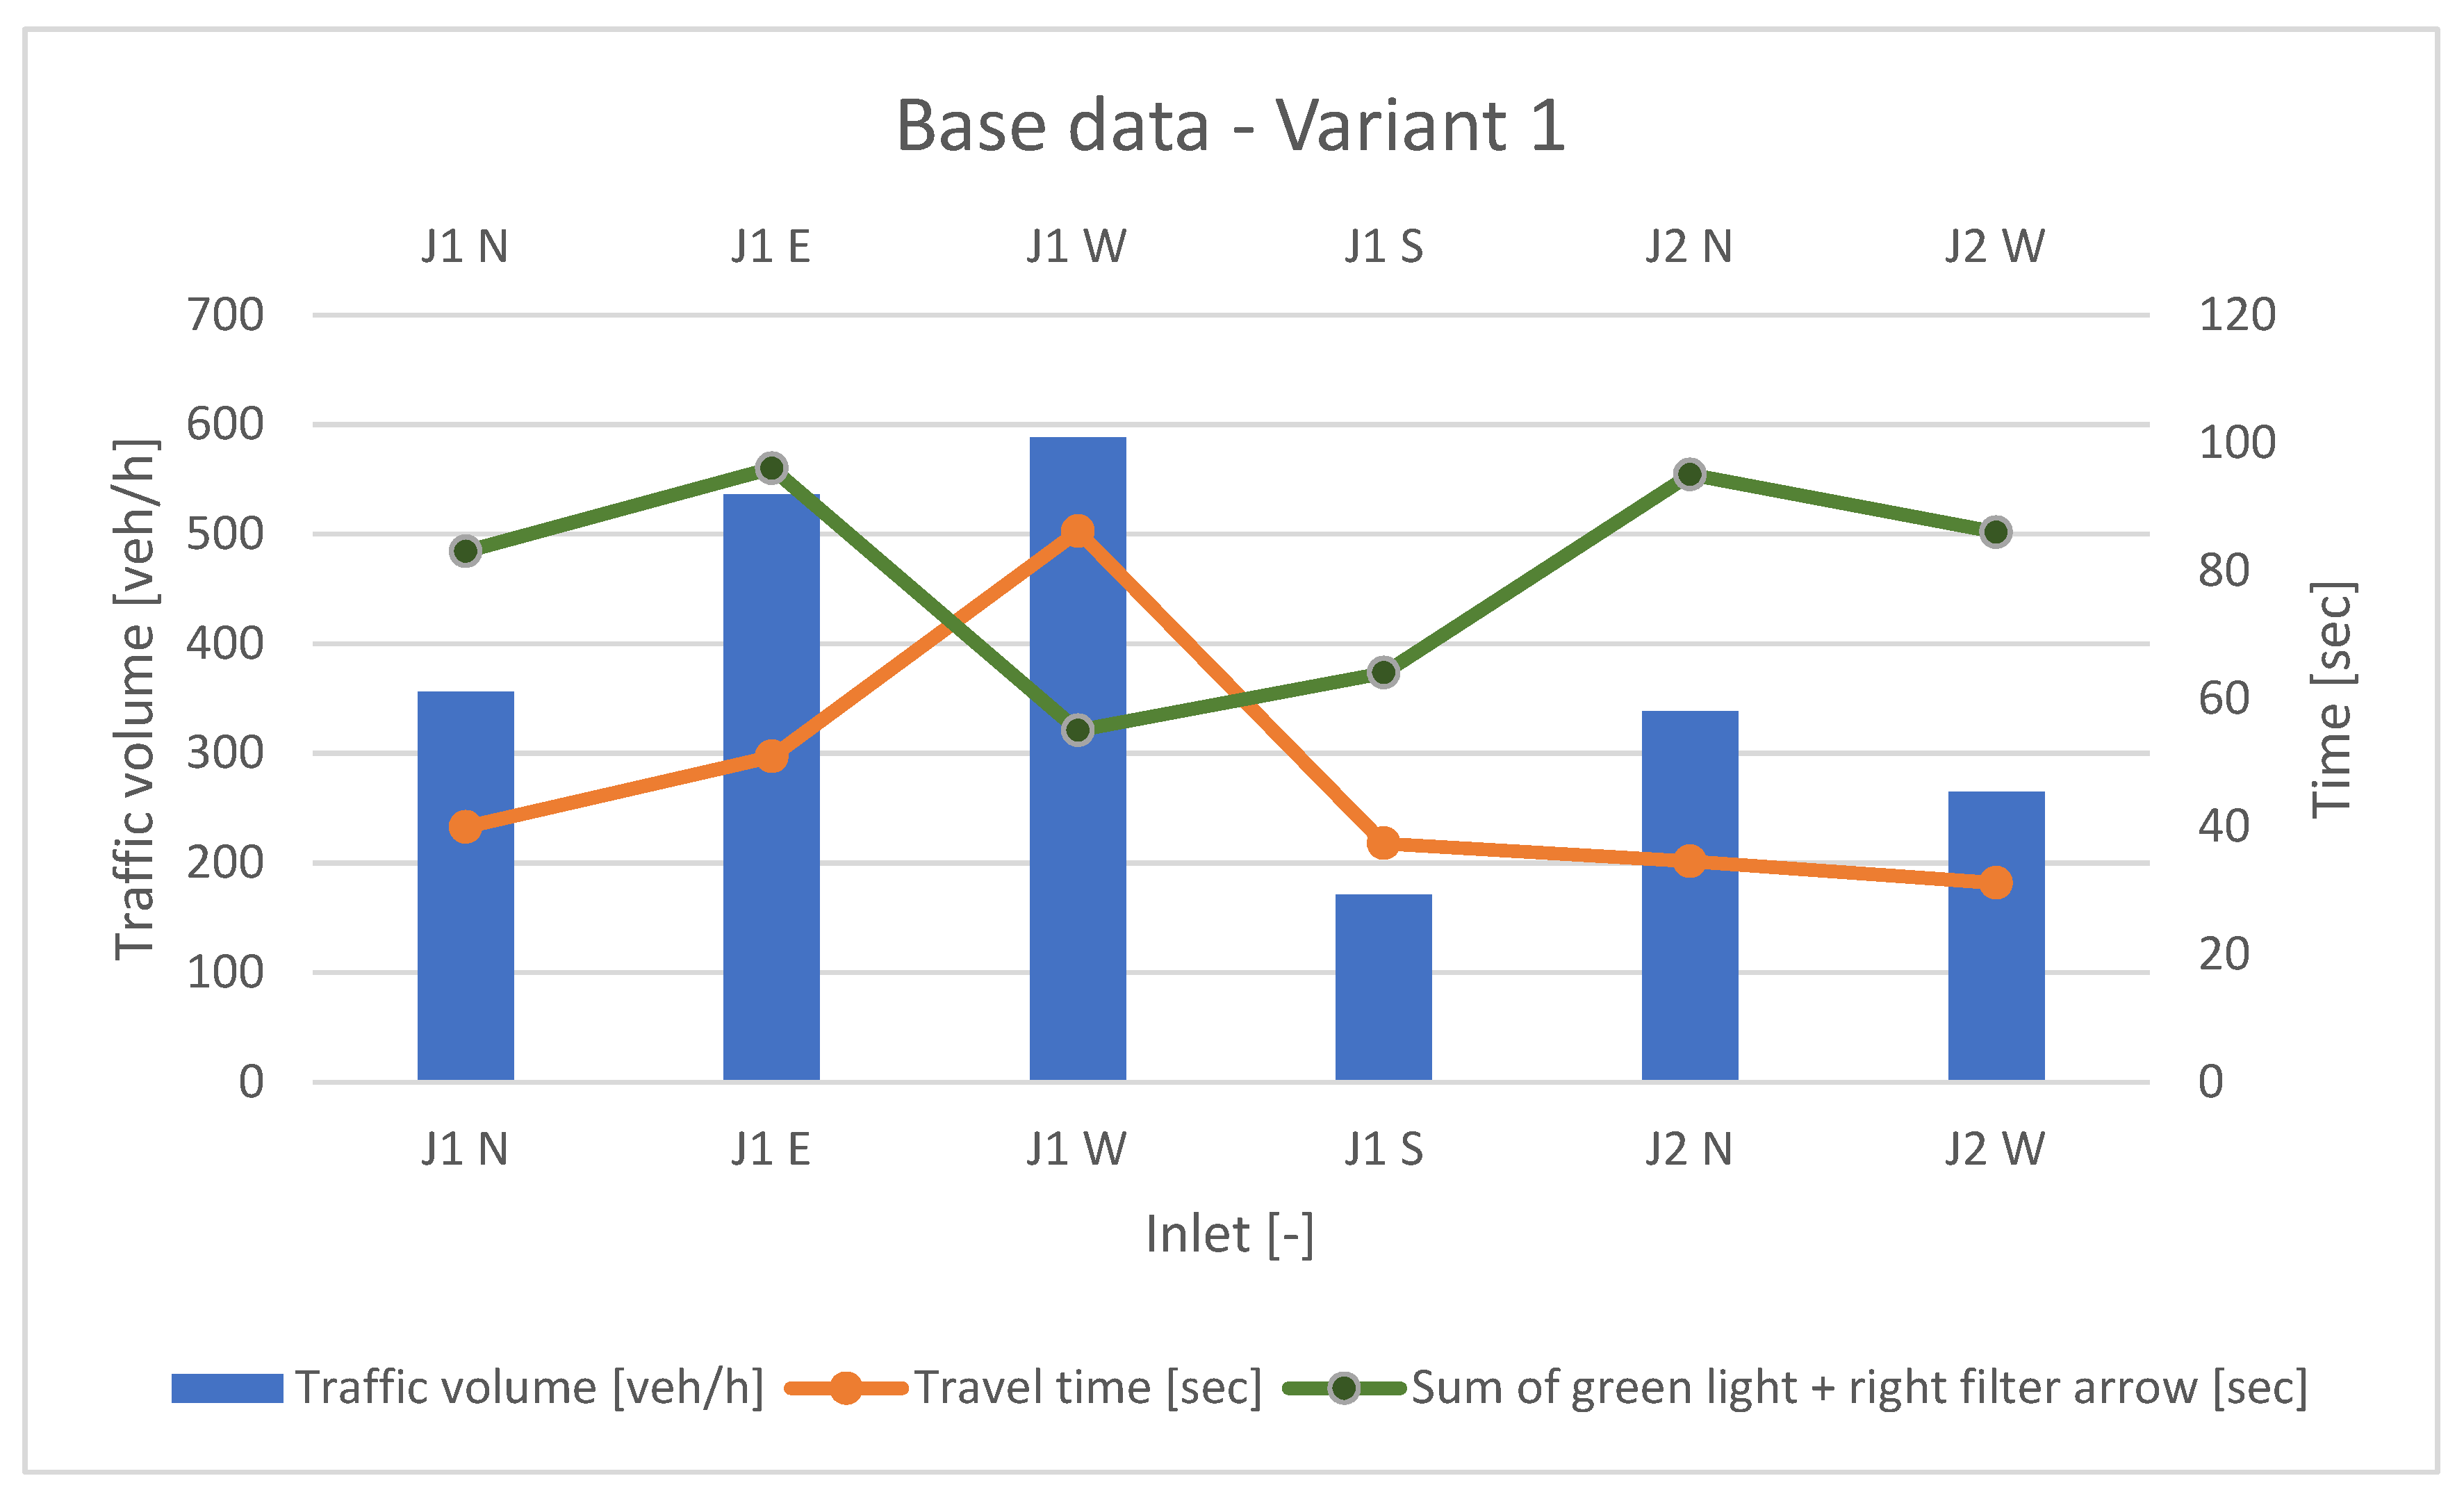
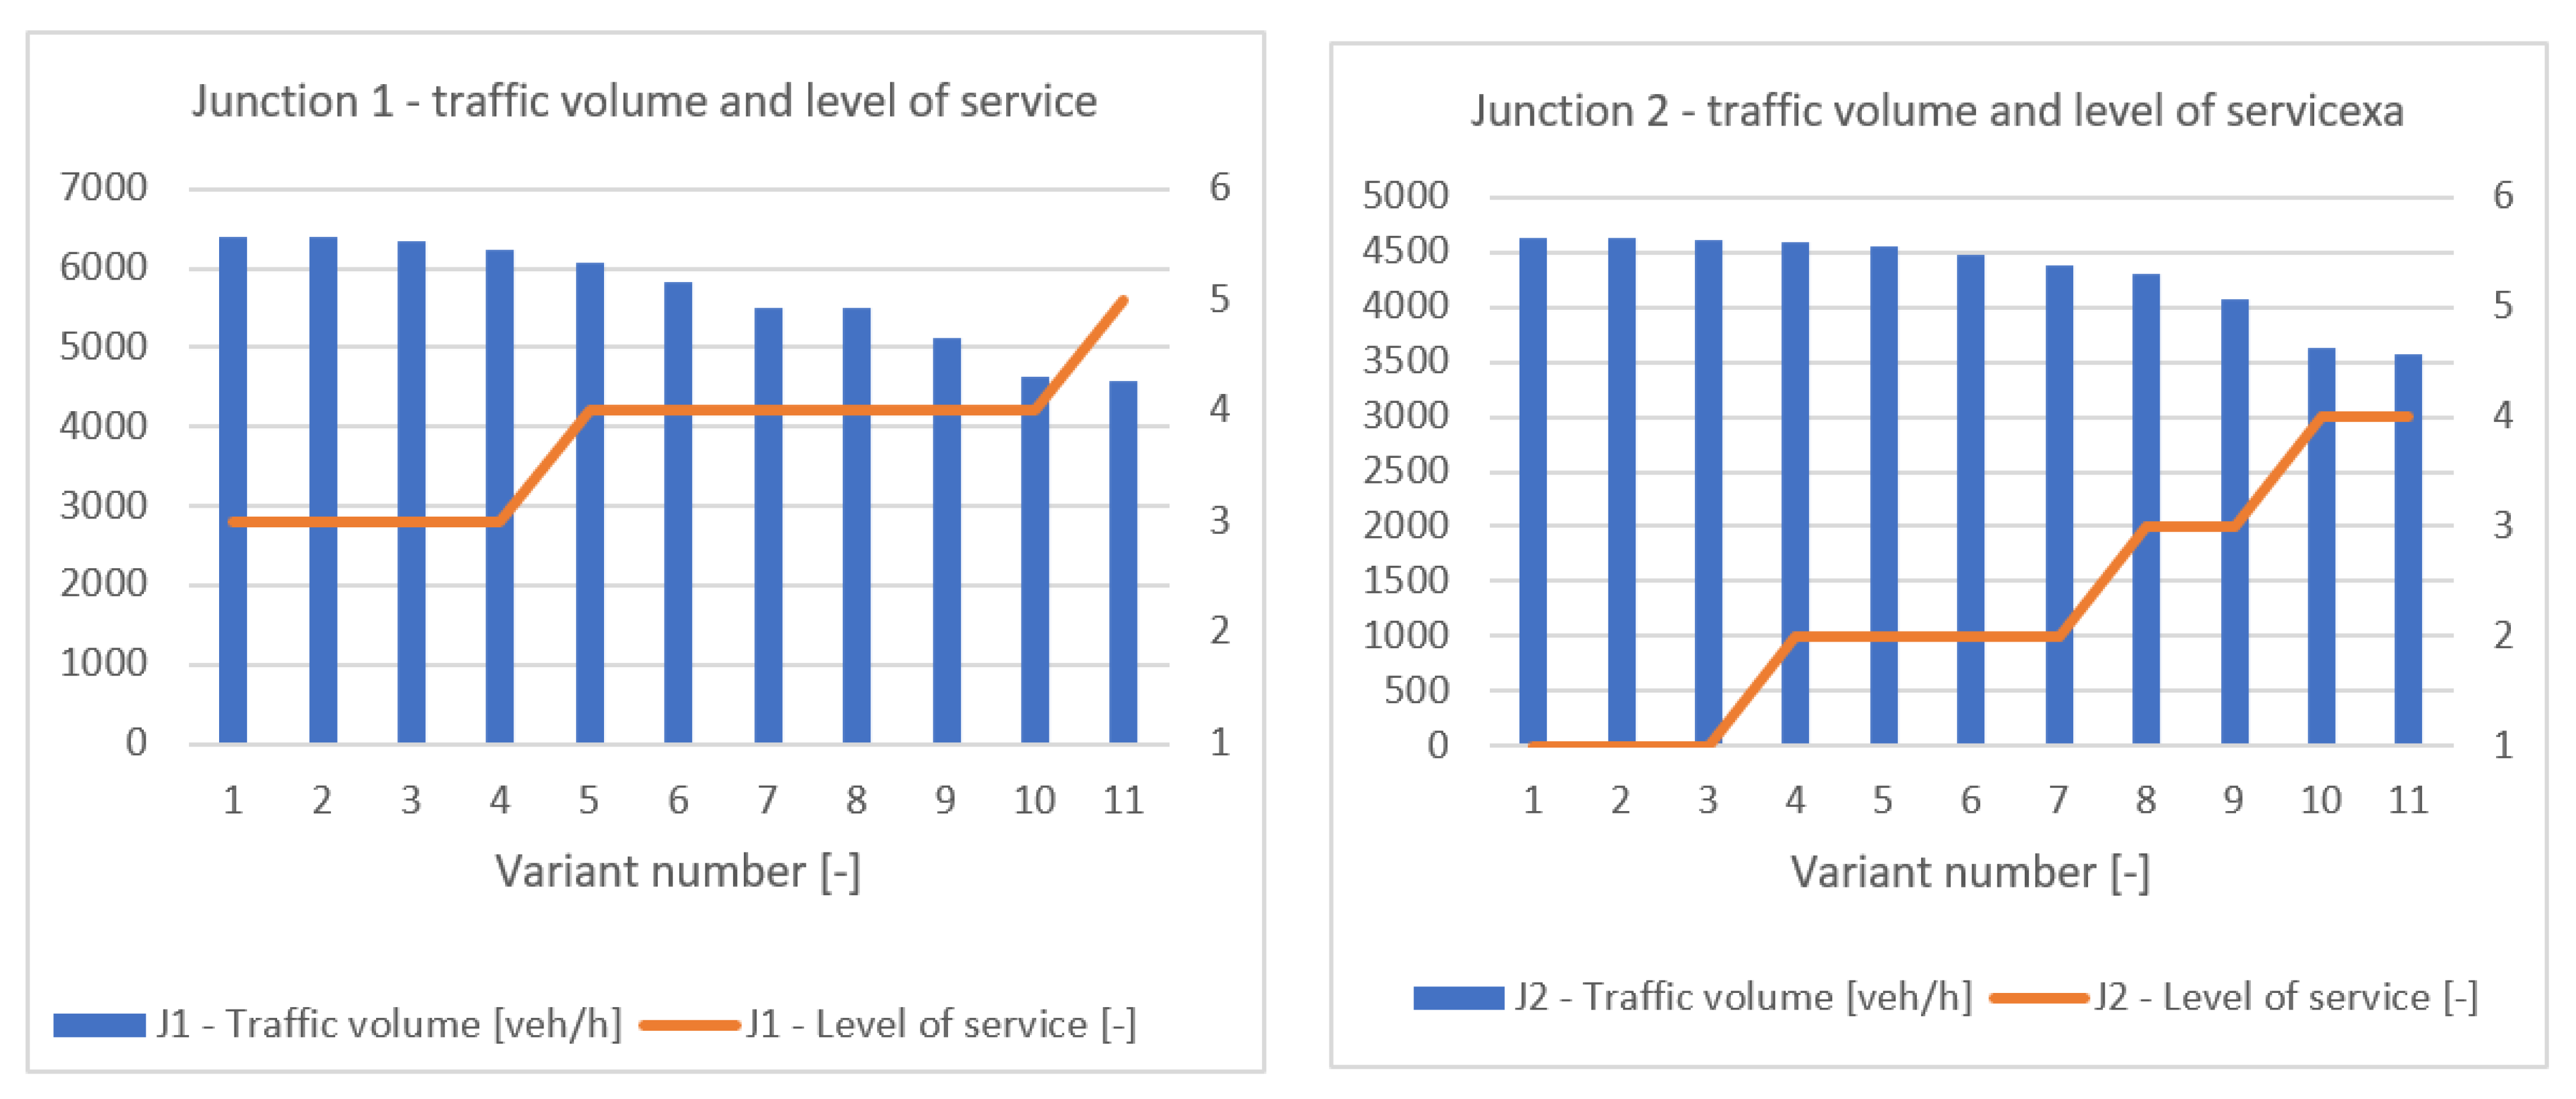
  • The intensity of vehicles at the entrance to the intersection (vehicles per hour)—these data may differ depending on the modeled variant—not all vehicles are able to pass in the hourly measuring distance;
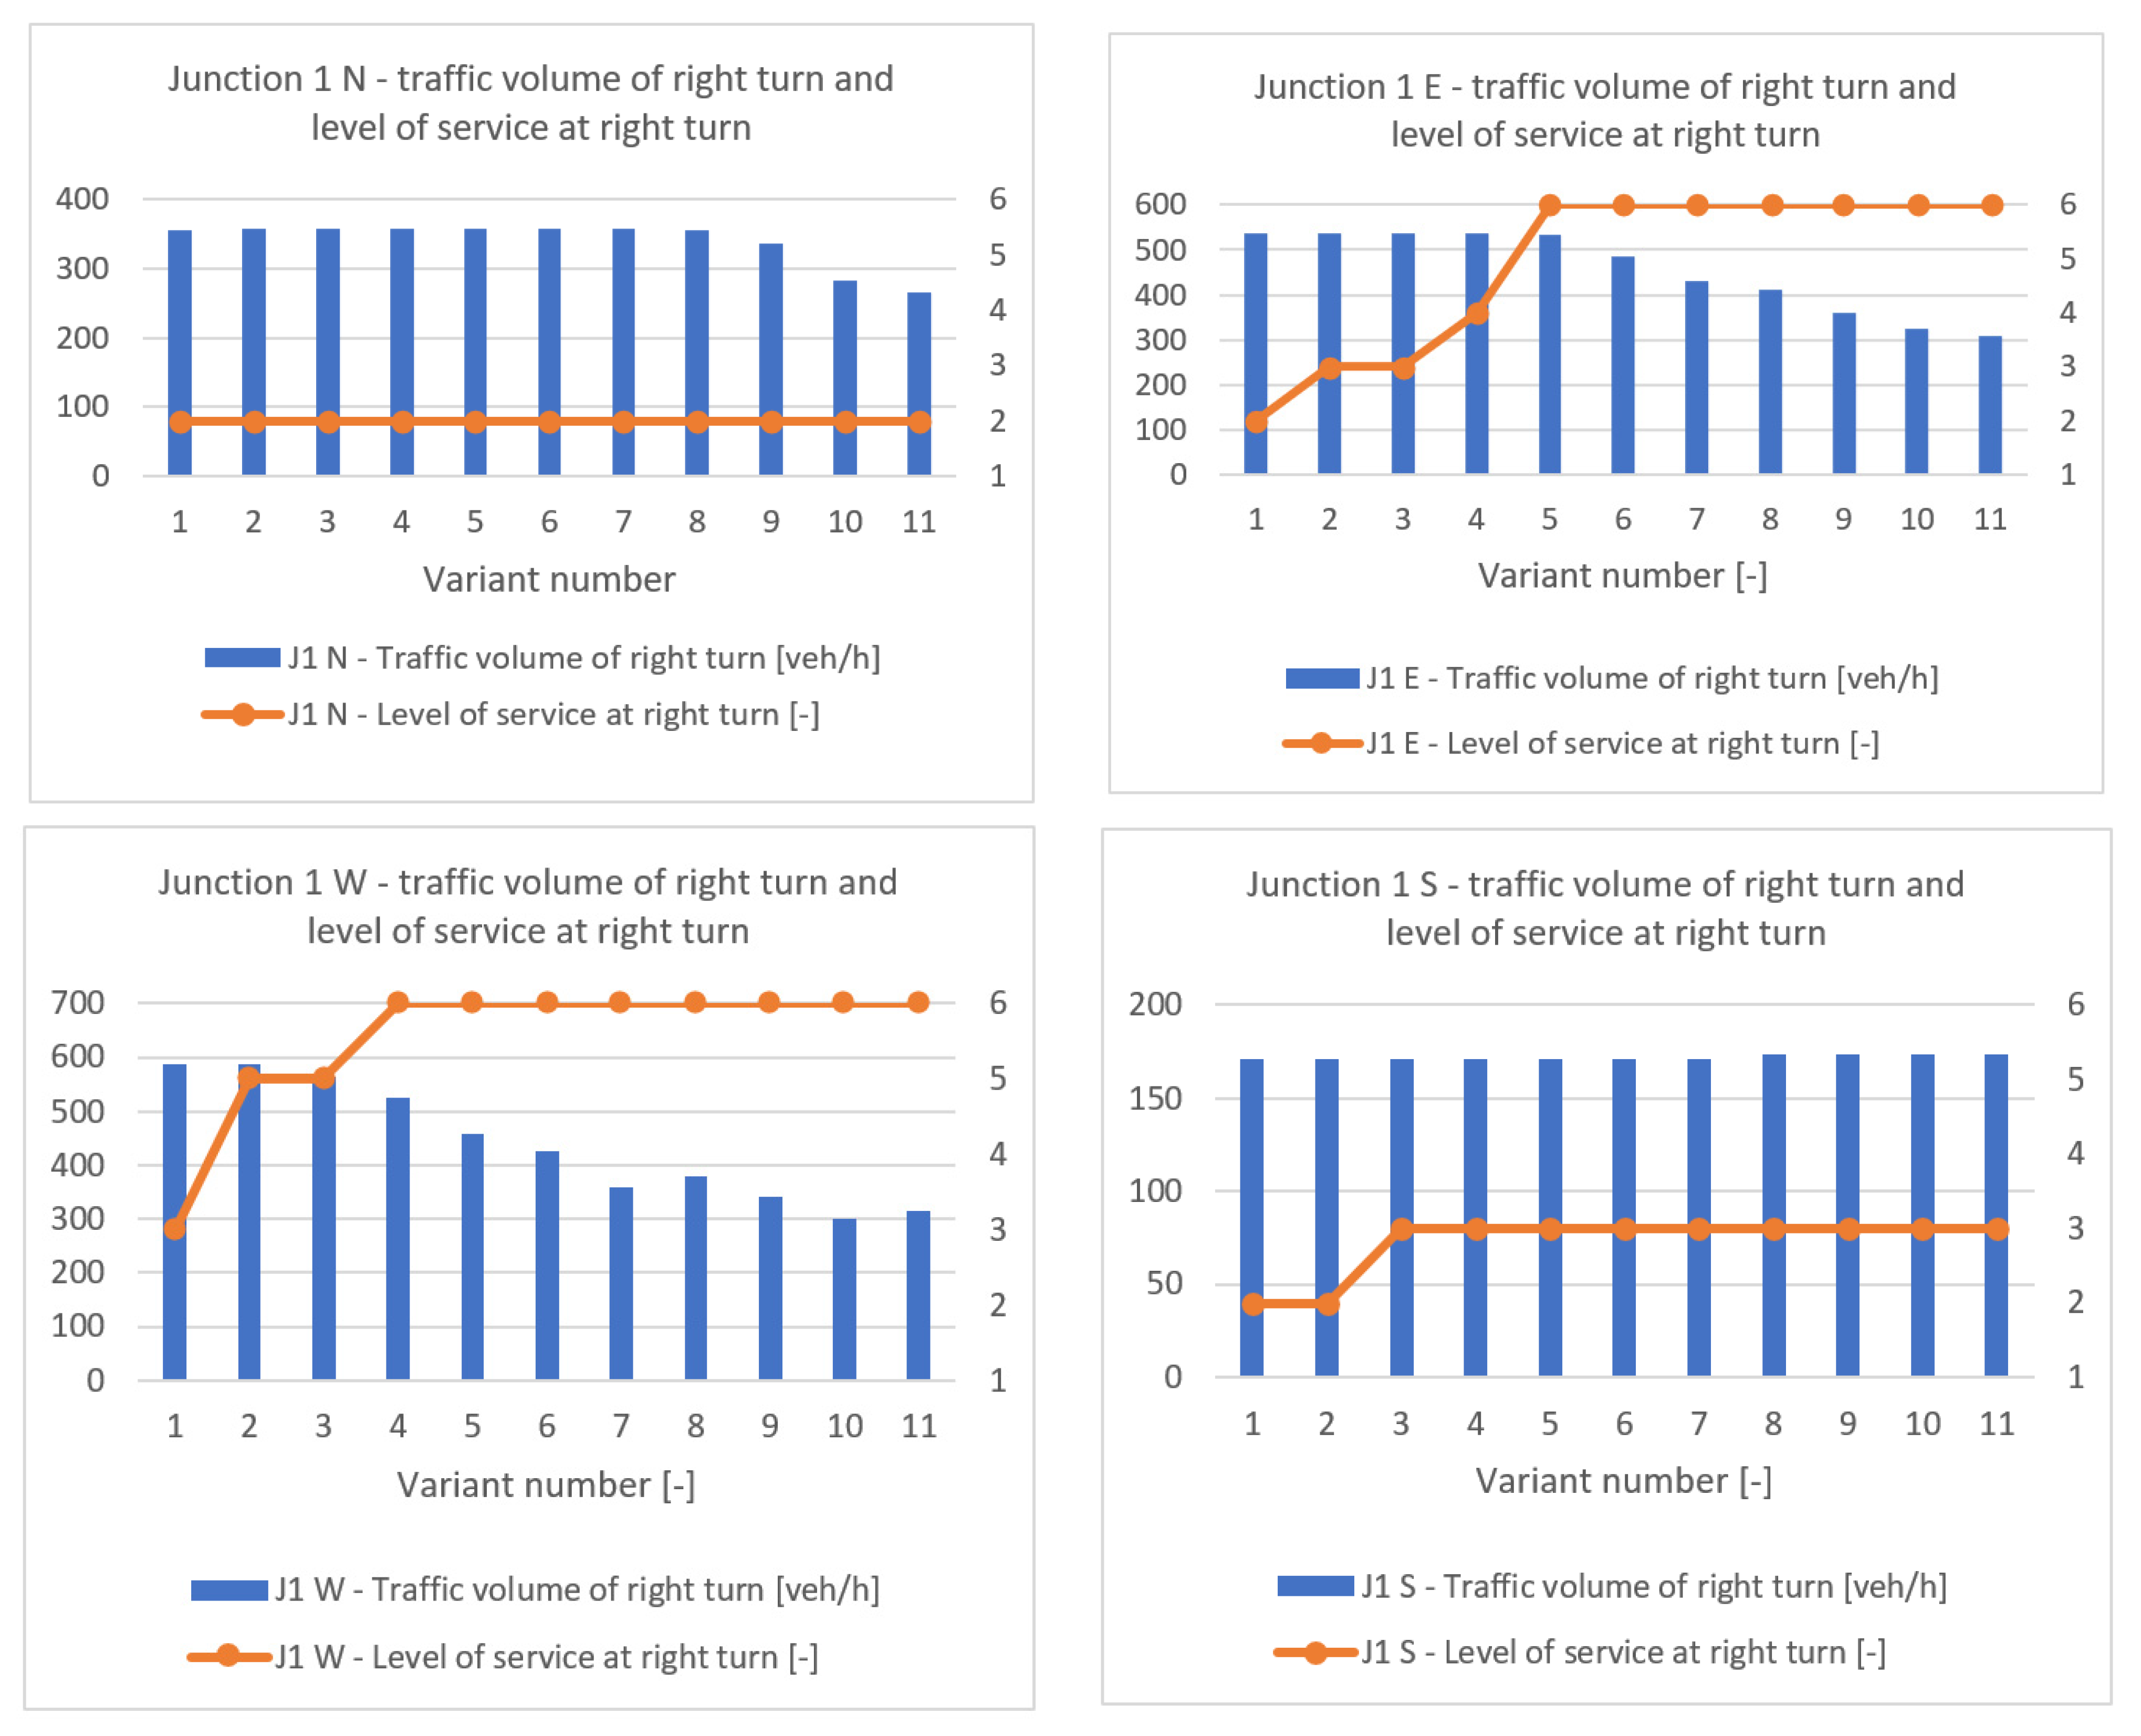
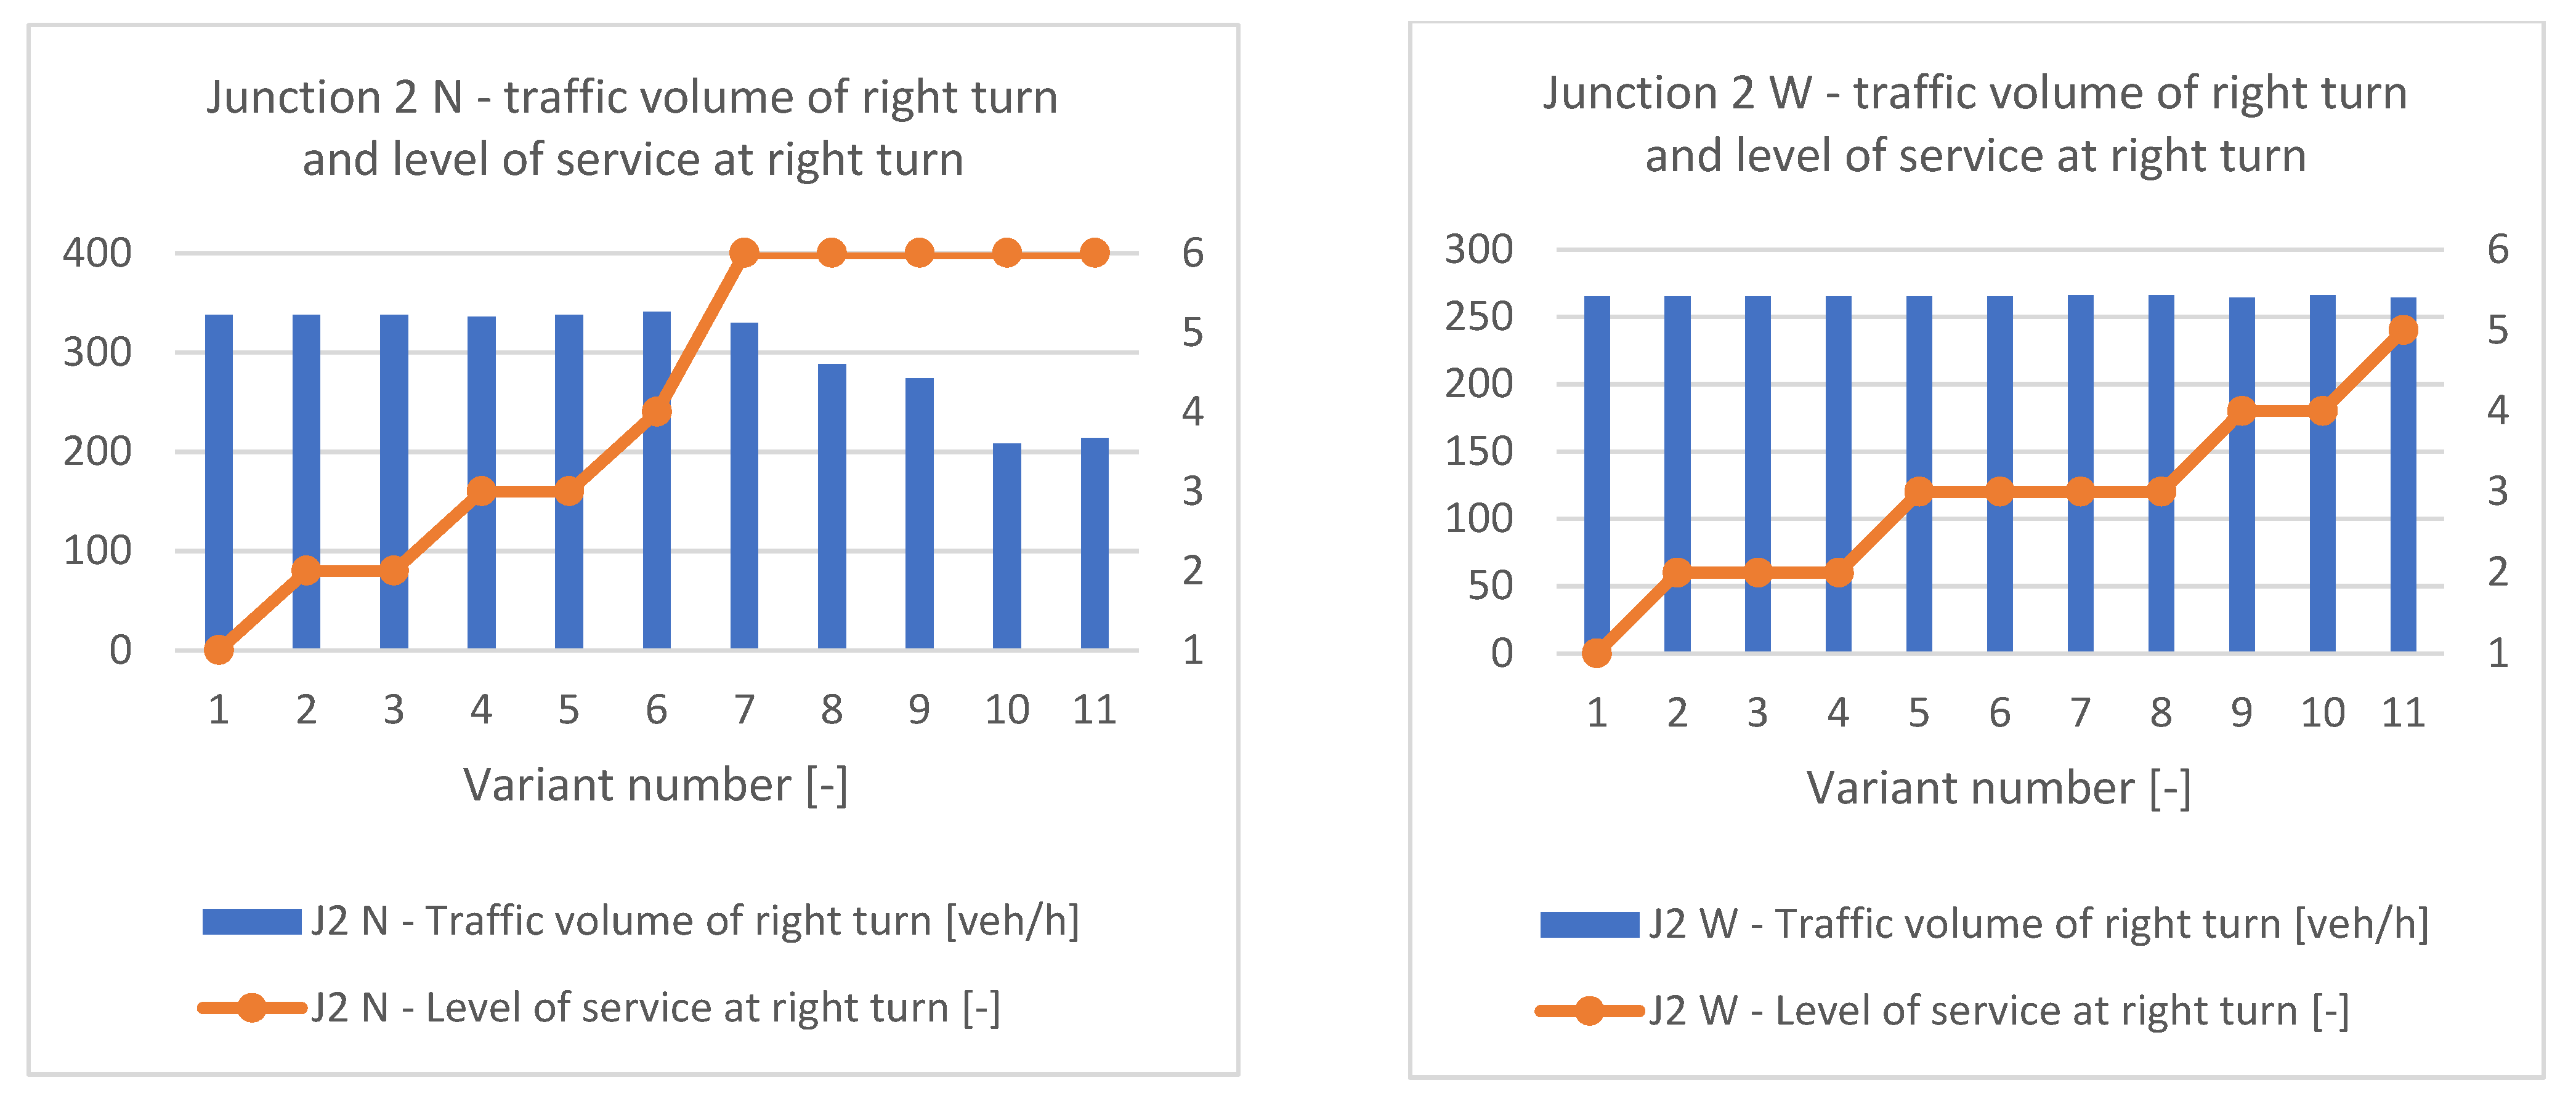
  • The intensity of right-turning vehicles at the inlet (vehicles per hour)—these data may differ depending on the modeled variant—not all vehicles are able to pass in the hourly measuring distance;
  • Duration of the entire cycle (seconds);
  • Duration of green light for a particular phase (seconds);
  • Duration of green light for right filter arrow(seconds);
  • Duration of green light for pedestrians (seconds).
The comparison of the data to the model has been presented collectively in Table 1 along with the division into inlets at each of the examined intersections.
For statistical reference, the graph below (Figure 4) shows that vehicle traffic is not burdened by pedestrian traffic at intersections (variant 1). The graph shows the driving time needed to turn right compared to the total length of green light appearing in one cycle, which is 110 s for both intersections, and to the number of vehicles turning right in an hour.
The variable in the model is the intensity of pedestrians crossing the crossing in the range from 0 to 500 pedestrians per hour in a step ratio of 50 pedestrians per hour. In total, 11 variants of the same simulation were performed, from V1 (where the number of pedestrians was 0 per hour) to V11 (where the number of pedestrians was 500 per h). The modeled network is the morning rush (7:00–9:00 a.m.) in the following sequence: 30 min of filling the network with vehicles, then 60 min of the proper measurement period, and another 30 min to silence the network. The tested intensity of both pedestrians and vehicles is related to the parameters of the resulting LOS.

3. Results

After 11 simulations were performed, in which the pedestrian traffic intensity was increased by another 50 pedestrians per hour, starting from the value of 0 pedestrians per hour, the intensity analysis was performed at each intersection entry. At the inlet, the number of right-turning vehicles was distinguished and compared to each variant. Due to the increasing number of pedestrians at the crossing, not all vehicles were able to cross the crossing at the same time interval due to the high volume of pedestrian traffic. The graphs below for both analyzed intersections show changes in the traffic intensity of left-turning vehicles compared to the time of a left turn. This analysis allowed for the determination of the first conclusions regarding the impact of the number of pedestrians on the possibility of leaving the intersection of right-turning vehicles.
In the case of intersection No. 1 at inlet N only in variant 9, where the number of pedestrians was assigned to 400 pedestrians per hour, it exceeded the number of vehicles wanting to turn right; the number of vehicles in the measurement interval was reduced and the travel time was extended
In the case of intersection No. 1 at inlet E already in variant 5, where the number of pedestrians was 200 pedestrians per hour, the time of maneuvering to the right began to increase, and in variant 6, the number of vehicles in the measurement interval began to decrease.
In the case of intersection No. 1 at inlet W, the first changes could already be observed in variant 3; therefore, with the number of 100 pedestrians per h, both the travel time increased and the number of vehicles in the measurement period decreased. Note that this was the only inlet that did not have a right filter arrow in the signal program.
In the case of intersection No. 1 at inlet S, the number of vehicles did not change in any of the analyzed variants, and the time of driving to the right increased slightly from variant 1, where the number of pedestrians was only 50 pedestrians per hour.
In the case of intersection No. 2 at inlet N, the number of right-turning vehicles decreased only in variant 8 with 350 pedestrians per hour, and the travel time was extended in variant 7 with 300 pedestrians per hour.
In the case of intersection No. 2 at inlet W, the number of pedestrians in the following variants did not affect the number of vehicles in the measuring section and the travel time of right-turning vehicles increased with each successive variant, starting from variant 2; however, the increase was insignificant.
Summing up the measurement results, it should be noted that the fewer the vehicles that turn right, the less the number of pedestrians affects the travel time and leave the intersection. In the analyzed case, the limit number of right-turning vehicles was 350 vehicles per hour, where up to this value, the influence of pedestrians was slight or extended the travel time in the case of the 8th variant, where the number of pedestrians was 350 pedestrians per hour.
Comparing the number of right-turning vehicles to the LOS assessment of a given right-turning relationship at individual inlets by conducting 11 simulations, the following results were obtained. For the N inlet of intersection 1, despite the increasing number of pedestrians, the LOS analysis did not change and was constantly at level 2 corresponding to B in the HCM2010 scale method. At inlet E, the LOS analysis for this inlet changed from the second variant to level C, and then from the fourth variant to level D. The maximum value achieved was from variant 5, i.e., 200 pedestrians per hour, and reached the worst possible value of F. In the case of W, the base LOS value as C and increased to E for variants 2 and 3, and then from variant 4 it already reached the worst possible F level. In the case of the S inlet, the LOS analysis showed an increase to level C from the 3rd simulation variant in the place where pedestrians reached the value of 100 pedestrians per hour. The analyses of individual inlets and variants are shown in Figure 5.
In the case of the Junction 2 analysis, the deterioration of the LOS analysis was gradual. Both at inlets N and W, these inlets began in variant 1 with LOS at level A. Then, in the case of inlet N, the worst possible F level for a right torsion was from variant 7 where the number of pedestrians was 300 per h. In the case of the W inlet, as the number of pedestrians at the LOS inlets increased, it grew from A until it reached E at the time of variant 11, where the number of pedestrians reached the maximum analyzed value of 500 pedestrians per hour. The analyses of individual inlets and variants are shown in Figure 6.
The final stage of the analysis was to compare the entire intersection and traffic conditions in the LOS analysis. The intensities of all vehicles at the intersection were assigned to the comparison in comparison to the LOS analysis also of the entire intersection. As the final result of the capacity study, the efficient operation of the entire intersection was not only aimed at individual inlets or torsion relationships. In the case of intersection 1, the level of freedom of movement LOS increased only from variant 5 (200 pedestrians/hour) and reached the value of D up to variant 10 (450 pedestrians/hour). In the case of a smaller intersection in terms of the number of flights and the intensity of vehicles, intersection 2, the level of freedom of movement was gradually reduced. From variants 4 to 7, the level of freedom of movement was B, from 8 to 9—C, and from 10 to 11—D. The graphical comparison is presented in Figure 7.
The final comparison shows that, depending on the constant factors at the intersection, such as the duration of green signals for individual signal groups, as well as the intensity of vehicles at the inlets, the impact of pedestrians walking on pedestrian crossings is significant. Ignoring the addition of the counted number of pedestrians is a big mistake in making microsimulation models.

4. Discussion

When performing microsimulation analyses commissioned by private or public clients, it is necessary not to ignore the number of pedestrians at the intersection. To obtain reliable results regarding, e.g., capacity and the assessment of traffic conditions, it is necessary to include pedestrians.
If the signaling programs allow for two signal groups that collide with each other, the number of pedestrians has a direct impact on the obtained measurement results.
From the eleven simulation variants performed on a micro-scale, the more vehicles on a given route, the more significant the impact of pedestrians. The longer the duration of the green signal for vehicles, the greater the chance of achieving better traffic conditions. The failure to use the filter arrow also contributes to the deterioration of the traffic conditions that can be obtained. Only in the case where pedestrians do not completely collide with vehicles is it possible to bypass pedestrians in microsimulation models.
The analyzed two different intersections show how different results can be obtained for different numbers of pedestrians and different initial conditions added to the microsimulation network. Even the number of 150 pedestrians per hour can significantly impact the assessment of traffic conditions at the analyzed intersection.
An important dominant factor in micro-modeling is the location of the intersection. For example, a nearby public transport stop may have a considerable impact on pedestrian traffic across pedestrian crossings. In the event of the arrival or departure of a large number of buses at a given time, pedestrian traffic may be uneven during the measurement period. Well-programmed and coordinated traffic lights are the basis for a well-functioning city and improving the lives of residents and road users.

Author Contributions

Formal analysis, methodology, resources: M.Z.-O.; software, validation, results: D.O. All authors have read and agreed to the published version of the manuscript.

Funding

This study was funded by the Gdynia Maritime University, research project WN/2022/PZ/10 and WN/2022/PZ/06.

Institutional Review Board Statement

Not applicable.

Informed Consent Statement

Not applicable.

Data Availability Statement

Not applicable.

Acknowledgments

Traffic data were obtained from the Intelligent Transportation System—TRISTAR (Gdynia Road Administration Office).

Conflicts of Interest

The authors declares no conflict of interest.

References

  1. Wang, L.; Xue, X.; Zhou, X.; Wang, Z.; Liu, R. Analyzing the Topology Characteristic and Effectiveness of the China City Network. Environ. Plan. B Urban Anal. City Sci. 2021, 48, 2554–2573. [Google Scholar] [CrossRef]
  2. Yulianto, B. Traffic Management and Engineering Analysis of the Manahan Flyover Area by Using Traffic Micro-Simulation VISSIM. IOP Conf. Ser. Mater. Sci. Eng. 2020, 852, 12005. [Google Scholar] [CrossRef]
  3. Jamroz, K.; Oskarbski, J.; Kustra, W.; Gumińska, L. Wielopoziomowe Modelowanie Ruchu—Koncepcja i Doświadczenie Praktyczne. In Proceedings of the VIII Konferencja Naukowo—Technologiczna z Cyklu Problemy komunikacyjne miast w Warunkach Zatłoczenia Motoryzacyjnego: Nowoczesny Transport Publiczny w Obszarach Zurbanizowanych, Poznań, Poland, 15–17 June 2011. [Google Scholar]
  4. Lopez, A.; Jin, W.; Al Faruque, M.A. Security Analysis for Fixed-Time Traffic Control Systems. Transp. Res. Part B Methodol. 2020, 139, 473–495. [Google Scholar] [CrossRef]
  5. Kim, H.; Han, Y.-J.; Park, J.-S. Impacts of Special Traffic Lights on Deep Learning Based Traffic Light Recognition Systems. J. Korean Inst. Commun. Inf. Sci. 2021, 46, 526–531. [Google Scholar] [CrossRef]
  6. Oskarbski, J.; Gumińska, L. The Application of Microscopic Models in the Study of Pedestrian Traffic. MATEC Web Conf. 2018, 231, 03003. [Google Scholar] [CrossRef]
  7. Yeh, T.-W.; Lin, H.-Y.; Chang, C.-C. Traffic Light and Arrow Signal Recognition Based on a Unified Network. Appl. Sci. 2021, 11, 8066. [Google Scholar] [CrossRef]
  8. Tang, K.; Kuwahara, M.; Tanaka, S. Design of Intergreen Times Based on Safety Reliability. Transp. Res. Rec. J. Transp. Res. Board 2011, 2259, 213–222. [Google Scholar] [CrossRef]
  9. Szagała, P.; Brzeziński, A.; Kieć, M.; Budzynski, M.; Wachnicka, J.; Pazdan, S. Pedestrian Safety at Midblock Crossings on Dual Carriageway Roads in Polish Cities. Sustainability 2022, 14, 5703. [Google Scholar] [CrossRef]
  10. Chauhan, B.; Joshi, G.; Parida, P. Speed Trajectory of Vehicles in VISSIM to Recognize Zone of Influence for Urban-Signalized Intersection. In Recent Advances in Traffic Engineering; Springer: Singapore, 2020; pp. 505–516. ISBN 978-981-15-3741-7. [Google Scholar]
  11. Fellendorf, M.; Vortisch, P. Microscopic traffic flow simulator VISSIM. In International Series in Operations Research and Management Science; Springer: New York, NY, USA, 2010. [Google Scholar]
  12. Manjunatha, P.; Vortisch, P.; Mathew, T. Methodology for the Calibration of VISSIM in Mixed Traffic. In Proceedings of the Transportation Research Board 92nd Annual Meeting, Washington, DC, USA, 13–17 January 2013. [Google Scholar]
  13. Wibowo, S.; Fadilah, S.R. Queuing Analysis Using Viswalk for Check-in Counter: Case Study of Lombok Praya International Airport. MATEC Web Conf. 2018, 181, 2006. [Google Scholar] [CrossRef]
  14. Heydemans, E.; Sumabrata, J. The Analysis of Pedestrian’s Facility Level of Service at Pondok Cina Rail Station’s Platform Using PTV Viswalk. MATEC Web Conf. 2019, 278, 5001. [Google Scholar] [CrossRef] [Green Version]
  15. Ziemska, M. Exhaust Emissions and Fuel Consumption Analysis on the Example of an Increasing Number of HGVs in the Port City. Sustainability 2021, 13, 7428. [Google Scholar] [CrossRef]
  16. Ziemska, M.; Smolarek, L. Analysis of the Effect of Mass Events on Car Traffic in the City in the Daily Interval. In Proceedings of the 2017 IEEE 2nd International Conference on System Reliability and Safety (ICSRS), Milan, Italy, 20–22 December 2017; Volume 2018, pp. 521–525. [Google Scholar]
  17. Kaths, H.; Keler, A.; Bogenberger, K. Calibrating the Wiedemann 99 Car-Following Model for Bicycle Traffic. Sustainability 2021, 13, 3487. [Google Scholar] [CrossRef]
  18. Zheng, Y.; Shao, Q.; Zhang, Y.; Zhang, S. Simulation on Two Types of Improved Displaced Left-Turn Intersections Based on VISSIM. In International Symposium on Simulation and Process Modelling; Springer: Singapore, 2021; pp. 213–221. ISBN 978-981-33-4574-4. [Google Scholar]
  19. Qu, W.; Sun, Q.; Zhao, Q.; Tao, T.; Qi, Y. Statistical Analysis of Safety Performance of Displaced Left-Turn Intersections: Case Studies in San Marcos, Texas. Int. J. Environ. Res. Public Health 2020, 17, 6446. [Google Scholar] [CrossRef] [PubMed]
  20. Li, Z.; Chitturi, M.; Zheng, D.; Bill, A.; Noyce, D. Modeling Reservation-Based Autonomous Intersection Control in VISSIM. Transp. Res. Rec. 2013, 2381, 81–90. [Google Scholar] [CrossRef] [Green Version]
  21. Siddharth, S.M.P.; Ramadurai, G. Calibration of VISSIM for Indian Heterogeneous Traffic Conditions. Procedia Soc. Behav. Sci. 2013, 104, 380–389. [Google Scholar] [CrossRef] [Green Version]
  22. Lownes, N.E.; Machemehl, R.B. VISSIM: A Multi-Parameter Sensitivity Analysis. In Proceedings of the Proceedings—Winter Simulation Conference, Monterey, CA, USA, 3–6 December 2006. [Google Scholar]
  23. Kumar, L. Study of Heterogeneous Traffic and Modelling Using VISSIM; Third Rock Consultants Private Limited: Hyderabad, India, 2020. [Google Scholar]
  24. Carvalho, L.; Setti, J.R. Calibration of the VISSIM Truck Performance Model Using GPS Data. Transportes 2019, 27, 131–143. [Google Scholar] [CrossRef]
  25. Ghonaim, F. Optimizing Router Bypass Granularity Based on Traffic Behaviour. In Proceedings of the 2019 IEEE International Black Sea Conference on Communications and Networking (BlackSeaCom), Sochi, Russia, 3–6 June 2019; pp. 1–3. [Google Scholar]
  26. Kaixi, Y.; Li, M. Traffic Simulation, Optimization and Evaluation of Adjacent Intersections Based on VISSIM Model. Appl. Sci. Innov. Res. 2020, 4, 53. [Google Scholar] [CrossRef]
  27. Fellendorf, M. VISSIM: A Microscopic Simulation Tool to Evaluate Actuated Signal Control Including Bus Priority. In Proceedings of the 64th Institute of Transportation Engineers Annual Meeting, Dallas, TX, USA, 16–19 October 1994. [Google Scholar]
  28. Van, T. A Method to Identify Critical Acceptance Gap at Conflict Area: Apply to Vissim Simulation. Sci. Technol. Dev. J. 2014, 17, 72–78. [Google Scholar] [CrossRef]
  29. Liang, Q.; Wan, Q.; Bai, L.; Yu, H.; Lv, L.; Li, D. Sensitivity of Simulated Conflicts to VISSIM Driver Behavior Parameter Modification. In Green, Smart and Connected Transportation Systems; Springer: Singapore, 2020; pp. 113–122. ISBN 978-981-15-0643-7. [Google Scholar]
  30. Kretz, T.; Grünebohm, A.; Schreckenberg, M. Experimental Study of Pedestrian Flow through a Bottleneck. J. Stat. Mech. Theory Exp. 2006, 2006, 10014. [Google Scholar] [CrossRef] [Green Version]
  31. Campisi, T.; Basbas, S.; Tesoriere, G.; Canale, A.; Vaitsis, P.; Zeglis, D.; Andronis, C.; Alkharabsheh, A. Evaluation of Pedestrians’ Behavior and Walking Infrastructure Based on Simulation. Lect. Notes Comput. Sci. 2020, 12250, 741–753. [Google Scholar] [CrossRef]
  32. Bandi, M.; George, V. Calibration of Vehicle and Driver Characteristics in VISSIM and ANN-Based Sensitivity Analysis. Int. J. Microsimulation 2020, 13, 79–101. [Google Scholar] [CrossRef]
  33. Sandaruwan, A.; Karunarathne, T.; Wickramasinghe, V. Determining Roundabout Capacity by Modifying HCM Model under Mixed Traffic Conditions. In ICSECM; Springer: Singapore, 2021; pp. 313–326. ISBN 978-981-15-7221-0. [Google Scholar]
  34. Rodríguez, D. Revisión Del HCM 2010 y 2000 Intersecciones Semaforizadas. Ingenium 2015, 16, 19–31. [Google Scholar] [CrossRef] [Green Version]
  35. Adnan, M.; Rani, M.; Sulaiman, N.; Zainuddin, N.; Tuan Besar, T.B.H. Comparative Evaluation of Malaysian HCM 2011 and US HCM 2010: Ramp Merging Expressway. J. Phys. Conf. Ser. 2020, 1529, 32095. [Google Scholar] [CrossRef]
  36. Gaca, S.; Suchorzewski, W.; Tracz, M. Inżynieria Ruchu Drogowego Teoria i Praktyka, 1st ed.; Wydawnictwa Komunikacji i Łączności: Warszawa, Poland, 2014; ISBN 978-83-206-1888-4. [Google Scholar]
  37. National Research Council. Highway Capacity Manual Transportation Research Board; TRB: Washington, DC, USA, 1997. [Google Scholar]
  38. PTV Vissim and PTV Viswalk Help. Available online: https://cgi.ptvgroup.com/vision-help/VISSIM_2022_ENG/Content/11_Auswertungen/Ausw_a_ausfuehren.htm (accessed on 17 June 2022).
  39. Ziemska, M.; Płodzik, E.; Falkowska, M. Comparative Analysis of Ports Practices and Activities in the Tri-City and China. TransNav 2019, 13, 641–646. [Google Scholar] [CrossRef]
  40. Ziemska, M.; Szumacher, P. Analysis of Infrastructure Ports and Access Road and Rail to Tri-City Seaport. In Proceedings of the Safety of Sea Transportation—Proceedings of the International Conference on Marine Navigation and Safety of Sea Transportation; TRANSNAV 2017; CRC Press: Boca Raton, FL, USA, 2017. [Google Scholar]
Figure 1. PTV Vissim framework.
Sustainability 14 08945 g001
Figure 2. Junction 1 (J1) and signal program—the name of the streets: Morska–Kwiatkowskiego.
Sustainability 14 08945 g002
Figure 3. Junction 2 (J2) and signal program—the name of the streets: Hutnicza–Kwiatkowskiego.
Sustainability 14 08945 g003
Figure 4. Base data from variant 1.
Sustainability 14 08945 g004
Figure 5. LOS analysis of Junction 1 right turns—comparison.
Sustainability 14 08945 g005
Figure 6. LOS analysis on Junction 2 right turns—comparison.
Sustainability 14 08945 g006
Figure 7. LOS comparison.
Sustainability 14 08945 g007
Table 1. Comparison of the duration of the green light at the inlets where a right turn is possible.
J1 NJ1 SJ1 WJ1 EJ2 NJ2 W
Duration of green light for a particular phase (s)271455323138
Duration of green light for right filter arrow (s)5650-646448
SUM: green light + right filter arrow (s)836455969586
Publisher’s Note: MDPI stays neutral with regard to jurisdictional claims in published maps and institutional affiliations.

