Article

Failure Mechanism and Stability Control Technology of Slope during Open-Pit Combing Underground Extraction: A Case Study from Shanxi Province of China

1
China Aviation Supplies Holding Company, Beijing 101312, China
2
School of Civil and Transportation Engineering, Hebei University of Technology, Tianjin 300401, China
3
China Construction Science & Technology Group Co., Ltd., Beijing 100195, China
4
School of Energy and Mining Engineering, China University of Mining and Technology (Beijing), Beijing 100083, China
5
Zhengzhou Road & Bridge Construction Investment Group Co., Ltd., Zhengzhou 450052, China
6
Beijing Hongchuang Tianye Construction Engineering Co., Ltd., Beijing 101300, China
*
Author to whom correspondence should be addressed.
Sustainability 2022, 14(14), 8939; https://doi.org/10.3390/su14148939
Submission received: 3 June 2022 / Revised: 16 July 2022 / Accepted: 18 July 2022 / Published: 21 July 2022
(This article belongs to the Special Issue Sustainability in Geology and Civil Engineering)

Abstract

:
With the development of society, the demand for mineral resources is gradually increasing, and the current situation of decreasing total resources dictates the inevitable interaction between open-pit combing underground extraction (OPUG) in time and space. In this research, we took the Anjialing coal mine in Shanxi Province of China as a case study, and tested the physical and mechanical properties of coal rocks in the laboratory. The similarity criterion was used to build a similar experimental model for the deformation evolution of the slope of the open-pit mine section; the digital scattering method was used to test the influence of the underground mining process parameters on the deformation evolution of the open-pit slope. The results showed that there was an obvious distribution of “three zones” above the mining goaf, namely, a collapse zone, fracture zone, and slow subsidence zone. When the mining face was continuously advanced towards the bottom of the open pit, the supporting stress of the mining face transferred to the side of the open-pit slope. Additionally, large displacement and stress concentration were observed on the slope near the stoping line, which caused the slope body to move along the uppermost part of the slope first, and thereafter along the lower part. Various techniques for slope stability control are discussed, including the optimization of spatial and temporal relationships between open-pit and underground mining, the optimization of mining plans, and the use of monitoring and early warning systems. The results can provide a guide for slope stability control of similar open-pit mines in the process of mining coal resources.

1. Introduction

With the continuous advancement of surface mining technology, the proportion of surface coal production has been increasing in the past decades. Restricted by factors such as mining technology and stripping ratio, the mining scope of surface mines is limited to the upper section resources of the entire ore body, and resources not suitable for surface mining at depth are completed by underground mining means [1,2,3]. For horizontal or near-horizontal coal mines with miscellaneous coal seams, it is economically unreasonable to open-pit mine the deeper resources, and a combination of open-pit mining method and underground extraction method is generally used [4,5,6,7]. This form of mining is also known as the method of open-pit combing underground extraction (OPUG) [8,9,10,11,12]. In the process of OPUG, the effects of underground and opencast mining are both mutual superimposition, forming a large dynamic composite system, so the deformation mechanisms of slopes and rock bodies are more complicated, and the slope already formed within the opencast mine will be affected by the disturbance of the underground mining. Settlement deformation and weak layer activation will continuously occur, posing a serious threat to the stability of the slope and safe production [13,14,15,16].
To take necessary and timely strengthening and prevention measures and enable the mining enterprise to obtain optimal economic benefits, it is essential to obtain knowledge of slope mechanisms and deformation characteristics under the mutual influences of open-pit combined underground mining. For conventional slope stability in actual open-pit combined underground mining engineering, the impact of open-pit mining on slope deformation is often analyzed separately, without taking into account the factor of underground mining. Presently, numerical simulation methods are commonly applied for analysis and evaluation, and remarkably critical results have been obtained [17]. Stead et al. analyzed rock slope failure mechanisms in a complex stress environment by using modified numerical modeling techniques [18]. Scholtès and Donzé simulated the expansion and evolution process of fissure-bearing rock masses using the three-dimensional discrete unit method and conducted stability analysis for a specific fissure-bearing rock slope engineering example [19]. Shen and Karakus proposed the Hoek–Brown criterion-based finite element nonlinear strength reduction method for three-dimensional rocky slope stability analysis using the FLAC3D program [20]. Amini et al. divided the rock masses in the reverse slope into two parts: one part was considered as completely disconnected from the parent rock, and the other part was considered as intact rock masses connected with the parent rock [21]. Johari and Lari divided the damage modes of rocky slopes into four types, explored the influence of different heights and damage modes on the instability probability of slope systems, and established a model to directly assess the instability probability of rocky slopes. The influence of different heights and damage modes on the probability of slope system instability was discussed, and a model for directly assessing the probability of rocky slope instability was established [22]. Zhou et al. used RFPA-2D to study the stability of multiple sections of open-pit intersections containing faults and concluded that the presence of faults changes the stress distribution, damage patterns, and water flow paths [23]. Luo et al. used the stochastic finite element method (FEM) to analyze the probability of rock mass stability of mine slopes and underground quarries, and the numerical simulation results showed that the mining of underground quarries had some influence on the stability of mine slopes [24]. Dagdelen and Traore determined the optimum mining depths for six open-pit and shaft mines based on mixed integer linear programming (MILP) [25]. Gischig et al. investigated the significance of kinematic release mechanisms on planar translational slope failure using the three-dimensional distinct element codes [26]. They studied the three-dimensional block shape and volume of the unstable rock masses simulated with different discontinuity set geometries. Li et al. [27] showed through three-dimensional numerical simulation that plastic damage occurs gradually with increasing depth, and a large amount of tensile damage occurs at the top of the slope when the mining depth reaches the edge determined by the seismic exploration method. These research results can solve the related problems of conventional slope stability analysis, among others. Meanwhile, there are still few studies on the joint mining process. Jiang et al. [28] studied the maximum mining capacity of different shafts in the Shirengou iron ore mine under open-pit combined mining conditions based on ore loss rate and grade. Cao et al. [29] studied the impact of underground mining on the mining environment of opencast coal mines based on a two-dimensional heat transfer equation with a phase change component. Wang et al. [30] concluded that mining of shallow buried coal seams causes shear damage to polygonal rock masses, leading to the instability of articulated structures, and that increasing slope and mining height leads to the more rapid development of fractures within gullies, which has a significant effect on the stability of gully slopes.
Due to the complex engineering environment of open-pit joint mining, the deformation value and deformation range of slope rock have far exceeded the original single mining theory understanding. Some scholars have also used model tests, field monitoring, or integrated means to study the deformation and damage law of slope rock under the combined surface and underground mining conditions to analyze the coordinated interaction between the two mining effects. Li et al. [31] have concluded through field investigations, centrifugal modeling, and numerical simulations that the subsurface mining area causes overturning damage to the upper rock masses, resulting in sliding shear of the underlying rock. Singh investigated the vibration response of roof slabs to adjacent open-pit blasting by investigating seven underground coal mines in India. Kovrizhnykh [32] used an elastic creep model to solve the problem of deformation and damage of rock masses in shaft and surface mining under hydrostatic pressure, determining the time to complete damage under long-term stress. The above studies have shown that the interaction between open-pit and underground extraction poses a threat to the safe and orderly production of open-pit mines and that the slope instability and ecological problems caused by such coordinated open-pit and underground extraction constitute a major potential hazard to large-scale open-pit mining. Although some research work has been conducted on coordinated open-pit and underground extraction, systematic results have not yet been seen, and the prevention and control measures for slope hazards of coordinated open-pit and underground extraction under the action of complex factors are still in the initial stage. It has become a research trend to carry out systematic theoretical research on the safety evaluation, monitoring, prediction, forecasting, and treatment of mining slopes, and to provide safety measures and optimization methods for combined surface and underground mining engineering.
Therefore, the engineering geological conditions and mining conditions of the Anjialing II open-pit mine are presented here. We adopted a combination of theoretical research, model tests, and mechanical parameter testing experiments to investigate the spatial and temporal relationship between the mining face and slope of the open-pit mine in the process of OPUG. The deformation and damage characteristics of the slope of the open-pit mine under the influence of pit mining disturbances, the deformation and damage process and instability mechanisms of the mining slope, and the slope stability control methods were investigated. The research results can provide an important basis for improving the resource recovery rate, reducing resource waste, and optimizing the industrial layout, with broad application prospects and significant economic and social benefits.

2. Background of the Engineering

2.1. Overview of the Project

2.1.1. Geological Settings

The Anjialing opencast coal mine located in Shanxi Province of China was selected as the study area (Figure 1). Founded in 1982, the coalfield is a large coal production and energy export base of 100 million tons. The mining area is bordered by the Taihang and Wutai Mountains to the east and Inner Mongolia to the west and has a cold, dry continental climate with particularly severe sand and wind. The area is in a lower temperature state all year round, with an annual average temperature of 5.4–13.8 °C and a large daily temperature difference of 18–25 °C. The average annual sunshine period is 2693.3 h, with a minimum of 2444.5 h and a maximum of 2883.1 h. The maximum humidity is 80% and the minimum is 0. Precipitation is concentrated between July and September and rainfall is unevenly distributed, with annual average precipitation of 426.7 mm and annual average evaporation of 2006.7 mm.

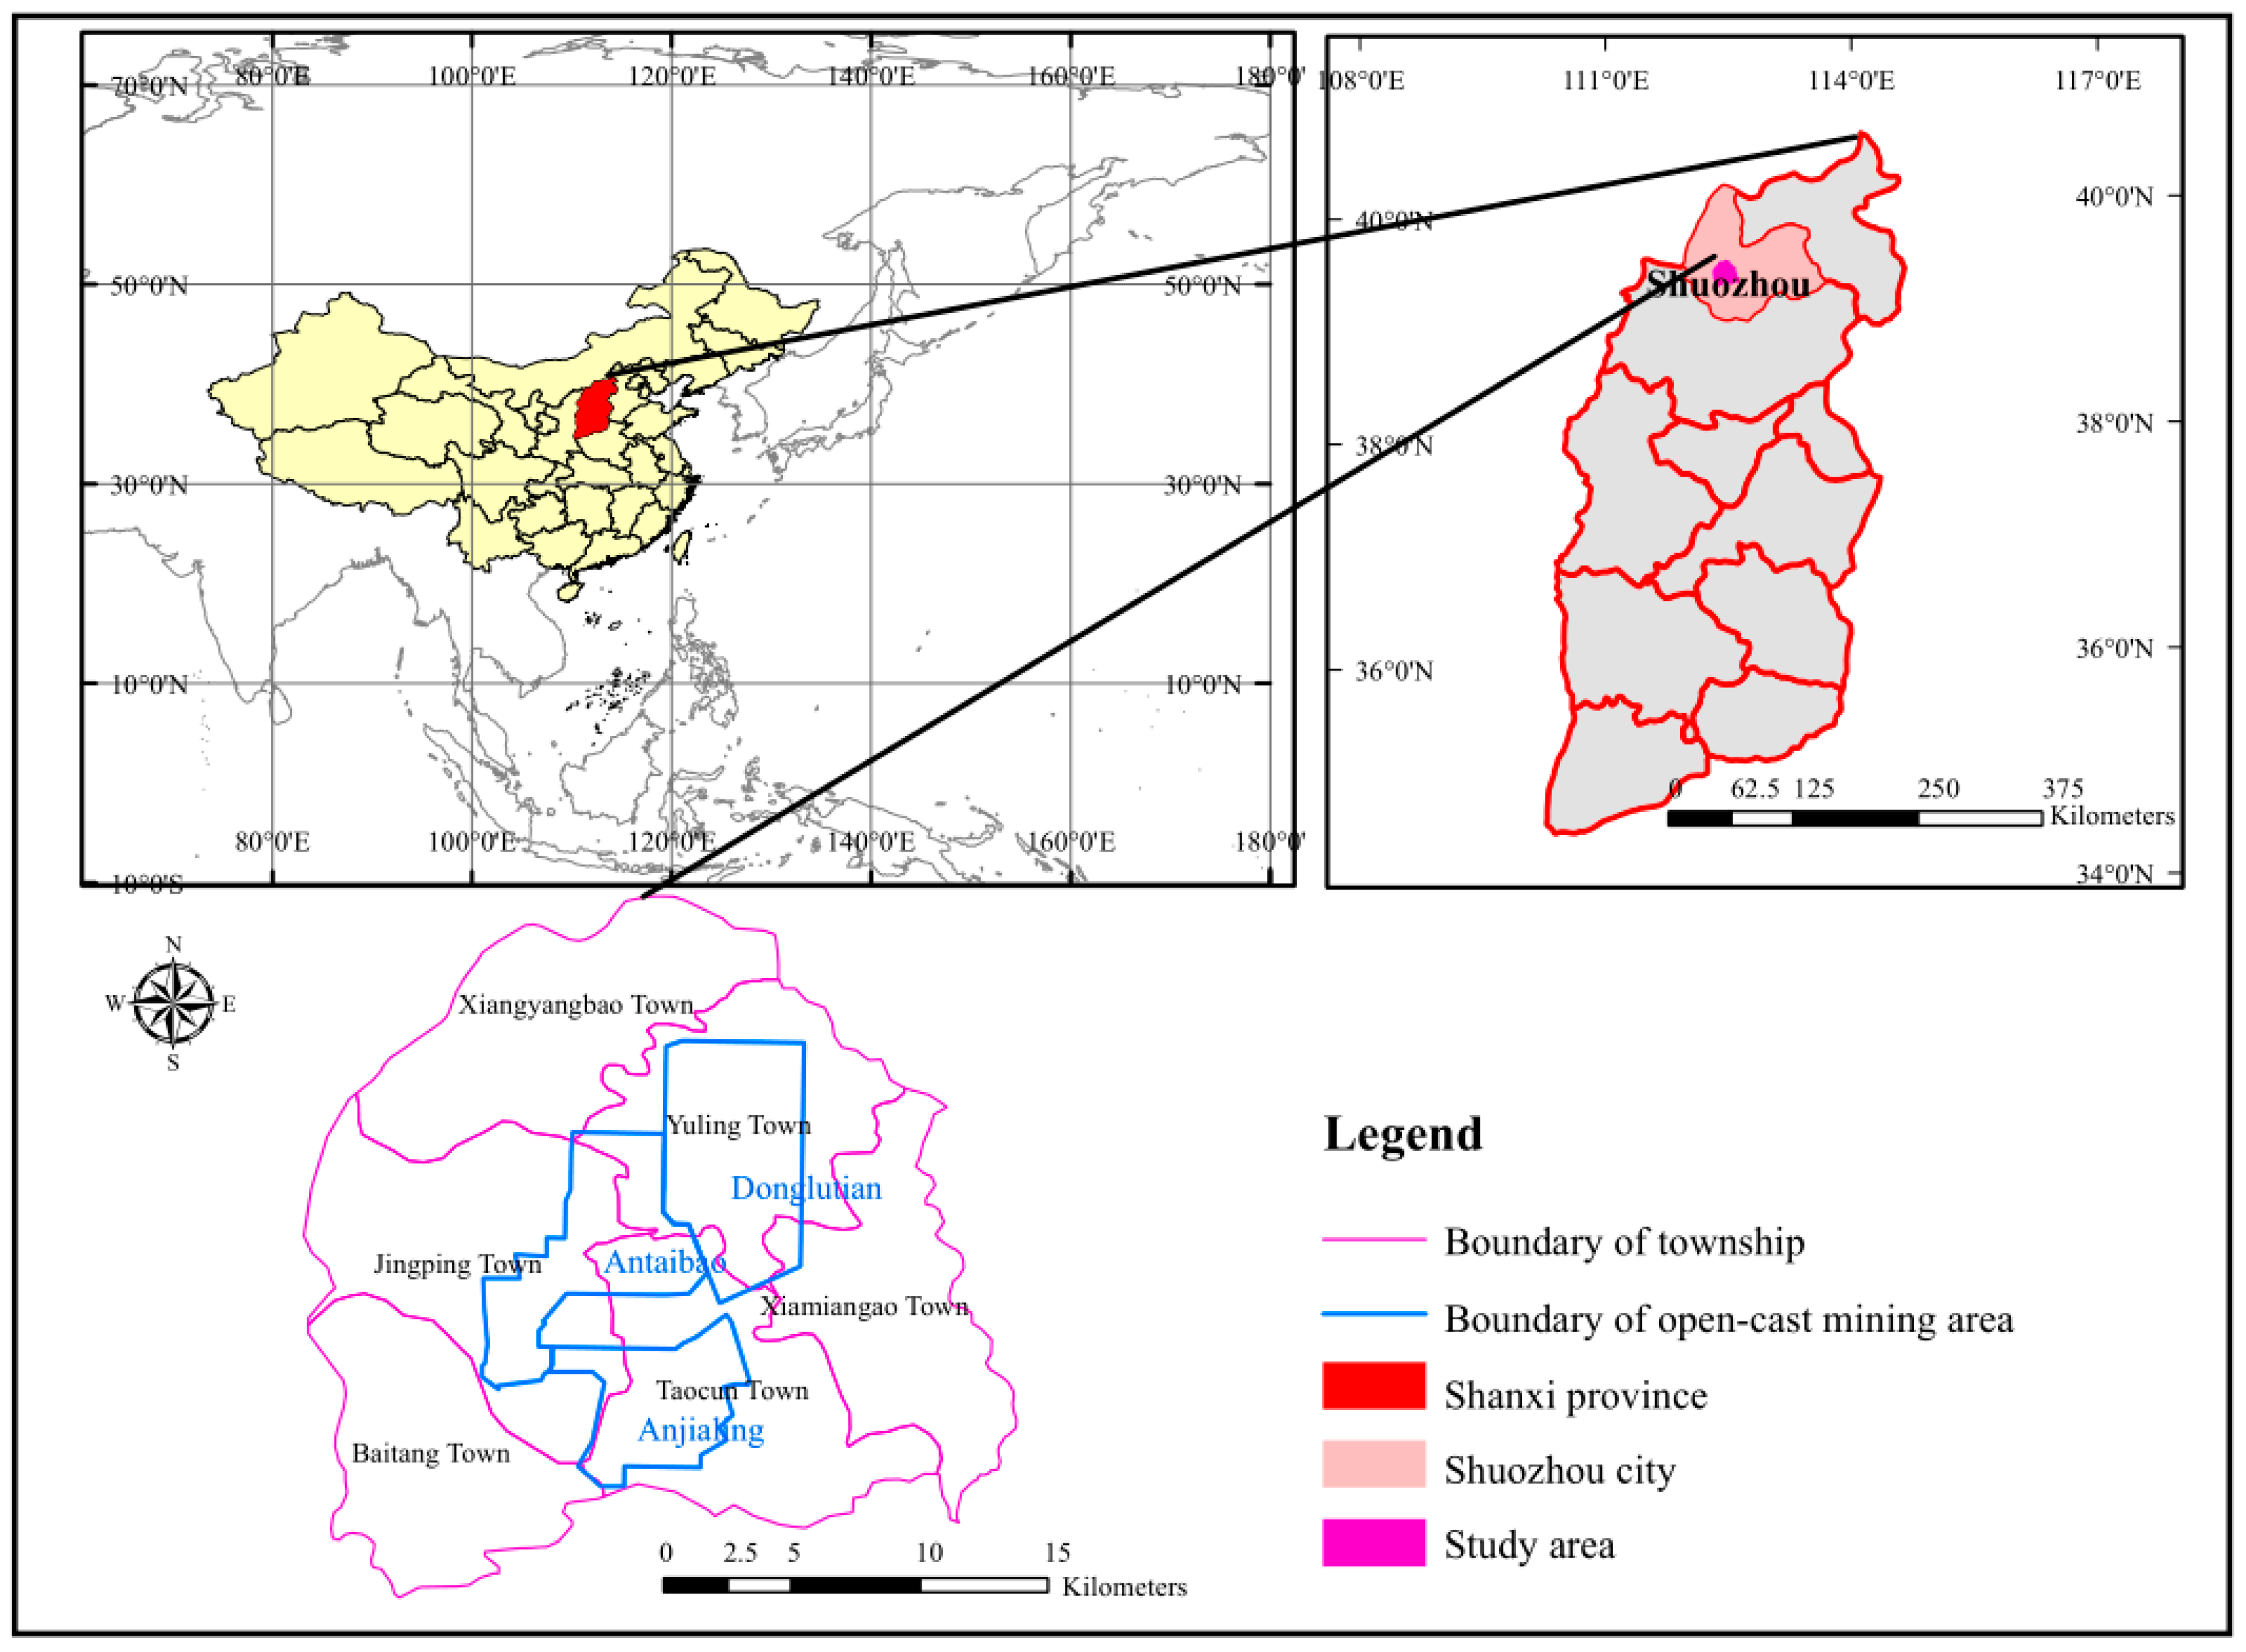
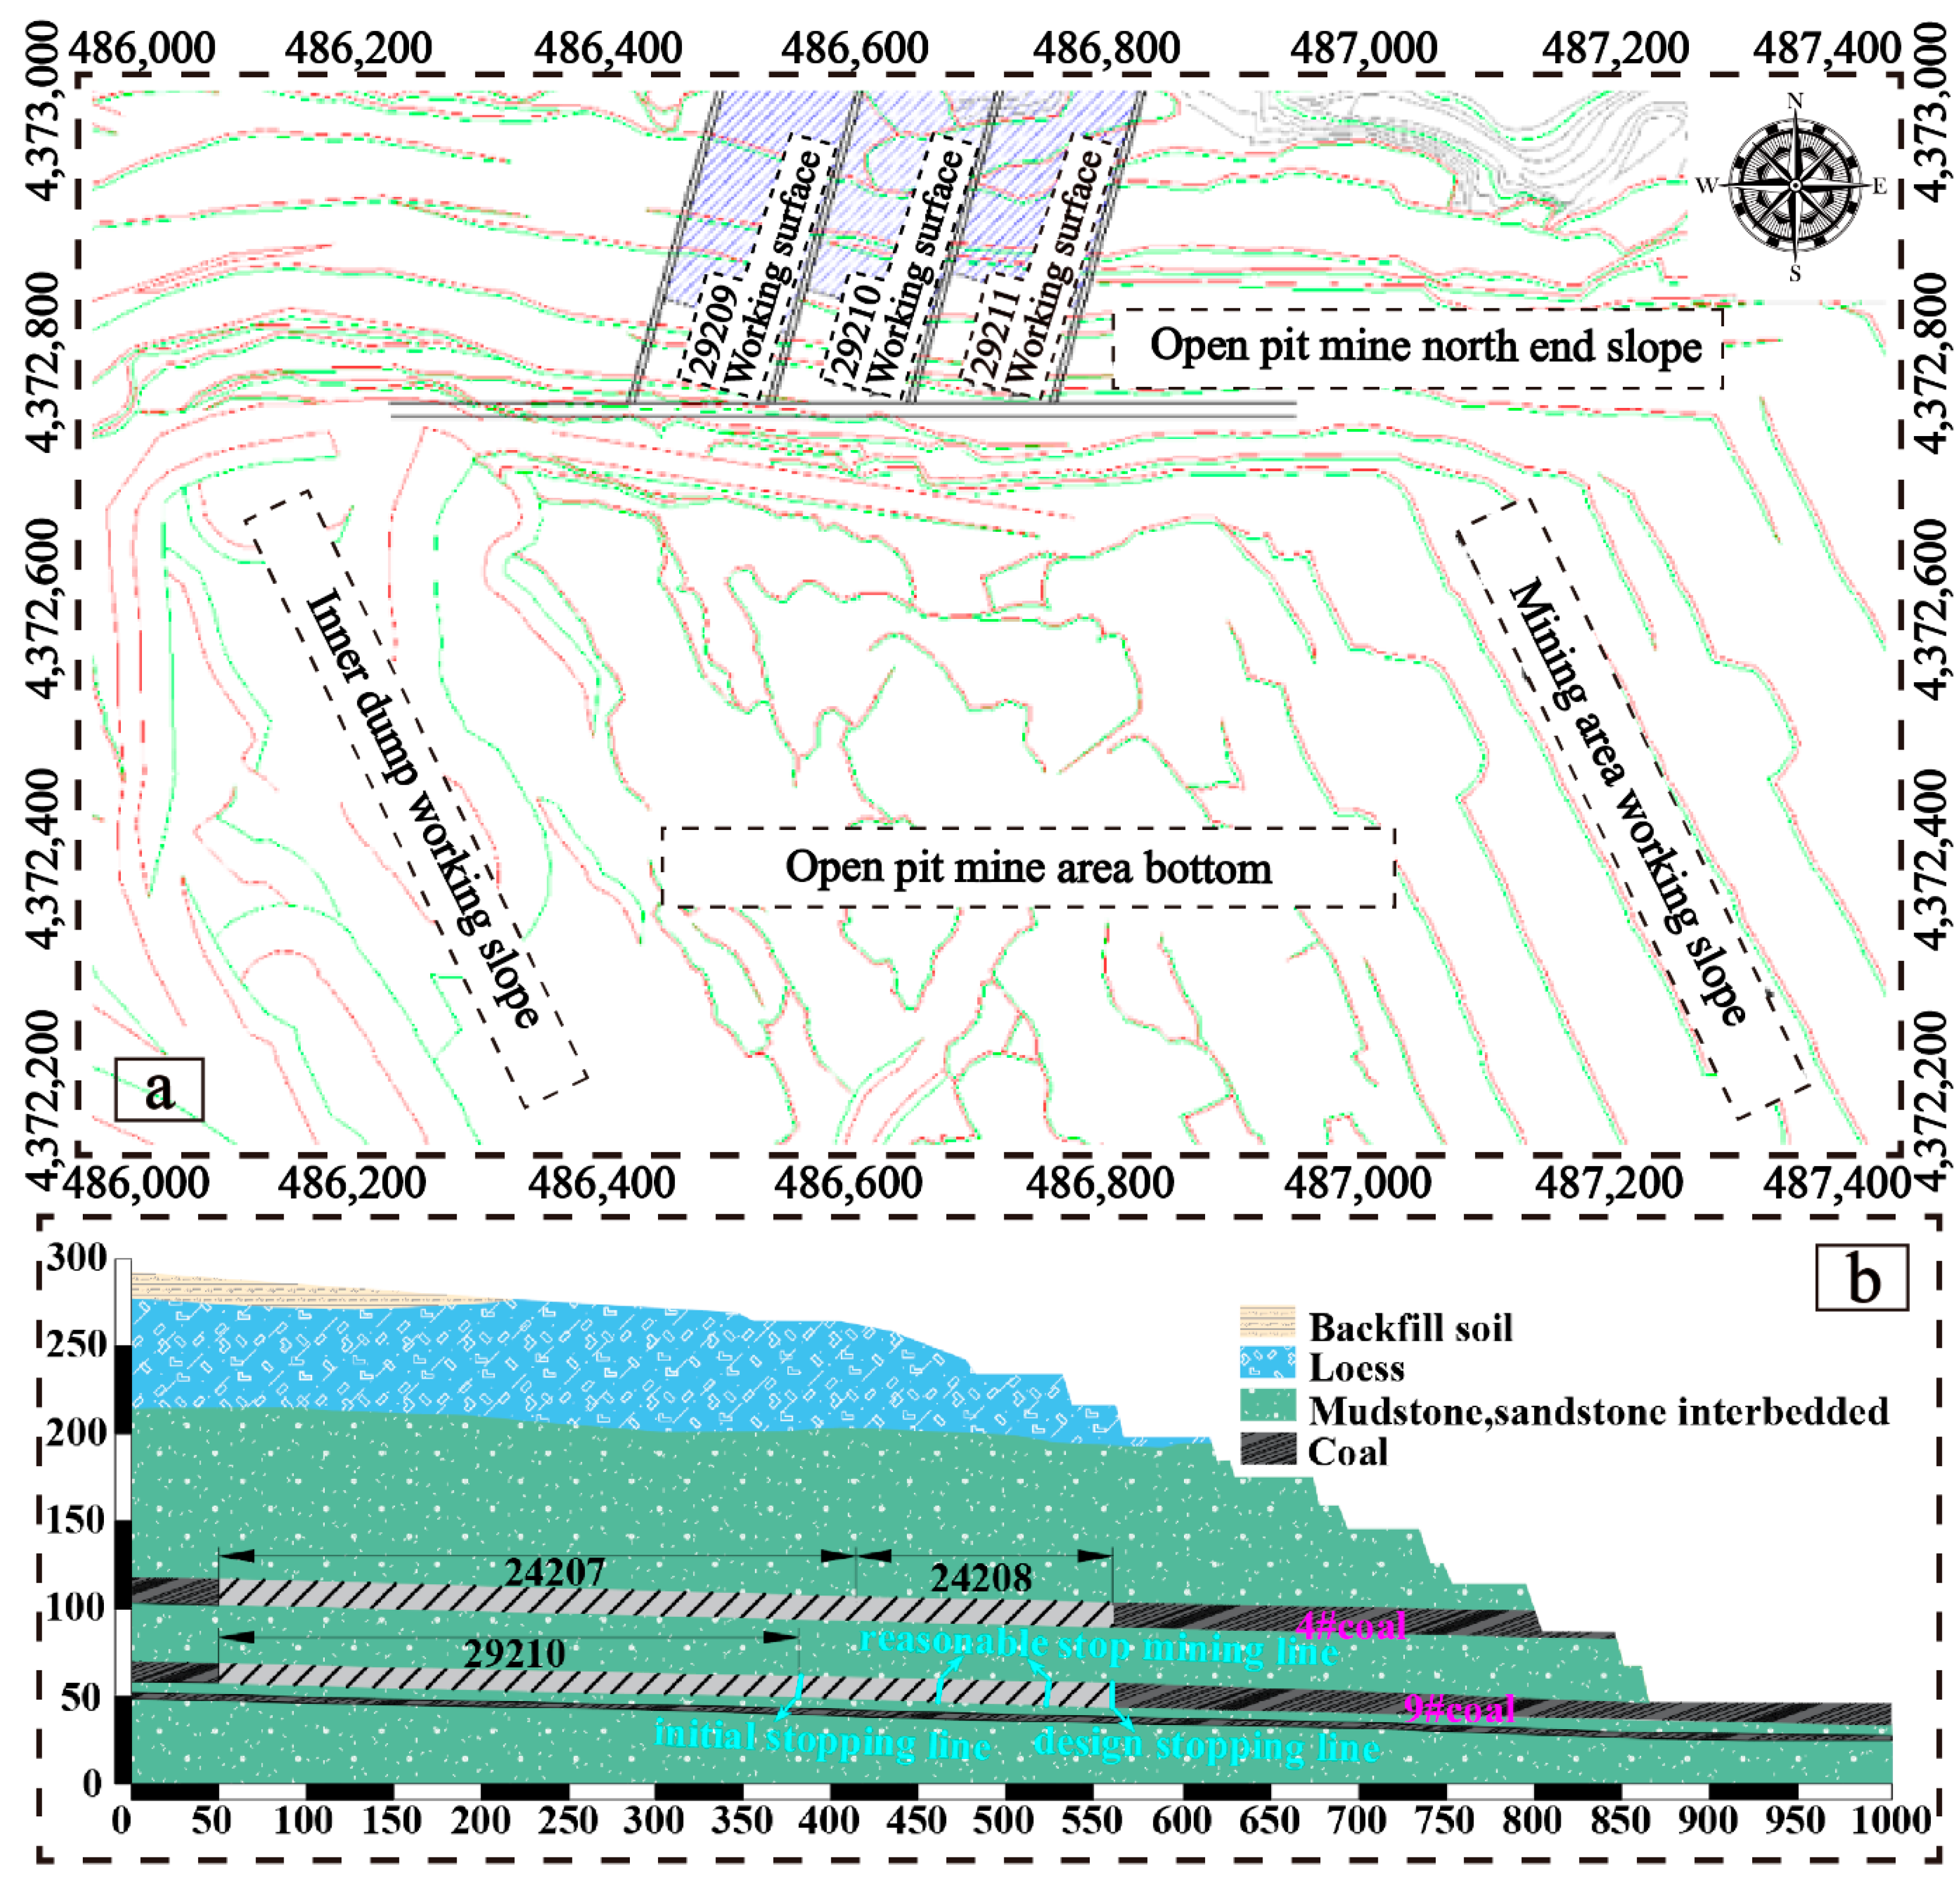
2.1.2. Location of the Anjialing North and the Well-Working Coal Mining II Mine

At present, the north gangue of Anjialing is mainly affected by the sinking of the 9# coal seams mining face of well-working coal mining II mine area, which is manifested by the sinking of the slope of the north gangue of the 9# coal No. 29,209 mining face, No. 29,210 mining face, and No. 29,211 mining face by back mining. During the mining process, the overlying coal seams form “three zones”, i.e., a collapse zone, fracture zone, and subsidence zone. The direct topping of the 9# seam coal in the shaft working mine resulted in the formation of funnel-type subsidence in the flat pan above 1405 in the north end of the open pit. The fissure zone and bending zone caused by the mining of the 9# coal resulted in fissures in the flat pan above 1360 elevation in the north end of the open pit. The impact on the geotechnical body of the north end of the open pit is mainly manifested in the reduction in the physical and mechanical parameters of the geotechnical body of the north gangue caused by the disturbance of the shaft working mine, resulting in the reduction in the physical and mechanical parameters of the geotechnical body of the north gangue. The impact on the rock and soil body of the north end is mainly due to the lowering of the physical and mechanical parameters of the rock and soil body of the north gangue as a result of the underground mining disturbance, which will lead to the development of joints and fissures in the rock and soil body of the north end. In addition, the 1330, 1360, and 1390 elevation pans are the main transportation pans in the open pit. If large fissures and funnel-type subsidence occur, the safety of the open pit will be seriously affected. The spatial location of the north gangue of the Anjialing open-pit mine and the 9# coal of the well-working coal mining II mine are shown in Figure 2.

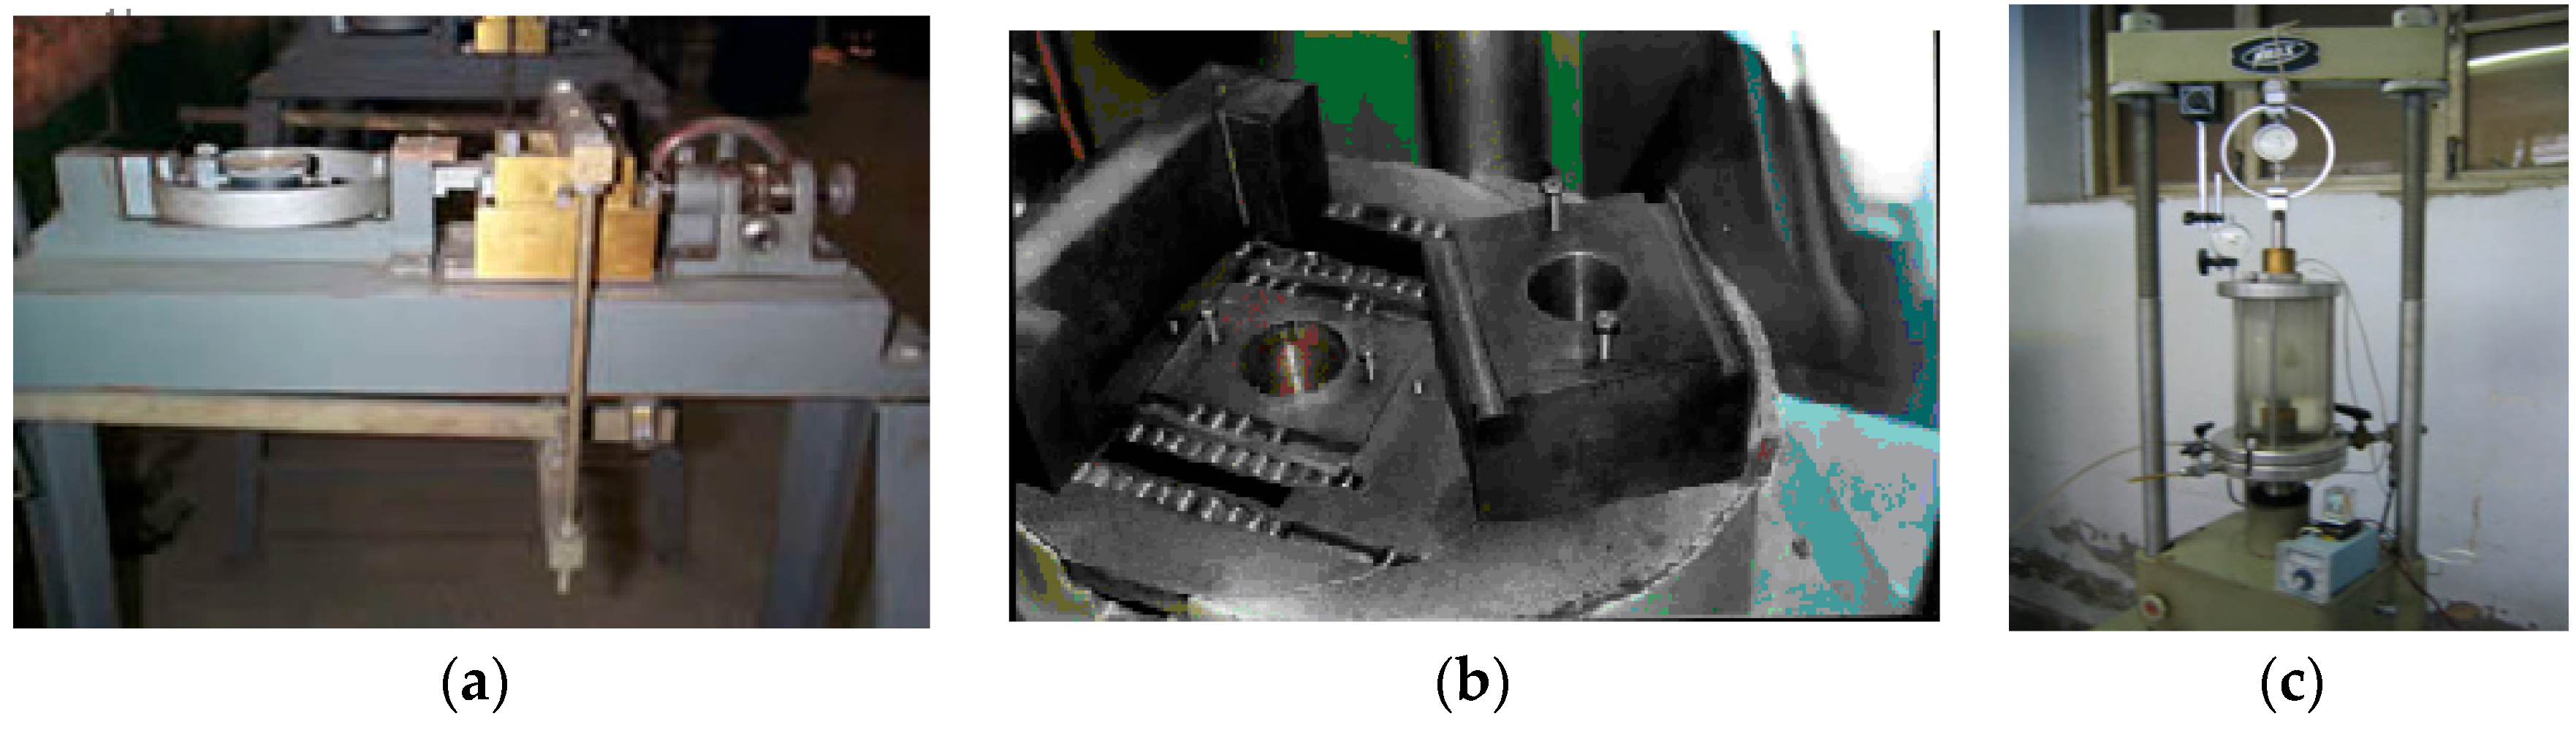
2.2. Testing of Geotechnical and Physical Properties in the Study Area

The understanding of the rock parameters and geological conditions is beneficial for decreasing the potential for geo-hazards during engineering [25,28,33,34,35,36]. The physical and mechanical parameters of the rock and soil were tested by collecting soil and rock from the slope of the open pit, making standard soil and rock specimens, using a straight shear meter, a rock shear resistance meter, and a triaxial shear tester. The test specimens, equipment, and test results are shown in Figure 3 and Table 1.
Twenty soil samples, numbered ZJ1–ZJ20, were collected (Table 1). The physical and mechanical properties of the soil samples were tested in the laboratory and the samples were classified and named accordingly. The weathered bedrock specimens collected, numbered KJ-1–KJ10, are shown in Table 2. The physical and mechanical properties of the weathered bedrock specimens were tested in the laboratory and the specimens were named accordingly.

3. Model Tests

Model tests were conducted using the similarity principle to study the evolution of open-pit slope deformation under different well mining conditions. Using the similarity criterion, a similar experimental model was constructed for the evolution of slope deformation in coordinated open-pit and well mining. Using the digital scattering method, the influence of well mining process parameters on the evolution of slope deformation in the open pit was tested to provide parametric support for the stability of slopes in the process of OPUG.

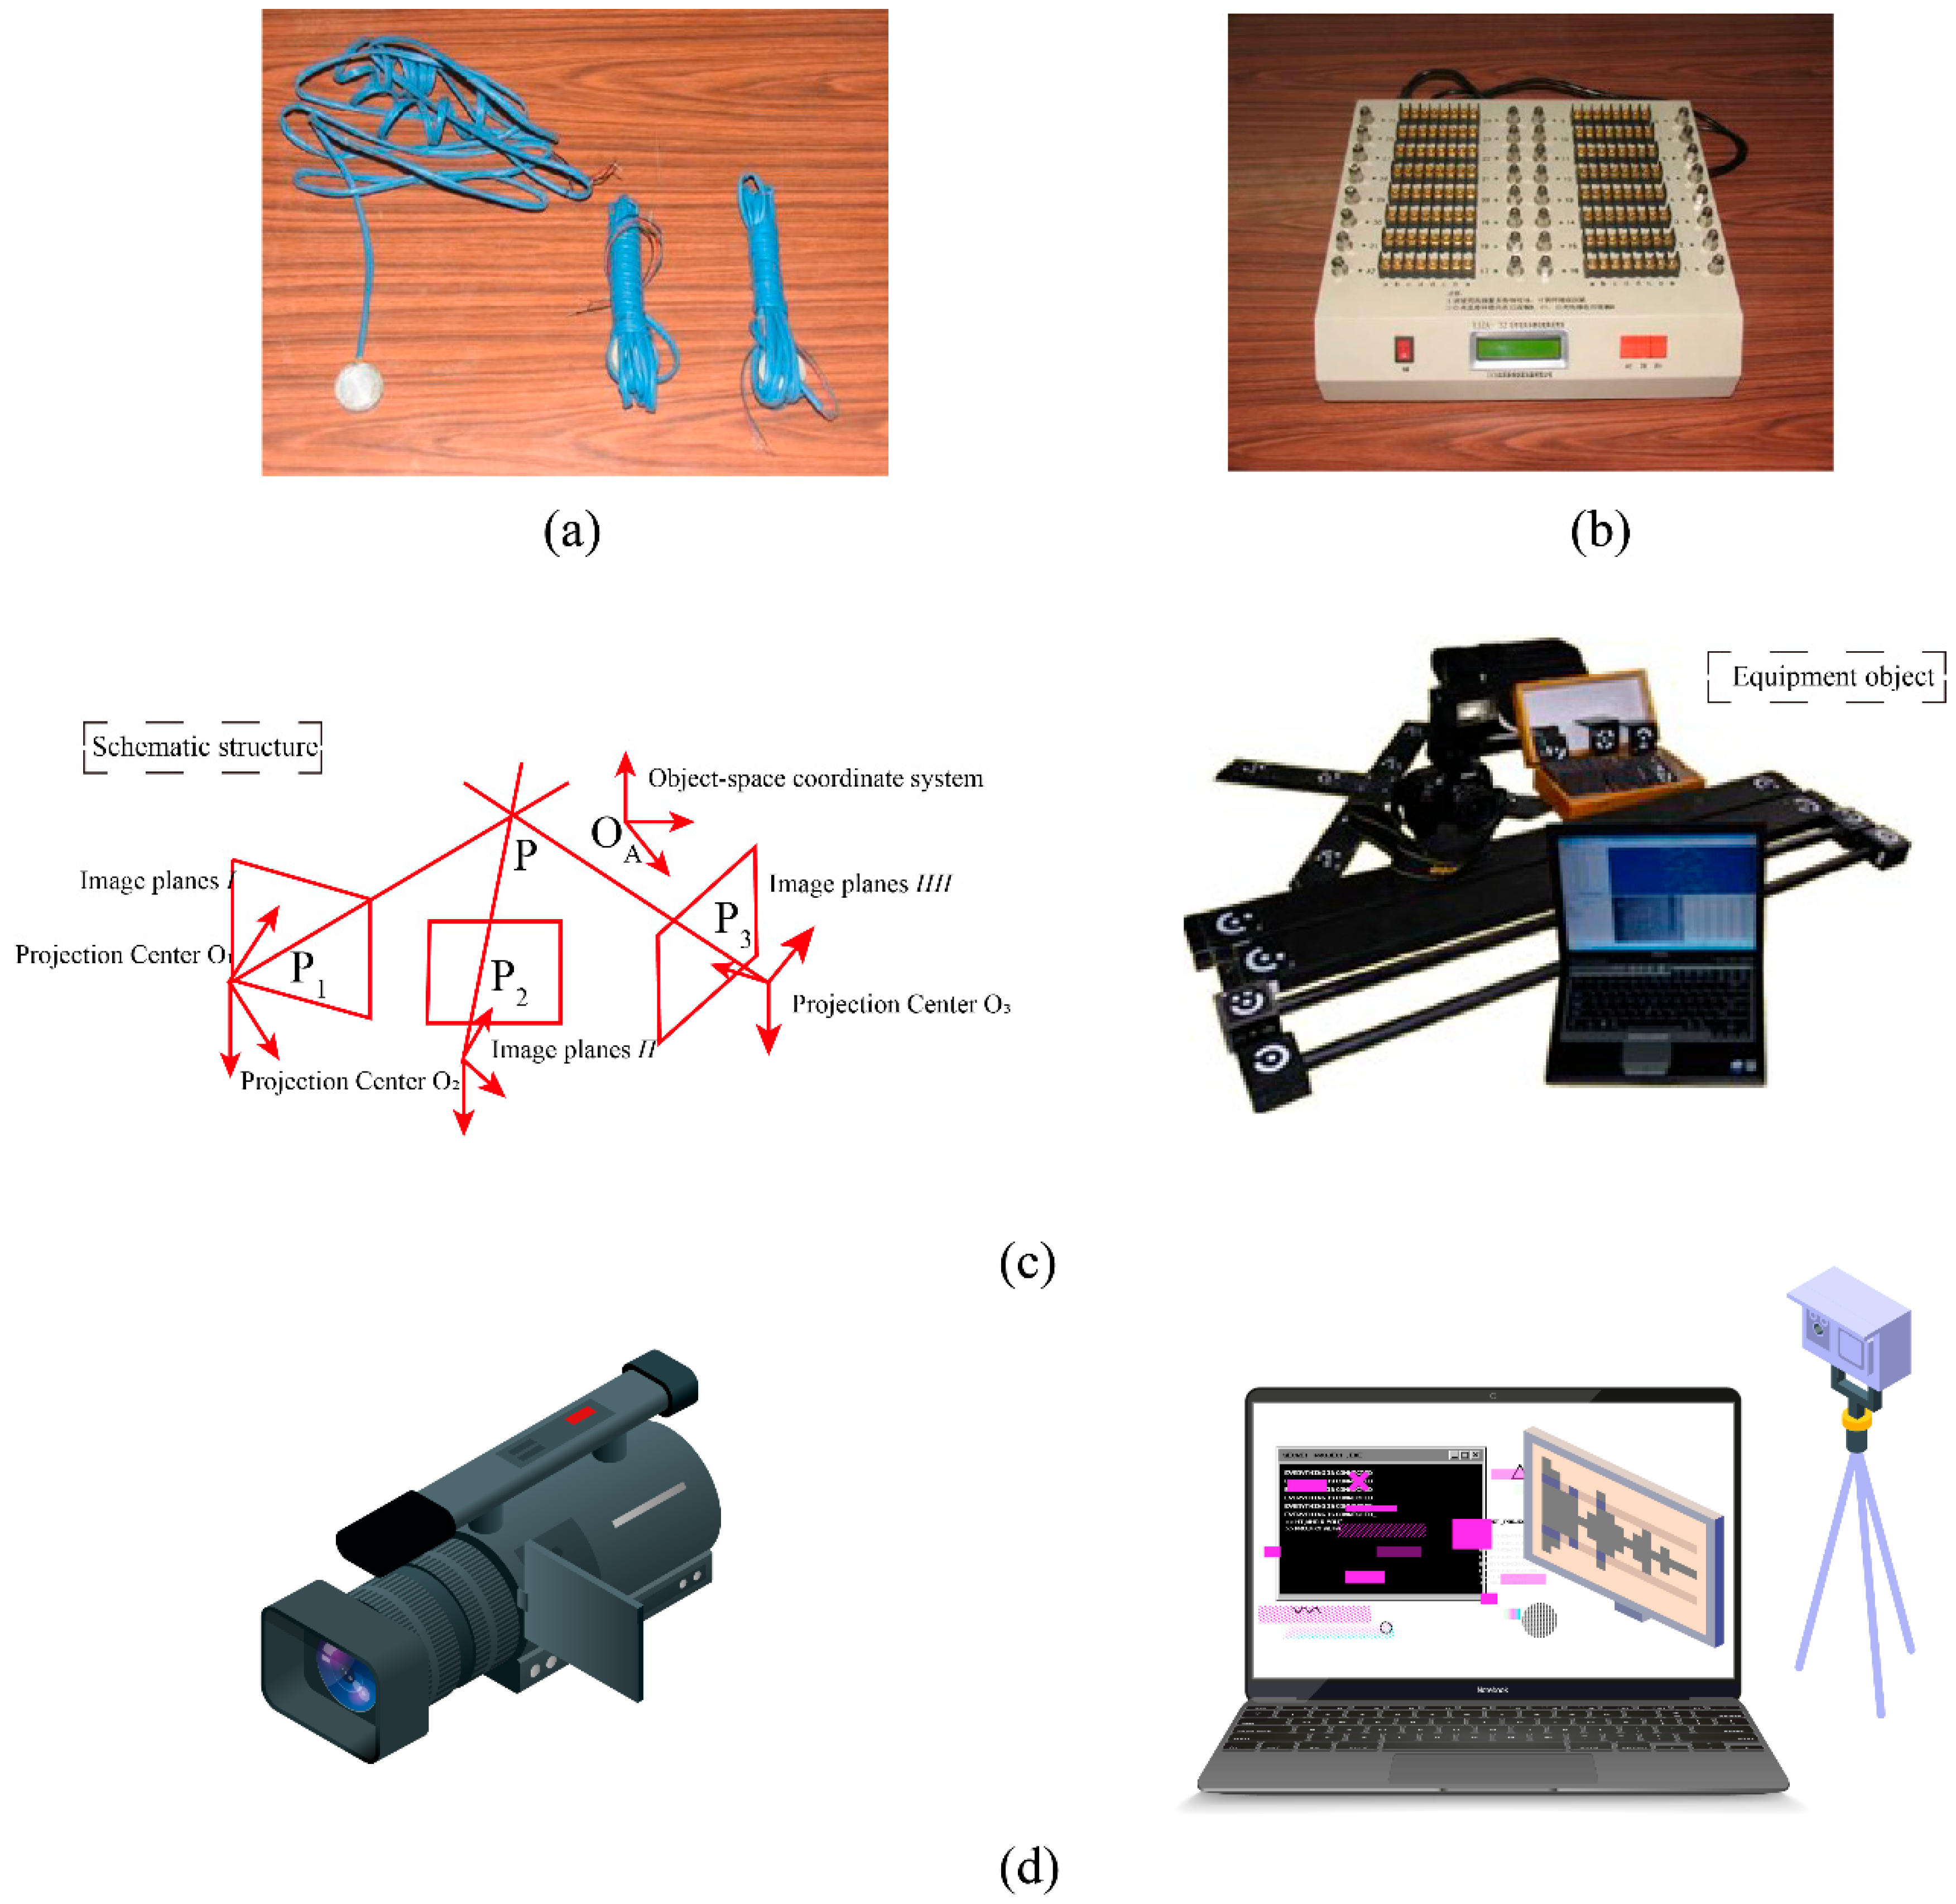
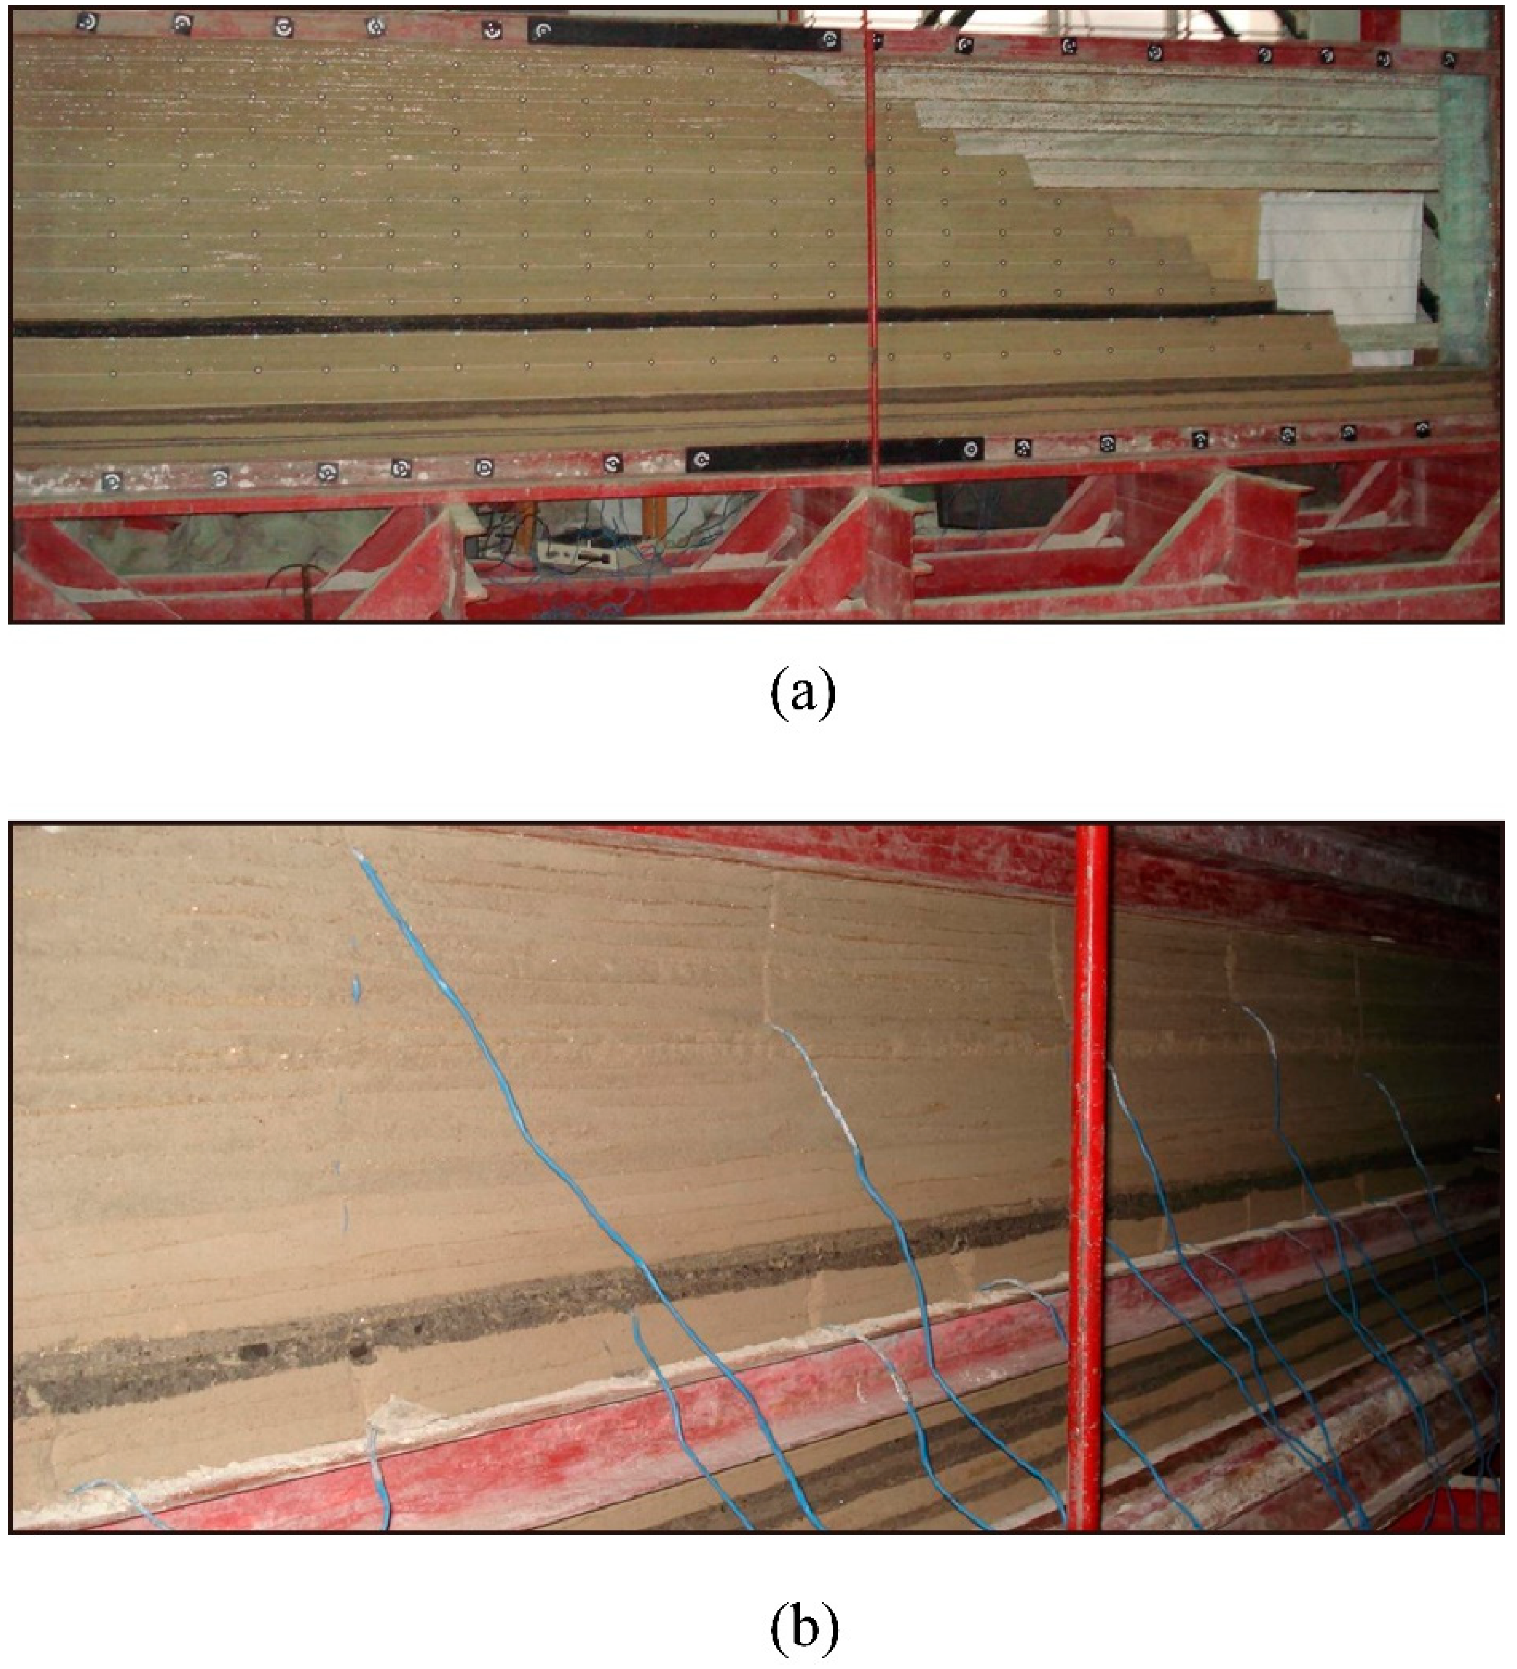
3.1. Test Methods and Equipment

A similar material simulation test has the advantages of intuitive results and repeatable analysis of influencing factors, which plays an important role in guiding mining. A similar material simulation experiment of slope stability in the Anjialing open-pit mine under the effect of coordinated open-pit and shaft mining includes a similar material model, a BW-5 micro pressure box, and an XJTUDP 3D optical photogrammetry system and a digital scatter monitoring system. The digital scatter correlation method is a non-contact photometric test mechanics method that determines the displacement and strain of an object’s surface by obtaining information about its deformation. The main equipment used include an image recording computer, a high-resolution CCD camera, an image processor, etc.
Figure 4a shows the BW-5 pressure box and Figure 4b shows the YJZ-32A digital strain gauge. Figure 4c shows the XJTUDP 3D optical measurement system, and Figure 4d shows the digital scattering light measurement system, etc.

3.2. Similar Material Models and Similar Parameters

3.2.1. Theory and Methods

Similar materials experiments are conducted using similar materials, following similar theories and guidelines, to build a model similar to the site and then carry out a simulated mining study to observe the movement of the overburden and the distribution of support pressure during mining. The model is then used to observe the movement of overburden and support pressure distribution during mining, and to calculate or extrapolate the pattern of roof movement and support pressure distribution during actual mining under these conditions.

3.2.2. Similar Material Parameters

Using the similarity principle, similar model similarity parameters are obtained based on geometric similarity, kinematic similarity, and dynamic similarity calculations, as shown in Table 3.
In the table, α L is the similar length scale, t M is the time taken for the model to move, and σ H and σ M are the unidirectional compressive strengths of the rock formations for the prototype and model, respectively, in MPa.

3.2.3. Proportioning of Model Materials

A distilled water solution equipped with cement, lime, kaolin, paraffin, and retarder was used as the cementitious material and calcium carbonate. Gypsum and silica sand were used as aggregates and similar models were constructed according to the actual slope range of the studied open-pit mine. According to the mechanical parameters of the different rock layers of the slope, similar materials were made by adjusting the ratios of lime, gypsum, and silica sand, as shown in Table 4.

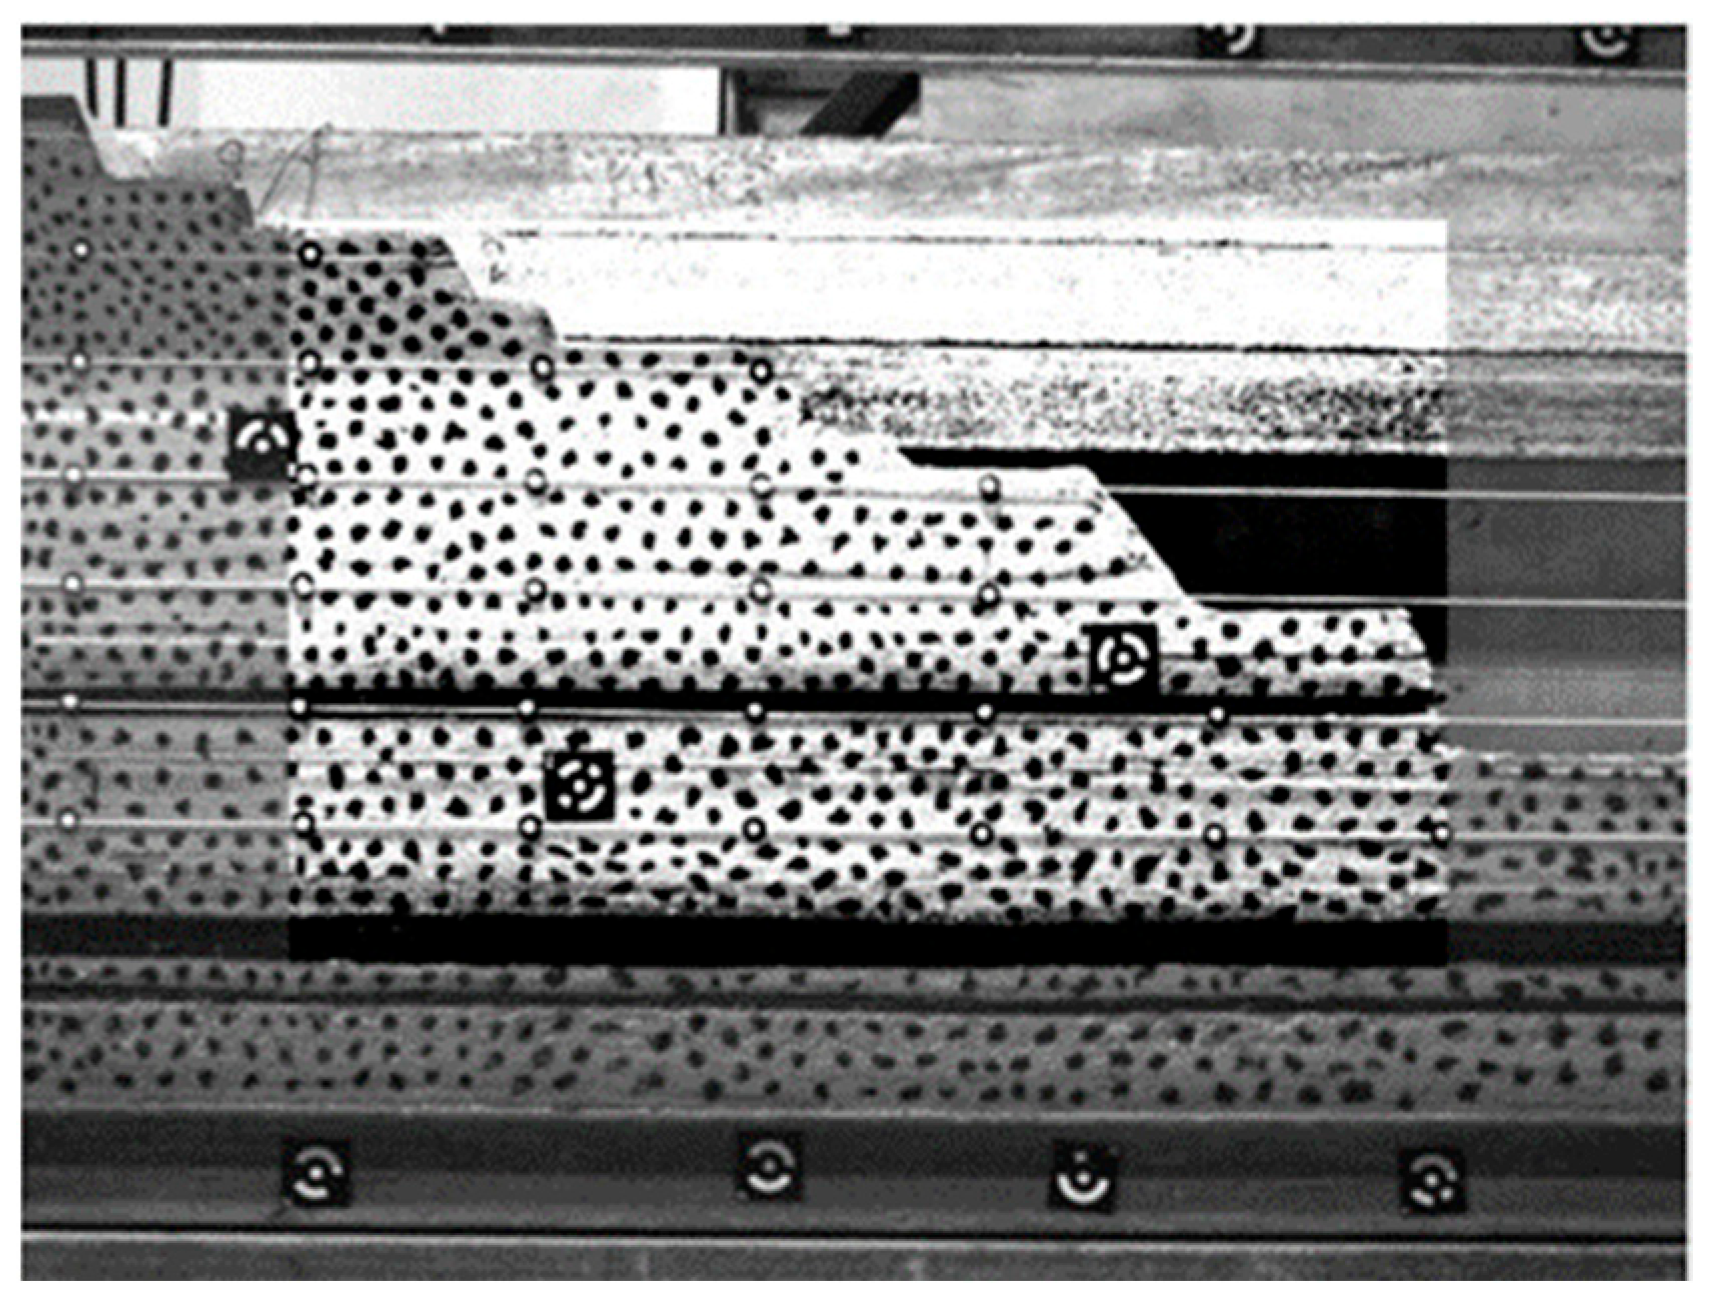
3.2.4. Point Settings and Model Boundaries

The size of the model table is 5000 mm × 300 mm × 2000 mm. Considering the influence of well mining on the evolution of slope deformation, the displacement monitoring points are laid out according to 200 mm × 100 mm. In the process of model building, the BW-5 pressure box was pre-buried to test the stress value, and the YJZ-32A intelligent digital strain gauge tested the deformation value to achieve real-time monitoring of stress and displacement during the advancement process. Seven measurement lines parallel to the coal seam were laid out on the overlying rock layer at the top of the coal seam, with equally spaced measurement points on each line, making a total of 118 optical displacement measurement points with a horizontal spacing of 200 mm and a vertical spacing of 100 mm. Twelve stress test points were also laid out in the rock layer 8 m from the top of the coal seam with a horizontal spacing of 100 mm.
The model boundary conditions are displacement constraints on the left, bottom, and top edges of the model, free surface on the front of the model, and horizontal displacement constraints on the back of the model. The initial stress state is simulated by the self-gravity of the model seam, and the well mining pressure and slope deformation are simulated by the advancement of the coal seam. Figure 5 shows the arrangement of displacement measurement points and stress tests for similar models.

3.2.5. Experimental Program

According to the actual situation mining conditions, similar material tests were conducted to study the effect of conditions such as continuing mining after the working face of the 4# and 9# coal seams in the open pit was advanced to the corresponding stoping line on the stability of the slope. At the same time, the overlying rock stress (initial incoming pressure, periodic incoming pressure step, etc.) and deformation law were obtained to determine the reasonable stoping line location, collapse angle, and the first appearance of ground deformation results. Finally, according to the results, the deformation and damage process of the slope of the north gangue is analyzed, and the interaction law between the reasonable stoping line of the shaft mine and the open pit is studied. Then, the factors of cutting the slope of the north gangue to reduce the weight and the pressure foot of the inner row are considered, and the influence of measures such as the pressure foot of the inner row on the stability of the north gangue is analyzed. The interaction between the reasonable stoping line and the open pit is investigated, and the impact of measures such as internal pressure footing on the stability of the north end is analyzed, taking into account the factors of slope cutting and weight reduction of the north end.

4. Results and Analysis

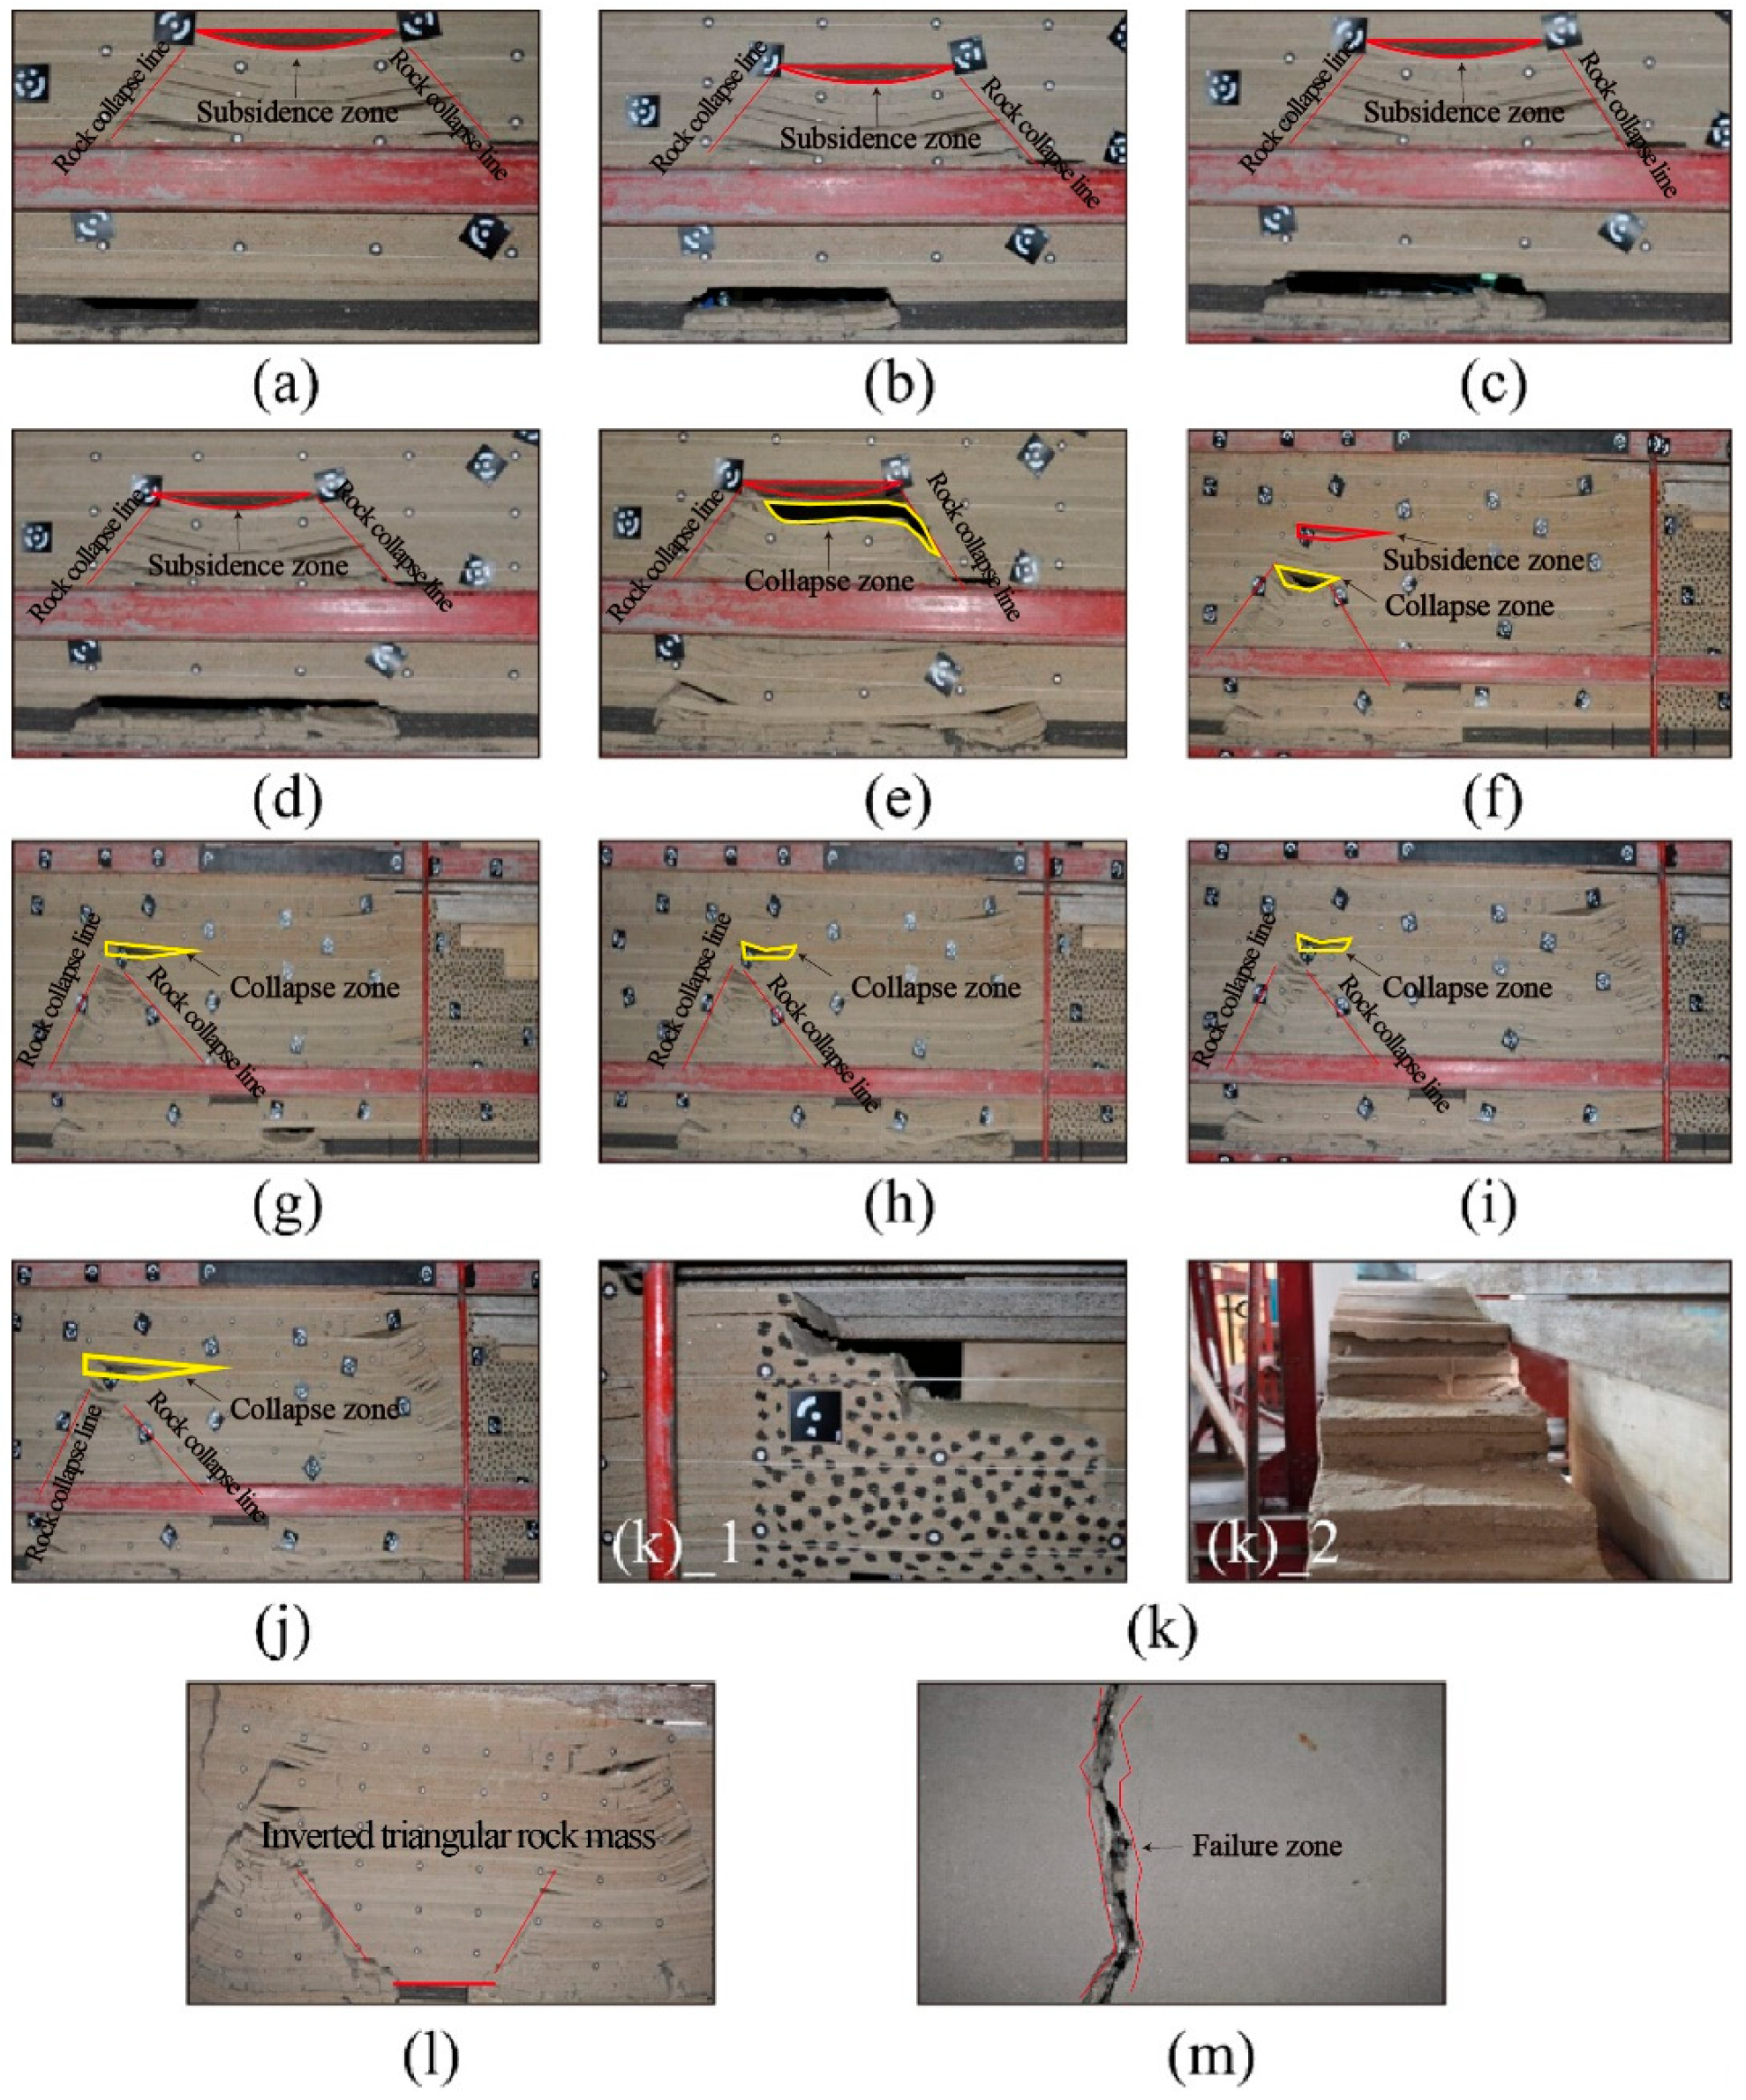
4.1. Analysis of the Formation Mechanism and Rock Movement Pattern of the “Three Zones” in Close Combination of Coal Seam Mining

Figure 6 gives the results of the collapse and deformation of the overlying rock layer during the advance of the 29,210 mining face. The test results show that after 24,207 and 24,208 were mined to the position, the overlying rock layer of coal No. 4 settled and compacted and then acted on the rock body above the 29,210 mining face, and the deformation and settlement of the overlying rock layer on the 29,210 mining face were completed, which had a certain unloading effect on the mining of the 29,210 mining face. When the face of 29,210 was advanced to 734 m from the foot of the slope, the top plate collapsed for the first time, with a collapsed height of 8 m and a rock collapse angle of about 54°. When the face was advanced to 709 and 671.5 m from the foot of the slope, the top plate collapsed periodically. When the face was advanced to 621.5 m from the foot of the slope, the collapse zone of 9# coal was connected with the collapse zone of 4# coal face, and the cycle pressure came strongly, and the collapse range reached 107.5 m. When the mining face advanced to 571.5 m from the foot of the slope, under the influence of the double mining of 4# coal and 9# coal, the overburden deformation and damage developed on the surface, the surface cracked, and the slope of the open pit was displaced. When the mining face advanced to the initial stoping line (i.e., 486.5 m from the foot of the slope), the 9# coal collapse zone was connected with the 4# coal. When the mining face advanced to reasonable stoping line 1 and reasonable stoping line 2, the overburden rock damage and deformation became more and more adequate. By the time the mining face advanced to the final stoping line, the overburden rock within the mining area as a whole slipped towards the side slope, and the steps of the open pit side slope at +1363 m level and above were affected.

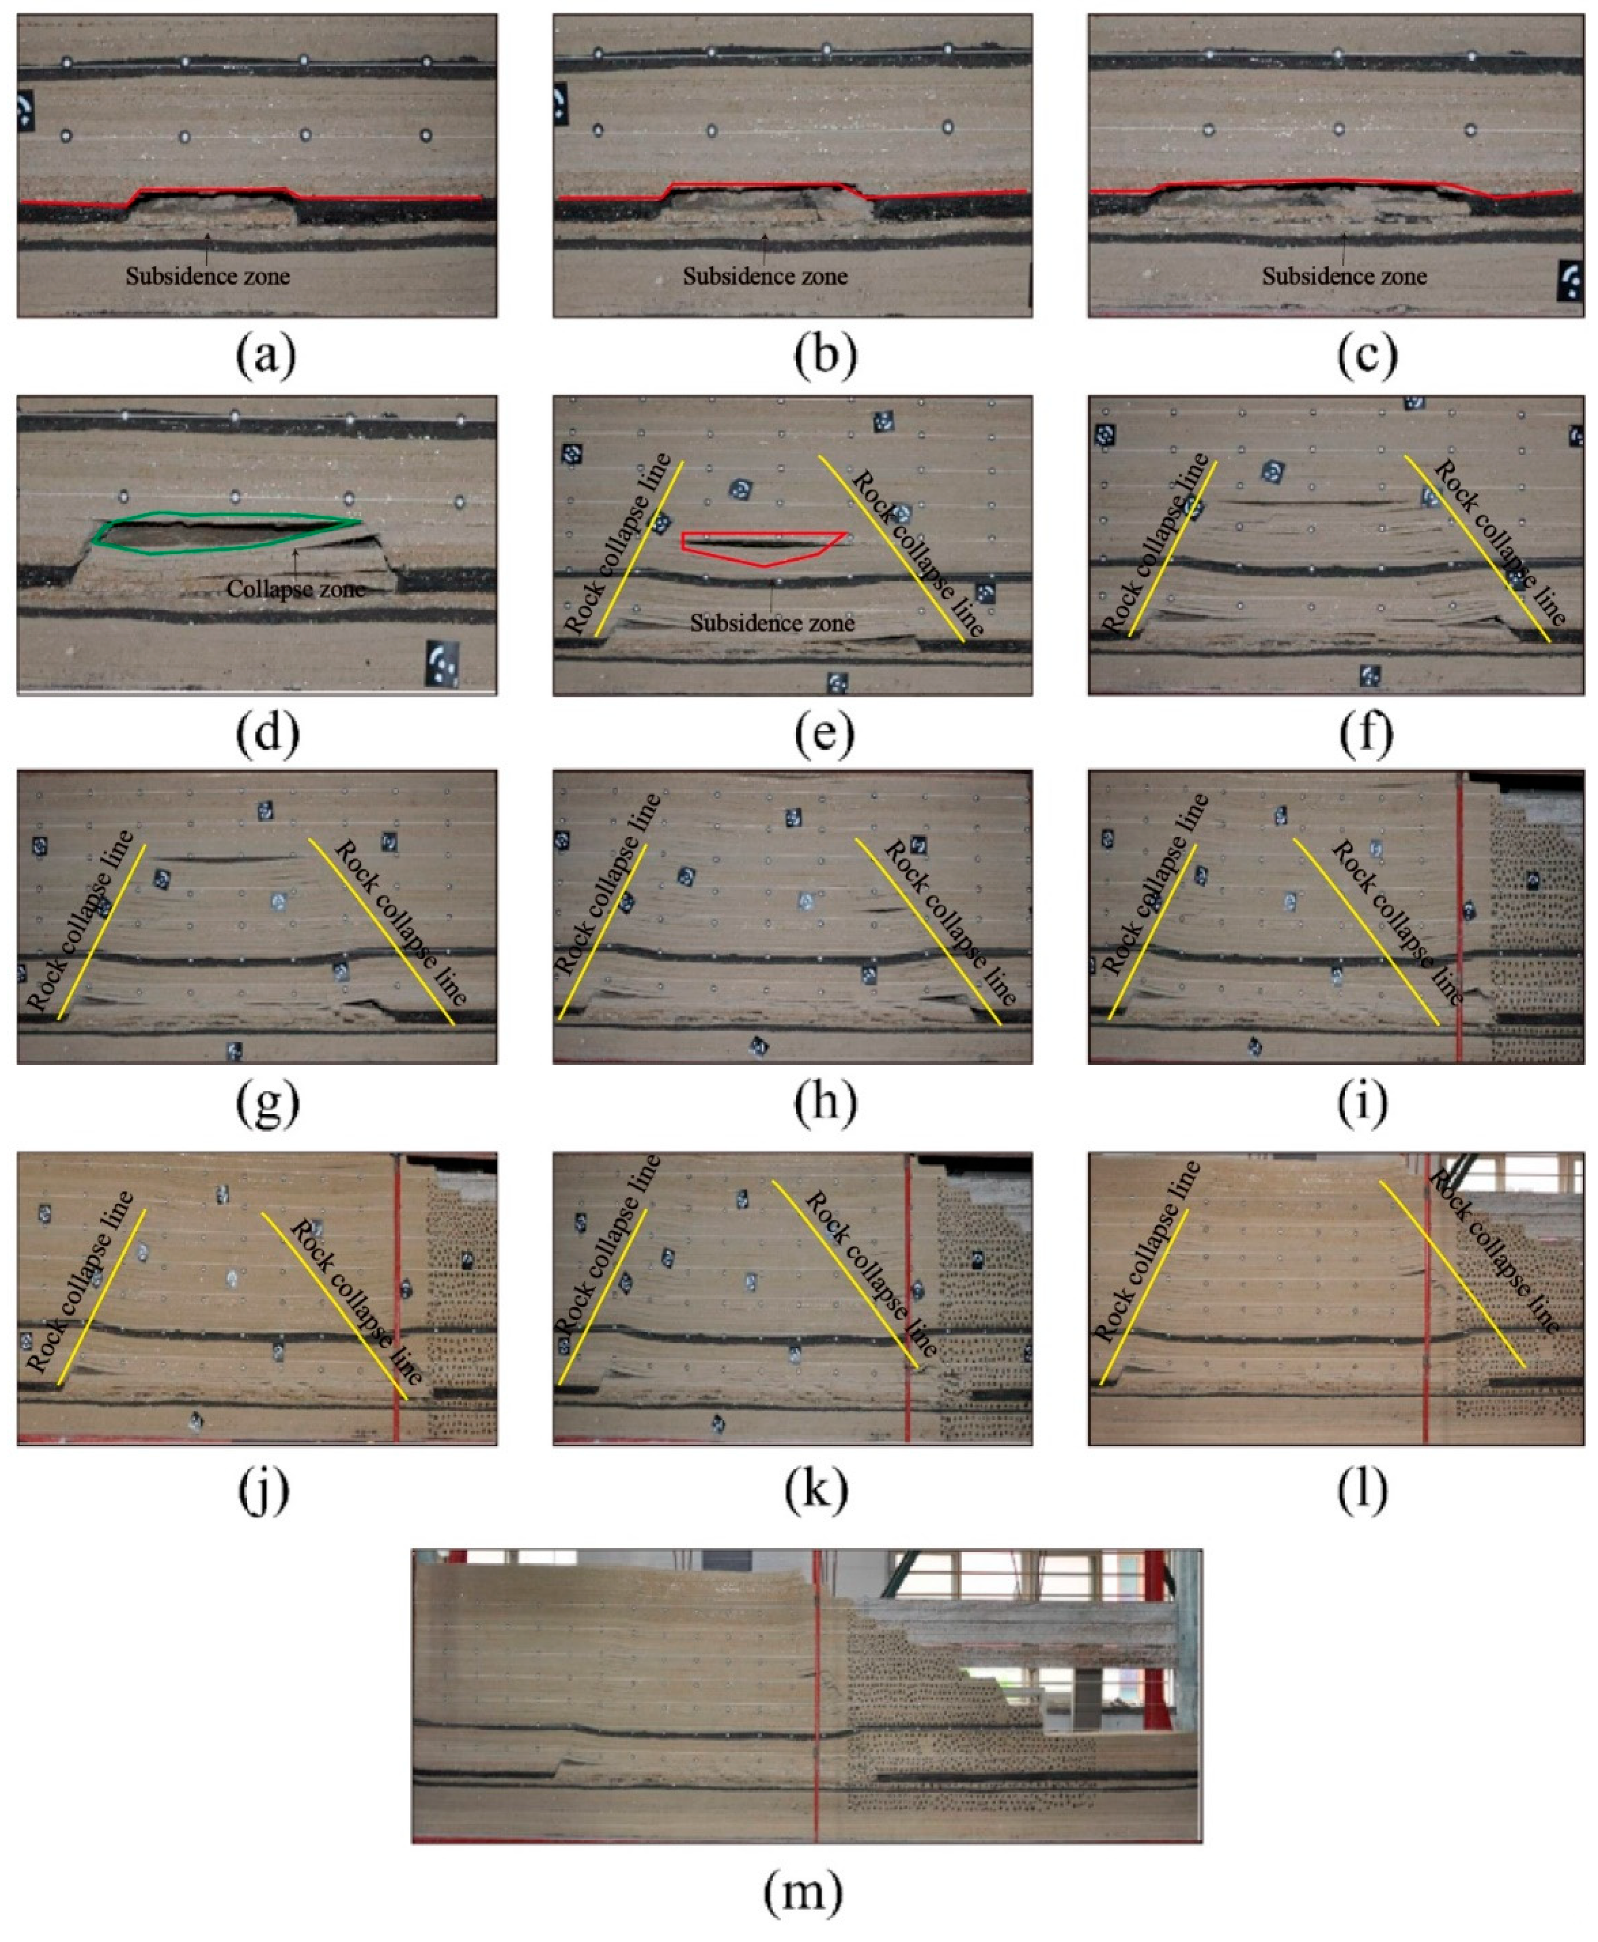
4.2. Analysis of the Formation Mechanism and Rock Movement Pattern of the “Three Zones” in Single-Seam Mining

The results of the collapse and deformation of the overlying rock during the advance of the 29,211 mining face are shown in Figure 7. The 29,211 mining face has similarities with 29,210 in terms of the formation of “three belts” and the rock movement pattern. When 29,211 was advanced to 719 m from the foot of the slope, the basic roof first emerged with a height of 12 m. When the face was advanced to 644 m from the foot of the slope, the overburden damage developed to 75 m from the top of the coal seam, and the overburden was separated from the seam. When the mining face was advanced 594 m from the foot of the slope, the overburden rock fall developed to a height of 92.5 m from the top slab. When the mining face was advanced 544 m from the foot of the slope, the overburden rock damage reached a height of 105 m from the top slab. After the overburden destruction, a trapezoidal distribution is formed in the vertical direction, and the “three zones” of bending and sinking zone, fallout zone, and fracture zone are distributed. At 1 m from the reasonable stoping line, the bending and deformation of the rock layer developed on the surface.

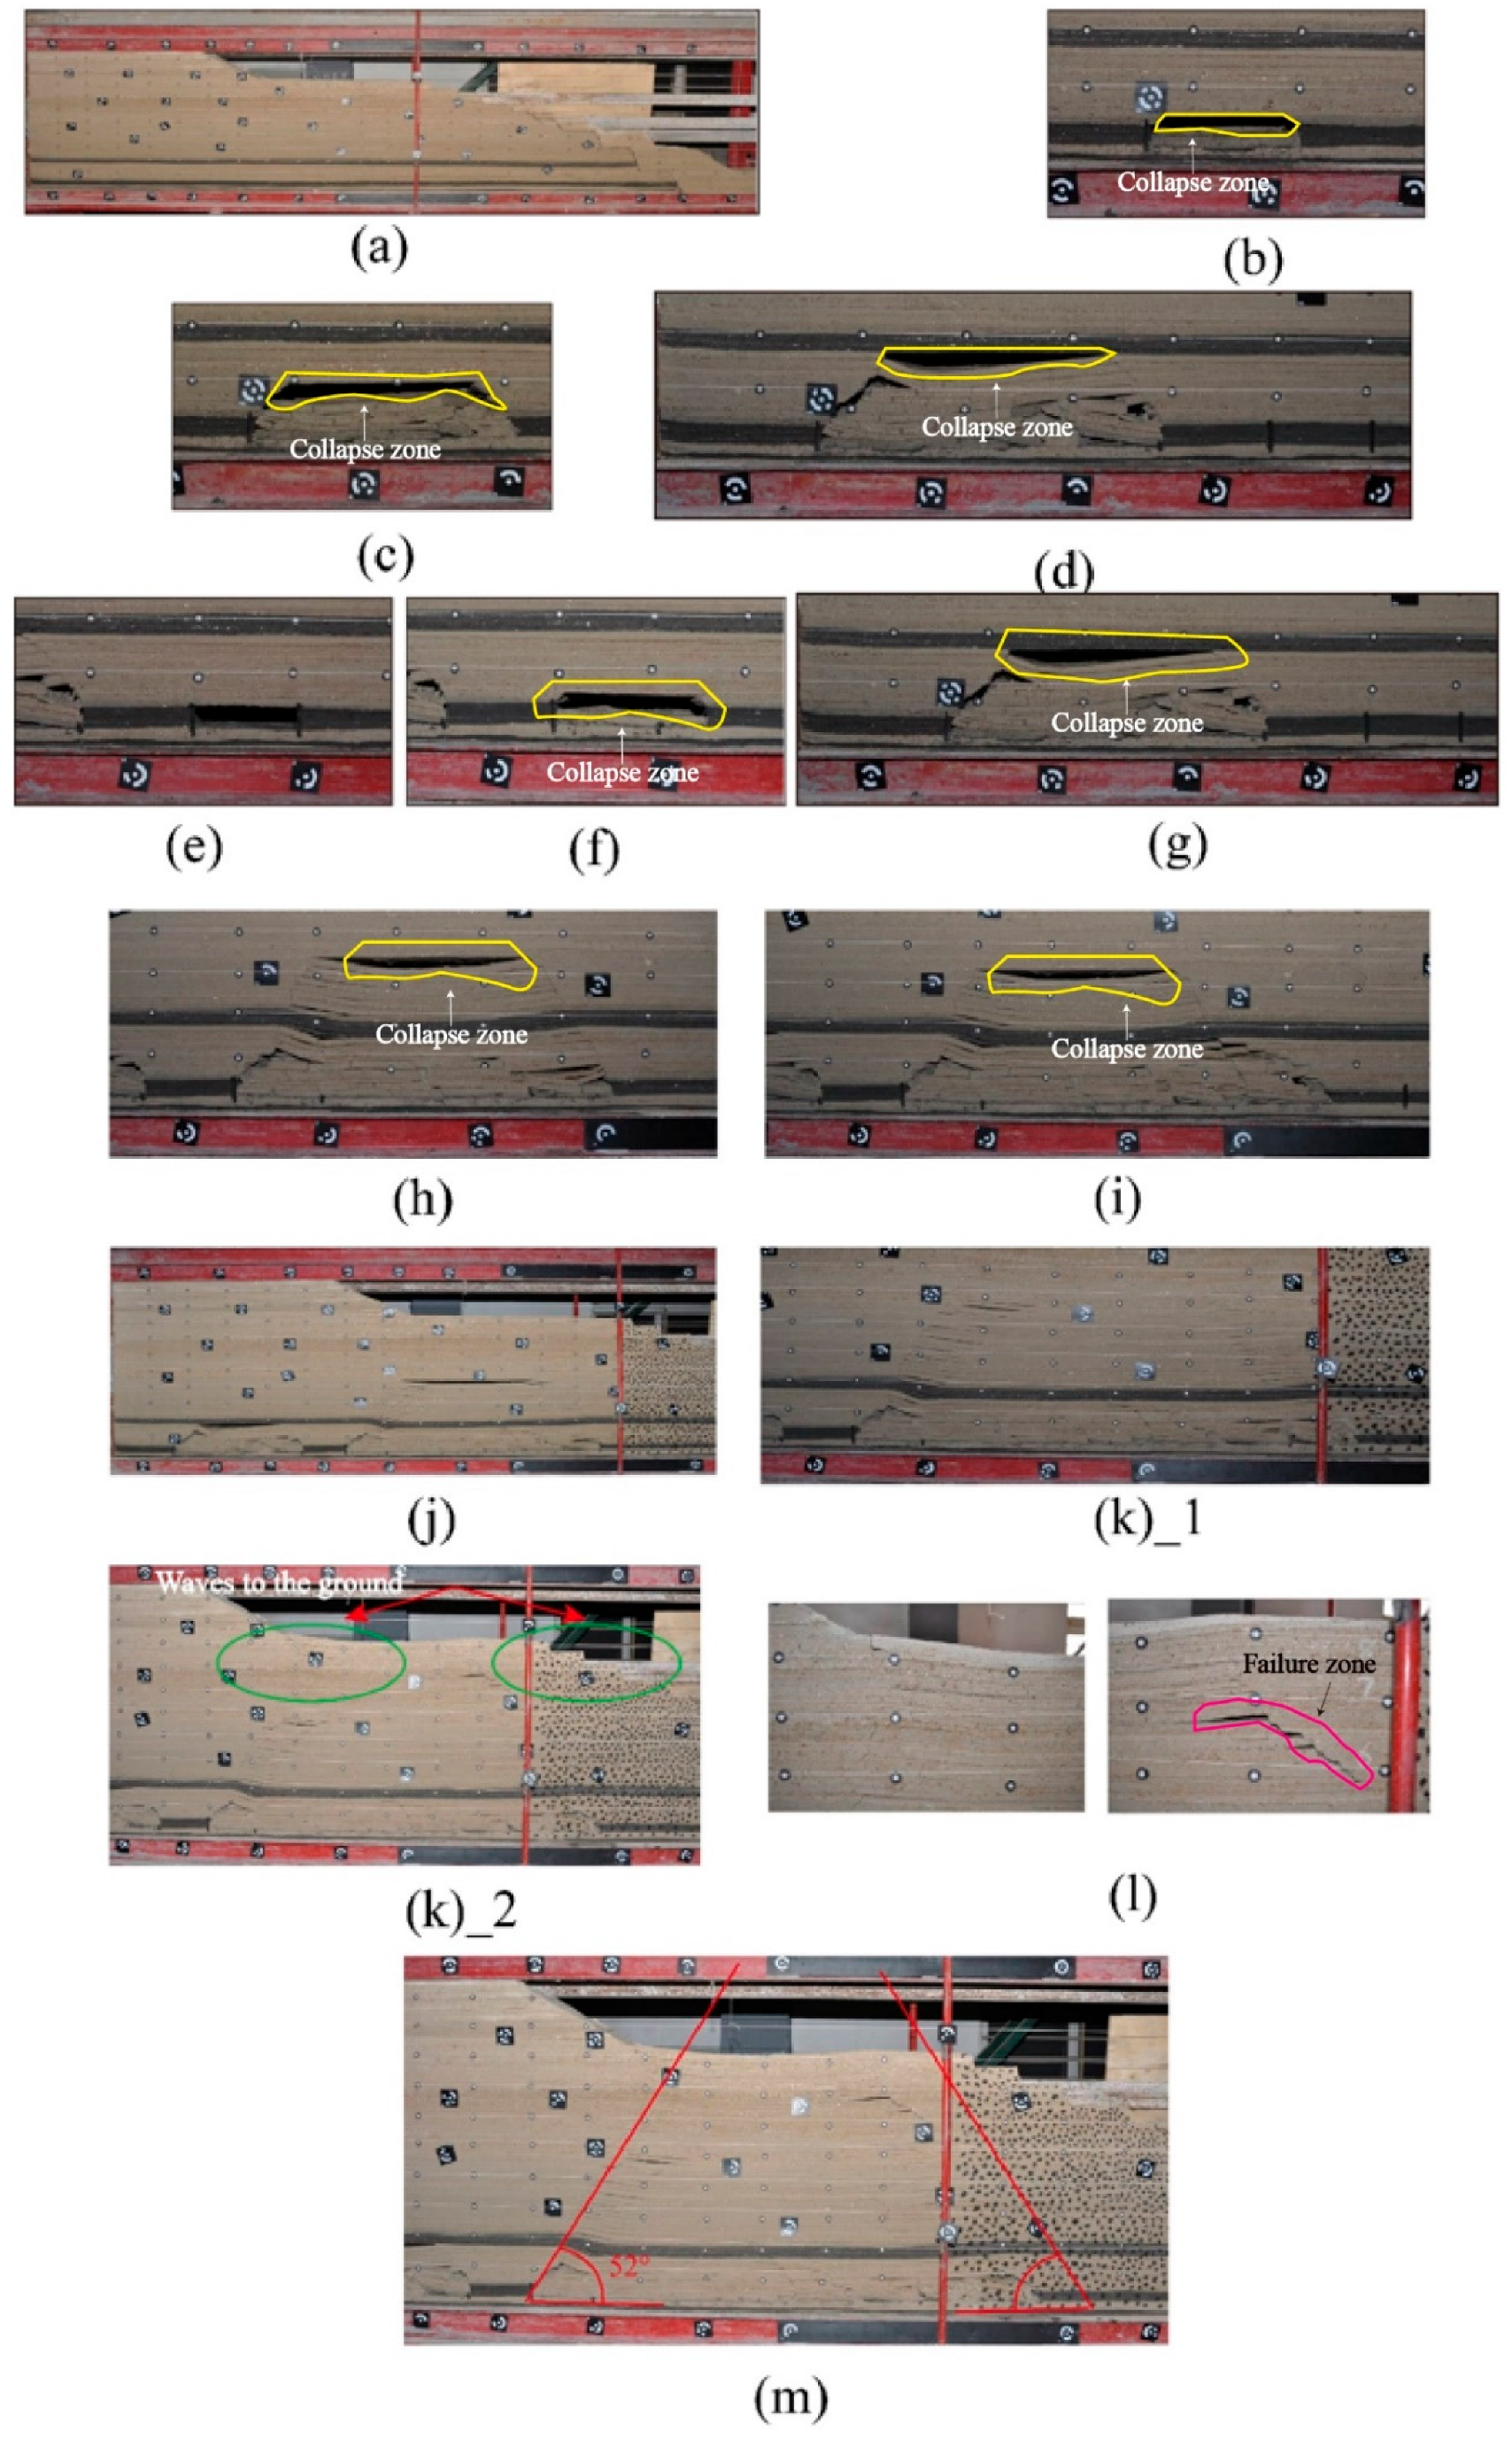
4.3. Analysis of the Formation Mechanism and Rock Movement Pattern of the “Three Zones” in Single-Seam Mining after the Footing of the Slope

The overburden rockfall and deformation on the 29,209 mining face are shown in Figure 8. As the 29,209 mining face advances towards the foot of the slope, the pattern of overburden rockfall is similar to that of the 29,210 and 29,211 mining faces. From the physical model test results, when the mining face is advanced to 707 m from the foot of the slope, the first rise in the direct roof occurs, with a height of 5.5 m and a fallen angle of 52°. Later, the direct roof rises with the mining, with a cycle pressure step of about 22 m. When the mining face is advanced to 656 m from the foot of the slope, the first rise in the basic roof occurs, with a fall height of 13 m. When the mining face is advanced to 227.5 m from the foot of the slope, the overlying rock layer of the coal seam falls. When the mining face was advanced to the foot of the slope, the coal seam overlying rock layer fell to a height of 80 m, and the overlying rock layer was separated from the seam. When the mining face was advanced to 555 m from the foot of the slope, the coal seam overlying rock layer fell to a height of 95 m. When the mining face was advanced to 454 m from the foot of the slope, the coal seam overlying rock layer fell to a height of 100 m, and when the mining face was advanced to 404 m from the foot of the slope, the ground surface was sunken and deformed. When advancing to the initial stoping line, the slope tends to slide, and a pressure square reinforcement plan should be adopted to ensure that mining reaches the stoping line without landslides.
The results show that during a similar simulation of the 29,209 mining face, the initial and periodic pressure on the overlying coal seam is obvious, as the distribution of the “three zones”, namely, the bubble zone, the fracture zone, and the slow sinking zone in the mining area. In addition, the mining of the mining face will lead to surface deformation and even crack penetration to the surface. The mining line will have an impact on the stability of the slope.

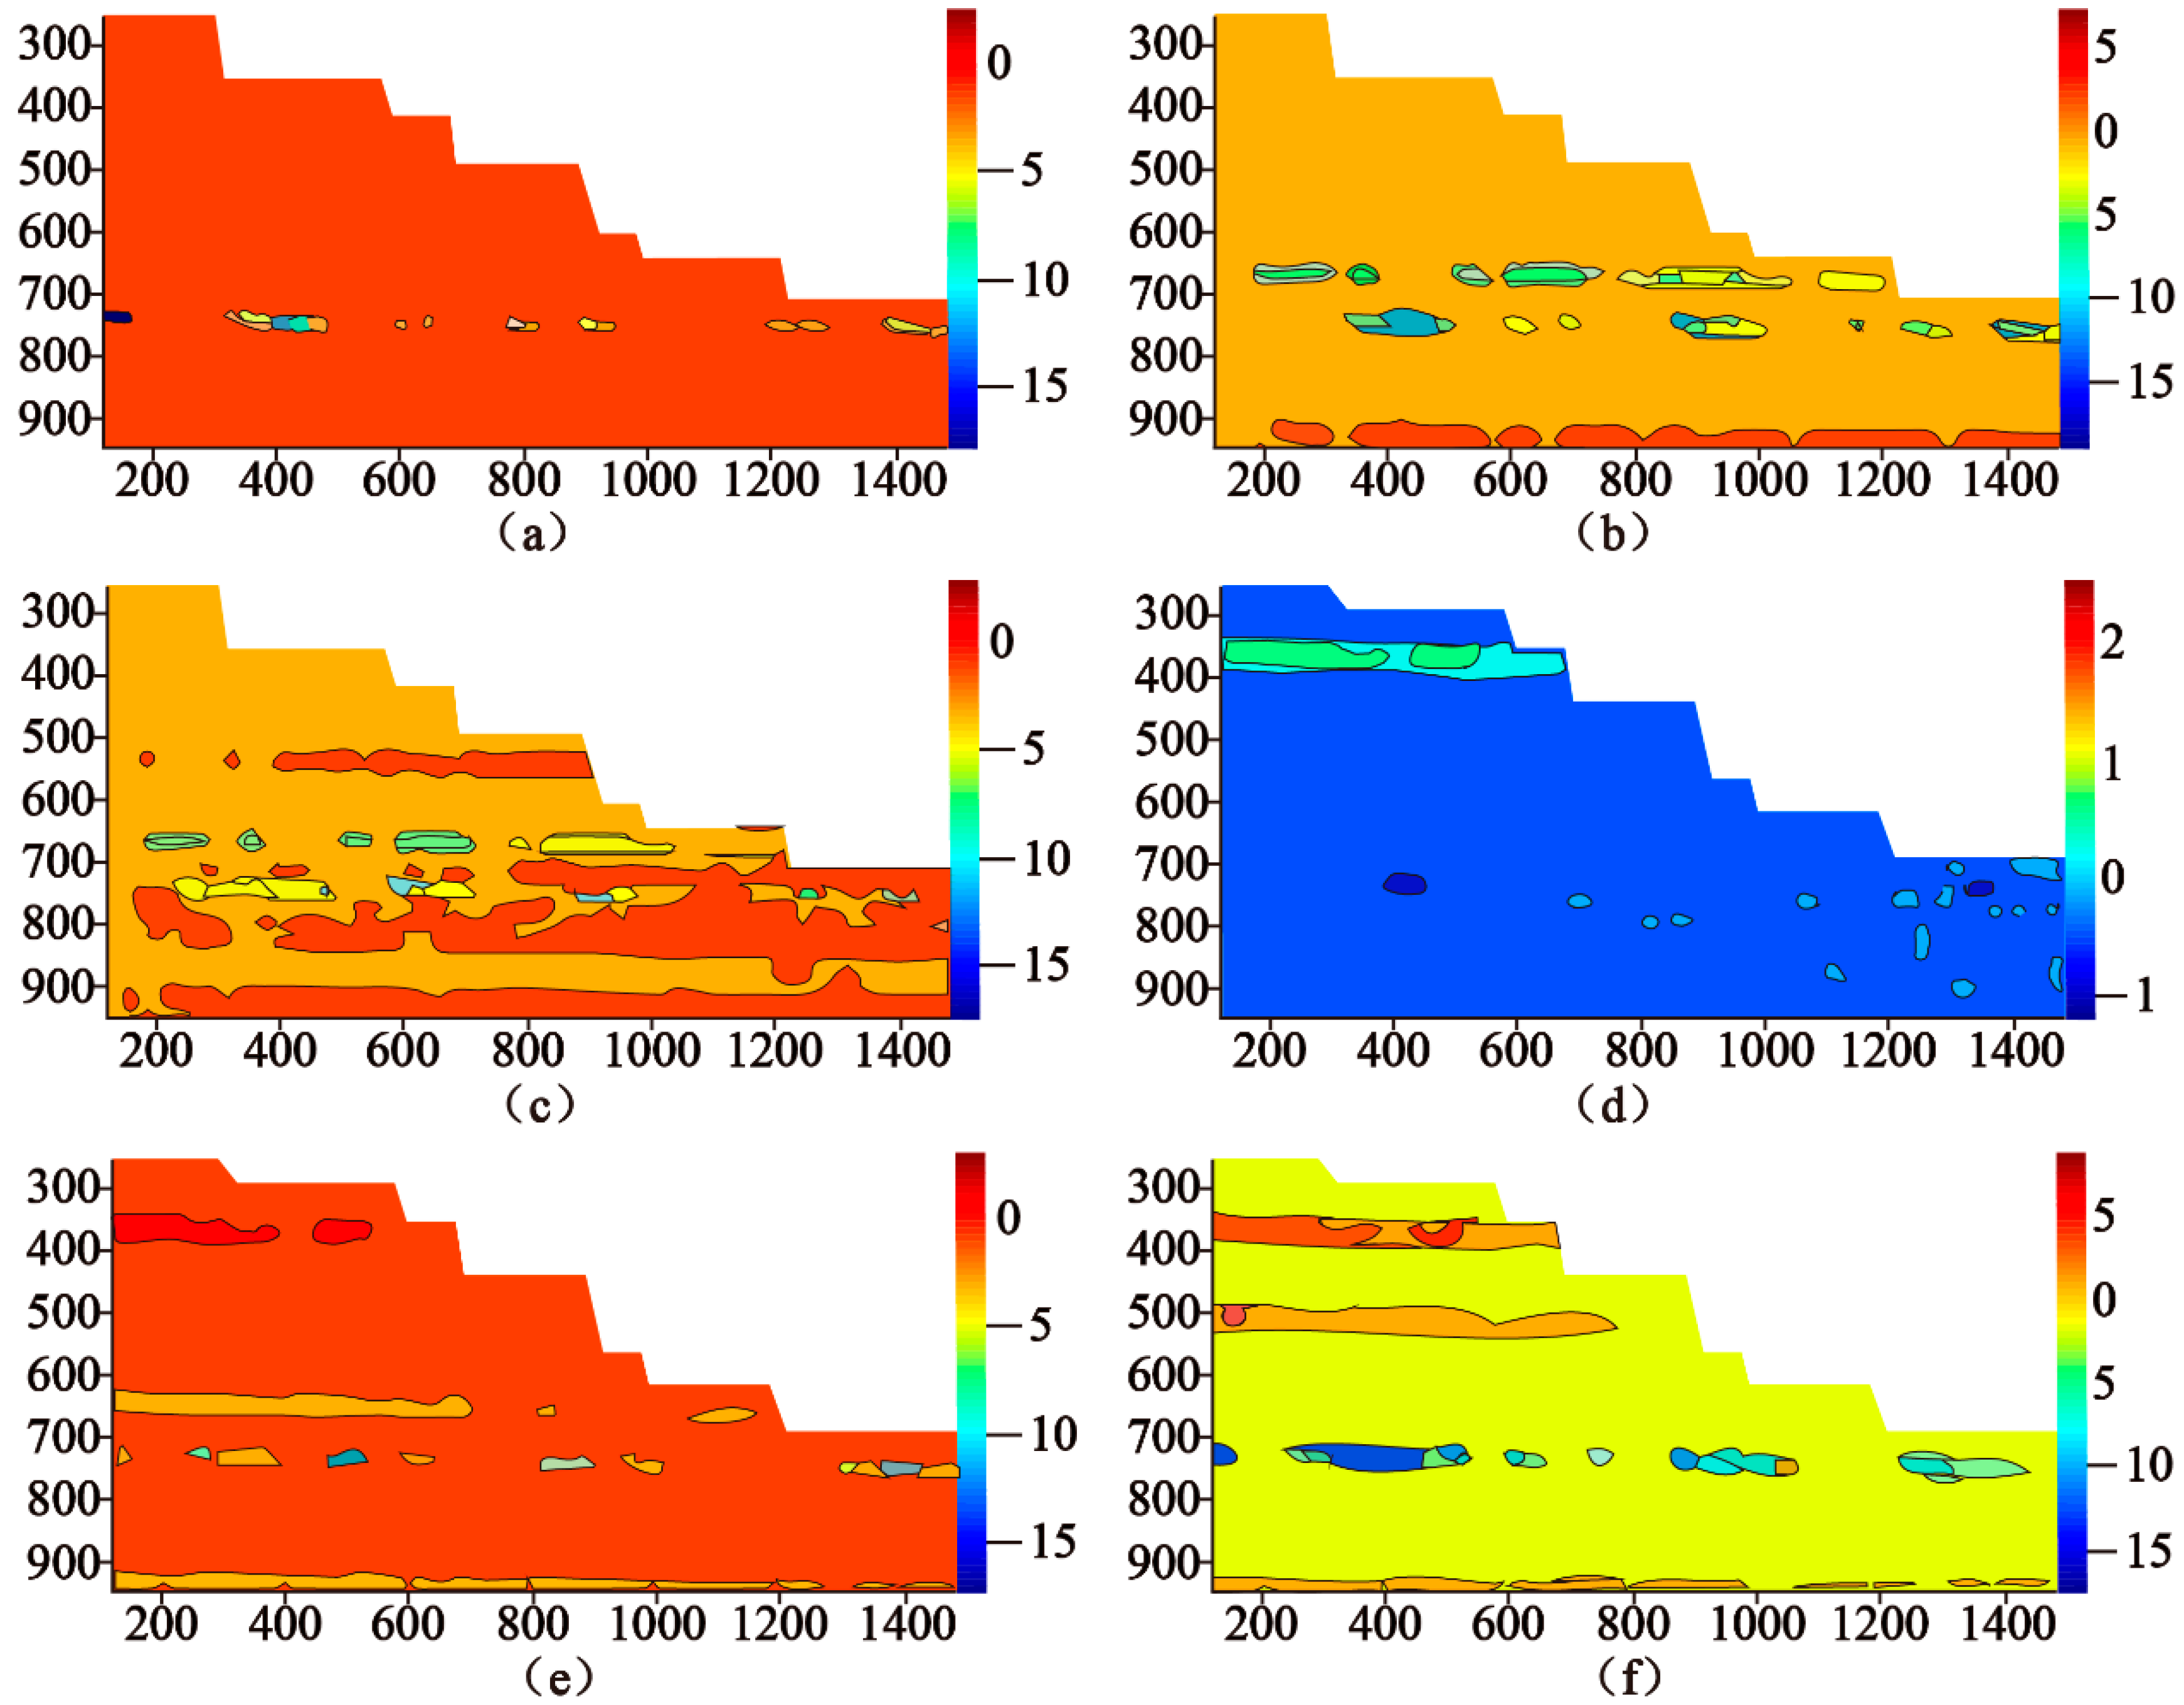
4.4. Analysis of the Evolution of Slope Deformation in the Process of OPUG

The area of monitoring and calculation of the open-pit slope in the similar simulation of open-pit and shaft coordinated mining in profile 1 is shown in Figure 9.
The results of digital scatter photometry of the impact of mining face mining of the 4# coal seam on the slope of the open pit are shown in Figure 10. When the 24,207 mining face was mined, the slope of the open pit was deformed to some extent, the maximum vertical displacement was about 0.5 m, and the corresponding strain value was small. The main reason for this analysis is that the mining face was far away from the slope location, so the deformation and movement of the overlying rock layer caused by the mining of the mining face had less impact on the rock body of the slope. Therefore, the mining of mining face 24,207 will not pose a hazard to the stability of the slope. When the 24,208 mining face advanced to the designed stoping line, the slope of the open pit was locally deformed and cracks appeared, with maximum vertical displacement and strain of approximately 1.0 m and 0.2, respectively, with vertical displacement and vertical strain mainly concentrated in the 1280 flat pan. The local deformation and cracks in the slope of the open pit do not affect the overall stability of the slope but are mainly due to the deformation and subsidence of the overlying rock layer after the mining of the mining face to form an arch structure, which has a large thrust in the direction of the slope face, resulting in some deformation and horizontal displacement of the slope. Figure 11 depicts the calculation area at mining face 29,210 in the 9# coal seam.
In the model test, when the mining face advances to near the designed stoping line, the fractures in the rock body of the slope have penetrated, and at the same time, the fractures have extended to the flat plate of the lower slope. If mining continues, the fractures in the rock body are bound to penetrate (see Figure 12). Figure 13 shows the results of digital scattering photometry of the impact of mining the 29,210 mining face on the slope of the open pit. At this time, the maximum vertical displacement value is close to 1.8 m, the strain value increases to about 0.4, and the maximum horizontal displacement is larger in the direction of the proverbial surface. When the mining line continues to advance 60 m to 120 m after the designed stoping line, the maximum vertical displacement and strain value increase significantly. In addition, the horizontal displacement value is large in the direction of the proverbial surface. The crack penetrated to the foot of the slope, the upper slope rock is close to sliding out, and the whole slope may slide.
The monitoring area and calculation area for the open-pit slope in the similar model in the mining process of 29,211 mining face are shown in Figure 14.
Figure 15 shows the results of digital scatter photometry of the impact of mining on the slope of the open pit at 29,211, where the overburden rock layer has fallen and sunk to form an arch-like structure, which has a horizontal thrust effect on the slope, resulting in the horizontal displacement of the slope deformation to the adjoining surface, thus producing a tensile effect on the slope and causing sliding. This will cause the slope to pull apart and deform in the settlement, which will lead to the sliding of the slope. When the mining face advances to the vicinity of the reasonable stoping line, the maximum vertical displacement and strain are about 0.8 m and 0.3, respectively, and the displacement in the horizontal direction is larger towards the critical plane, with local rupture in the rock body of the slope, which has little impact on the stability of the slope at this time. However, when advancing to the vicinity of the designed stoping line, the internal cracks of the rock body of the slope gradually penetrate towards the bottom of the slope, and the maximum vertical displacement and strain are 1.5 m and 0.4, respectively, with the maximum vertical displacement and strain towards the critical plane. The horizontal displacement increased significantly in the direction of the critical plane. If the mining face continued to advance across the designed stoping line, the rock body of the slope would deform and rupture under the joint action of tension and pressure, and the slope would tend to slide out as a whole, which would seriously affect the stability of the rock body of the slope.

5. Discussion

5.1. Analysis of Coupling Effects in the Process of OPUG

The study of the spatial and temporal relationship between open-pit mining and shaft mining is a key issue in open-pit coordinated mining. The purpose of open-pit co-mining is to effectively utilize the complementary roles of open-pit mining and well-working mining while minimizing the coupling effects of both parties. In the process of OPUG, their mutual influence is mainly manifested in three aspects. (1) Shaft mining leads to the weakening of the sloping rock in its influence domain while activating the internal weak structural surface of the slope system, again disturbing the slope system which has been adjusted by the stress state due to the unloading effect of open-pit excavation, easily leading to the occurrence of slope instability disasters. (2) The unloading effect of opencast mining will also have an impact on shaft mining, especially the repeated loading of dynamic loads such as blasting in opencast mines, resulting in damage to the rock body and even loosening of the surrounding rock of the roadway. (3) Due to the overlap of the two influence domains, their mining effects are superimposed, coupled, and amplified, thus leading to disasters.

5.2. Techniques for Slope Stability Control of Open-Pit Mine

5.2.1. Optimizing the Spatial and Temporal Relationship in the Process of OPUG

The spatial and temporal relationship between the mining operations of the Anjialing shaft mining face No. 2 mine and the opencast coal mine are two different coal mining methods in the same spatial and temporal context, and the spatial and temporal relationship between shaft mining face overlaid with the mining effects of opencast mining is a complex systemic issue. In terms of the stability and safety of the slopes of the opencast mine, the most favorable spatio-temporal relationship is for shaft mining to lag behind opencast mining, and then proceed with shaft mining when the inner row of the opencast mine is stable. However, due to succession problems, shaft mining currently overtakes opencast mining, and when shaft mining pushes to the designed stoping line, the inner row of the opencast mine cannot follow in time. This is why it is necessary to dynamically adjust the location of the stoping line and reduce the temporal and spatial parameters, such as the shaft mining intensity.

5.2.2. Optimizing the Mining Plan in the Process of OPUG

In the process of advancing the open pit to the east, the mining plan was adjusted to change from parallel advance to U-shaped mining, while accelerating the rate of internal drainage follow-up to ensure the safety of the open-pit slopes. During the mining process, the slope moves back towards the shaft mining void, and the backfill is used to stop the slope slippage trend. The backfilling process both prevents large tension cracks in the slope platform and increases the slip resistance of the slope, avoiding the possibility of landslides under the influence of well mining disturbances. For underground mining, pressurized footing backfill increases the overburden load on the quarry, which affects the stability of the mining tunnel and quarry envelope.

5.2.3. Monitoring and Early Warning Techniques

This project aims to maximize the recovery of coal resources under the premise of safe production in the surface mine. At the time when the 29,210 and 29,211 back mining faces are mined to the designed stoping line, the surface mine 1360 and above are in the shaft mining subsidence zone. The amount of settlement is less than that of 1405 and above the pan, and with effective slope maintenance, transport vehicles can pass normally. The Anjialing open-pit mine has a more advanced monitoring and surveillance system. During the joint mining process of the open-pit mine and shaft mining and after the shaft mining to the designed stoping line, when the internal row of the Anjialing Road open-pit mine has not been followed up, the slope monitoring work is the key to ensuring safe production. Therefore, the monitoring system is given full play, and the combination of full-coverage monitoring and early warning technology, such as geological radar monitoring and global navigation satellite system (GNSS) monitoring of the slope, is used to achieve prediction and forecasting of landslides on the slopes of the open-pit mines to ensure the safety and stability of the slopes under the influence of coordinated open-pit and shaft mining.

6. Conclusions

(1) The mining of the 24,207 mining face does not affect the stability of the slope. During the advancement of the 24,208 mining face, the distribution of “three belts”, namely, the collapse zone, fracture zone, and slow sinking zone, is obvious in the vertical direction after the overlying rock layer emerges, but it does not pose a threat to the stability of the slope. The 29,209 mining face advanced to the initial stoping line. When the 29,209 mining face reached the initial stoping line, the rock deformation developed on the surface, obvious cracks appeared in the flat pan of the slope, and the slope tended to move in the direction of the airside. At this time, the slope reinforcement measures of internal pressure foot were adopted, so that the mining face continued to advance to the designed stoping line without causing sliding damage to the slope.
(2) As the 29,210 mining face continues to advance, the “three zones” of the overlying rock layer become more and more obvious. The angle of rock collapse is about 54°, the height of collapse is about 22 m, and the cycle pressure step is about 19 m. As the mining face continues to advance 60–120 m, the fracture will soon penetrate to the bottom of the slope, and the upper step may slide out. The 29,210 mining face is suitable to stop mining when it advances to the reasonable stoping line 2 (341 m from the foot of the slope).
(3) As the mining face of 29,211 advanced, the rock collapse angle was about 56°, the height of rock collapse was about 25 m, and the cycle collapse step was about 17 m. When the mining face advanced to 1360 flat, a fracture zone was formed under the slope. The fracture penetrated the whole slope rock body and the slope of the open-pit mine showed “situational landslide” damage. Therefore, the appropriate stoping position for the 29,211 mining face is when the mining face is advanced to the reasonable stoping line 2 (288 m from the foot of the slope).
(4) The digital scatter calculation results show that as the mining face of the mine continues to advance, the over-supporting stress of the mining face shifts to the side of the open-pit slope, and large displacement and stress concentration occur on the side of the slope near the stoping line. The deformation of the open-pit slope body first appears at the lowermost stratification of the slope. As the mining face advances, the overlying rock layer collapse height increases, and the deformation of the open-pit slope body continues to develop towards the upper part of the slope body. When the mining face gradually advances to the designed stoping line, the slope body is “pushed” along the uppermost part of the open-pit slope, and a fracture along the stratification layer appears below it. If the mining face continues to advance, the slope body may be “pushed” along the next level, and large displacements and stress concentrations may occur on the side of the slope near the stoping line.
(5) Full-coverage monitoring and early warning technology that combines the optimization of the spatial and temporal relationship, the mining plan in the process of OPUG, and the use of a combination of slope geological radar monitoring and GNSS monitoring has been adopted to achieve safe and stable control of slopes in the process of OPUG.

Author Contributions

Conceptualization, Z.G.; Data curation, S.S. and H.M.; Investigation, H.M.; Methodology, S.S., Z.G., P.D. and Z.J.; Software, S.S., P.D. and Y.T.; Supervision, Z.G.; Validation, P.D.; Visualization, P.D. and Y.T.; Writing—original draft, S.S. and Z.G.; Writing—review & editing, Y.T., H.M. and Z.J. All authors have read and agreed to the published version of the manuscript.

Funding

This research was funded by the National Natural Science Foundation of China (no. 41902290; no. 41972297), the Natural Science Foundation of Hebei Province (no. d2020202002; no. D2021202002), and the Talents in Hebei Provincial Education Office (no. SLRC2019027).

Institutional Review Board Statement

Not applicable.

Informed Consent Statement

Not applicable.

Data Availability Statement

Data are available on request through the corresponding author.

Conflicts of Interest

The authors declare no conflict of interest.

References

  1. Du, H.; Song, D.; Chen, Z.; Shu, H.; Guo, Z. Prediction model oriented for landslide displacement with step-like curve by applying ensemble empirical mode decomposition and the PSO-ELM method. J. Clean. Prod. 2020, 270, 122248. [Google Scholar] [CrossRef]
  2. Emanov, A.A.; Emanov, A.F.; Fateev, A.V.; Leskova, E.V. Simultaneous Impact of Open-Pit and Underground Mining on the Subsurface and Induced Seismicity. Seism. Instrum. 2018, 54, 479–487. [Google Scholar] [CrossRef]
  3. Duan, B.; Xia, H.; Yang, X. Impacts of bench blasting vibration on the stability of the surrounding rock masses of roadways. Tunn. Undergr. Space Technol. 2018, 71, 605–622. [Google Scholar] [CrossRef]
  4. Li, X.; Wang, Y.; Hu, Y.; Zhou, C.; Zhang, H. Numerical Investigation on Stratum and Surface Deformation in Underground Phosphorite Mining Under Different Mining Methods. Front. Earth Sci. 2022, 10, 831856. [Google Scholar] [CrossRef]
  5. Chen, T.; Mitri, H.S. Strategies for surface crown pillar design using numerical modelling—A case study. Int. J. Rock Mech. Min. Sci. 2021, 138, 104599. [Google Scholar] [CrossRef]
  6. Prostov, S.; Shabanov, E.; Sokolov, M.; Shabdanov, M. Improving earthquake resistance of structures by injection consolidation of earth foundations. In Proceedings of the 5th International Innovative Mining Symposium (IISM), Kemerovo, Russia, 19–21 October 2020. [Google Scholar]
  7. Neverov, A.A.; Nikolsky, A.M.; Tsymbalyuk, T.A. Geomechanical justification of geotechnical situation in coal extraction with highwall mining system. IOP Conf. Ser. Earth Environ. Sci. 2020, 523, 012005. [Google Scholar] [CrossRef]
  8. Konurin, A.I.; Shchukin, S.A.; Neverov, S.A. Extraction of ore reserves from undermined protective pillar under open pit bottom. IOP Conf. Ser. Earth Environ. Sci. 2020, 523, 012007. [Google Scholar] [CrossRef]
  9. Kalenchuk, K.; Falmagne, V.; Gelover, A.; Montiel, I.; Luzania, J. Risk Evaluation, Design, Implementation, Instrumentation, and Verification for Crown Pillar Extraction at Pinos Altos Mine. Rock Mech. Rock Eng. 2019, 52, 4997–5011. [Google Scholar] [CrossRef]
  10. MacNeil, J.A.L.; Dimitrakopoulos, R.G. A stochastic optimization formulation for the transition from open pit to underground mining. Optim. Eng. 2017, 18, 793–813. [Google Scholar] [CrossRef]
  11. King, B.; Goycoolea, M.; Newman, A. Optimizing the open pit-to-underground mining transition. Eur. J. Oper. Res. 2017, 257, 297–309. [Google Scholar] [CrossRef]
  12. Zhang, J.; Wang, Z.; Song, Z. Numerical study on movement of dynamic strata in combined open-pit and underground mining based on similar material simulation experiment. Arab. J. Geosci. 2020, 13, 785. [Google Scholar] [CrossRef]
  13. Varga, S.; Benndorf, J. Geostatistical Simulation for Filling Misclassified Pixels in Hyperspectral Images. AIP Conf. Proc. 2020, 2209, 040001. [Google Scholar]
  14. Kuznetsova, L.V.; Anfyorov, B.A. Combined geotechnology potentials in the process of coal deposits integrated development. IOP Conf. Ser. Earth Environ. Sci. 2019, 377, 012003. [Google Scholar] [CrossRef]
  15. Ajamzadeh, M.; Sarfarazi, V.; Dehghani, H. Evaluation of plow system performance in long-wall mining method using particle flow code. Int. J. Coal Sci. Technol. 2019, 6, 518–535. [Google Scholar] [CrossRef] [Green Version]
  16. Porathur, J.L.; Jose, M.; Bhattacharjee, R.; Tewari, S. Numerical modeling approach for design of water-retaining dams in underground hard rock minesa case example. Arab. J. Geosci. 2018, 11, 750. [Google Scholar] [CrossRef]
  17. Stead, D.; Wolter, A. A critical review of rock slope failure mechanisms: The importance of structural geology. J. Struct. Geol. 2015, 74, 1–23. [Google Scholar] [CrossRef]
  18. Stead, D.; Eberhardt, E.; Coggan, J.S. Developments in the characterization of complex rock slope deformation and failure using numerical modelling techniques. Eng. Geol. 2006, 83, 217–235. [Google Scholar] [CrossRef]
  19. Scholtès, L.; Donzé, F.-V. Modelling progressive failure in fractured rock masses using a 3D discrete element method. Int. J. Rock Mech. Min. Sci. 2012, 52, 18–30. [Google Scholar] [CrossRef]
  20. Jiayi, S.; Murat, K. Three-dimensional numerical analysis for rock slope stability using shear strength reduction method. Can. Geotech. J. 2014, 51, 164–172. [Google Scholar] [CrossRef]
  21. Amini, M.; Majdi, A.; Veshadi, M.A. Stability Analysis of Rock Slopes Against Block-Flexure Toppling Failure. Rock Mech. Rock Eng. 2012, 45, 519–532. [Google Scholar] [CrossRef]
  22. Johari, A.; Lari, A.M. System probabilistic model of rock slope stability considering correlated failure modes. Comput. Geotech. 2017, 81, 26–38. [Google Scholar] [CrossRef]
  23. Zhou, C.; Lu, S.; Jiang, N.; Zhang, D.; Zhang, Z.; Miao, G. Rock Mass Deformation Characteristics in High-Steep Slopes Influenced by Open-Pit to Underground Mining. Geotech. Geol. Eng. 2016, 34, 847–866. [Google Scholar] [CrossRef]
  24. Luo, Y.-Z.; Wu, A.-X.; Liu, X.-P.; Wang, H.-J. Stability and reliability of pit slopes in surface mining combined with underground mining in Tonglushan mine. J. Cent. South Univ. Technol. 2004, 11, 434–439. [Google Scholar] [CrossRef]
  25. Dagdelen, K.; Traore, I. Open pit transition depth determination through global analysis of open pit and underground mine production scheduling. In Advances in Applied Strategic Mine Planning; Springer: Berlin/Heidelberg, Germany, 2018; pp. 287–296. [Google Scholar]
  26. Gischig, V.; Amann, F.; Moore, J.R.; Loew, S.; Eisenbeiss, H.; Stempfhuber, W. Composite rock slope kinematics at the current Randa instability, Switzerland, based on remote sensing and numerical modeling. Eng. Geol. 2011, 118, 37–53. [Google Scholar] [CrossRef]
  27. Li, H.-J.; Zhong, H.-Y.; Li, W.-C. Research on stability of a slope due to underground mining. J. Coal Sci. Eng. 2013, 19, 474–482. [Google Scholar] [CrossRef]
  28. Jiang, N.; Zhou, C.; Lu, S.; Zhang, Z. Effect of Underground Mine Blast Vibrations on Overlaying Open Pit Slopes: A Case Study for Daye Iron Mine in China. Geotech. Geol. Eng. 2018, 36, 1475–1489. [Google Scholar] [CrossRef]
  29. Cao, W.; Sheng, Y.; Wu, J.; Li, J.; Chou, Y.; Li, J. Simulation analysis of the impacts of underground mining on permafrost in an opencast coal mine in the northern Qinghai–Tibet Plateau. Environ. Earth Sci. 2017, 76, 711. [Google Scholar] [CrossRef]
  30. Wang, X.-F.; Zhang, D.-S.; Zhang, C.-G.; Fan, G.-W. Mechanism of mining-induced slope movement for gullies overlaying shallow coal seams. J. Mt. Sci. 2013, 10, 388–397. [Google Scholar] [CrossRef]
  31. Li, B.; Feng, Z.; Wang, G.; Wang, W. Processes and behaviors of block topple avalanches resulting from carbonate slope failures due to underground mining. Environ. Earth Sci. 2016, 75, 694. [Google Scholar] [CrossRef]
  32. Kovrizhnykh, A.M. Deformation and failure of open and underground mine structures under creep. J. Min. Sci. 2009, 45, 541–550. [Google Scholar] [CrossRef]
  33. Du, H.; Song, D.; Chen, Z.; Guo, Z. Experimental study of the influence of structural planes on the mechanical properties of sandstone specimens under cyclic dynamic disturbance. Energy Sci. Eng. 2020, 8, 4043–4063. [Google Scholar] [CrossRef]
  34. Deng, Z.; Liu, X.; Zhou, X.; Yang, Q.; Chen, P.; de la Fuente, A.; Ren, L.; Du, L.; Han, Y.; Xiong, F.; et al. Main engineering problems and countermeasures in ultra-long-distance rock pipe jacking project: Water pipeline case study in Chongqing. Tunn. Undergr. Space Technol. 2022, 123, 104420. [Google Scholar] [CrossRef]
  35. Deng, Z.; Liang, N.; Liu, X.; de la Fuente, A.; Lin, P.; Peng, H. Analysis and application of friction calculation model for long-distance rock pipe jacking engineering. Tunn. Undergr. Space Technol. 2021, 115, 104063. [Google Scholar] [CrossRef]
  36. Deng, Z.; Liu, X.; Zhou, X.; de la Fuente, A.; Han, Y.; Xiong, F.; Peng, H. Field monitoring of mechanical parameters of deep-buried jacketed-pipes in rock: Guanjingkou Water Control Project. Tunn. Undergr. Space Technol. 2022, 125, 104531. [Google Scholar] [CrossRef]
Figure 1. Location of the study area.
Sustainability 14 08939 g001
Figure 2. Relationship between the spatial location of: (a) the north gangue of the Anjialing mine and the 9# coal of the well-working coal mining II mine and section layout; (b) showing typical geological longitudinal section of 4 coal seams, 9 coal seams, 24,207 working surface, 24,208 working surface, and 29,210 working surface.
Sustainability 14 08939 g002
Figure 3. Main test equipment: (a) straight shear; (b) rock shear test; (c) triaxial shear tester.
Sustainability 14 08939 g003
Figure 4. Test equipment: (a) BW-5 pressure box; (b) YJZ-32A digital strain gauge; (c) 3D optical photogrammetry systems; (d) digital scatter photometric systems.
Sustainability 14 08939 g004
Figure 5. (a) Displacement measurement points. (b) Stress test arrangement and light measurement layouts.
Sustainability 14 08939 g005
Figure 6. Results of overburden collapse and deformation during the advance of the 29,210 mining face: (a) 759 m from the foot of the slope; (b) 734 m from the foot of the slope; (c) 709 m from the foot of the slope; (d) 671.5 m from the toe of the slope; (e) 621.5 m from the foot of the slope; (f) 571.5 m from the foot of the slope; (g) 459.5 m (initial stoping line) from the foot of the slope; (h) 419 m from the foot of the slope (reasonable stoping line 1); (i) 364 m from the foot of the slope (reasonable stoping line 2); (j) 334 m from the foot of the slope; (k) horizontal shearing out of side slope flat pan, (k)_1: on the perspective of right direction. (k)_2: on the perspective of main view direction.; (l) full view after mining; (m) through surface fractures.
Sustainability 14 08939 g006
Figure 7. Results of overburden collapse and deformation on mining face 29,211: (a) 795 m from the foot of the slope; (b) 771 m from the foot of the slope; (c) 743 m from the foot of the slope; (d) 719 m from the foot of the slope; (e) 644 m from the foot of the slope; (f) 594 m from the foot of the slope; (g) 544 m from the foot of the slope; (h) 471.5 m from the foot of the slope (reasonable stoping line 1); (i) 391.5 m from the foot of the slope (initial stoping line); (j) 380.5 m from the foot of the slope (reasonable stoping line 2); (k) 355.5 m from the foot of the slope (designed stoping line); (l) 352.5 m from the foot of the slope (reasonable stoping line 3); (m) simulated end state.
Sustainability 14 08939 g007
Figure 8. Monitoring area and calculation area: (a) overall model; (b) mining face 29,208 is 932 m from the foot of the slope (initial fall); (c) mining face 29,208 is 872 m from the foot of the slope; (d) collapse pattern of 29,208 mining face at 839.5 m from the foot of the slope (29,208 mining face retrieved); (e) 29,209 mining face 730.5 m from the foot of the slope; (f) 29,209 mining face 707 m from the foot of the slope initial collapse; (g) collapse pattern at mining face 29,209 at 606 m from the foot of the slope; (h) collapse pattern of mining face 29,209 at 555.5 m from the foot of the slope; (i) collapse pattern of mining face 29,209 at 505.5 m from the foot of the slope; (j) current stoping line (mining face 454 m from the foot of the slope); (k) 29,209 mining face 404 m from the toe of slope (wave to ground surface), (k)_1: not involves the ground surface. (k)_2: involves the ground surface.; (l) designed stoping line (mining face 355 m from the foot of the slope); (m) simulated end state.
Sustainability 14 08939 g008
Figure 9. Monitoring area and calculation area: (a) monitoring area; (b) 24,207, 24,208 mining face calculation area.
Sustainability 14 08939 g009
Figure 10. Digital scatter calculations for the impact of 4# coal seam working on the slope of the open pit: (a) 24,207 mining face is 742 m from the foot of the slope; (b) 24,207 mining face is 667 m from the foot of the slope; (c) 24,208 mining face is 227 m from the foot of the slope; (d) 24,208 mining face is 177 m from the foot of the slope; (e) 24,208 mining face is 125 m from the foot of the slope; (f) 24,208 mining face is 100 m from the foot of the slope.
Sustainability 14 08939 g010
Figure 11. Calculation area at mining face 29,210 in 9# coal seam: (a) 29,210 mining face from the foot of the slope is 571 m before the calculation area; (b) 29,210 mining face from the foot of the slope is 571 m after the calculation area.
Sustainability 14 08939 g011
Figure 12. Crack penetration zone.
Sustainability 14 08939 g012
Figure 13. Numerical scatter calculations for the impact of mining of 29,210 mining face for the open-pit slopes: (a) 709 m from the foot of the slope; (b) 621 m from the foot of the slope; (c) 571 m from the foot of the slope; (d) 521 m from the foot of the slope; (e) 486 m from the foot of the slope; (f) 349 m from the foot of the slope.
Sustainability 14 08939 g013
Figure 14. Calculated area before mining face 29,211 is 606 m from the toe of the slope.
Sustainability 14 08939 g014
Figure 15. Numerical scatter calculations for the impact of mining at mining face 29,211 on the slopes of the open pit: (a) 844 m from the foot of the slope; (b) 644 m from the foot of the slope; (c) 356 m from the foot of the slope; (d) 352 m from the foot of the slope.
Sustainability 14 08939 g015
Table 1. Physical and mechanical properties of soils.
Soil
Sample No.
Physical Properties of SoilShear TestName
Moisture Content (%)Unit Weight GsWet Density ρ (g/cm3)Dry Density ρd (g/cm3)Saturation Sr (%)Pore Ratio eCohesionC (kPa)Friction Angle Φ (°)
ZJ17.92.701.731.5443.60.75030.5519.4Silt
ZJ413.32.701.841.5273.10.77634.9537.0Silt
ZJ58.22.722.141.8198.30.50134.1523.3Silt
ZJ68.92.702.121.8291.50.48135.929.9Silt
ZJ822.12.711.781.5554.60.75418.0124.1Silty clay
ZJ1013.42.721.921.5389.20.77829.330.4Silt
ZJ1112.92.702.051.7879.30.51733.218.7Silt
ZJ1221.02.722.031.6793.40.62927.3516.0Silty clay
ZJ1525.72.722.031.6288.10.54328.4819.4Silty clay
ZJ1722.12.712.041.6990.10.54815.621.9Silty clay
ZJ1825.52.722.031.6892.40.68115.8522.2Silty clay
ZJ2021.62.721.991.7090.30.87248.4525.7Silty clay
Table 2. Physical and mechanical properties of weathered bedrock specimens.
No.Density (g/cm3)Uniaxial
Compressive
Strength (MPa)
Point Load
Compression
Strength (MPa)
Poisson’s Ratio μ50Saturated
Deformation Modulus
E50 (104 MPa)
Saturated
Deformation Modulus
Name
SaturationSaturationSaturationSaturationC (MPa)Φ (°)
KJ-12.6328.30.790.320.315.8437.9Sandstone
KJ-22.5327.60.80.241.174.8635.1Sandstone
KJ-32.4811.30.30.261.033.7229.9Mudstone
KJ-42.5623.50.690.261.345.5931.9Mudstone
KJ-52.5616.50.660.271.184.1530.4Argillary sandstone
KJ-62.5917.40.540.350.493.0633.4Argillary sandstone
KJ-72.6230.31.040.272.842.1340.8Sandstone
KJ-82.238.50.150.330.295.7931.6Mudstone
KJ-92.56240.730.281.094.7532.4Coal
KJ-102.58240.730.281.094.7532.4Sandstone
Table 3. Table of similar parameters for similar models.
Geometric Similarity
Parameter ( α L /m)
Motion Similar Parameters ( t M /min)Power Similar Parameters ( σ M /MPa)
250300.002 σ H
Table 4. Rock material parameters and similar material ratios.
LithologySand to Rubber RatioGluesCompressive Strength/MPa
LimeGypsumPrototypeModel
Discharge material7:10.60.41.710.0034
Quaternary7:10.60.41.720.0035
Weathered sandstone4:10.40.656.50.113
Sandstone3:10.50.595.10.1902
Clay ore6:10.40.658.30.1166
4# Coal5:10.50.540.90.0818
Sandy mudstone6:10.40.664.10.1282
Fine sandstone4:10.40.699.70.1994
Siltstone4:10.40.6107.30.2146
Gray sandstone4:10.50.554.70.1094
9# Coal5:10.50.538.60.0772
Mudstone4:10.50.554.50.109
11# Coal5:10.50.536.50.073
Medium and fine sandstone3:10.30.799.40.1988
Publisher’s Note: MDPI stays neutral with regard to jurisdictional claims in published maps and institutional affiliations.

