Article

Life Cycle Assessment and Life Cycle Cost of an Innovative Carbon Paper Sensor for 17α-Ethinylestradiol and Comparison with the Classical Chromatographic Method

by
Florinda Martins
1,
Álvaro Torrinha
2,
Cristina Delerue-Matos
2 and
Simone Morais
2,*
1
Instituto Superior de Engenharia do Porto, Instituto Politécnico do Porto, Rua Dr. António Bernardino de Almeida, 431, 4249-015 Porto, Portugal
2
REQUIMTE-LAQV, Instituto Superior de Engenharia do Porto, Instituto Politécnico do Porto, Rua Dr. António Bernardino de Almeida, 431, 4249-015 Porto, Portugal
*
Author to whom correspondence should be addressed.
Sustainability 2022, 14(14), 8896; https://doi.org/10.3390/su14148896
Submission received: 24 June 2022 / Revised: 13 July 2022 / Accepted: 18 July 2022 / Published: 20 July 2022
(This article belongs to the Section Environmental Sustainability and Applications)

Abstract

:
Nowadays there is a growing concern with the environment and sustainability, which means that better methods, including pollutants analysis, with less consumption of materials, organic solvents, and energy, need to be developed. Considering the almost inexistent information about the topic, the main goal of this work was to compare the environmental impacts of two analytical methods, a traditional one based on liquid chromatography with fluorescence detection and a newly developed carbon paper sensor. The selected analyte was 17α-ethinylestradiol, which is a contaminant of emergent concern in aquatic ecosystems due to its endocrine disruptor behavior. The life cycle assessment data showed that the sensor detection presents an almost negligible environmental impact when compared with the extraction step (the same for both methods) and the liquid chromatographic determination (roughly 80 times higher than with the sensor). The sensor values for all categories of damage are below 3% of the total method impacts, i.e., 1.6, 1.9, 2.4, and 2.9% for resources, climate change, human health, and ecosystem quality. The extraction represents 98.1% of the sensor environmental impacts (and 99.6% of its life cycle costing) and 38.8% of the chromatographic method. This study evidences the need of developing and applying greener analytical (detection and extraction) strategies.

1. Introduction

Today there is a growing concern about Sustainable Development due to the depletion of resources, energy supply, pollution, and other global problems such as climate change. In order to tackle these problems, a set of solutions are emerging such as renewable energy and the implementation of a circular economy; however, it is necessary an effort in all domains, from energy production, industry, transport, households, analytical protocols, etc. [1,2].
Another serious threat to the environment is the uncontrolled release of contaminants of emergent concern, affecting mainly aquatic systems and consequently human health. One relevant group of this type of contaminants are pharmaceutical compounds since they are potentially characterized as persistent, bioaccumulative, and toxic [3,4]. Attributed to their increasing consumption and to some inefficiency in their treatment at disposal, this type of compounds is frequently found on water bodies [5], raising the awareness of governmental authorities and the scientific community. Therefore, the development of analytical methodologies, especially capable of fast, highly sensitive, and on-site operation are critical since there are no regulatory measures or control programs for the majority of this type of compounds [6]; moreover, the development of methods that reduce environmental impacts and costs considering the life cycle of product, services or activities are urgently needed. In this context, life cycle thinking is essential [2].
Constant research and innovation on new (nano)materials over the years have been contributing to important advancements in analytical tools with significant improvements in the level of sensitivity and selectivity, as well as miniaturization, portability, and in situ monitoring capacity [7,8,9]. All these interesting aspects are offered by electrochemical sensors, which are potential alternatives to the more traditional analytical techniques, as is the case of chromatographic methods. Although being very reliable and enabling multiplex analysis, chromatographic-based methods have the downside of being restricted physically to the laboratory due to the bulk equipment and necessity of specialized personnel for their operation with significant related costs; moreover, the associated costs and considerable expense of reagents, some with inherent toxicity (e.g., organic solvents used as mobile phase in liquid chromatography), are additional relevant drawbacks. On the contrary, ecologically sustainable strategies can be adopted in electrochemical sensors due to the variability of materials that can be equated in their design, as well as to the aforementioned miniaturization ability, drastically reducing the reagents and sample volumes needed [10,11] combined with their potential in loco real-time sensing applicability. Although not a “new” material, carbon fiber paper (CP) has been lately increasingly used in diverse electroanalytical applications [12]; this is attributed to its unique characteristics, namely, high surface area-to-volume ratio and excellent electro-mechanical properties [12,13], enabling high sensitivities [14,15] and facile integration in miniaturized devices [12]; besides, it is made of carbon, which exploits its availability, reduced cost, and negligible toxicity.
Life cycle assessment (LCA) has been successfully applied to several domains, such as biofuels [16,17,18], dairy processing industry and meat products [19,20], bioplastics use in the food chain and agriculture [21,22], construction materials and green buildings for implementation of ecodesign strategies [23,24,25], waste management operations and water treatment [26,27], among others. It was applied to laboratory-scale processes with success also contributing to more environmentally friendly procedures and practices [28]. Life cycle cost (LCC) is another interesting tool that combines life cycle with economic analysis, being very relevant to the decision-making process; thus, the main objective of the present work was the assessment of the environmental impacts and costs of a new CP-based electrochemical sensor and the traditional liquid chromatographic analytical method for the specific analysis of 17α-ethinylestradiol (widely consumed hormone [29] with endocrine disruption capacity [30] that was included by the European Commission in the first watch list of environmental monitoring of potentially hazardous substances [6] by employing LCA and LCC tools as comparative criteria. There are very limited studies on the application of LCA to electrochemical-based sensors in the literature [31,32]. In this sense, to the best of our knowledge, this is the first study on the assessment of the environmental impacts regarding an analyte detection by an electrochemical sensor and a chromatographic technique; moreover, the application of LCA and LCC tools, specifically to a CP-based sensor is firstly reported here.

2. Materials and Methods

In this section, details are given for the whole procedure regarding the screening of the hormone 17α-ethinylestradiol in fish samples either by the developed sensor based on CP [15] or by liquid chromatography coupled with fluorescence detection [33]. LCA and LCC were employed based on the procedures described in this section.

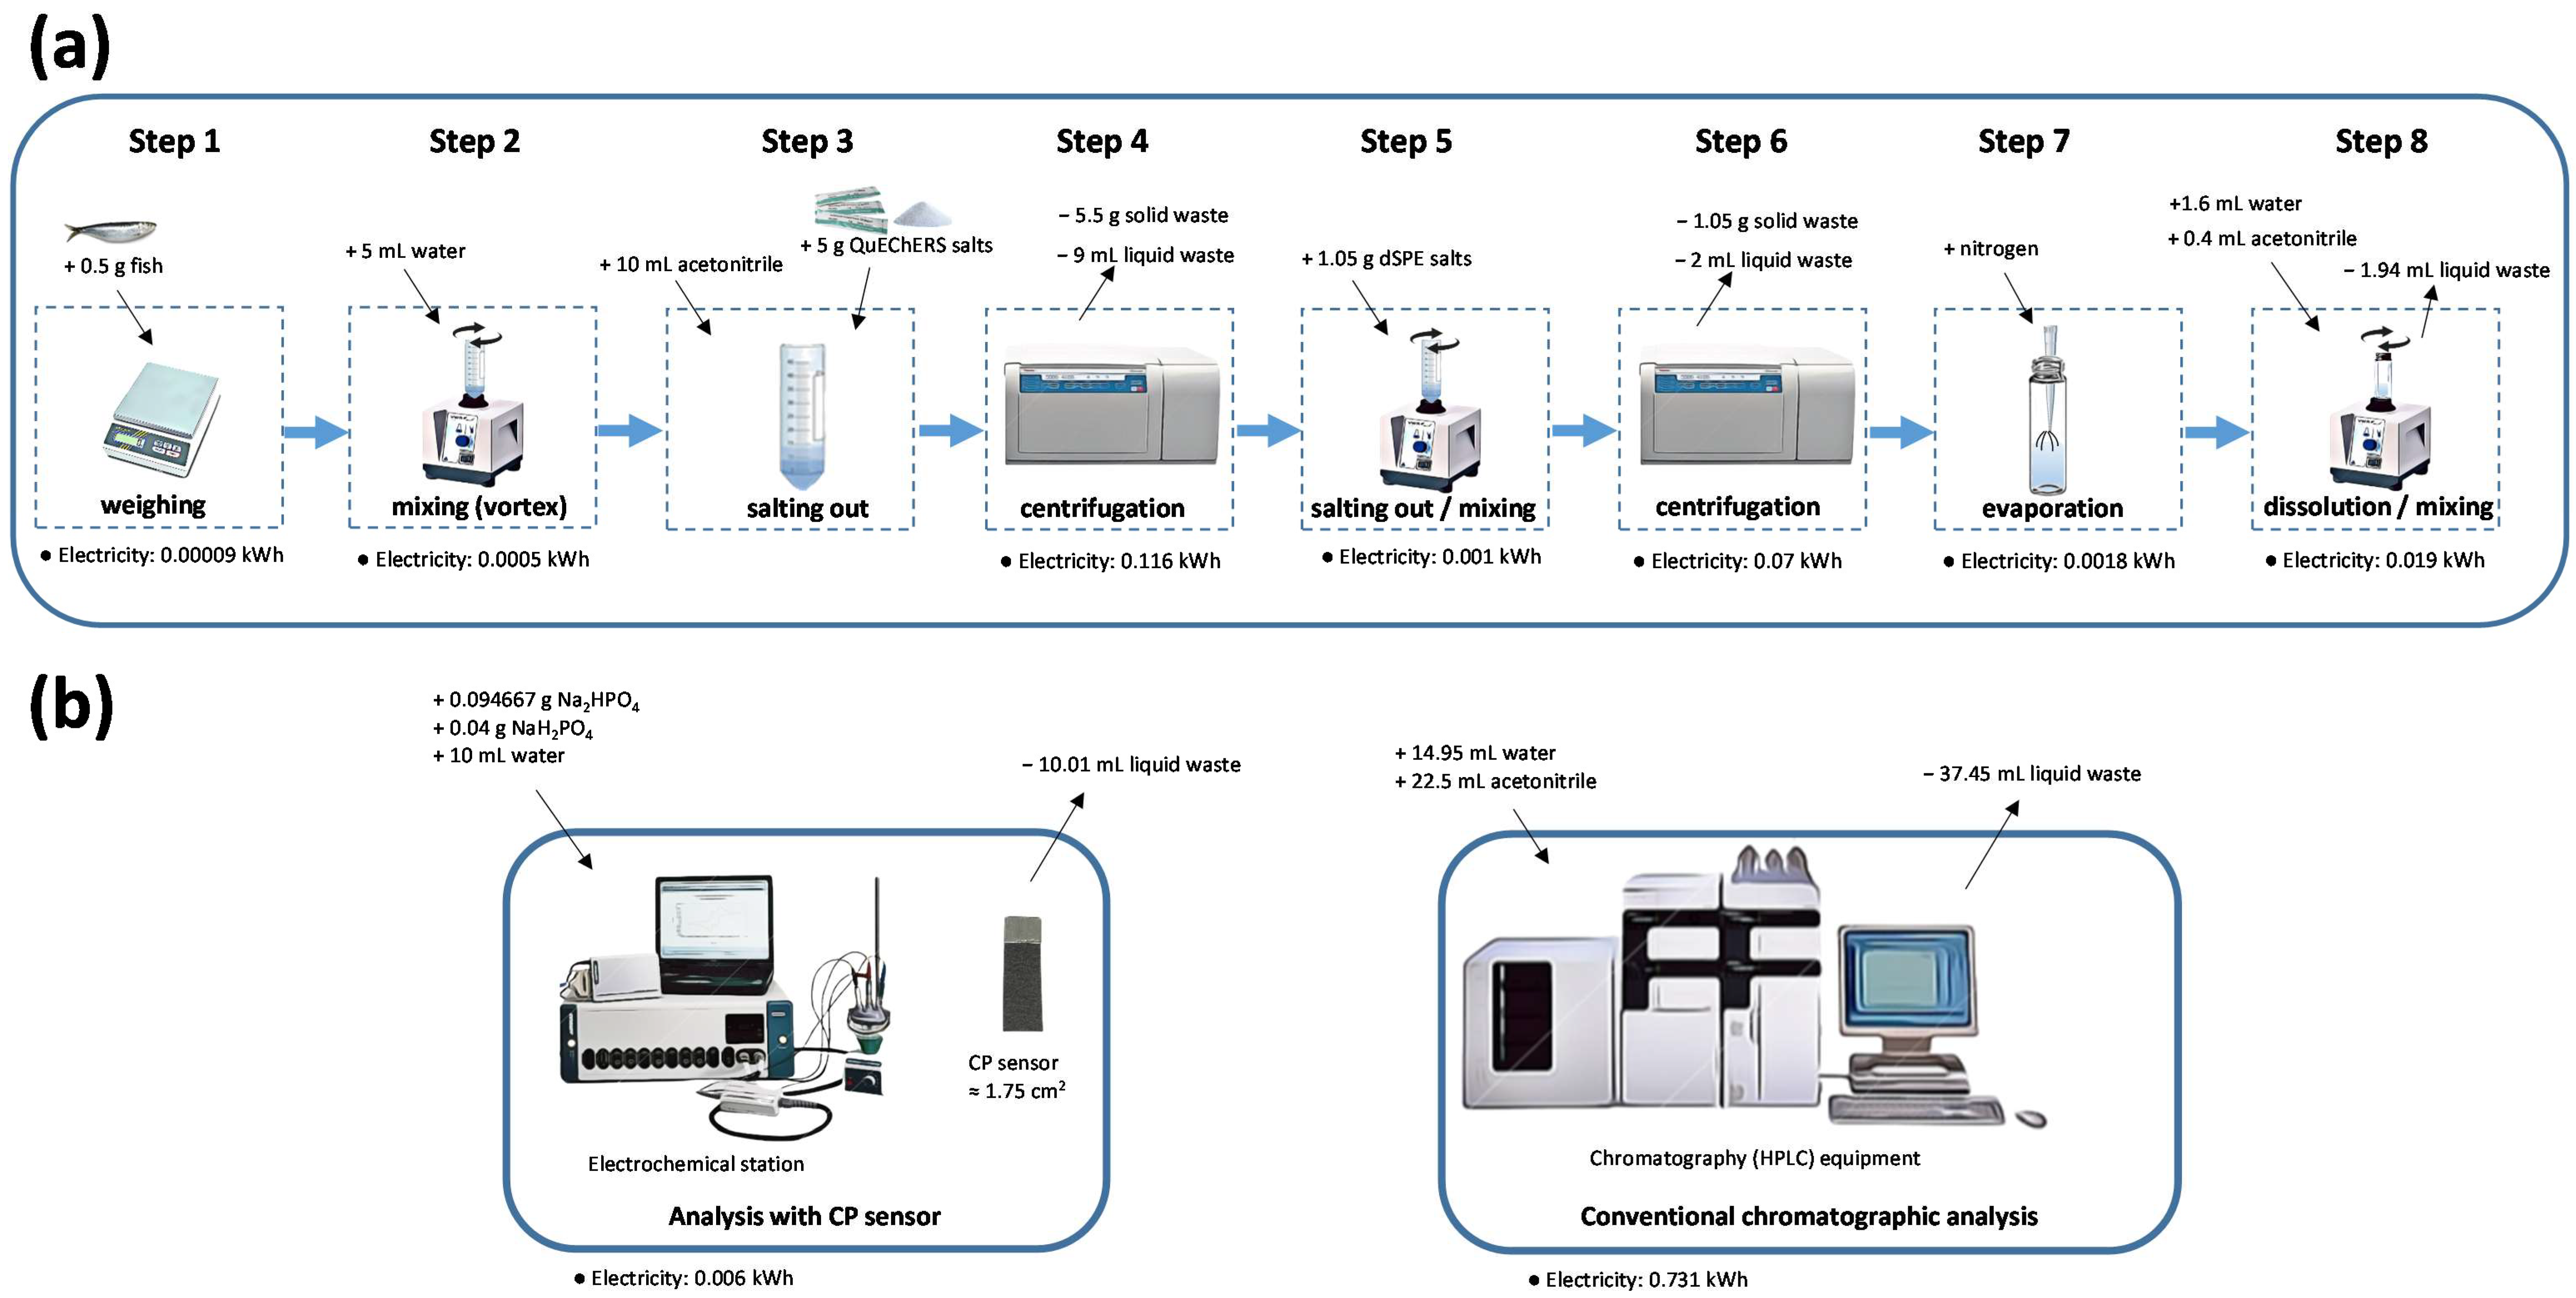
2.1. Extraction Procedure of 17α-Ethinylestradiol from Fish Samples

Samples of Sardina pilchardus fish specimens were obtained from a local market (Porto, Portugal), and were subjected to a validated extraction methodology (Figure 1a). The procedure consisted of weighting about 0.5 g portion of edible fish tissue into a 50 mL falcon tube (step 1) Next, 5 mL of water were added, vortexed (VWR, VV3, United Kingdom) (step 2), and followed by the addition of 10 mL of acetonitrile. After shaking by hand for 30 s, QuEChERS salts (4 g magnesium sulphate and 1 g sodium chloride; Agilent, Santa Clara, CA, USA) were added and agitated for 1 min (step 3) followed by centrifugation (Thermo Scientific Heraeus Megafuge 16R, Kandel, Germany) at 4000 rpm during 5 min at 4 °C (step 4). The supernatant (6 mL) was then transferred to a 15 mL tube containing the dispersive solid phase extraction salts (composed of 150 mg C18 and 900 mg magnesium sulphate; Agilent USA), agitated in the vortex during 1 min (step 5) and centrifuged at 13,000 rpm for 3 min at 4 °C (step 6). The obtained supernatant (4 mL) was finally evaporated under nitrogen stream (step 7) and redissolved in about 2 mL of water:acetonitrile (4:1 v/v; acetonitrile from Sigma-Aldrich, Taufkirchen, Germany) with the aid of ultrasounds (5 min) and vortex (3 min) (step 8). An appropriate aliquot (10 μL) of this extract was then used for electrochemical analysis or chromatographic analysis (Figure 1b).

2.2. Carbon Paper Sensing of 17α-Ethinylestradiol in Fish Extracts

A 10 μL aliquot of fish extract was added to 10 mL electrolyte (sodium phosphate buffer, 0.1 M, pH 7) in the electrochemical cell and differential pulse voltammetry (between 0.2 and 0.7 V using the following optimized parameters: modulation amplitude 90 mV; modulation time 3 ms; interval time 0.1 s; step potential 0.01 V; deposition potential 0.4 V; deposition time 180 s) was applied for the analysis of 17α-ethinylestradiol. The analysis equipment consisted of a PGSTAT12 Metrohm Autolab controlled with GPES version 4.9 software. A three-electrode configuration was used with an Ag/AgCl (3M, KCl) as a reference electrode, a platinum rod as a counter electrode, and the CP sensor as a working electrode. The CP sensor was made of Toray carbon paper (TGP-H-60, 0.19 mm thickness; Alfa Aesar, Kandel, Germany) with a size of approximately 2.5 × 0.7 cm2 and used without further pre-treatment and modification (Figure 1b).

2.3. Chromatographic Analysis of 17α-Ethinylestradiol in Fish Extracts

A 10 μL aliquot of fish extract was injected into the liquid chromatograph (Figure 1b) system composed of an octadecylsilane column (Luna 5 μm C18 100 Å, 150 × 4.6 mm (Phenomenex, Alcobendas, Spain), an autosampler Sil-20AHT, a system controller CBM-20A, and a fluorescence detector (Shimadzu, Duisburg, Germany), set with a flow rate of 1 mL min−1 of the mobile phase constituted by 60% acetonitrile and 40% water. The total run time was 37.5 min.
All aqueous solutions were prepared with ultrapure water obtained from a Milliporewater purification system (18 MΩ, Milli-Q, Millipore, Molsheim, France).
Figure 1. Scheme representing (a) the extraction procedure (common to the carbon paper sensor and chromatographic analysis) and (b) analytical detection: novel CP sensor (left) and the conventional chromatographic method (right).
Sustainability 14 08896 g001

3. Life Cycle Assessment

3.1. Goal and Scope

The goal of this study is to compare, through LCA and LCC, a novel carbon paper sensor and the classical chromatographic-based method for the analysis of 17α-ethinylestradiol in fish samples.
The methodology of impact assessment used was the ‘‘IMPACT 2002+”; this methodology proposes a feasible implementation of a midpoint in a combined approach to assess the damage; it has four categories of damage: human health, ecosystem quality, climate change and resources, and this type of approach was chosen for the evaluation of environmental impacts for LCA of both the characterized analytical methods since it is expressed in points due to the normalization, which facilitates the calculations of a global indicator. The LCA included all materials and determination procedures, and it is performed with a “cradle to grave” approach so system boundaries end at final disposal. The functional unit considered was one analysis.
This work was based on primary data from laboratory experiments [15] and data available in the literature (e.g., the data for CP production [34] and secondary data given by proper LCI data sets available on Ecoinvent. The Ecoinvent database (v. 3.8) provided data for several processes and commodities (electricity, etc.). The Ecoinvent database also provided data for the needed reagents and materials (mentioned in the experimental section i.e., acetonitrile, magnesium sulphate, sodium chloride, water, etc.) and waste incineration and wastewater treatment, i.e., for all the inputs and outputs of the methods.

3.2. Inventory

The inventory of the extraction procedure (Figure 1a displaying the inputs and outputs), which is equal for the two analytical methods, is given in Table 1 whereas the inventory for the analytical procedure of both methods (inputs and outputs exhibited in Figure 1b) is given in Table 2. The electricity consumption (in all steps except in salting out; Figure 1) was estimated considering the power of the equipment and the time that they were used. The wastes (steps 4, 6, and 8, and the chromatographic eluent; plastic wastes: falcons and tips) were considered to be sent to incineration because of hazard characteristics. The water-based effluent (CP sensor) was considered to be discharged through the sewage for wastewater treatment. The conventional methodology (liquid chromatography with fluorescence detection) uses a silica column that can be used about 250 times and the CP sensor can be reused about 50 times. These primary data were obtained from experiments carried out in the laboratory. Additionally, in order to account for the CP production, it was necessary to gather information from the literature [34] and the Ecoinvent database.
In the extraction procedure (Table 1) there is also (besides electricity) the consumption of water, the extraction salts (QuEChERS), polypropylene tips for micropipettes, falcon tubes, and acetonitrile as outputs wastes. In the CP sensing procedure (Table 2), there is the consumption of electricity, water, Na2HPO4, NaH2PO4, carbon paper (that may be used 50 times), polypropylene tips, and as outputs wastewater; it was also considered to be solid waste when the carbon paper reaches the end of its life, but this value must be divided by 50. In the chromatographic analysis (Table 2), there is consumption of electricity, acetonitrile, water, column (used 250 times), and plastics represented by polypropylene. The outputs are wastes. Maintenance was considered; however, no significant inputs and outputs were identified.

4. Results and Discussion

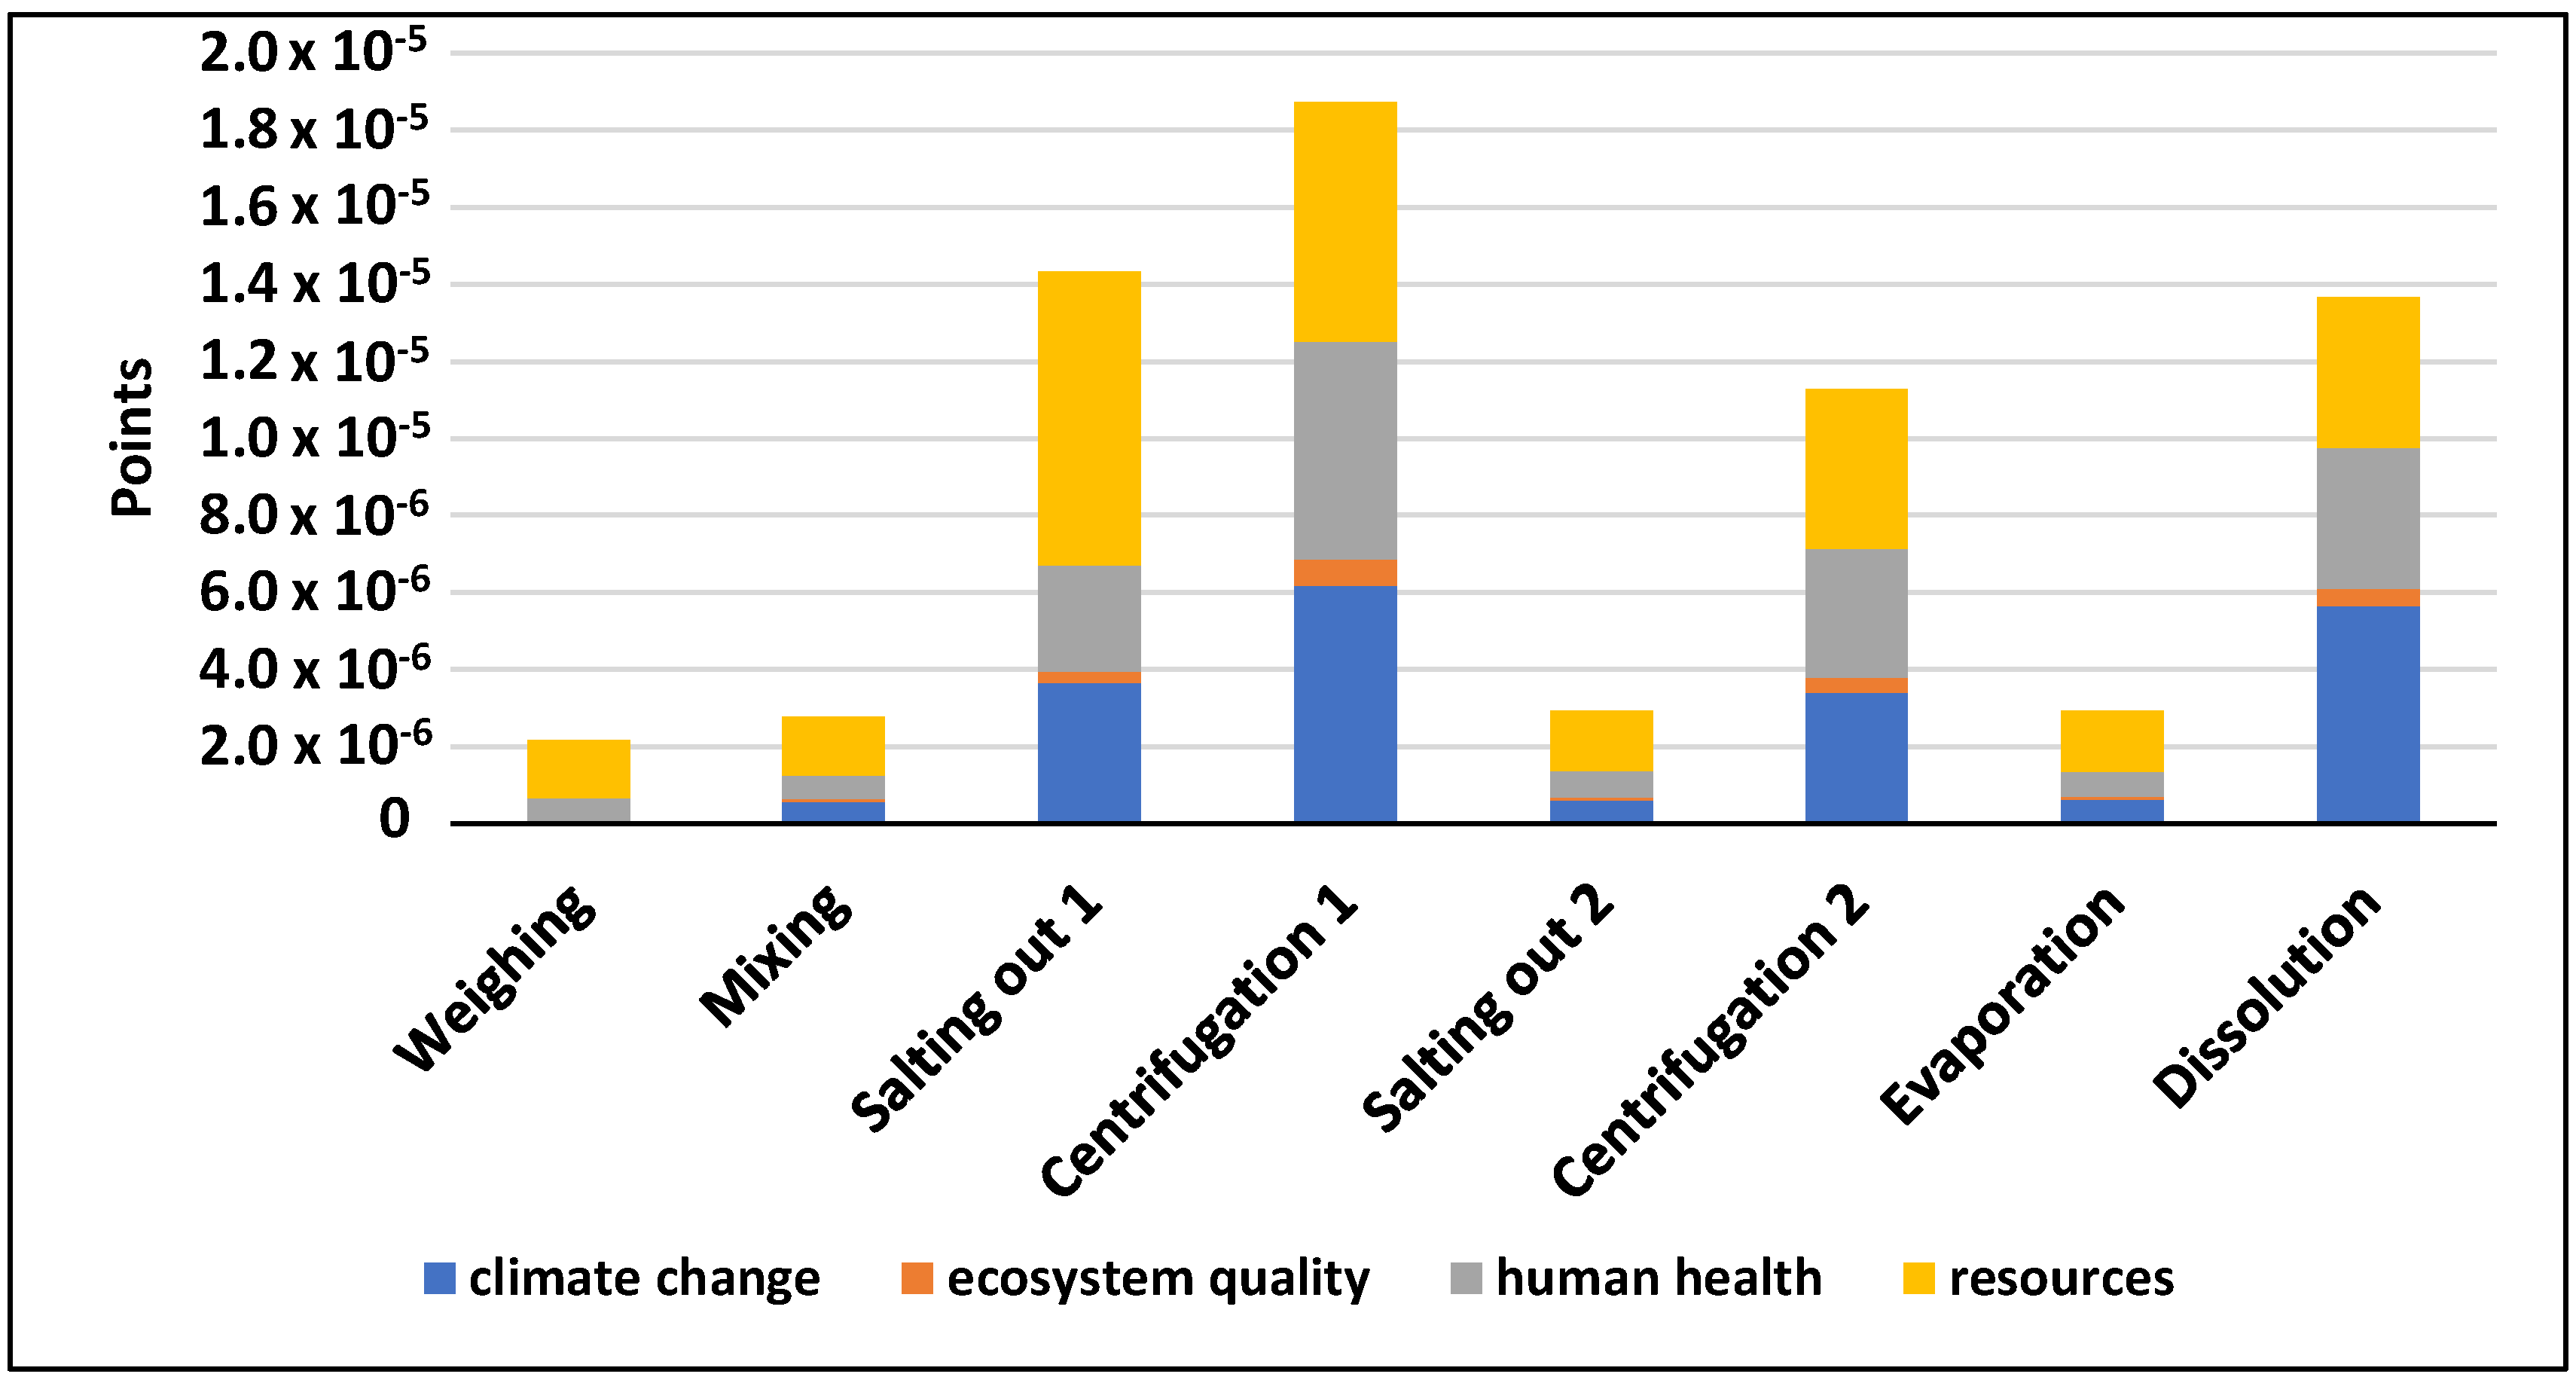
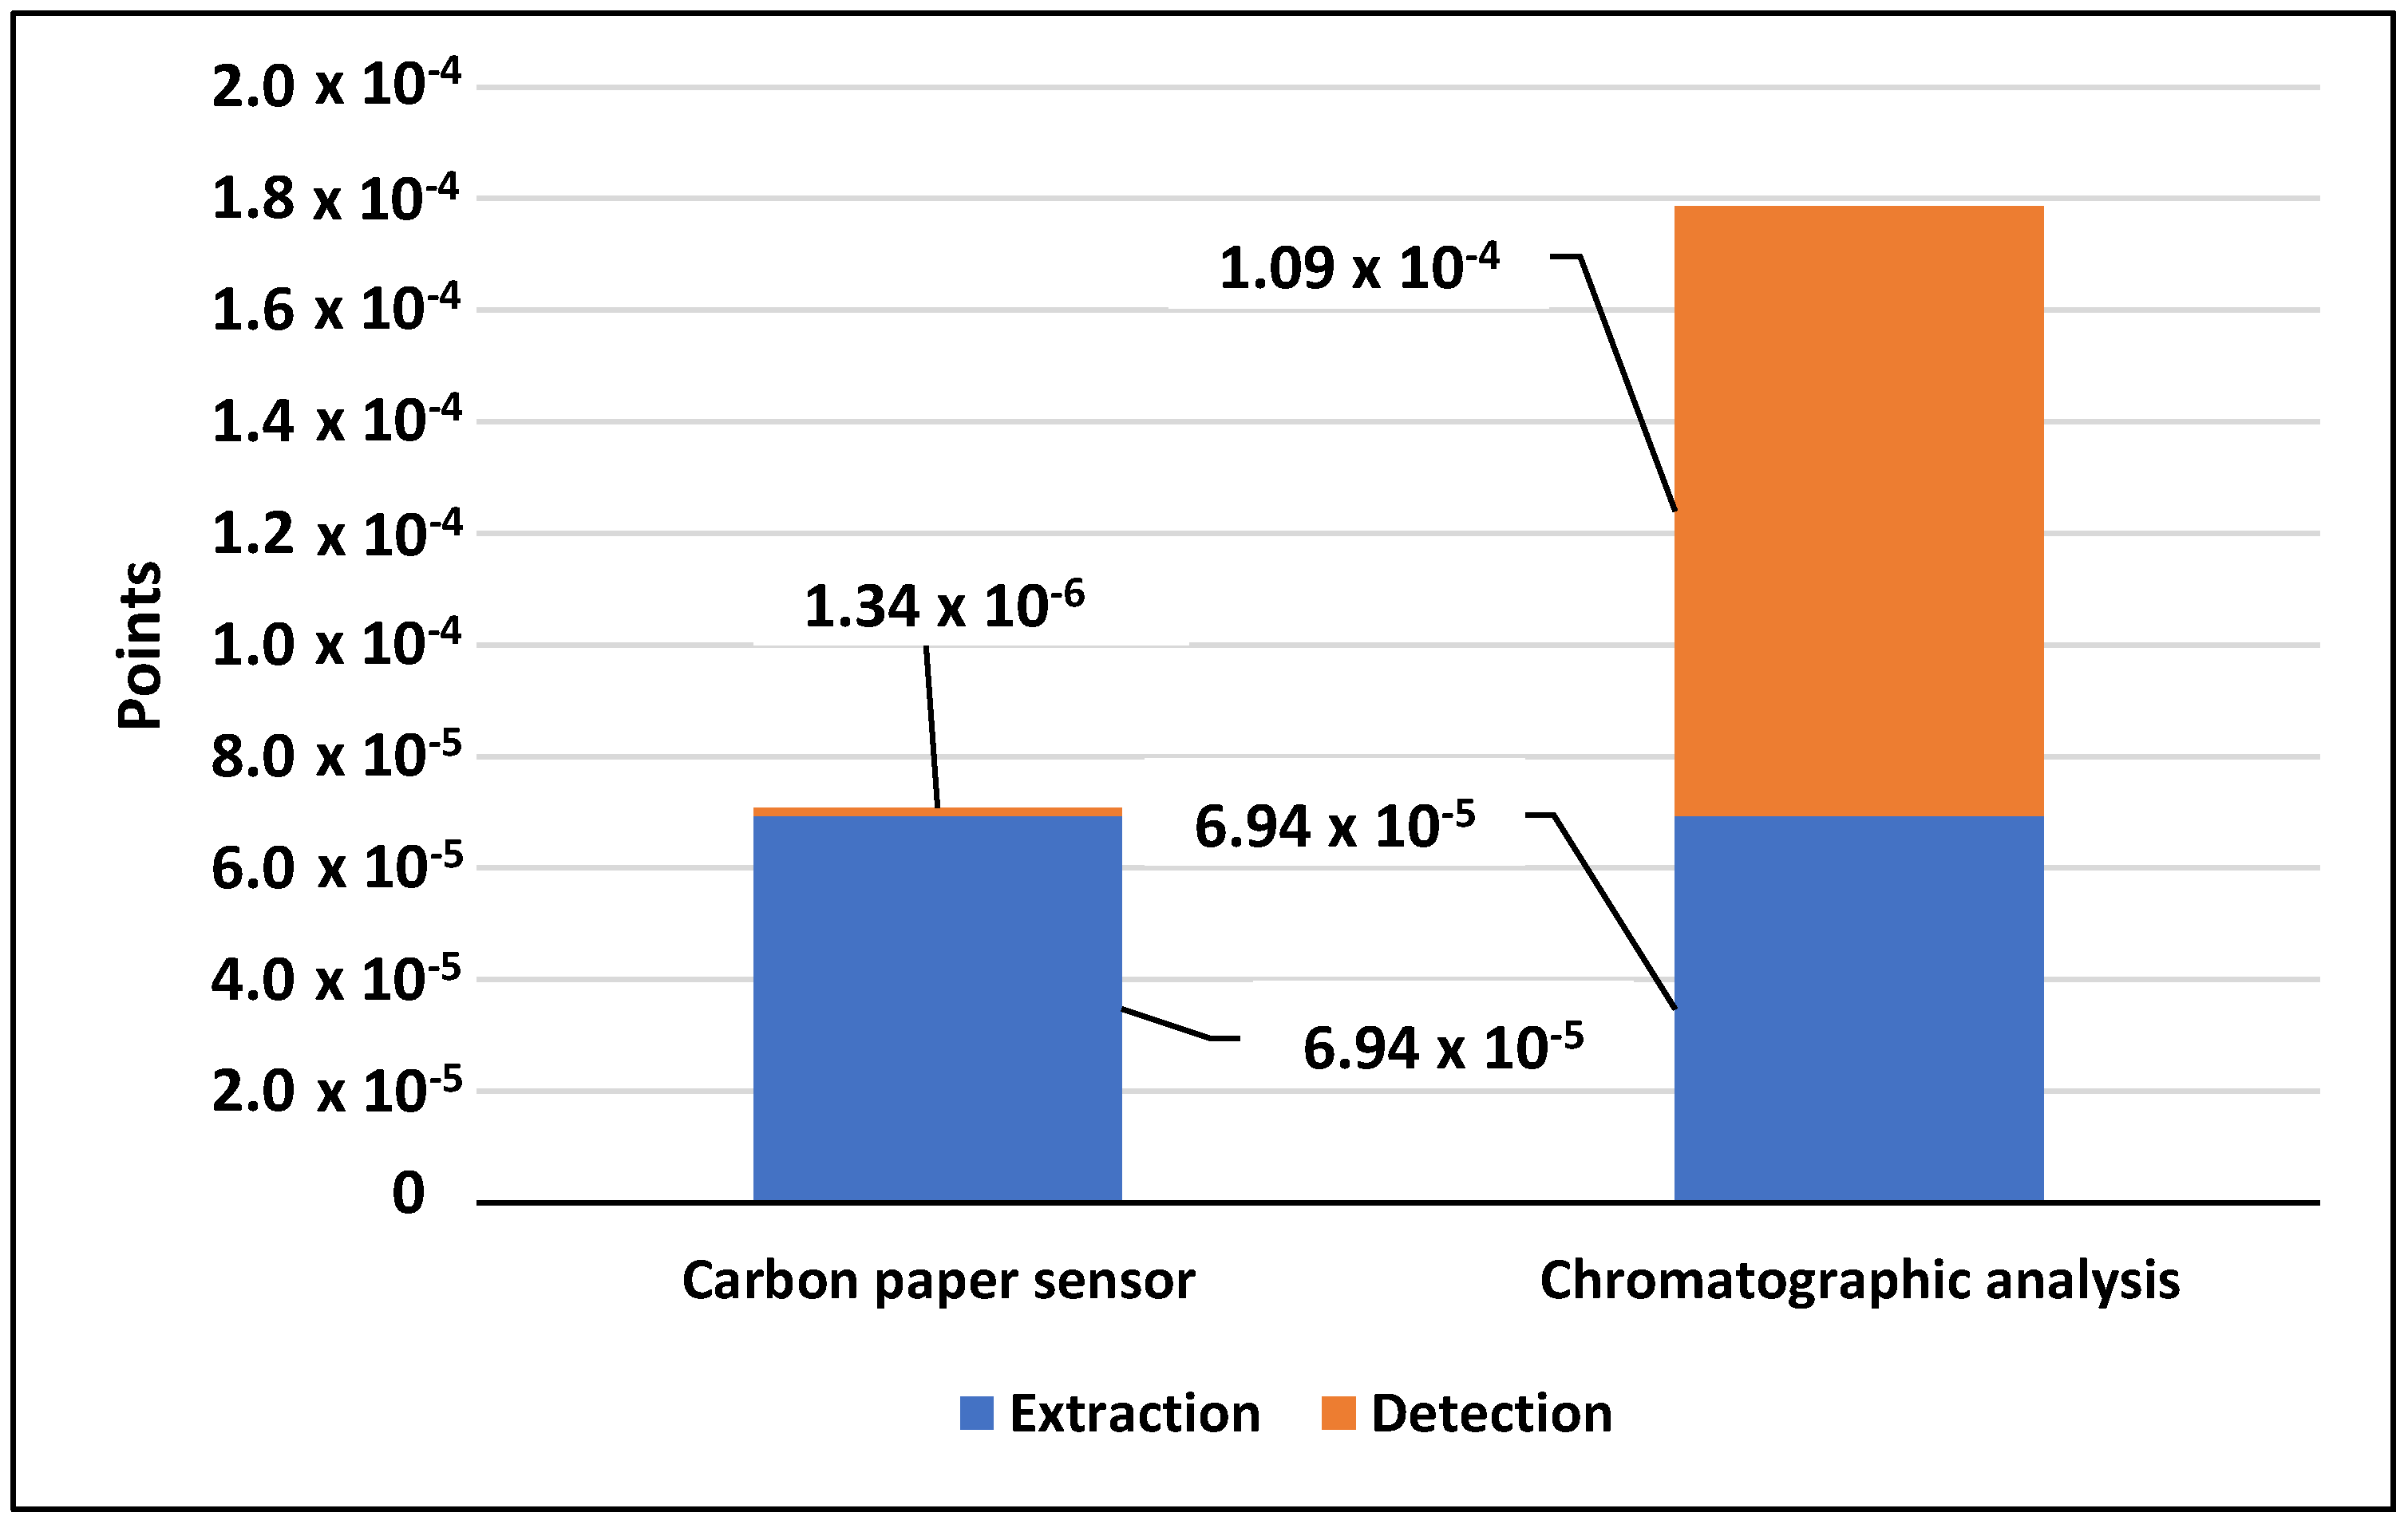
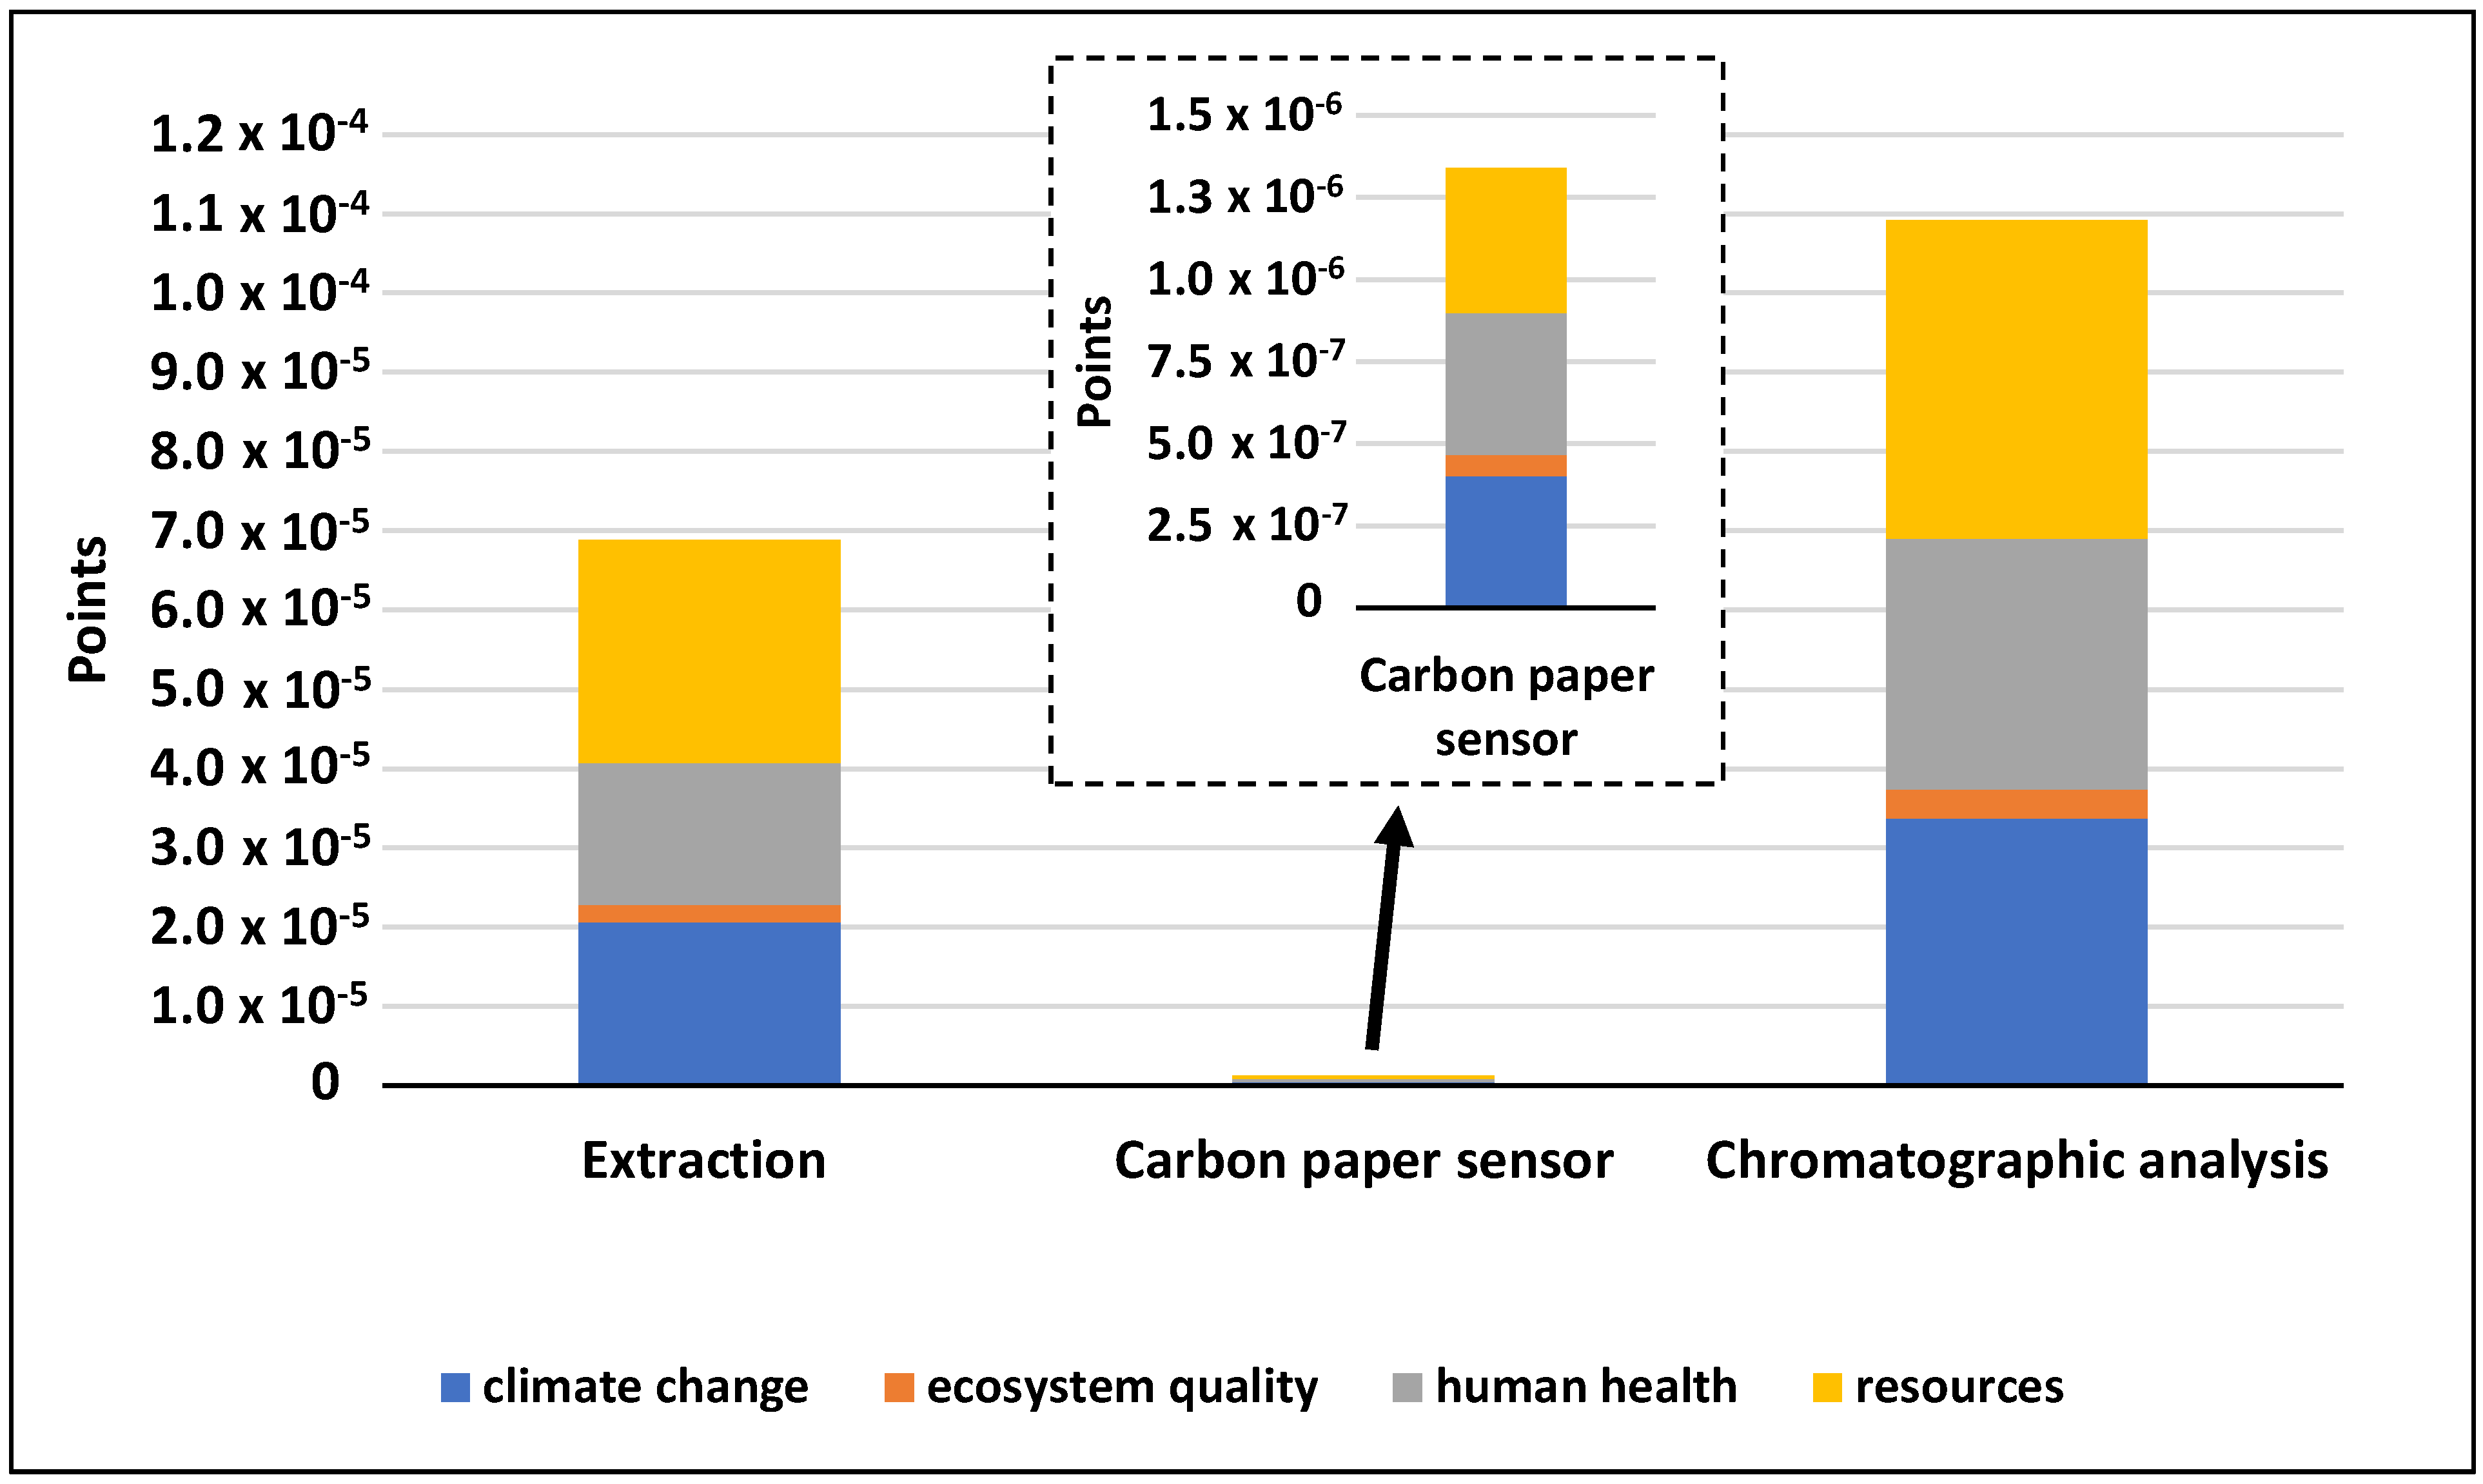
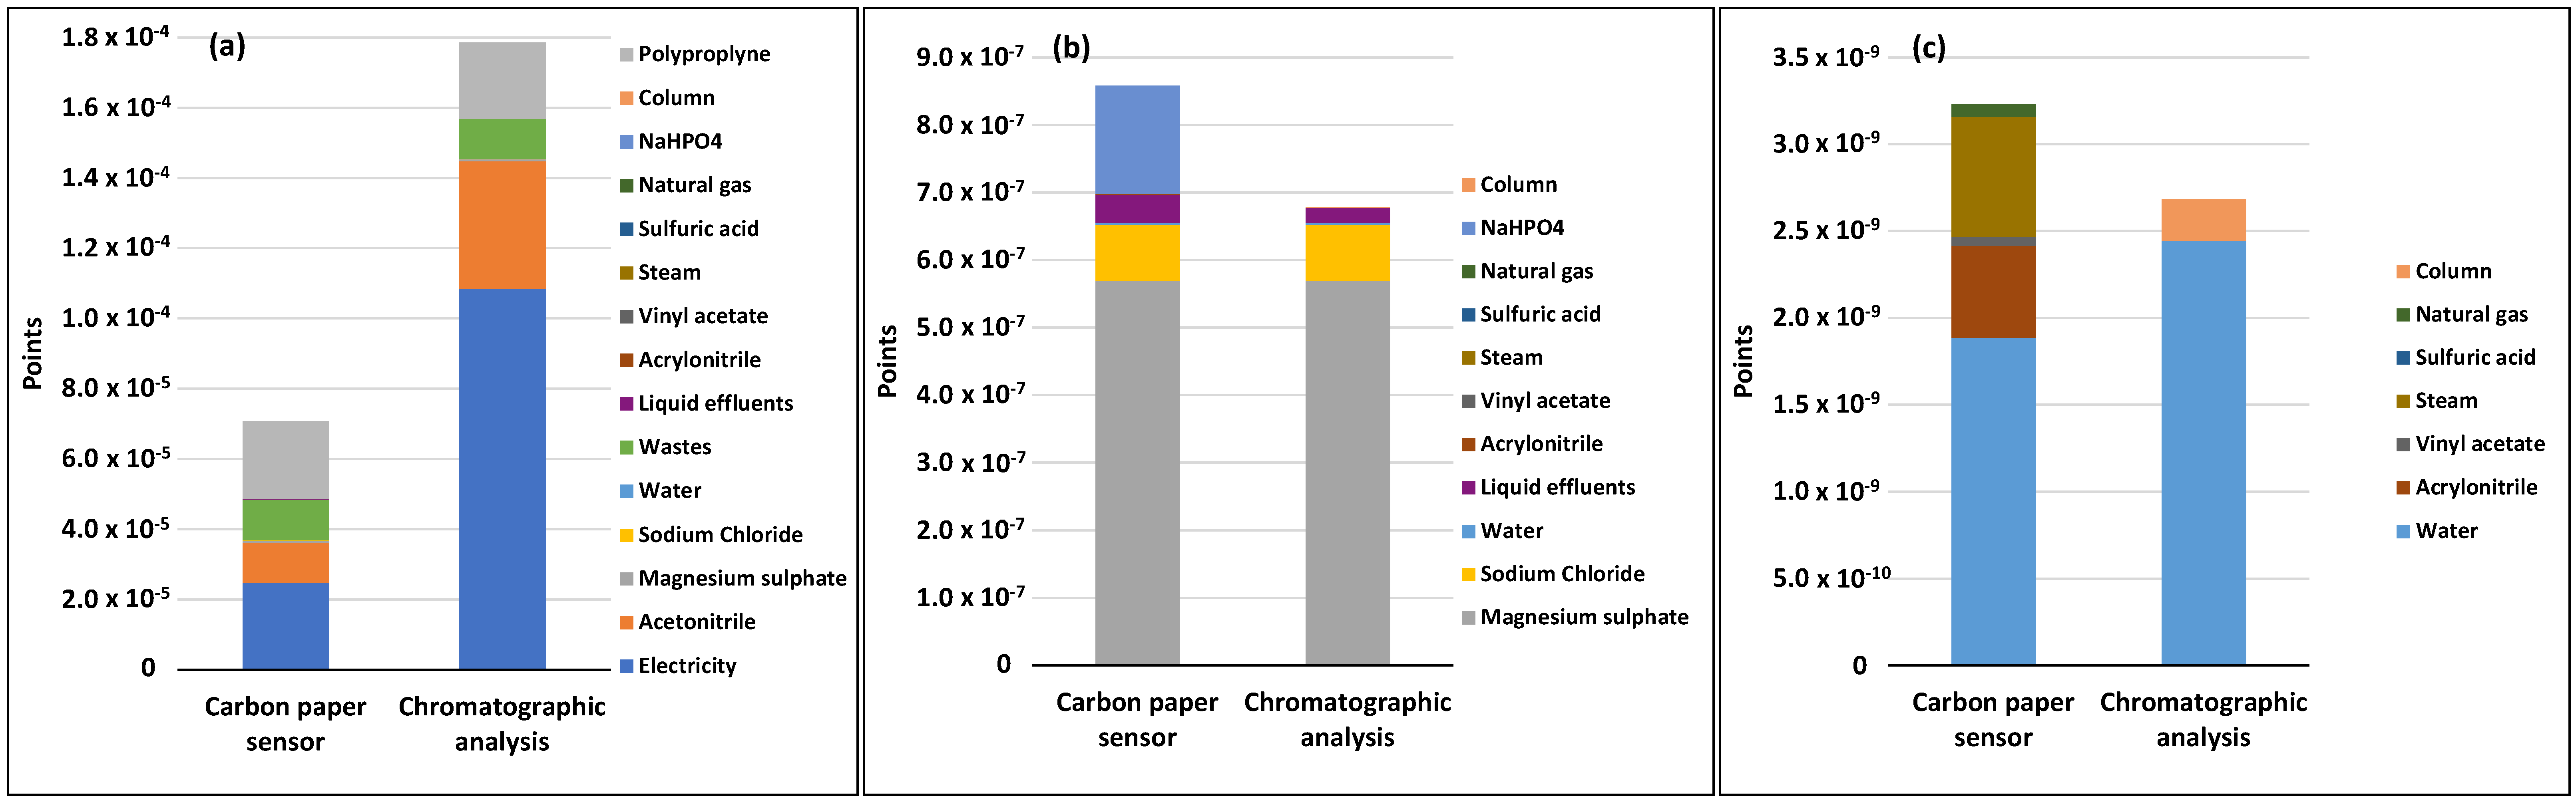
4.1. Environmental Impact Assessment

The environmental impact assessment was carried out considering the inputs and outputs of the systems (Table 1 and Table 2). The environmental impacts of the various steps of the extraction procedure are presented in Figure 2, being the most important contributor to the first centrifugation step (centrifugation 1) due to the substantial consumption of electrical energy. The second most contributor is the salting out one step due to the consumption of acetonitrile and QuEChERS salts followed by the dissolution operation because of the consumption of electricity and acetonitrile. Centrifugation 2 also presents a significant environmental impact due to energy consumption. The impact of plastic (polypropylene) material inputs such as falcon and tips were divided by all stages, but it corresponds roughly to 30% of the extraction environmental impacts.
For all extraction steps, the global highest impact is on resources (sometimes more than double the closest value), whereas the magnitude for human health and climate change is generally similar. All stages present lower values on the impact category of ecosystem quality.
Figure 3 presents the results of the global environmental impact assessment of both the complete analytical strategies. It is possible to observe that the total (extraction and detection) CP sensor approach is significantly more environmentally friendly than the classical methodology with total values roughly 2.5 times lower. The environmental impacts of the extraction procedure represent 38.8% of the chromatographic method and 98.1% of the CP method. Comparing only the detection steps (Figure 1b) of both methods, it is possible to conclude that the environmental impacts of the detection step of the classical method are much higher, roughly 80 times higher, which is very significant.
Figure 4 presents the data considering the four categories of damage for the two entire strategies. Ecosystem quality is the category with lower global impacts, while the other categories present an overall similar magnitude. Generally, it is quite evident that electrochemical sensing presents an almost negligible impact when compared with the extraction step and the liquid chromatographic analysis. In fact, the values for all categories are below 3% of the total impact of the method; 1.6, 1.9, 2.4, and 2.9% for resources, climate change, human health, and ecosystem quality. The results also suggest that additional potential environmental improvements should be focused on the extraction step. The low environmental impact of electrochemical sensors, especially based on carbon was also confirmed in the work of Ahamed et al. [31], who assessed several transduction materials (platinum, gold, silver, carbon black, and carbon nanotubes) in screen-printed electrodes. The reported data pointed out that carbon-based electrodes have implications mostly on resource depletion and climate change impact categories [31], similarly as seen in the inset of Figure 4. For the chromatographic detection, all percentual contributions are well above 50% of the total (extraction and detection) environmental impacts of the method, namely, 58.9, 62.0, 63.0, and 63.8% corresponding to resources, climate change, ecosystem quality, and human health.
Figure 5 presents the environmental impacts of the different inputs and outputs. The series that describe the most relevant processes (up to 98.8% for CP sensor and 99.6% for chromatography) is electricity >> acetronitrile > polypropylene >> wastes for the chromatographic analysis and electricity > polypropylene > wastes ≈ acetronitrile for the sensor method. Electricity is the highest contributor to both detection schemes [ca. 35.0% (sensor) to 60.7% (chromatography)]; acetonitrile (20.4%) and polypropylene (31.2%) are those that exhibit the second highest prevalence, respectively for chromatography and the sensor. Concerning the CP sensor, acetonitrile contribution (16.3%) is in the same range as wastes (16.4%).

4.2. Interpretation of Environmental Impacts

From this work, it is possible to conclude that the electrochemical analytical method with a CP sensor presents much lower environmental impacts compared with the traditional technique. The extraction procedure, which is common for both analytical methods under study, has a significant impact on both detection strategies, especially in the electrochemical method. Improvements in the environmental footprint of electrochemical sensors should be tackled in the extraction step. The processes that are important contributors to both analytical methods are electricity, acetonitrile, polypropylene, and the final disposal of wastes. A sensitivity analysis was conducted in order to see the effect of number of times the carbon paper and the column can be reused. The number of uses was reduced to half for each of them without occurring a significate change in the results with the environmental impacts obtained being identical; also, it is important to take into account the disposal at the end-of-life of the carbon sensors as well as the chromatographic columns. Since carbon paper is composed of more than 90% carbon element [35], its waste management is relatively simple through biodegradability or with the available incineration options [31]. On the other hand, chromatographic columns are metallic-based, and thus a higher level of waste separation and treatment is expected, increasing the environmental impact of this analytical option.
The integration of an eco-design approach in sensor fabrication, without compromising efficiency, as assisted in the work of Le Brun and Raskin [32], must serve as an inspirational ground for future developments in the electroanalytical field.

4.3. Life Cycle Costing

A life cycle cost analysis was performed taking into consideration raw materials, electricity acquisition, determination, and end-of-life costs. Table 3 presents the inventory and the costs assessment for the extraction step whereas Table 4 presents the inventory and the assessment cost for both analytical detection procedures including the maintenance costs per functional unit (one analysis). Analyzing the results, it can be concluded that the highest impact is attributed to the extraction procedure (ca. EUR 8.34), followed by the analytical procedure based on chromatography (ca. EUR 6.59), which is 205 times higher than the CP sensor detection (ca. EUR 0.034). The total life cycle cost for the traditional method is EUR 14.93 and for the carbon, the paper method is EUR 8.37, which is almost equal to the cost of the extraction step, which represents 99.6% of the life cycle costing of the electrochemical analytical method employing the CP sensor.

5. Conclusions

There is a general idea of electroanalytical methods being more ecologically sustainable compared with chromatographic methods when considering the analysis of a single compound. The attained LCA results clearly evidence that assumption by confirming a much lower environmental impact for the analytical process (corresponding to 1% only comparing the detection step and 40% if the extraction step is considered), mainly observable by the consumption of electrical energy and hazardous solvents (acetonitrile); moreover, the total LCC for carbon paper sensor represents 56% of the chromatographic analysis. These factors contribute to the competitiveness of electroanalytical methods over traditional ones.
Specifically attending the use of carbon paper, this is a very interesting material since its mechanical, electronic, and electrochemical properties, as well as its format resembling paper, envisages interesting (bio)sensing applications, especially on the level of miniaturization, portability, and easy adaptability of the sensing system. When used as a sensor it showed a high sensitivity for the analytes in the study even without any modification of the surface with (nano)materials, proving its efficiency as a simple electrode. All these minimization features attributed to carbon paper make it a very economic and environmentally sustainable alternative to traditional analytical methods such as those based on chromatography but also an excellent alternative to commonly used and bulkier electrodes in electroanalysis.
Electroanalysts are currently changing the future of the field with respect to the design of more sustainable new sensing platforms, by reducing component size and the use of hazardous materials and reagents. The application of LCA and LCC tools are crucial to quantitatively characterize the environmental impacts and footprints of these newly developed (bio)sensors, although still being very limitedly exploited and thus constituting an interesting complement to the research methodology in this field.

Author Contributions

Conceptualization, F.M., Á.T. and S.M. writing—original draft preparation, F.M. and Á.T.; writing—review and editing, F.M., Á.T. and S.M.; supervision, S.M. and C.D.-M.; project administration, S.M.; funding acquisition, S.M. All authors have read and agreed to the published version of the manuscript.

Funding

This work was financed by FEDER—Fundo Europeu de Desenvolvimento Regional funds through the COMPETE 2020—Operacional Programme for Competitiveness and Internationalization (POCI), and by Portuguese funds through FCT—Fundação para a Ciência e a Tecnologia in the framework of the project POCI-01-0145-FEDER-029547—PTDC/ASP-PES/29547/2017.

Institutional Review Board Statement

Not applicable.

Informed Consent Statement

Not applicable.

Data Availability Statement

Not applicable.

Acknowledgments

This work received support by UIDB/50006/2020, UIDP/50006/2020 and LA/P/0008/2020 by the Fundação para a Ciência e a Tecnologia (FCT), Ministério da Ciência, Tecnologia e Ensino Superior (MCTES) through national funds.

Conflicts of Interest

The authors declare no conflict of interest.

References

  1. Hysa, E.; Kruja, A.; Rehman, N.U.; Laurenti, R. Circular Economy Innovation and Environmental Sustainability Impact on Economic Growth: An Integrated Model for Sustainable Development. Sustainability 2020, 12, 4831. [Google Scholar] [CrossRef]
  2. Chen, T.-L.; Kim, H.; Pan, S.-Y.; Tseng, P.-C.; Lin, Y.-P.; Chiang, P.-C. Implementation of green chemistry principles in circular economy system towards sustainable development goals: Challenges and perspectives. Sci. Total Environ. 2020, 716, 136998. [Google Scholar] [CrossRef] [PubMed]
  3. Ebele, A.J.; Abou-Elwafa Abdallah, M.; Harrad, S. Pharmaceuticals and personal care products (PPCPs) in the freshwater aquatic environment. Emerg. Contam. 2017, 3, 1–16. [Google Scholar] [CrossRef]
  4. Miller, T.H.; Bury, N.R.; Owen, S.F.; MacRae, J.I.; Barron, L.P. A review of the pharmaceutical exposome in aquatic fauna. Environ. Pollut. 2018, 239, 129–146. [Google Scholar] [CrossRef] [PubMed]
  5. Papageorgiou, M.; Kosma, C.; Lambropoulou, D. Seasonal occurrence, removal, mass loading and environmental risk assessment of 55 pharmaceuticals and personal care products in a municipal wastewater treatment plant in Central Greece. Sci. Total Environ. 2016, 543, 547–569. [Google Scholar] [CrossRef]
  6. Carvalho, R.N.; Ceriani, L.; Ippolito, A.; Lettieri, T. Development of the First Watch List under the Environmental Quality Standards Directive, JRC Technical Report; European Commission: Publications Office of the European Union, Luxembourg, 2015.
  7. Hersey, M.; Berger, S.N.; Holmes, J.; West, A.; Hashemi, P. Recent Developments in Carbon Sensors for at-Source Electroanalysis. Anal. Chem. 2019, 91, 27–43. [Google Scholar] [CrossRef]
  8. Ferreira, P.C.; Ataíde, V.N.; Silva Chagas, C.L.; Angnes, L.; Tomazelli Coltro, W.K.; Longo Cesar Paixão, T.R.; Reis de Araujo, W. Wearable electrochemical sensors for forensic and clinical applications. TrAC Trends Anal. Chem. 2019, 119, 115622. [Google Scholar] [CrossRef]
  9. Zhang, W.; Wang, R.; Luo, F.; Wang, P.; Lin, Z. Miniaturized electrochemical sensors and their point-of-care applications. Chin. Chem. Lett. 2020, 31, 589–600. [Google Scholar] [CrossRef]
  10. Kalambate, P.K.; Rao, Z.; Dhanjai; Wu, J.; Shen, Y.; Boddula, R.; Huang, Y. Electrochemical (bio) sensors go green. Biosens. Bioelectron. 2020, 163, 112270. [Google Scholar] [CrossRef]
  11. Torrinha, Á.; Oliveira, T.M.B.F.; Ribeiro, F.W.P.; Correia, A.N.; Lima-Neto, P.; Morais, S. Application of Nanostructured Carbon-Based Electrochemical (Bio)Sensors for Screening of Emerging Pharmaceutical Pollutants in Waters and Aquatic Species: A Review. Nanomaterials 2020, 10, 1268. [Google Scholar] [CrossRef]
  12. Torrinha, Á.; Morais, S. Electrochemical (bio)sensors based on carbon cloth and carbon paper: An overview. TrAC Trends Anal. Chem. 2021, 142, 116324. [Google Scholar] [CrossRef]
  13. Shi, H.; Wen, G.; Nie, Y.; Zhang, G.; Duan, H. Flexible 3D carbon cloth as a high-performing electrode for energy storage and conversion. Nanoscale 2020, 12, 5261–5285. [Google Scholar] [CrossRef] [PubMed]
  14. Torrinha, Á.; Martins, M.; Tavares, M.; Delerue-Matos, C.; Morais, S. Carbon paper as a promising sensing material: Characterization and electroanalysis of ketoprofen in wastewater and fish. Talanta 2021, 226, 122111. [Google Scholar] [CrossRef] [PubMed]
  15. Torrinha, Á.; Carneiro, P.; Dias, D.; Delerue-Matos, C.; Morais, S. The simpler the better: Highly sensitive 17α-ethinylestradiol sensor based on an unmodified carbon paper transducer. Talanta 2022, 245, 123457. [Google Scholar] [CrossRef]
  16. Varanda, M.G.; Pinto, G.; Martins, F. Life cycle analysis of biodiesel production. Fuel Processing Technol. 2011, 92, 1087–1094. [Google Scholar] [CrossRef] [Green Version]
  17. Brito, M.; Martins, F. Life cycle assessment of butanol production. Fuel 2017, 208, 476–482. [Google Scholar] [CrossRef] [Green Version]
  18. Yusof, S.J.H.M.; Roslan, A.M.; Ibrahim, K.N.; Abdullah, S.S.S.; Zakaria, M.R.; Hassan, M.A.; Shirai, Y. Life Cycle Assessment for Bioethanol Production from Oil Palm Frond Juice in an Oil Palm Based Biorefinery. Sustainability 2019, 11, 6928. [Google Scholar] [CrossRef] [Green Version]
  19. Kumar, M.; Kumar Choubey, V.; Deepak, A.; Gedam, V.V.; Raut, R.D. Life cycle assessment (LCA) of dairy processing industry: A case study of North India. J. Clean. Prod. 2021, 326, 129331. [Google Scholar] [CrossRef]
  20. Wilfart, A.; Gac, A.; Salaün, Y.; Aubin, J.; Espagnol, S. Allocation in the LCA of meat products: Is agreement possible? Clean. Environ. Syst. 2021, 2, 100028. [Google Scholar] [CrossRef]
  21. Blanc, S.; Massaglia, S.; Brun, F.; Peano, C.; Mosso, A.; Giuggioli, N.R. Use of Bio-Based Plastics in the Fruit Supply Chain: An Integrated Approach to Assess Environmental, Economic, and Social Sustainability. Sustainability 2019, 11, 2475. [Google Scholar] [CrossRef] [Green Version]
  22. Gamage, A.; Liyanapathiranage, A.; Manamperi, A.; Gunathilake, C.; Mani, S.; Merah, O.; Madhujith, T. Applications of Starch Biopolymers for a Sustainable Modern Agriculture. Sustainability 2022, 14, 6085. [Google Scholar] [CrossRef]
  23. AzariJafari, H.; Guest, G.; Kirchain, R.; Gregory, J.; Amor, B. Towards comparable environmental product declarations of construction materials: Insights from a probabilistic comparative LCA approach. Build. Environ. 2021, 190, 107542. [Google Scholar] [CrossRef]
  24. Abdelaal, F.; Guo, B.H.W. Stakeholders’ perspectives on BIM and LCA for green buildings. J. Build. Eng. 2022, 48, 103931. [Google Scholar] [CrossRef]
  25. Bianco, I.; Thiébat, F.; Carbonaro, C.; Pagliolico, S.; Blengini, G.A.; Comino, E. Life Cycle Assessment (LCA)-based tools for the eco-design of wooden furniture. J. Clean. Prod. 2021, 324, 129249. [Google Scholar] [CrossRef]
  26. Anshassi, M.; Townsend, T.G. Reviewing the underlying assumptions in waste LCA models to identify impacts on waste management decision making. J. Clean. Prod. 2021, 313, 127913. [Google Scholar] [CrossRef]
  27. Goyal, H.; Mondal, P. Life cycle assessment (LCA) of the arsenic and fluoride removal from groundwater through adsorption and electrocoagulation: A comparative study. Chemosphere 2022, 304, 135243. [Google Scholar] [CrossRef]
  28. Martins, F.; Machado, S.; Albergaria, T.; Delerue-Matos, C. LCA applied to nano scale zero valent iron synthesis. Int. J. Life Cycle Assess. 2017, 22, 707–714. [Google Scholar] [CrossRef] [Green Version]
  29. The Top 300 of 2019, ClinCalc DrugStats Database, Version 2021.10. Available online: https://clincalc.com/DrugStats/Top300Drugs.aspx (accessed on 22 September 2021).
  30. You, H.H.; Song, G. Review of endocrine disruptors on male and female reproductive systems. Comp. Biochem. Physiol. Part C Toxicol. Pharmacol. 2021, 244, 109002. [Google Scholar] [CrossRef]
  31. Ahamed, A.; Ge, L.; Zhao, K.; Veksha, A.; Bobacka, J.; Lisak, G. Environmental footprint of voltammetric sensors based on screen-printed electrodes: An assessment towards “green” sensor manufacturing. Chemosphere 2021, 278, 130462. [Google Scholar] [CrossRef]
  32. Le Brun, G.; Raskin, J.-P. Material and manufacturing process selection for electronics eco-design: Case study on paper-based water quality sensors. Procedia CIRP 2020, 90, 344–349. [Google Scholar] [CrossRef]
  33. Ali, M.F.B.; Uejo, Y.; Kishikawa, N.; Ohyama, K.; Kuroda, N. A selective and highly sensitive high performance liquid chromatography with fluorescence derivatization approach based on Sonogashira coupling reaction for determination of ethinyl estradiol in river water samples. J. Chromatogr. A 2020, 1628, 461440. [Google Scholar] [CrossRef] [PubMed]
  34. Meng, F.; McKechnie, J.; Turner, T.A.; Pickering, S.J. Energy and environmental assessment and reuse of fluidised bed recycled carbon fibres. Compos. Part A Appl. Sci. Manuf. 2017, 100, 206–214. [Google Scholar] [CrossRef]
  35. Newcomb, B.A. Processing, structure, and properties of carbon fibers. Compos. Part A Appl. Sci. Manuf. 2016, 91, 262–282. [Google Scholar] [CrossRef]
Figure 2. Environmental impacts (climate change, ecosystem quality, human health, and resources) for the different steps of the extraction procedure.
Sustainability 14 08896 g002
Figure 3. Global environmental impacts for the extraction and detection steps of both analytical methods (carbon paper sensor and chromatographic method).
Sustainability 14 08896 g003
Figure 4. Environmental impacts by category of impact (climate change, ecosystem quality, human health, and resources) for extraction and both analytical detection procedures (carbon paper sensor and chromatographic method).
Sustainability 14 08896 g004
Figure 5. Environmental impacts for both analytical methods (carbon paper sensor and chromatographic method): (a) considering all inputs and outputs; (b) inputs and outputs with a magnitude lower than 9 × 10⁻⁷; (c) inputs and outputs with a magnitude lower than 4 × 10⁻⁹.
Sustainability 14 08896 g005
Table 1. Inventory for the extraction procedure.
Inputs/OutputsUnitsWeighingMixingSalting out 1Centrifugation 1Salting out 2Centrifugation 2EvaporationDissolution
ElectricitykWh0.000090.0005 0.1160.0010.070.00180.019
Acetonitrilekg 0.00787 0.0003148
Magnesium sulphatekg 0.004 0.0009
Sodium Chloridekg 0.001
Water kg 0.005 0.0016
Solid wasteskg 0.0055 0.00105 0.01754417
Liquid effluentsm3 0.000009 0.000002
acylonitrilekg
Vinyl acetatekg
Steamkg
Sulfuric acidkg
Natural gasMJ
NaHPO4kg
Column (silica)1
Polypropylenekg 0.02229
Table 2. Inventory for both the analytical detection procedures.
Inputs/OutputsUnitsCarbon Sensor—Carbon PaperCarbon Sensor—OtherChromatographic Analysis
ElectricitykWh1.21426 × 10−50.0060.731
Acetonitrilekg 0.0177075
Magnesium sulphatekg
Sodium Chloridekg
Water kg8.10502 × 10−70.010.01495
Solid wasteskg2.926 × 10−70.000322.94732 × 10−5
Liquid effluentsm3 0.00001
acylonitrilekg5.1205 × 10−7
Vinyl acetatekg4.6816 × 10−8
Steamkg9.18764 × 10−6
Sulfuric acidkg5.852 × 10−9
Natural gasMJ5.20243 × 10−5
NaHPO4kg 0.000134667
Column (silica)1 2.19371 × 10⁻⁵
Polypropylenekg 0.000320.00032
Table 3. Inventory of the life cycle costing for the extraction procedure.
Inputs/OutputsUnitsWeighingMixingSalting out 1Centrifugation 1Salting out 2Centrifugation 2EvaporationDissolution
Electricity0.2489 EUR/kWh0.000090.0005 0.1160.0010.070.00180.019
Acetonitrile135.6 EUR/L 0.01 0.0004
Magnesium sulfate and NaCl3.64 EUR/unit 1
Magnesium sulfate and C182.96 EUR/unit 1
Water 0.002218 EUR/L 0.005 0.0016
Solid wastes0.17 EUR/kg 0.0055 0.00105 0.017544
Liquid effluents1.7748 EUR/m3 0.000009 0.000002
NaHPO487.5 EUR/kg
Column (silica)760.08 EUR/unit
Propylene0.27534 EUR0.1250.1250.1250.1250.1250.1250.1250.125
Carbon paper0.4543 EUR/cm2
Costs—Subtotal (EUR) 0.03443990.0345535.0304180.0642412.9946660.0520230.0348660.096373
Costs—Total (EUR) 8.341578
Table 4. Inventory of the life cycle costing for both analytical detection procedures.
Inputs/OutputsUnitsCarbon Sensor—Carbon PaperCarbon Sensor—OtherChromatographic Analysis
Electricity0.2489 EUR/kWh 0.0060.731
Acetonitrile135.6 EUR/L 0.0225
Magnesium sulfate and NaCl3.64 EUR/unit
Magnesium sulfate and C182.96 EUR/unit 0.001
Water 0.002218 EUR/L
Solid wastes0.17 EUR/kg
Liquid effluents1.7748 EUR/m3 0.010.01495
NaHPO487.5 EUR/kg2.93 × 10−70.000322.95 × 10−5
Column (silica)760.08 EUR/unit 0.000010.04
Propylene0.0048 EUR/unit 0.0001346671
Carbon paper0.4543 EUR/cm20.035
Maintenance (EUR) 0.00330.3125
Costs—Subtotal (EUR) 0.0159000.0179936.58712
Costs—Total (EUR) 0.0338936.58712
Publisher’s Note: MDPI stays neutral with regard to jurisdictional claims in published maps and institutional affiliations.

