1. Introduction
A more efficient form of working can achieve higher output under the same resource constraints, which is a more resource-saving and sustainable way. The emergence of new business modes attempts to utilize new technologies to make traditional markets more efficient. Among them, online ride-hailing services, a new business model that leverages both mobile internet technology and matching algorithms, are developing at an unprecedented rate around the world. From the perspective of resource utilization, online-ride-hailing services may bring some changes in the following aspects. Firstly, the fact that the vehicles can be private cars and the drivers can work part-time may improve the utilization efficiency. Secondly, all orders are received online, which may achieve higher matching efficiency than street searching to satisfy more customer demand and reduce the driver’s working time or driving distance. Thirdly, carpooling services provided by online ride-hailing can improve vehicle utilization by increasing the number of passengers per vehicle. Fourthly, according to some regulations in China, online ride-hailing vehicles must be new energy vehicles, which may reduce the use of fossil fuels in public transportation to achieve sustainable development.
However, the role of the online ride-hailing service mode in terms of innovation and the impact the service mode brings remains debatable. Many people consider that it has brought about “disruptive” changes [
1,
2], while others argue that the disruptor should be a continuous innovator seeking to expand the market and improve traditional taxi services, but online ride-hailing has not yet done so [
3]. Our work focuses on answering the question “Does the online ride-hailing platform using internet technology significantly improve efficiency?” and gives an empirical result using data from the Shanghai taxi market. If the answer is significantly positive, it can be supposed that online ride-hailing mode indeed “causes disruptive changes in the taxi business” in terms of labor supply. Considering the energy consumption and pollution generated by public transport, a more efficient way of transport indicates more resource-saving and sustainable development, and thus should be worth encouraging and promoting. If the answer is no, the innovation of online ride-hailing may be exaggerated.
Shanghai is taken as an example to answer the questions mentioned above. In China’s taxi market, online ride-hailing vehicles and traditional cruising taxis have been competing fiercely with each other. We use a random sample of Shanghai-based taxi drivers within a week in 2019. The market share of online ride-hailing, and cruising taxis is approximately the same during the period, which can be treated as an ideal comparison scenario. We also use the data of cruising taxis from 2015 to 2019 for time dimension comparison. The results show that when the market shares of the two types are similar, the overall capacity utilization rate of online ride-hailing drivers is slightly higher than that of cruising taxi drivers. But it is mainly driven by part-time drivers, and there is no significant difference in the work efficiency of full-time drivers. What is more, the capacity utilization rate of cruising taxi drivers decreases with the decline of market share. Our results suggest that flexible work and market scale help improve capacity utilization, but there is little evidence to show that the online matching mechanisms play the same role.
From the perspective of an individual driver’s work efficiency, the empirical conclusion hardly suggests that full-time online ride-hailing drivers have significantly higher individual capacity utilization, which is similar to Cramer and Krueger’s study [
4] of New York. The main reason could be that online matching and street searching can achieve similar efficiency in Shanghai and New York. However, from the perspective of supply and demand matching, online ride-hailing creates a much more flexible supply and is more adaptable to the changes in demand, improving the overall taxi market efficiency.
The potential contributions of this paper are as follows: Firstly, it is based on Cramer and Krueger [
4] and expanded in several aspects: (1) We introduce a longitudinal comparison over time. (2) We use trip-level data to verify the effectiveness of several mechanisms potentially affecting capacity utilization. In particular, we point out that the role of online matching needs to be validated by comparing cruising taxi drivers to full-time online ride-hailing drivers rather than the overall online ride-hailing drivers’ group. Because part-time drivers often work only for a few orders or during peak demand periods, during which the capacity utilization rate is naturally high. (3) We try to enrich the concept of efficiency not only with respect to the individual labor supply but also with respect to the total labor supply. Secondly, current literature relating to ride-sourcing mainly concentrates on the US market, despite the fact that China has become the largest market for ride-sourcing in the world. There is still a lack of relevant research in China, especially empirical research using first-hand trip-level datasets of both types of drivers simultaneously. This paper fills the void with this part and gives evidence of the ride-sourcing market in a developing country.
The paper proceeds as follows.
Section 2 outlines the literature review,
Section 3 details the hypothesis, and
Section 4 is the data description.
Section 5 and
Section 6 compare the capacity utilization rate and dynamic changes in labor supply, respectively.
Section 7 and
Section 8 present the conclusion and discussion.
2. Literature Review
Online ride-hailing is a global phenomenon whose business model has quickly emerged in the literature over the last decade, with concepts such as sharing economy [
5,
6], platform economy [
7], digital economy [
8], and gig economy [
9,
10]. Employment issues [
11], consumer welfare [
12], safety and security issues [
13,
14], and economic regulation [
15] are examples of related topics.
In terms of labor supply, which is closely relevant to this article, a number of studies have sprung up. Taxi drivers are different from common occupations with fixed wages and working hours. Faced with fluctuating wages, they can make decisions on their own, including when to work and whether to work. Therefore, they are often regarded as ideal subjects in labor economics [
16,
17,
18,
19,
20,
21,
22,
23,
24]. Compared with traditional taxi drivers, the wages of online ride-haling drivers are more volatile, and they enjoy more freedom. Therefore, the taxi market is a suitable object to study labor supply.
As for the impact of online ride-hailing on the labor supply model, most studies have used the term “disruptive”. A typical example is Cramer and Krueger [
4], who discussed the effect of ride-sourcing on individual work efficiency. From the data of cruising taxis and Uber in Boston, Los Angeles, New York, San Francisco, and Seattle, they pointed out that online ride-hailing causes “disruptive change in the taxi business”, because Uber has greatly improved the utilization rate of capacity in the taxi market except in New York. Kim et al. [
25] pointed out that under the impact of the new model, drivers in the traditional taxi industry actively responded to the threat and changed their labor supply behavior by increasing geographical coverage and serving previously neglected customers, to maintain market share and income. Changes in the market have brought great benefits to consumers. In short, “the sharing economy has transformed the existing market in a positive and welfare-enhancing way”.
Among the benefits brought by online ride-hailing, besides the efficiency discussed above, flexibility is often mentioned. Chen et al. [
26] proposed that the value of flexibility can be measured by deriving from time variation in the drivers’ reservation wage. They estimated the surplus and labor supply implications of Uber relative to alternative, less-flexible work arrangements. They found that drivers earn more than twice the surplus they would in less-flexible arrangements. In addition to the impact of “flexible work” on income, that on well-being has been taken into account. Berger et al. [
9] used administrative data from Uber and a representative survey of London drivers to provide suggestive evidence showing that drivers who emphasized flexibility as an important motivation to join Uber also reported higher subjective well-being, which highlighted the importance of non-monetary factors in shaping the welfare of workers in the gig economy. What’s more, Burtch et al. [
27] examined the entry of the ridesharing platform UberX into local areas and verified that gig-economy platforms offered viable employment for the unemployed and underemployed, therefore predominantly reducing lower-quality entrepreneurial activity.
In most literature and media reports, online ride-hailing is widely painted as a disruptive and revolutionary change in the taxi market. However, Button [
3] believed that the role of ridesourcing had been grossly exaggerated, and it was not a disruptive innovation. Button [
3] reviewed the economic research of ridesourcing (or app-based ride-hailing), which was also called “Ubernomics” for the fact that ridesourcing was dominated by Uber, with a particular focus on the US. He concluded that the success of Uber was largely due to the fact that the traditional taxi market was regulated by price and market access, which largely limited their innovation ability and incentive. Uber just “escaped” the regulation, rather than consciously entering the market with higher profits. He agreed with Gabel [
28] that Uber was initially a rent seeker, circumventing regulation over very similar products and in particular over taxi drivers.
Inspired by Cramer and Krueger’s work [
4], which pointed out that online ride-hailing caused “disruptive change in the taxi business” through the data of the United States, our work is to discuss whether this kind of “disruptive change” has happened in the labor supply of China’s taxi market and give evidence of the developing country. There are some data limitations in their study. For example, they could not get information on whether the online ride-hailing drivers used different platforms at the same time. In addition, the cruising taxi samples were distributed in various periods, with at least one year before the online ride-hailing sample. The mismatch of the samples may affect the conclusions. We overcome the defects by using samples from Shanghai. Furthermore, we consider that Cramer and Krueger [
4] can be expanded from several perspectives: (1) Mechanisms affecting capacity utilization can be discussed and verified by data, (2) full-time drivers instead of all online ride-hailing drivers should be used in the comparison with cruising drivers to test whether the online matching mechanism improves efficiency, and (3) aside from the utilization rate of transport capacity as the embodiment of efficiency, the change in total market supply and demand can also bring Pareto improvement/loss to change the overall efficiency of the market.
3. Hypothesis
3.1. Main Hypothesis
The rapid development of online ride-hailing has had a great impact on the traditional taxi market. It is not only reflected by the lower and lower market share of cruising taxis, but also by the gradual decline of cruising taxi drivers and their transition to online ride-hailing drivers. Taking Shanghai as an example, according to the data of its transportation department, the proportion of the entire taxi market in the public transport passenger volume has remained stable from 16.94% in 2013 to 16.55% in 2019. Meanwhile, the number of cruising taxi drivers decreased from 125 thousand in 2013 to 87 thousand in 2019, a drop of 30% in six years. The number of local applicants for cruising taxi driver’s qualifications also decreased significantly, from 3474 in 2013 to 451 in 2018, a drop of 85% in six years. The evidence shows that the attraction of being a cruising taxi driver is much less than that of being an online ride-hailing driver.
If the driver decides rationally, he/she would like to choose the more effective form of work, that is, a higher income when total working hours are certain. The decline of cruising taxi drivers may be due to the generally accepted sense that online ride-hailing is a more efficient way of working. We use capacity utilization, that is, the proportion of time/mileage carrying passengers to the total working time/mileage, as a measure of work efficiency. Therefore, we propose Hypothesis 1:
H1. The overall capacity utilization of online ride-hailing drivers > the overall capacity utilization of cruising taxi drivers.
3.2. Mechanism Analysis
Assuming that the average work experience and service quality of the two types of drivers are similar, and they compete in the same market, there may be several channels that affect the utilization rate of transport capacity. Cramer and Krueger [
4] pointed out that the higher capacity utilization of UberX drivers may come from (1) Uber’s more efficient driver-passenger matching technology; (2) the larger scale of Uber, which supported faster matching; (3) inefficient taxi regulations; and (4) Uber’s flexible labor supply model and surge pricing, which made the supply and demand of the whole region more matched. Among them, the regulation factor is considerably complex and may include many aspects, including total amount control, price control, rent system, and so on. Therefore, we extend the discussion of “regulations” in the conclusion part. In this part, we talk about the possible impact of the other three specific mechanisms.
- (1)
Online Matching
The online matching mechanism can match the nearest passenger and driver algorithmically in real-time [
3]. Online ride-hailing vehicles find passengers only by online matching while cruising taxi drivers can use online apps or cruise on the street to search for passengers.
Among ridesourcing drivers, there are both full-time drivers with long working hours and part-time drivers with short working hours. Only the full-time drivers have similar performance to their cruising counterparts in terms of working hours. If online matching is a more efficient way to increase the capacity utilization rate of full-time online ride-hailing drivers, it may be higher than that of cruising taxi drivers. Therefore, we propose Hypothesis 2:
H2. The capacity utilization rate of full-time online ride-hailing drivers > the capacity utilization rate of cruising taxi drivers.
- (2)
Market Size
The scale effect is a well-known economic law that also applies to the taxi industry. Because if a certain type of taxi service is more widely consumed, it would be easier for drivers to find passengers. The reduction of search time would lead to an improvement in the capacity utilization rate. Despite the lack of data on online ride-hailing year-wise, we have obtained that of cruising taxis with the declining market share, we put forward Hypothesis 3:
H3. With the decline of market share of cruising taxis, the capacity utilization rate of cruising taxi drivers decreases.
- (3)
Flexible Work
Flexibility is one of the benefits that drivers get from the online ride-hailing mode in the labor supply [
9,
26,
27]. Short and medium-term contracts or freelancers (usually part-time) are common; therefore, the overall supply curve of online ride-hailing services is relatively flexible [
29,
30]. Part-time drivers often choose to join the market in the period of high-capacity utilization, which leads to an improvement in capacity utilization rate. Therefore, we propose Hypothesis 4:
H4. The capacity utilization rate of part-time online ride-hailing drivers > the capacity utilization rate of cruising taxi drivers.
4. Data
4.1. Data Background
Since Uber was founded in the United States in 2009, online ride-hailing has developed rapidly all over the world. However, it has also been banned repeatedly in many countries and regions, even in some states of the United States. China is one of the first countries in the world to recognize the legal status of online ride-hailing, which has promoted the rapid development of the new taxi model. In March 2012, the first taxi online booking software, “Yaoyao”, appeared in China. In February 2014, Uber, the world-famous online ride-hailing service, entered the Chinese market. On October 8, 2015, the Shanghai Municipal Transportation Commission issued the first domestic online ride-hailing platform license to Didi, a Chinese company. In July 2016, Chinese National Transportation Department issued “The Guiding Opinions on Deepening Reform and Promoting the Healthy Development of the Taxi Industry” and the “Interim Measures for the Management of Online Ride-Hailing Vehicle Operation and Service”, which standardized online ride-hailing. The Chinese government presents a relatively open attitude towards the development of online ride-hailing.
As for Shanghai, taxis have appeared since the beginning of the 20th century. Online ride-hailing entered the Shanghai market in 2012 and has since become an alternative service to cruising taxis. Since then, the market share of online ride-hailing has been increasing and is gradually crowding out that of cruising taxis. According to the Annual Report of Transportation issued by the Shanghai Urban and Rural Construction and Transportation Development Research Institute, from 2017 to 2019, the taxi industry accounted for 14.60%, 14.53%, and 16.55% of passengers in public traffic, respectively, in Shanghai. The average daily passenger volume of cruising taxis was 2.08 million, 1.747 million, and 1.586 million, respectively. Meanwhile, the average daily passenger volume of online ride hailing was 0.054, 1.586, and 1.7 million. The proportion of online ride hailing in taxi passenger volume was 20.61%, 37.54%, and 51.73%. It can be seen that the market share of online taxi hailing was small before 2017 but developed rapidly after 2017. In 2019, the market share of online ride-hailing was close to and has exceeded that of cruising taxis and has boosted the overall passenger volume in the taxi market.
4.2. Data Collection
The data we use are the trip records of Shanghai online ride-hailing and cruising taxi drivers from different sources. We have sought cooperation with Shanghai’s transportation department and taxi enterprises. The transportation department routinely archives vehicle operating data of all taxi enterprises in the city, including that of online ride-hailing companies, for the convenience of supervision, and provides a sample to us for academic research after random sampling and desensitization. In addition, a cruising taxi company with a comparatively large market share also offers us data support.
Specifically, the dataset of online car-hailing drivers comes from a random sample made by the transportation department, containing only one-week records in Shanghai in 2019. As for cruising taxi drivers, the data ranges from 2015 to 2019. The data for 2015–2017 is from one of the biggest taxi companies in Shanghai, which has complete three-year records of all drivers but inevitably has the firm’s characteristics. The data for 2018 and 2019 is from the transportation department, which is a random sample of taxi drivers in Shanghai. In our dataset, we can match the data of cruising taxi drivers and online car-hailing drivers in the same week of 2019 to make it possible to compare between the two types at the same time.
A trip is a whole process from the time the driver picks up the passengers from the place of departure to the time they reach the destination. The information from all trips is automatically recorded in the database. The information of cruising taxi drivers from 2015 to 2017 includes the driver ID, car ID, start time, end time, income, driving kilometers carrying passengers, and driving kilometers without passengers from the end of the previous trip to the beginning of this trip, as shown in
Table 1. However, the trip records of cruising taxi drivers in 2018 and 2019 and online car-hailing drivers in 2019 lack information on driving kilometers without passengers.
4.3. Shift Definition
For the daily work of the drivers, only a portion of their time is used for a trip. Searching for passengers and taking a short rest between trips constitute a part of their routine. It is necessary to summarize the successive trips’ information to identify the labor supply of the drivers. Generally, existing studies usually call the complete process of the taxi driver’s labor supply a shift. However, the beginning and end of work are often not directly identifiable in the raw data. In previous studies on the labor supply of taxi drivers, some data included information about the beginning and end of every trip or the shift time [
16]. Other data only includes the records of all trips without information about the shift [
22]. Especially after the popularity of electronic records, the latter situation is more common. The data we use is similar to the New York taxi driver data used by Farber [
22]. We followed the method of Farber [
22] and treated the interval between two trips greater than 6 h as the standard of the two shifts.
4.4. Full-Time and Part-Time Drivers
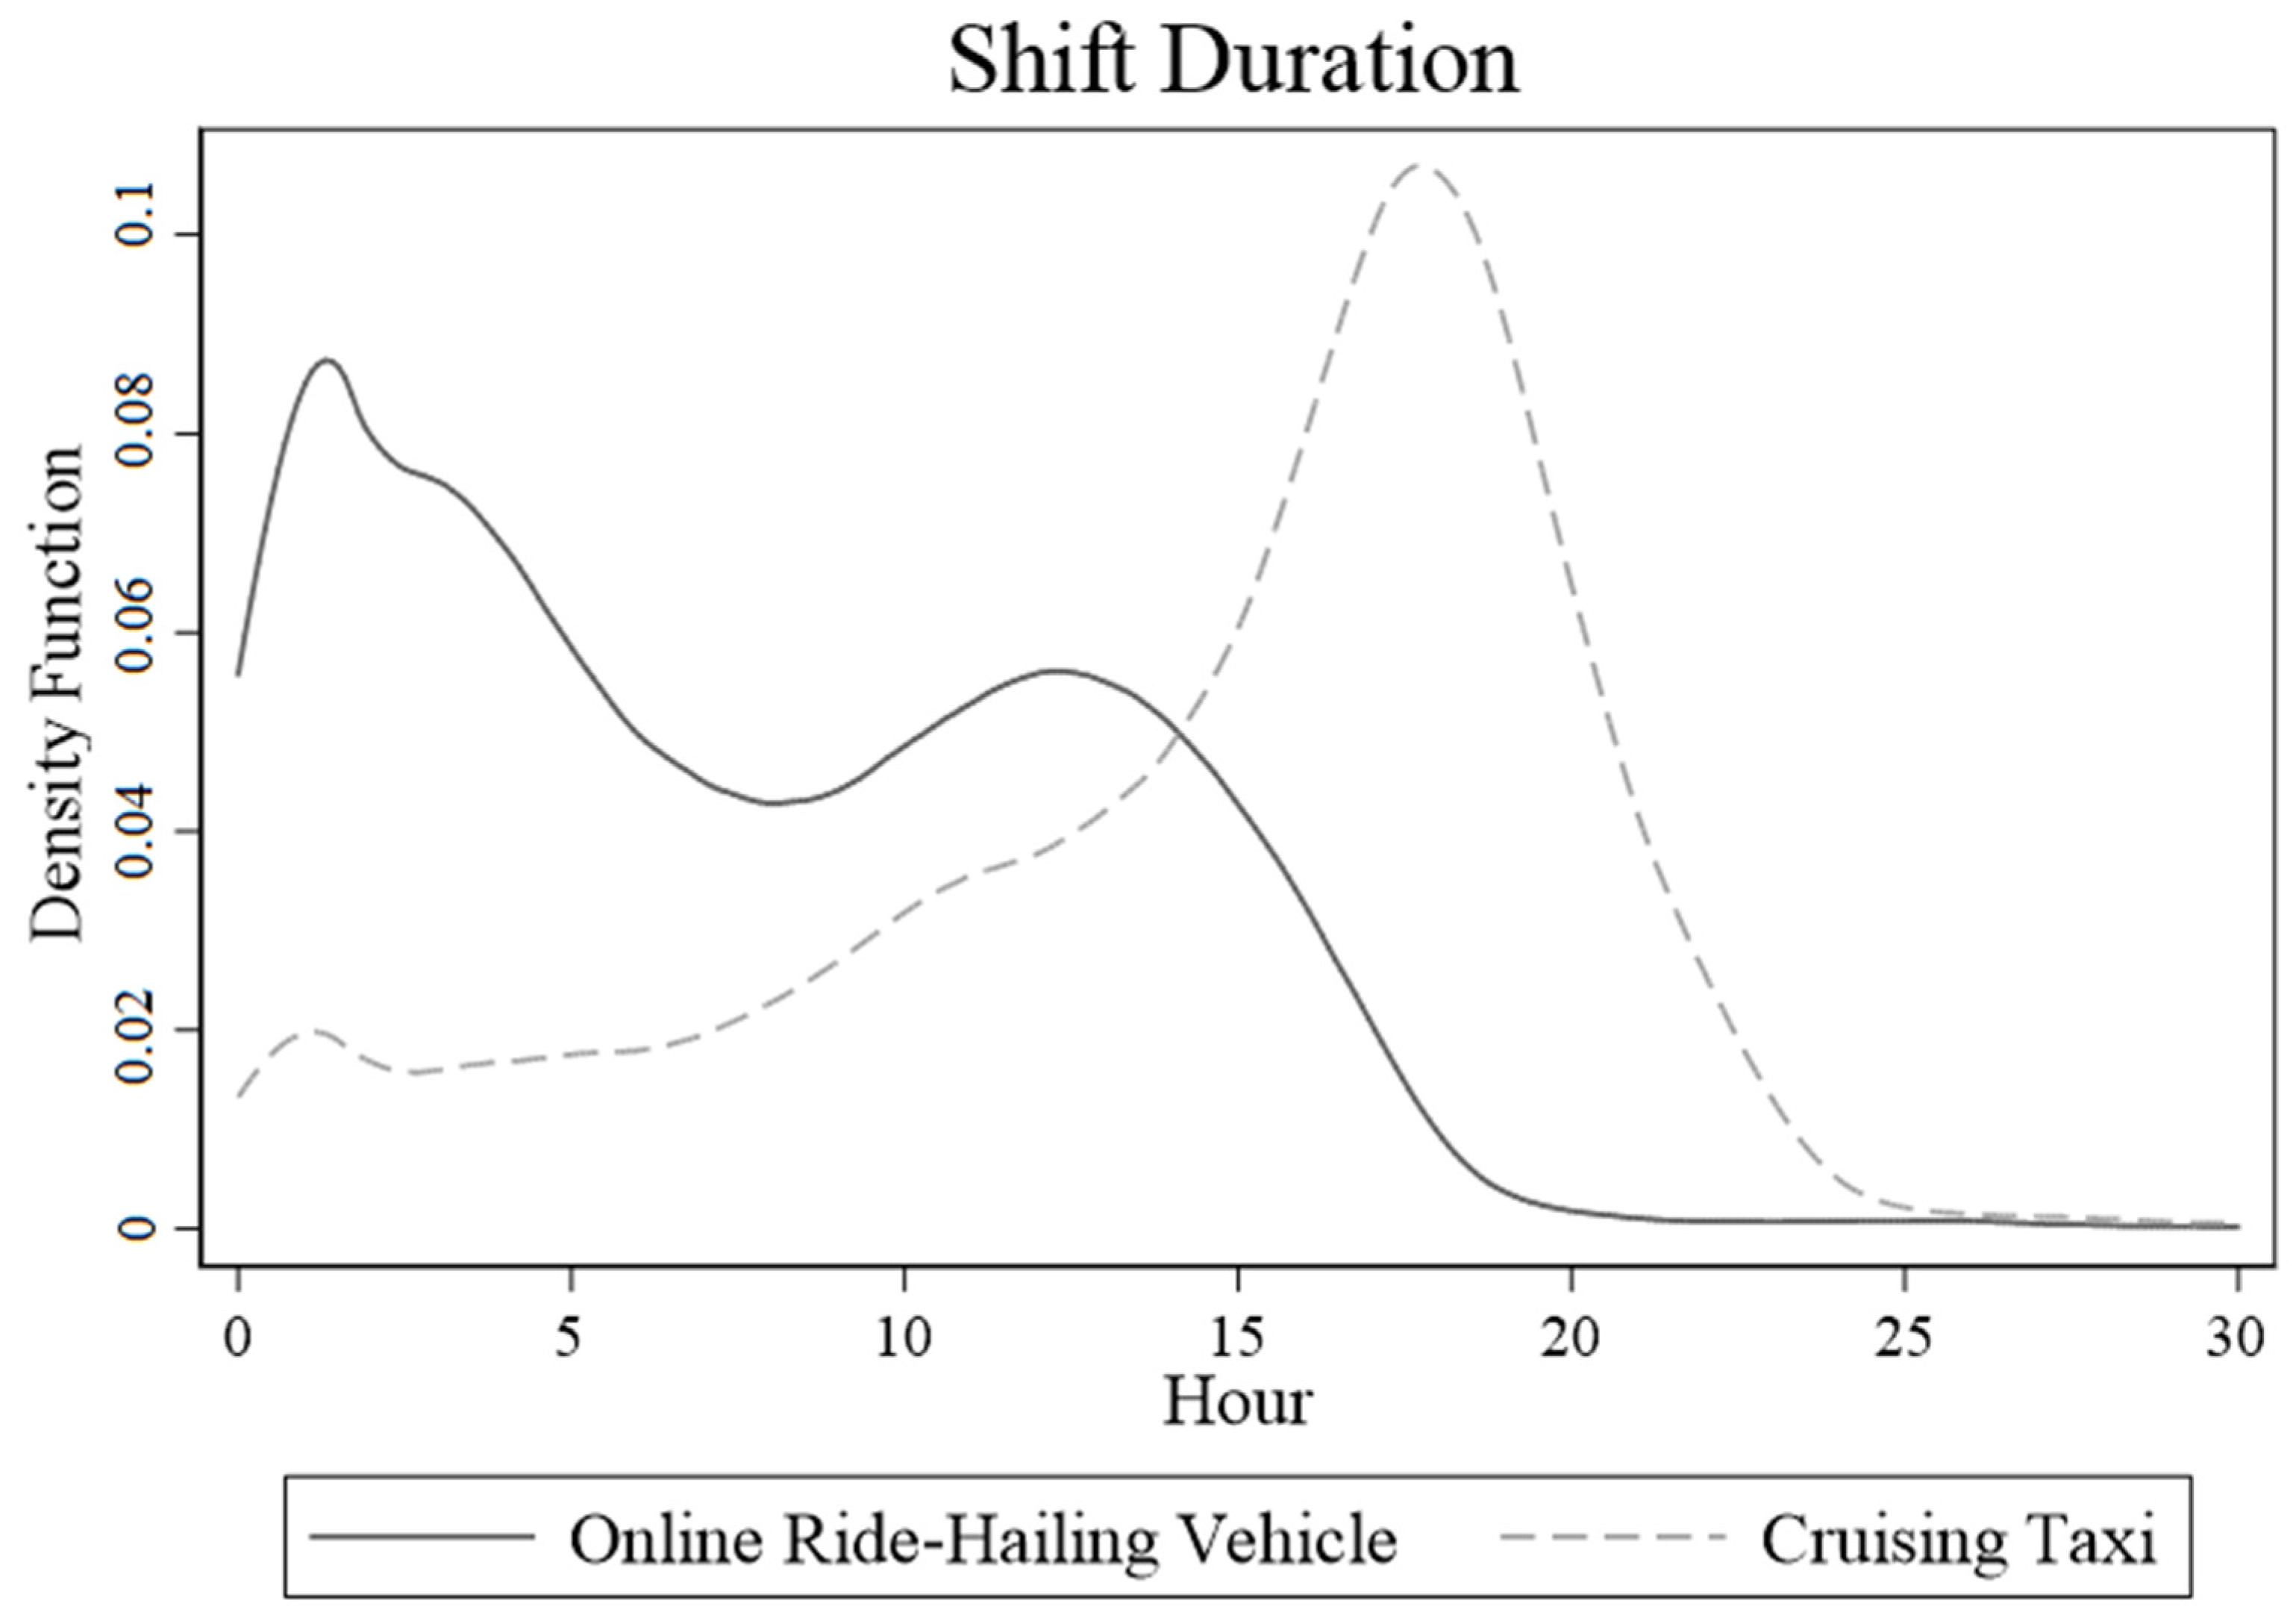
We compare the two types of drivers from the duration of shifts. The distribution of shift duration is shown in
Figure 1. There are two peaks for online ride-hailing drivers; one is between 0–5 h and the other is between 10–15 h. However, there is only one peak for cruising taxi drivers, which is between 17–18 h. The shift duration of online ride-hailing drivers is mainly shorter than that of cruising taxi drivers, and they have more peaks. From
Figure 1, we can find that full-time drivers always work more than 10 h while part-time drivers usually work less than 5 h. In contrast, most cruising taxi drivers work more than 10 h, even close to 20 h.
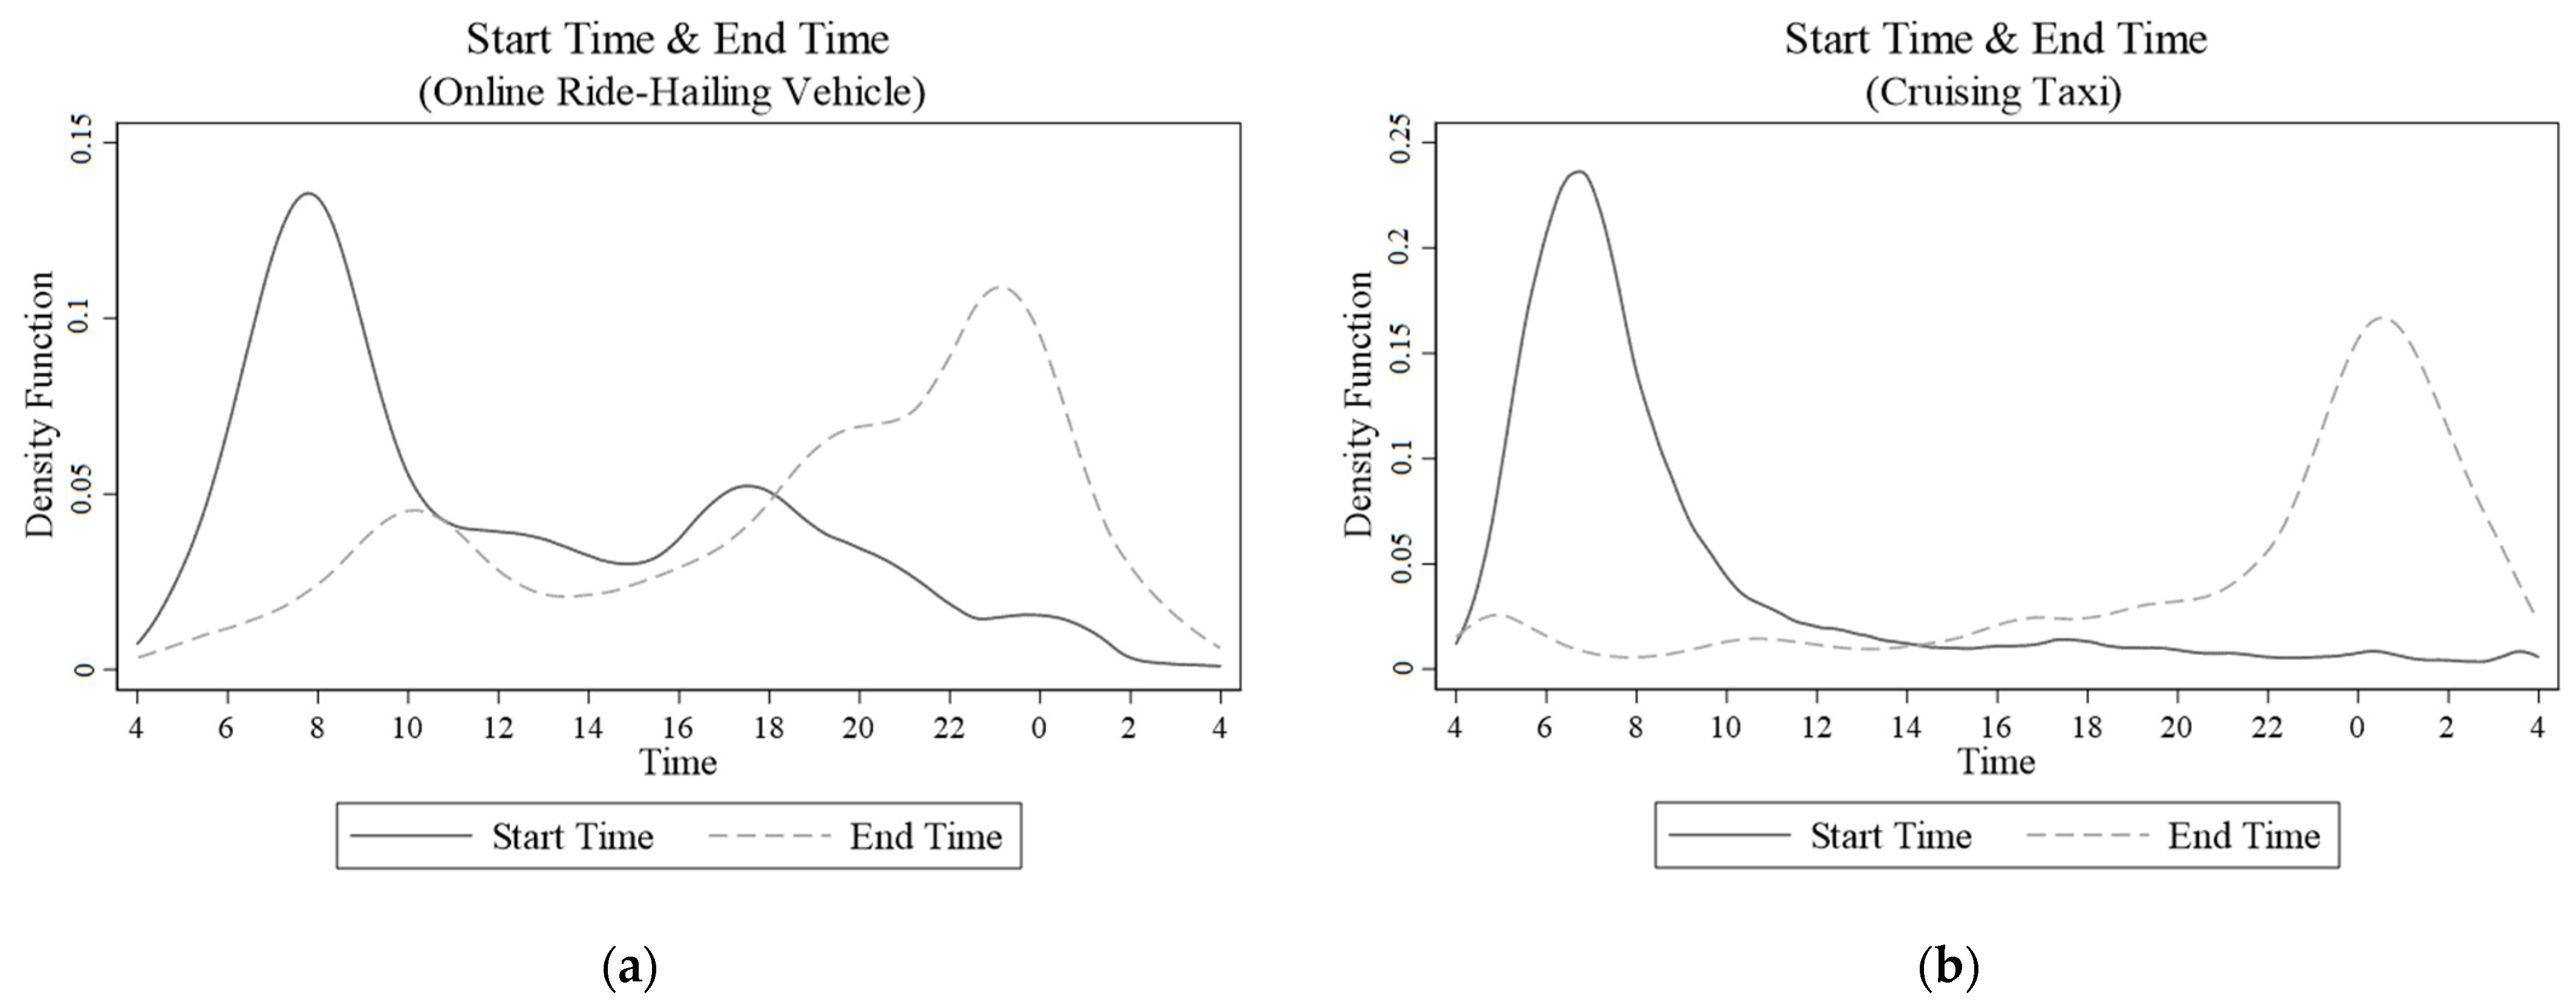
In addition to the difference in shift duration, we further consider the differences in the distribution of shift start time and end time, as shown in
Figure 2. Panel A shows the distribution of online ride-hailing drivers. The peak of the start time occurs around 8:00 and 17:00, corresponding to the start of the morning and evening demand peaks. The peak of the end time occurs around 10:00 and 24:00, corresponding to the end of the morning and evening demand peaks. More drivers start working before the morning peak than before the evening peak, and more drivers end working after the evening peak than after the morning peak. The results further indicate that full-time drivers go to work early and return late, but there are a significant number of part-time drivers in online ride-hailing who temporarily supplement the taxi market in the peak hours. Panel B shows the cruising taxis. There is only one obvious peak in the distribution of shift start and end times. The peak start time appears around 7:00 and the end time appears around 24:00.
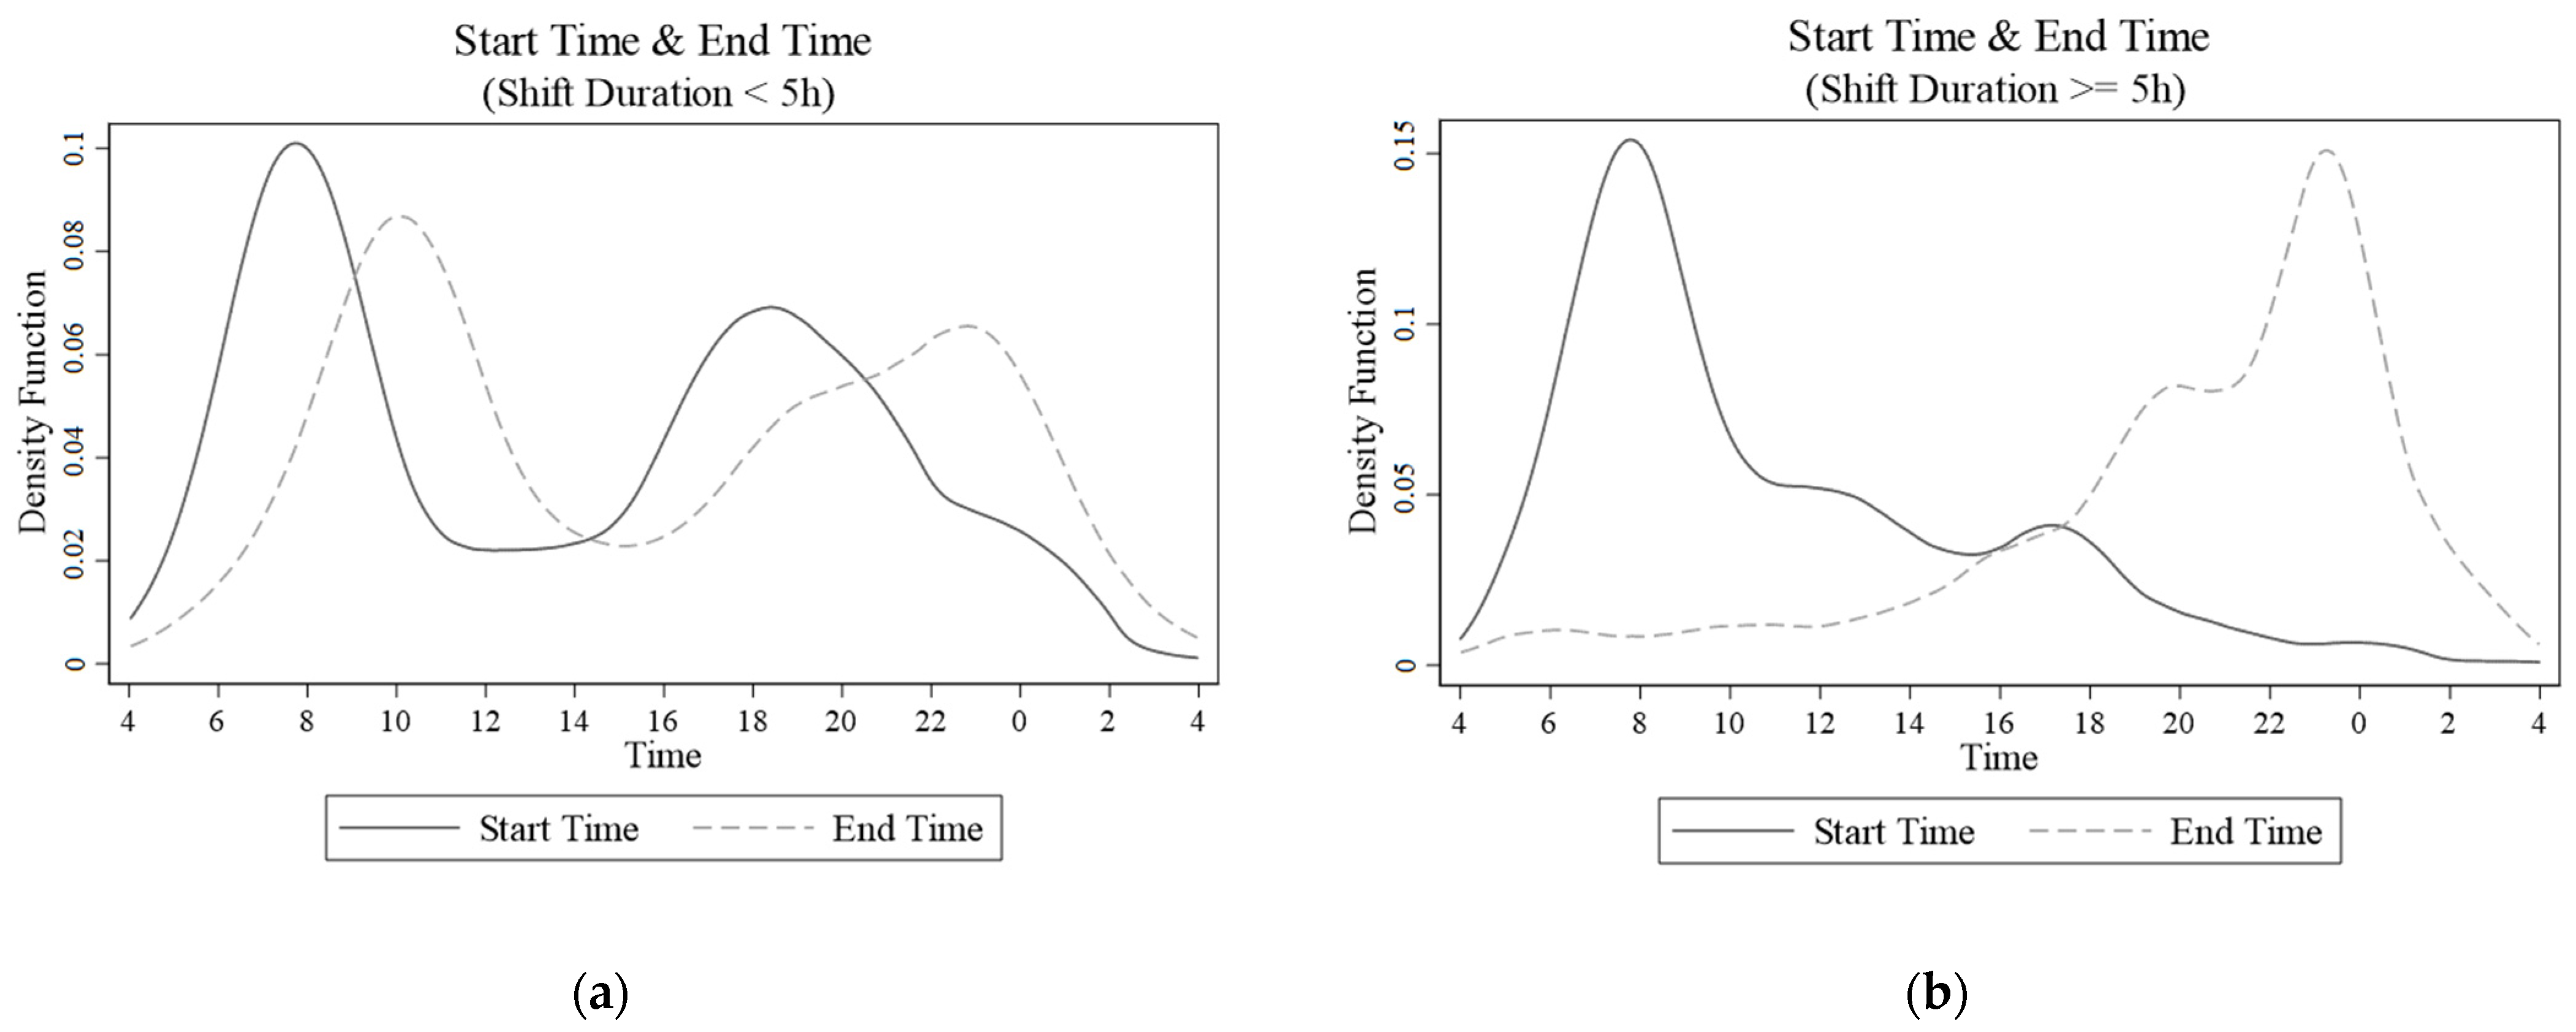
Further, we distinguish between online ride-hailing shifts with a duration of less than 5 h and those with a duration equal to or more than 5 h. The distribution of shift start time and end time is shown in
Figure 2. In the
Figure 3 on the left, there are more obvious double peaks for shifts with a duration of less than 5 h, corresponding to drivers entering before and exiting after the market in the peak demand periods. Shifts lasting 5 h or more are shown on the right, which is more similar to that of cruising taxi drivers. It confirms the existence of part-time and full-time drivers in online ride-hailing.
5. Comparison of Work Efficiency
5.1. Efficiency Index Construction
First, we discuss work efficiency at an individual level. In fact, cruising taxi drivers can also use an online app at work. According to the survey by the Shanghai Road Transport Bureau, 47% of the cruising taxi drivers used the network mode in 2019, which was lower than in previous years. Since more than half of traditional taxi drivers still do not use these apps, the online matching mode has limited impact on them. Therefore, we can compare the work efficiency of the two types of drivers to reflect the role of the online matching method.
The working process of drivers can be mainly divided into searching for passengers, carrying passengers, and temporary resting, all of which will cost time and gasoline. However, only the part carrying passengers can bring revenue to the driver. Work efficiency should be reflected in the proportion of effective work in the whole shift, which can be measured by the hours/kilometers of carrying passengers in the whole working process. The higher the proportion, the higher the driver’s income and the more services provided for passengers under certain working hours.
We refer to the indicator constructed by Cramer and Krueger [
4] for capacity utilization. Assuming that the total working hours and the hours carrying passengers for a given shift
i, is
Hi and
hi. respectively, and the sample contains a total of N shifts. Then the average capacity utilization rate measured by the working hours (or the hour utilization rate) is as follows.
Specifically,
represents the capacity utilization rate of shift
i. If the data at the individual level of each driver is not available, but the aggregated level of all the shifts is available, the hour utilization rate
fh can be updated by
Fh.
In Equation (2),
indicates the percentage of hours worked by shift
i to the total working hours of all shifts. In the same way, the capacity utilization rate measured by distance (or mileage utilization rate) can be constructed by the total mileage traveled by drivers in each shift,
Di and the mileage carrying passengers
di.
In Equation (4), represents the ratio of the working hours of shift i to the total working hours of all shifts. fd and Fd are calculated similarly to fh and Fh, but from the perspective of working distance instead of working hours. In addition, if the condition of is satisfied, will hold.
In general, the capacity utilization rate measured by mileage is usually higher than that measured by the hour. This is due to the fact when drivers search for passengers between trips, they generally reduce speed to search, stop and wait for passengers, or stop to rest. These behaviors will make the hourly utilization rate higher than the mileage utilization rate. In Cramer and Krueger [
4],
Hi and
Di are determined by the opening time of the online car-hailing app, which is similar to the concept of shift we use. Due to the lack of such information, we use the total working hours and mileage of the shift to represent
Hi and
Di.
5.2. Comparison of the Two Types
5.2.1. Overall Comparison
This part compares the capacity utilization of all online ride-hailing drivers and cruising taxi drivers constructed through shift-level data, as shown in
Table 2. Data for online ride-hailing drivers are from one week in 2019, with a sample size of 14,116, and data for cruising drivers are from the same week in 2019 and 2018, with a sample size of 16,961 and 21,287. The driver’s mileage utilization rate during this period could not be calculated due to the lack of information on mileage without carrying passengers. The data used by Cramer and Krueger [
4] for cruising taxi drivers was one year earlier than that of the drivers. Hence, in their comparison, time may have contributed to the difference between Uber and taxi drivers and could not be excluded due to data quality. The contemporaneous data in 2019 we use here, which were generated when the market shares of the two types of taxis were similar, is more ideal for making two types of comparison.
Firstly, in 2019, whether it is calculated in fh or Fh, the hour utilization rate of online ride-hailing drivers is higher than that of cruising taxi drivers, indicating that online ride-hailing has a higher overall work efficiency. Secondly, from 2018 to 2019, the hour utilization rate of cruising taxi drivers has experienced a significant decline, about 4.6% in terms of fh, and about 5.6% in terms of Fh. Thirdly, it is worth noting that in 2019, the hour utilization rate of online ride-hailing calculated in terms of fh was about 13.5% higher than that of cruising taxis, while that calculated in Fh was close to cruising taxis, and only 2.22% higher.
This comparison result verifies the hypothesis H1 that the overall capacity utilization of online ride-hailing drivers is higher than that of cruising taxi drivers. To explore the reasons, we further divide online ride-hailing drivers, that are more diverse, into groups and make a comparison in the next part.
5.2.2. Comparison of Full-Time and Part-Time Drivers
According to the shift characteristics of online ride-hailing and cruising taxis, there is a certain proportion of part-time drivers, which is reflected by the shorter shift duration. We “roughly” treat online ride-hailing drivers with shorter average shifts as part-time drivers and drivers with longer average shifts as full-time drivers. This is a very natural approach since part-time drivers spend most of their time in their main job and only do this work in their spare time, so the average working hours in the taxi market are significantly less than full-time drivers.
We have made two attempts at dividing part-time and full-time ride-hailing drivers. Firstly, according to the 30% and 70% quantiles of drivers’ average shift duration, the hour utilization rate of each group is shown in
Table 3 Secondly, according to drivers’ average shift duration of less than 5 h and greater than or equal to 5 h, the hour utilization rate of each group is shown in
Table 4. From both
Table 3 and
Table 4, the sample size of the full-time driver group is larger, and the hour utilization rate is lower, which is closer to the cruising taxi driver.
Firstly, since the grouping is based on the average shift duration of each driver, the number of drivers in the two groups whose average shift duration is less than 30% is the same as the number of drivers in the two groups whose average shift duration is greater than 70%. However, the latter has a larger sample size, indicating that full-time drivers not only work longer on average per shift, but also work more shifts in a week. Secondly, the higher average hour utilization rate of online ride-hailing drivers is mainly due to part-time drivers. Although the hour utilization rate of full-time ride-share drivers is still higher than that of cruising drivers, they are very close. Thirdly, Fh is significantly smaller than fh. This is mainly because part-time drivers with higher hour utilization have a weight of 1/N when calculating fh and a weight less than 1/N when calculating Fh. Due to the small proportion of part-time drivers, each part-time driver has fewer shifts, and the duration of each shift is also shorter. As a result, in calculating Fh is less than 1/N, which reduces the contribution to the calculation of the average duration utilization. Compared with the online ride-hailing drivers, the heterogeneity of the shift time of the cruising taxi drivers is smaller, so the fh and Fh will be much closer.
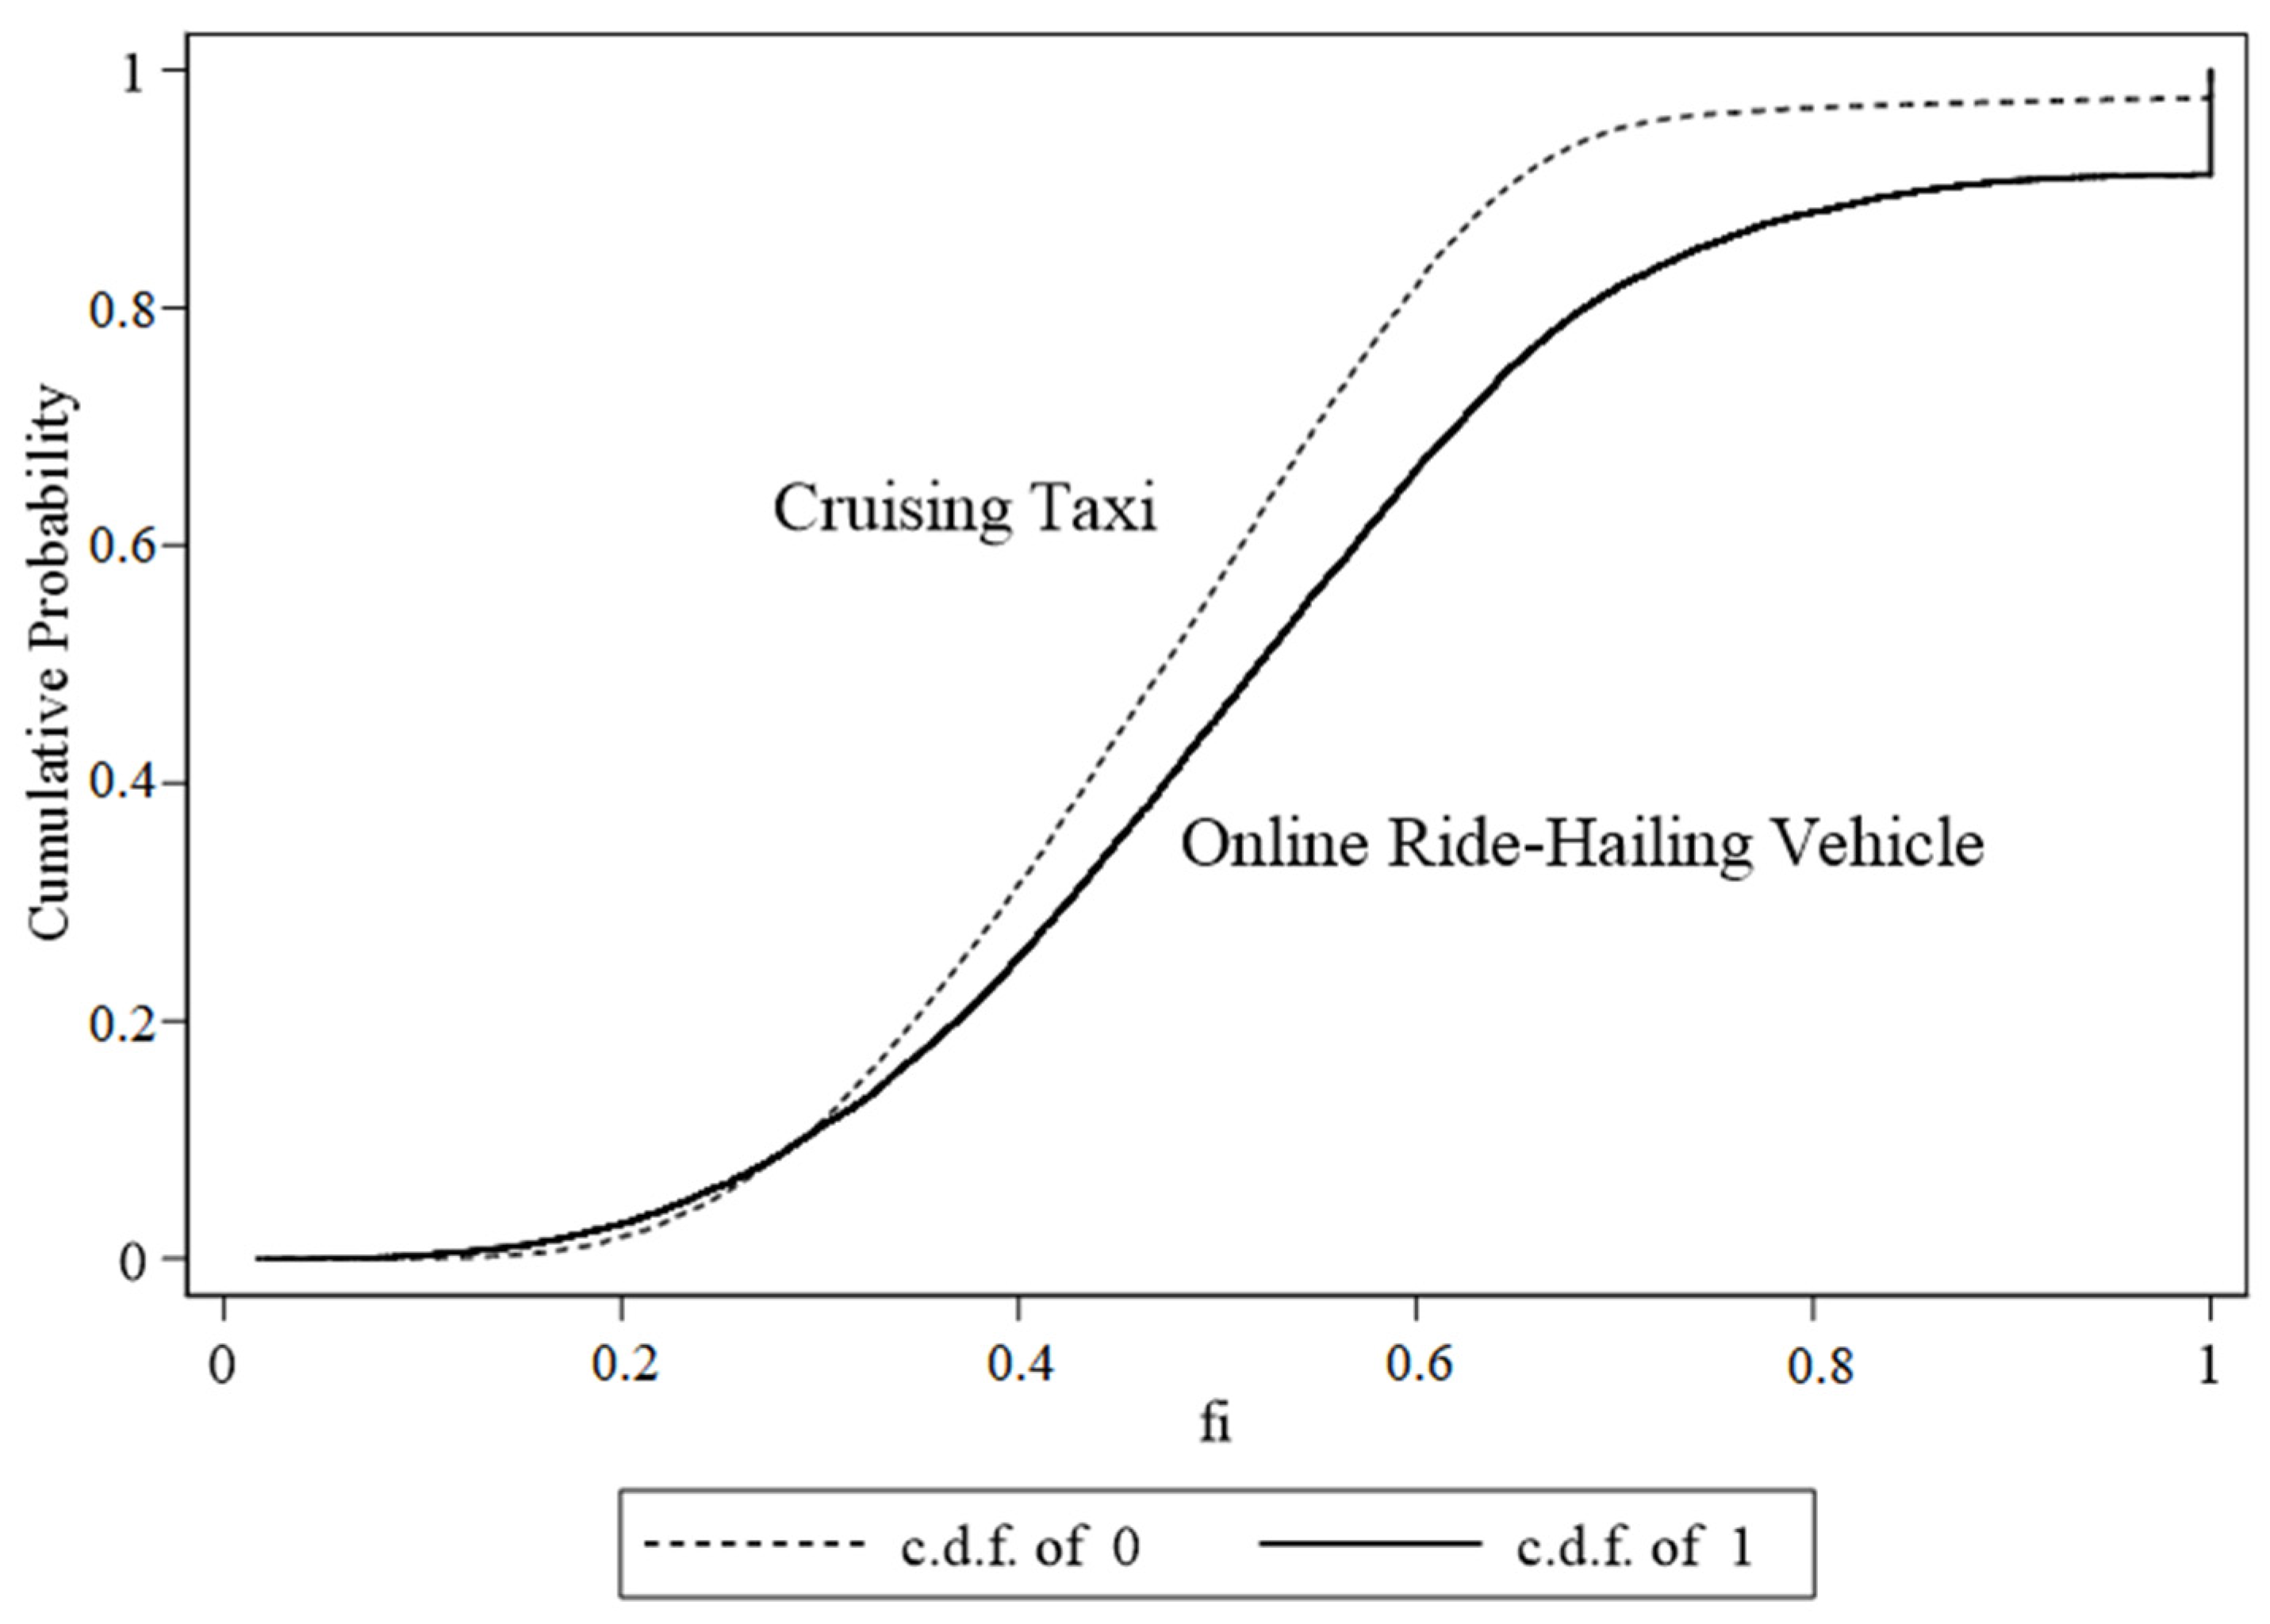
Figure 4 shows the cumulative distribution function of the hour utilization of the types of drivers randomly sampled in a week in 2019. Overall, the hour utilization rate of online ride-hailing drivers is higher than that of cruising taxi drivers, but there are some exceptions in the lowest 10% and the highest 10%.
In the part where the cumulative probability is less than 10%, the hourly utilization rate of the cruising taxi drivers is higher, which is mainly caused by the way the shift is defined in this paper. Due to the lack of information on the time when the driver is in the working state, this paper uses the trip interval of 6 h as the standard for division. Part-time ride-hailing drivers may only provide services during the morning and evening commute periods and do other jobs between these periods. If the interval time is less than 6 h, it will be included in the shift, resulting in an extremely low time utilization rate for some part-time drivers.
In addition, in the part where the cumulative probability is greater than 90%, the cumulative distribution function of online ride-hailing drivers increases rapidly in places where the hour utilization rate is 1, indicating that a certain proportion of online ride-hailing drivers are carrying passengers all the time during the shift. This is mainly caused by shifts containing only one trip or several consecutive uninterrupted trips. This situation is difficult to occur in a certain proportion among full-time drivers who have worked a long time, which further confirms the existence of part-time drivers and their role in increasing the overall capacity utilization rate of online ride hailing.
Based on the data analysis in this part, H4 that “the capacity utilization rate of part-time online ride-hailing drivers > the capacity utilization rate of cruising taxi drivers” is proved, while H2 that “the capacity utilization rate of full-time online ride-hailing drivers > the capacity utilization rate of cruising taxi drivers” is not verified. These results mean that the mechanism of flexible work contributes to the increase in the capacity utilization rate, while online matching does not.
5.3. Comparison of Cruising Taxi Drivers in Different Years
Cramer and Krueger [
4] pointed out that it was necessary to discuss the change in taxi driver capacity utilization before and after the entry of online car-hailing, but it was not realized due to the difficulty of data acquisition. The data used in this paper includes a five-year sample of cruising taxis from 2015 to 2019. The calculated hour and mileage utilization rates of cruising taxis are shown in
Table 5.
The data are all randomly sampled from the same week in each year. And there are no special holidays during the week, which can remove the influence of cyclical factors other than the year. However, the sampling scope of each year is not completely consistent. Specifically, the data from 2015 to 2017 comes from a cruising taxi company with a large market share, which may have the characteristics of the company’s operation efficiency and cannot reflect the characteristics of all drivers. The data for 2018 and 2019 are from cruising drivers in the whole city of Shanghai.
From 2015 to 2017, the change in capacity utilization rate is very small. The hourly utilization rate has decreased slightly, while the mileage utilization rate has hardly decreased. What’s more, fh and FH, fd, and FD are very close, indicating that the taxi drivers of this cruising taxi enterprise are more homogeneous than the online ride-hailing drivers discussed earlier. According to the Annual Report of Transportation issued by Shanghai Urban and Rural Construction and Transportation Development Research Institute, the average daily passenger volume of cruising taxis in Shanghai in 2017 was 2.08 million, and the number of online car-hailing was 0.54 million. From 2015 to 2017, the share of the online ride-hailing in Shanghai was still small. In terms of hour utilization and mileage utilization, the impact of online car-hailing on the market for cruising taxis was not strong in and before 2017.
From the data of 2018 and 2019, the hour utilization rate has decreased significantly, and the difference between fh and FH is greater, indicating that the heterogeneity of cruising taxi drivers is stronger than that of drivers in the same company. Twenty nine-teen is a special year. In that year, the market share of online ride-hailing became very close to that of cruising taxis and exceeded that of cruising taxis for the first time. The gradual increase of online ride-hailing market share should be the main reason for the decline of fh and FH.
In short, with the increase in the market share of online ride-hailing, the capacity utilization rate of cruising taxis gradually decreased, which was not obvious before 2017, but significant after 2017. According to the research data of the Shanghai Road Transportation Center, the mileage utilization rates of cruising vehicles in Shanghai from 2015 to 2019 were 64.54%, 62.53%, 63.86%, 62.11%, and 61.89, respectively, which confirms our conclusion. This result is in accordance with H3 that “with the decline of market share of cruising taxis, the capacity utilization rate of cruising taxi drivers decreases” and conforms to the mechanism of market size in the change of capacity utilization rate.
5.4. Comparison of Shanghai and New York
Based on the previous horizontal comparison of capacity utilization between the two types, and the vertical comparison of cruising taxi drivers in different years, it can be found that, with the gradual penetration of online ride-hailing in the taxi market the capacity utilization of traditional cruising taxis decreases due to market competition. The capacity utilization rate of online ride-hailing drivers is higher than that of cruising taxi drivers in 2019 when their market shares are similar and even higher than that of cruising taxi drivers in enterprises with a higher capacity utilization rate in the industry during 2015–2017 and when the market share of online ride-hailing is still small. However, the higher part mainly comes from part-time drivers. In fact, the capacity utilization rate of full-time drivers is actually very close to that of cruising taxi drivers. Without considering carpooling conditions, the capacity efficiency of full-time online ride-hailing in Shanghai has not been significantly improved compared with traditional taxis.
The online matching mechanism has little effect on the improvement of capacity utilization, which seems “counter-intuitive”. The result may originate from the similar metropolitan nature of both Shanghai and New York. In Cramer and Krueger’s [
4] study of Boston, Los Angeles, New York, San Francisco, and Seattle, New York was the only city where the utilization rate of cruising taxis and online ride-hailing were close. The of cruising taxis and online ride hailing was 48.3% and 50.9%, respectively, and the
Fh was 49.5% and 51.2%, respectively. In other cities, the utilization rate of cruising taxis was much lower than that of online ride-hailing, and both were lower than that of New York.
The capacity utilization rate
Fh they calculated in New York was very close to that we calculated in Shanghai. In addition, the values of
fh and
Fh were closer in their study. This could be because the online ride-hailing data they used came from UberX, the Uber cpany, and the heterogeneity was likely smaller than in the sample used in this paper, which included multiple online car-hailing platforms. Cramer and Krueger [
4] believed that the particularity of New York may lie in its higher population density compared with other big cities, which made “street waving” as efficient as online matching to match drivers and passengers.
6. Dynamic Changes of Labor Supply
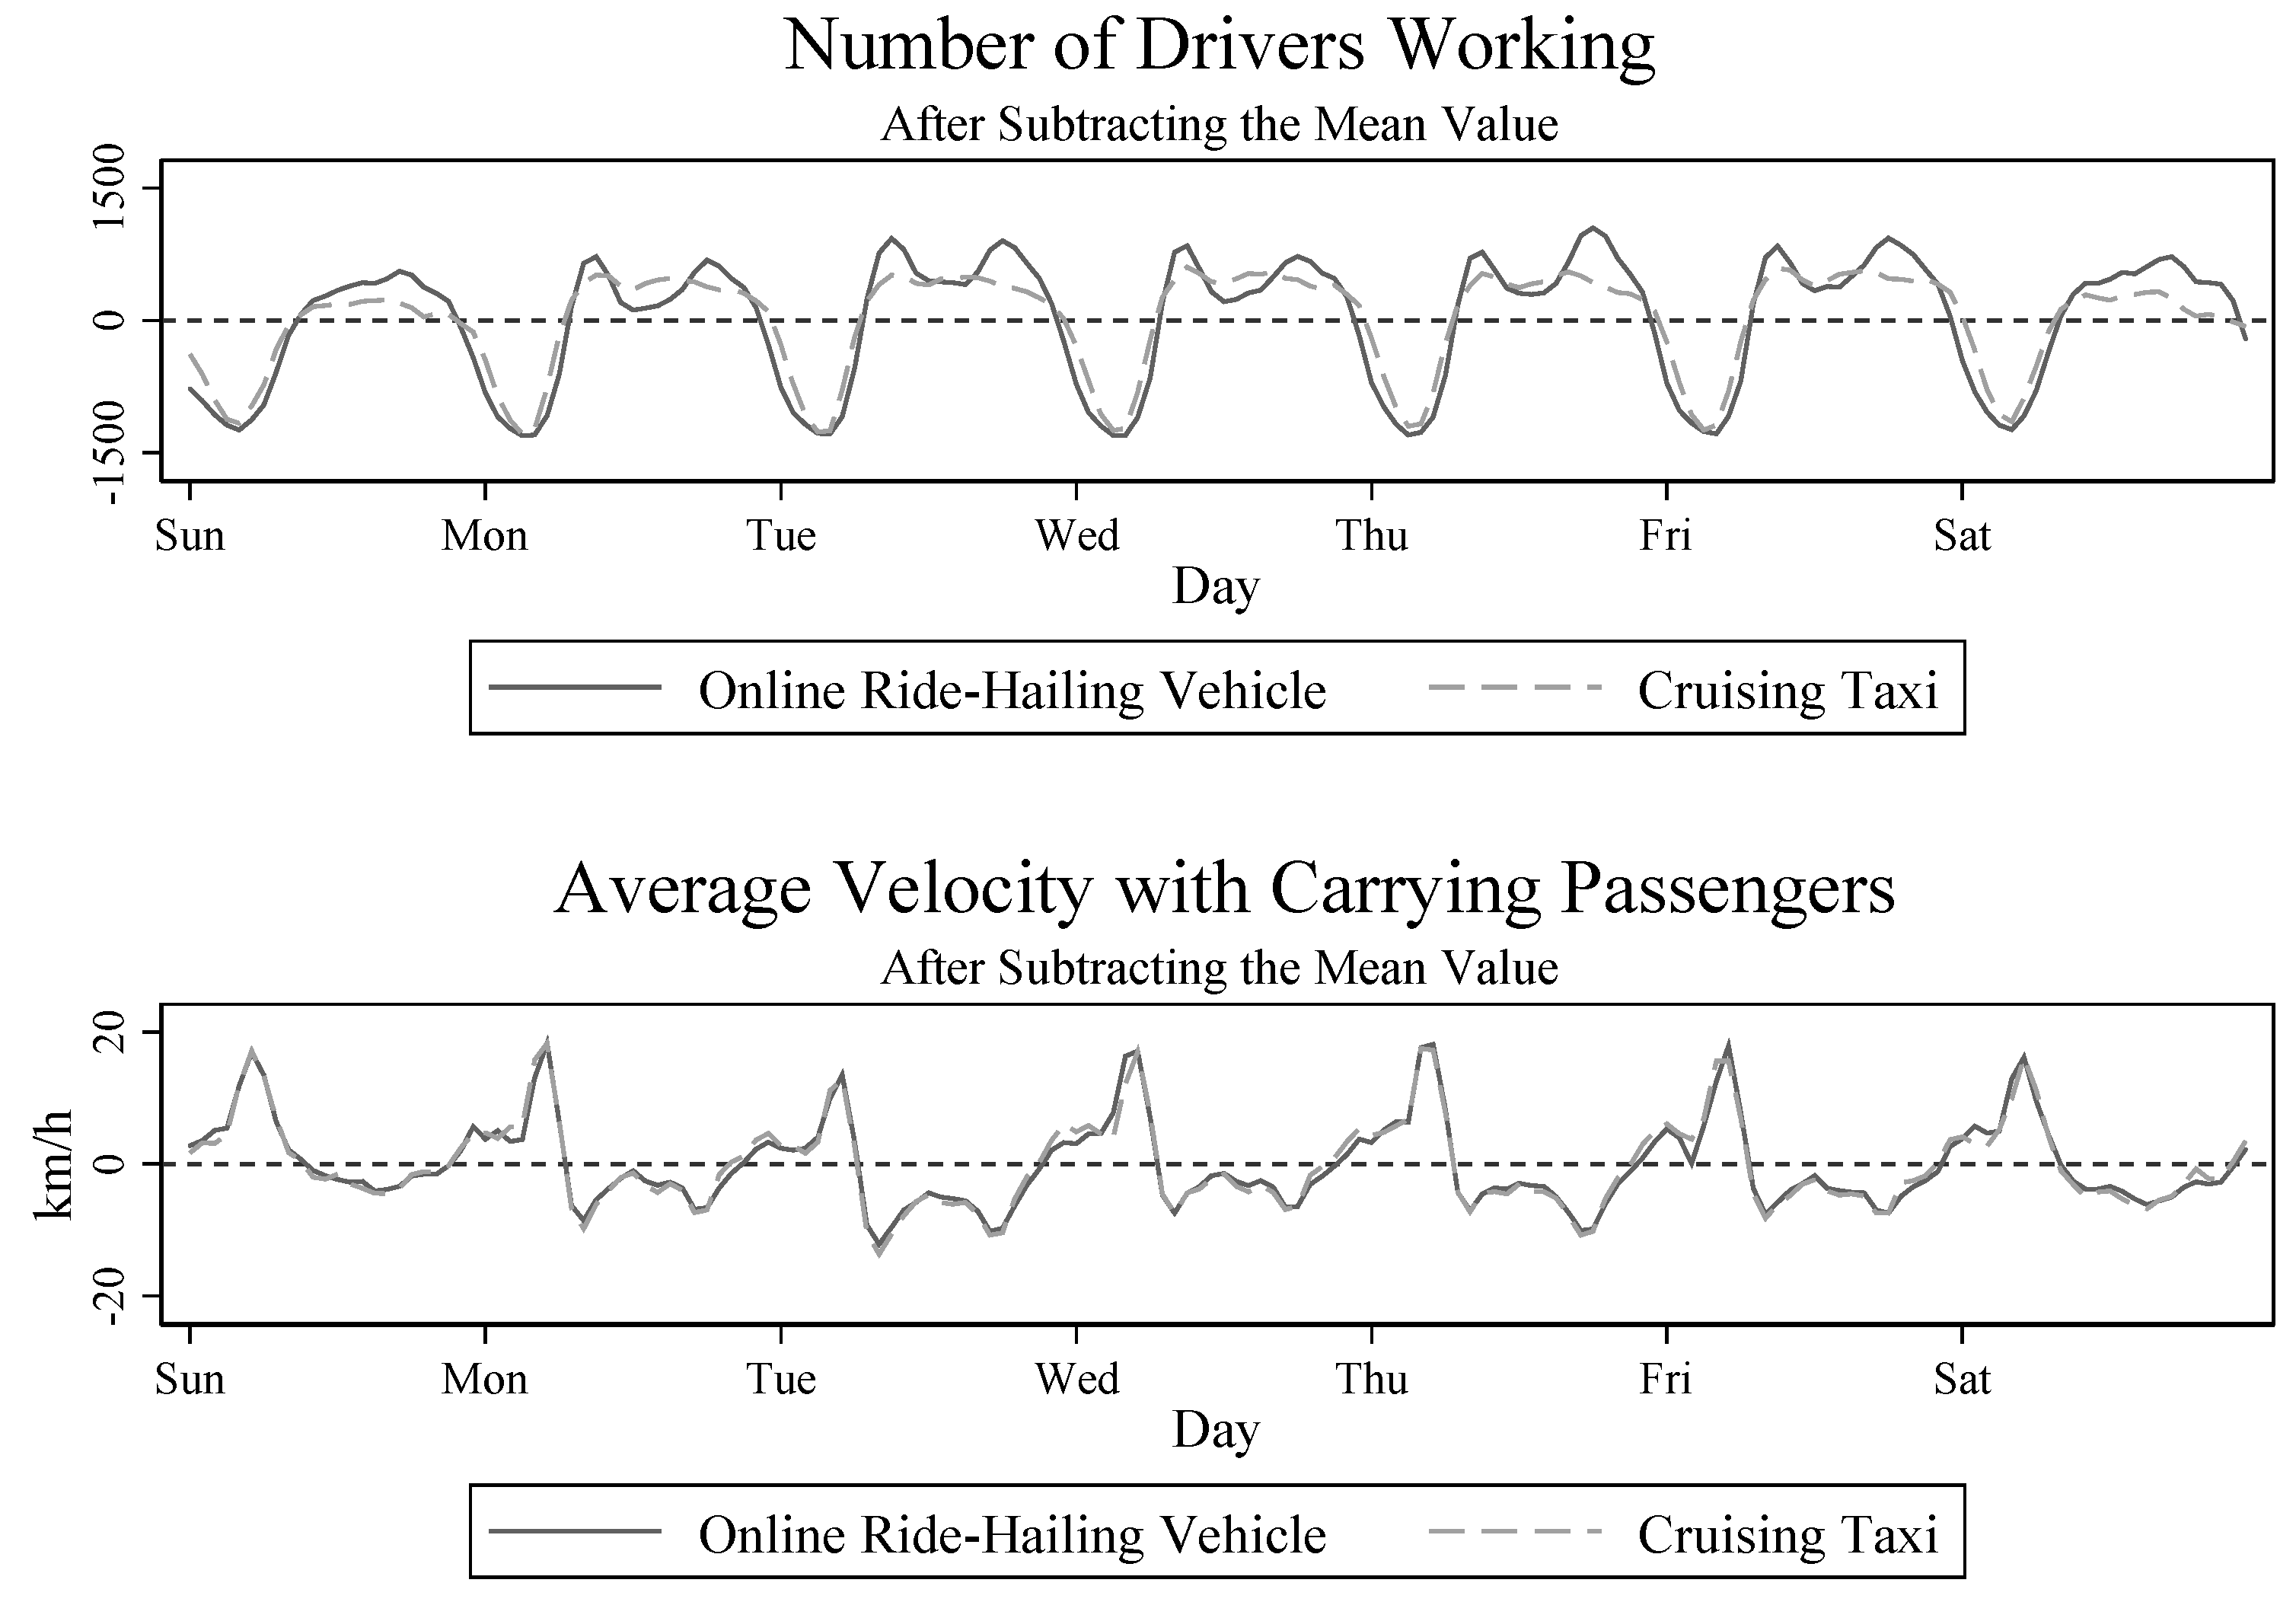
We also use one week’s data for 2019 to compare the total labor supply provided by the two modes. As the data is a random sample of taxis in Shanghai, it is representative of the overall market supply. The basic strategy is to count the number of drivers who have records of carrying passengers each hour, and then observe the change in the total number. In order to eliminate the influence of different sampling proportions of the two types of drivers, the numbers are subtracted by the average value of each group, as shown by the first picture of
Figure 5. From the dynamic changes within a week, online ride-hailing and cruising taxi show strong cyclical characteristics. However, in the morning and evening peak periods of weekdays and the evening of weekends, the fluctuation range of online ride-hailing drivers is significantly greater than that of cruising taxi drivers. In other words, more online ride-hailing drivers enter the market at peak demand.
Compared to the cruising taxi supply, the dynamic changes of online ride-hailing vehicles in service are accordant much better with that of residents’ travel demand because demand is most vigorous in the morning and evening peak periods of weekdays and the evening of weekends, which can be reflected in the average speed. The greater the travel demand of residents and the more vehicles on the road, the slower the driving speed of vehicles will be. The second picture in
Figure 5 shows the change of average speed for carrying passengers per hour in a week (calculated by dividing the average distance with carrying passengers per hour by the average duration of carrying passengers, in kilometers per hour). The peaks of the fluctuation in the number of online ride-hailing just correspond to the troughs of driving speed, while the number of taxis does not change significantly. In other words, the number of online ride-hailing drivers changes in the positive direction of demand. From the above analysis, it can be concluded that the change to online ride hailing is more consistent with the change in demand and will increase efficiency in the matching of supply and demand. The result strengthens the impact of “flexible work”, which not only improves the capacity utilization rate of transportation but also makes the supply and demand match better, which then increases the overall market efficiency.
7. Conclusions
This paper makes a comparison between online ride-hailing and traditional cruising taxis through the driver’s individual level of big data. Based on the horizontal comparison of capacity utilization between the two types and the vertical comparison of cruising taxi drivers in different years, it can be found that the overall capacity utilization rate of online ride-hailing drivers is slightly higher than that of cruising taxi drivers when their market shares are similar. But it is mainly driven by part-time drivers, and there is no significant difference in the work efficiency of full-time drivers. What’s more, the capacity utilization rate of cruising taxi drivers decreases with the decline of market share. Our results suggest that flexible work and market scale help improve capacity utilization, but there is little evidence that online matching mechanisms play the same role.
From the perspective of work efficiency or individual labor supply, there is no significant difference in capacity utilization between the two types of full-time drivers. The similarity with the conditions in New York may partly explain the reason. That is, in the environment of dense population or high demand, “street waving” may achieve similar efficiency to online matching. However, from the perspective of total labor supply, there are significant differences between the two types. Specifically, during the peak periods of demand, part-time online ride-hailing drivers’ temporary labor supply is added to the market, while the change in labor supply of traditional cruising taxis is not obvious. The factors that produce these part-time drivers, known as a kind of “flexible work”, may come from the following regulatory aspects:
Firstly, online ride-hailing drivers give a fixed proportion of their revenue to the platform. With different identities and living needs, they can choose to work full-time or part-time. In contrast, cruising taxi drivers need to rent the vehicle for a fixed amount of money every month. Under the constraint of the contract money, drivers need to work enough time to ensure that their income is higher than the contract money. Therefore, the majority of cruising taxi drivers choose to work full-time.
Secondly, in Shanghai, there is no limit on the total number of online ride-hailing vehicles, while the total number of cruising taxis is controlled under the operation license issued by the government. The restriction on the total quantity limits the flexible change of the number of cruising taxis.
Thirdly, cruising taxis are subjected to fixed fare rates regulated by the government. However, the online ride hailing service uses a “surge” pricing algorithm and makes dynamic adjustments to the fare rate in response to demand changes. The price increases during the peak period may also encourage online ride-hailing to perform more actively during this period and timely supplement the labor supply when the demand for taxis increases.
8. Discussion
In comparison with Cramer and Krueger’s conclusion [
4] that Uber has greatly improved the capacity utilization rate of taxi drivers and caused “disruptive changes” to the taxi market, our research results do not support the “disruptive change” of online ride-hailing services in individual work efficiency. This deserves our vigilance that new technologies and new business models may not bring about obvious efficiency improvements and social changes in all environments. As Button (2020) said, if Uber relied on exploiting the loopholes of traditional industry regulation rather than creating new products and higher profits, its role was exaggerated.
“Flexible work”, which has brought about part-time jobs, is the key mechanism to improving the overall capacity utilization rate and the overall matching degree of market supply and demand in the taxi market. The reason why it is difficult for the traditional taxi industry to create a “gig economy” is mainly because of the regulations on licenses, rent, fare rates, etc. It is worthy of reflection by the government that some rigid management and regulation may dampen the economic vitality of some departments.
There are some deficiencies in this paper. Firstly, just as Cramer and Krueger’s conclusion [
4] in New York was quite different from that in other big cities in the United States, the research on Shanghai in this paper may also have its own particularity among cities in China. However, since this article has not obtained data from other cities, it is difficult to discuss the role of online ride-hailing at the national level. Secondly, we have tried to collect relevant data from various channels, but the data about online ride-hailing is limited, and the quality of different data is inconsistent to some extent. In addition, due to the lack of background information on drivers, the econometric method, which is widely used for economic empirical research, is difficult to support in this paper by controlling factors such as demographic background and time change. Therefore, this paper chooses a descriptive direct comparison, which inevitably lacks the persuasion of causality.
The work of this paper still has space worth expanding: Firstly, there may be significant differences in the role and impact mechanism of online ride-hailing in different cities in China, as well as in developed and developing countries. Secondly, economic theory, mathematical modeling, and empirical research on big data need to be further combined. Thirdly, the theme of our paper is only a case of the following topic, namely: Can the new business model promote the sustainable development of the economy? We discuss the role of the online ride-hailing mode from the perspective of labor supply efficiency. In the future, this issue needs to be addressed from more perspectives, such as employment, consumer welfare, congestion, and general social welfare.


