
The Threshold Effect of Executive Compensation on Corporate Environmental Responsibility: Based on the Moderating Effect of Industry Competition

Abstract
:1. Introduction
2. Literature Review and Research Hypothesis
2.1. Executive Compensation and Corporate Environmental Responsibility
2.2. The Moderating Role of Industry Competition
3. Research Design
3.1. Data Source
3.2. Variable Description
3.2.1. Dependent Variable
3.2.2. Independent Variable
3.2.3. Moderating Variable
3.2.4. Control Variables
3.3. Model Construction
4. Empirical Analysis
4.1. Descriptive Statistics and Correlation Analysis
4.2. Main Regression Analysis
4.3. Robustness Test
4.3.1. Replacing Explained Variable
4.3.2. Robustness Test Based on the Tobit Model
4.3.3. Endogeneity Test with the Heckman Model
4.3.4. Further Analysis
5. Discussion and Conclusions
5.1. Theoretical Contributions
- (1)
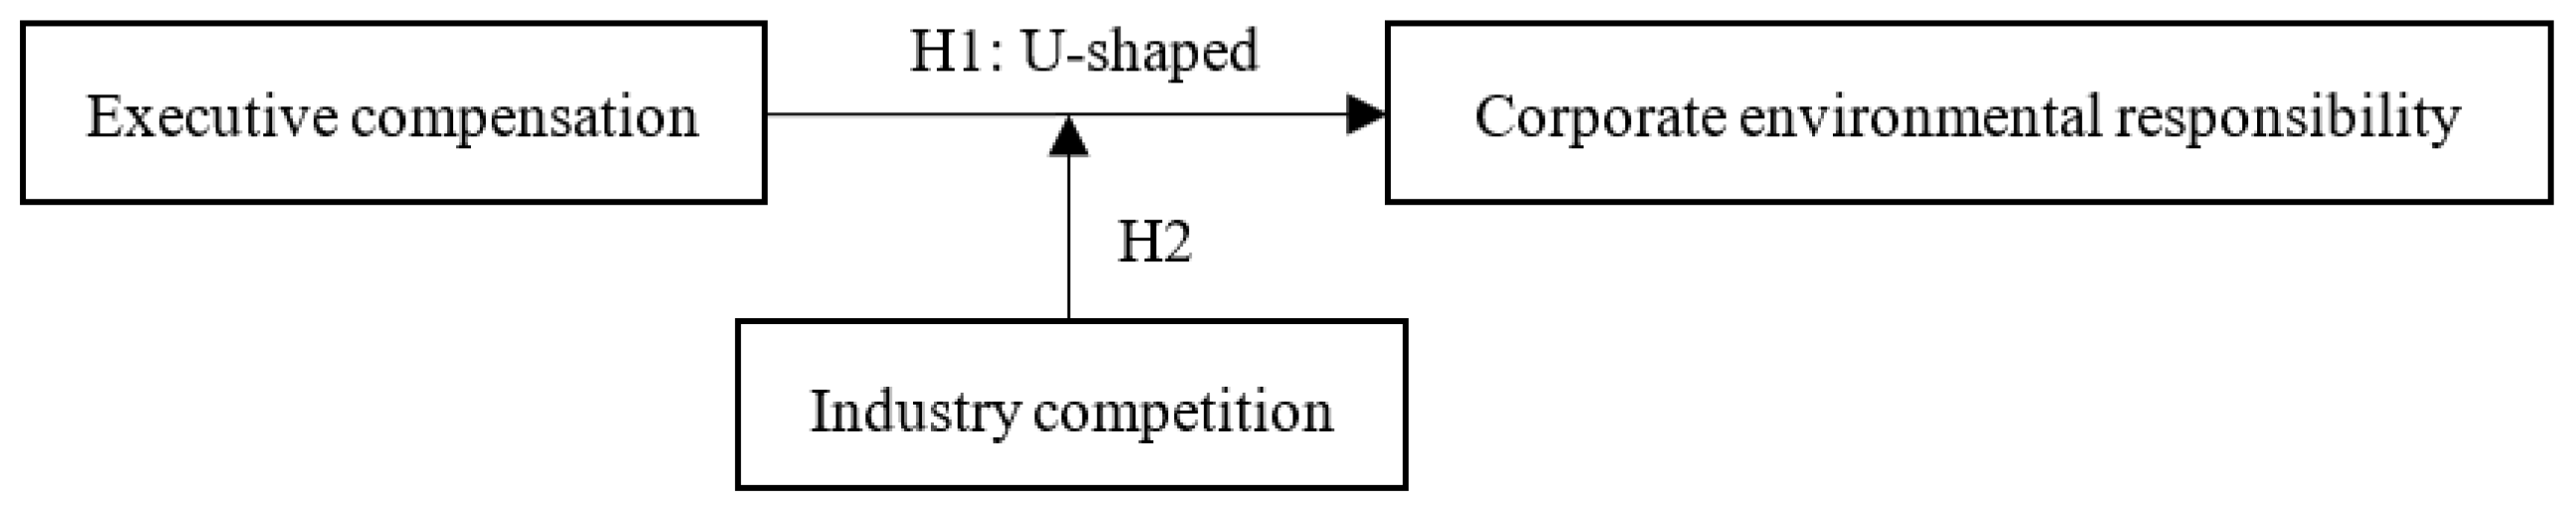
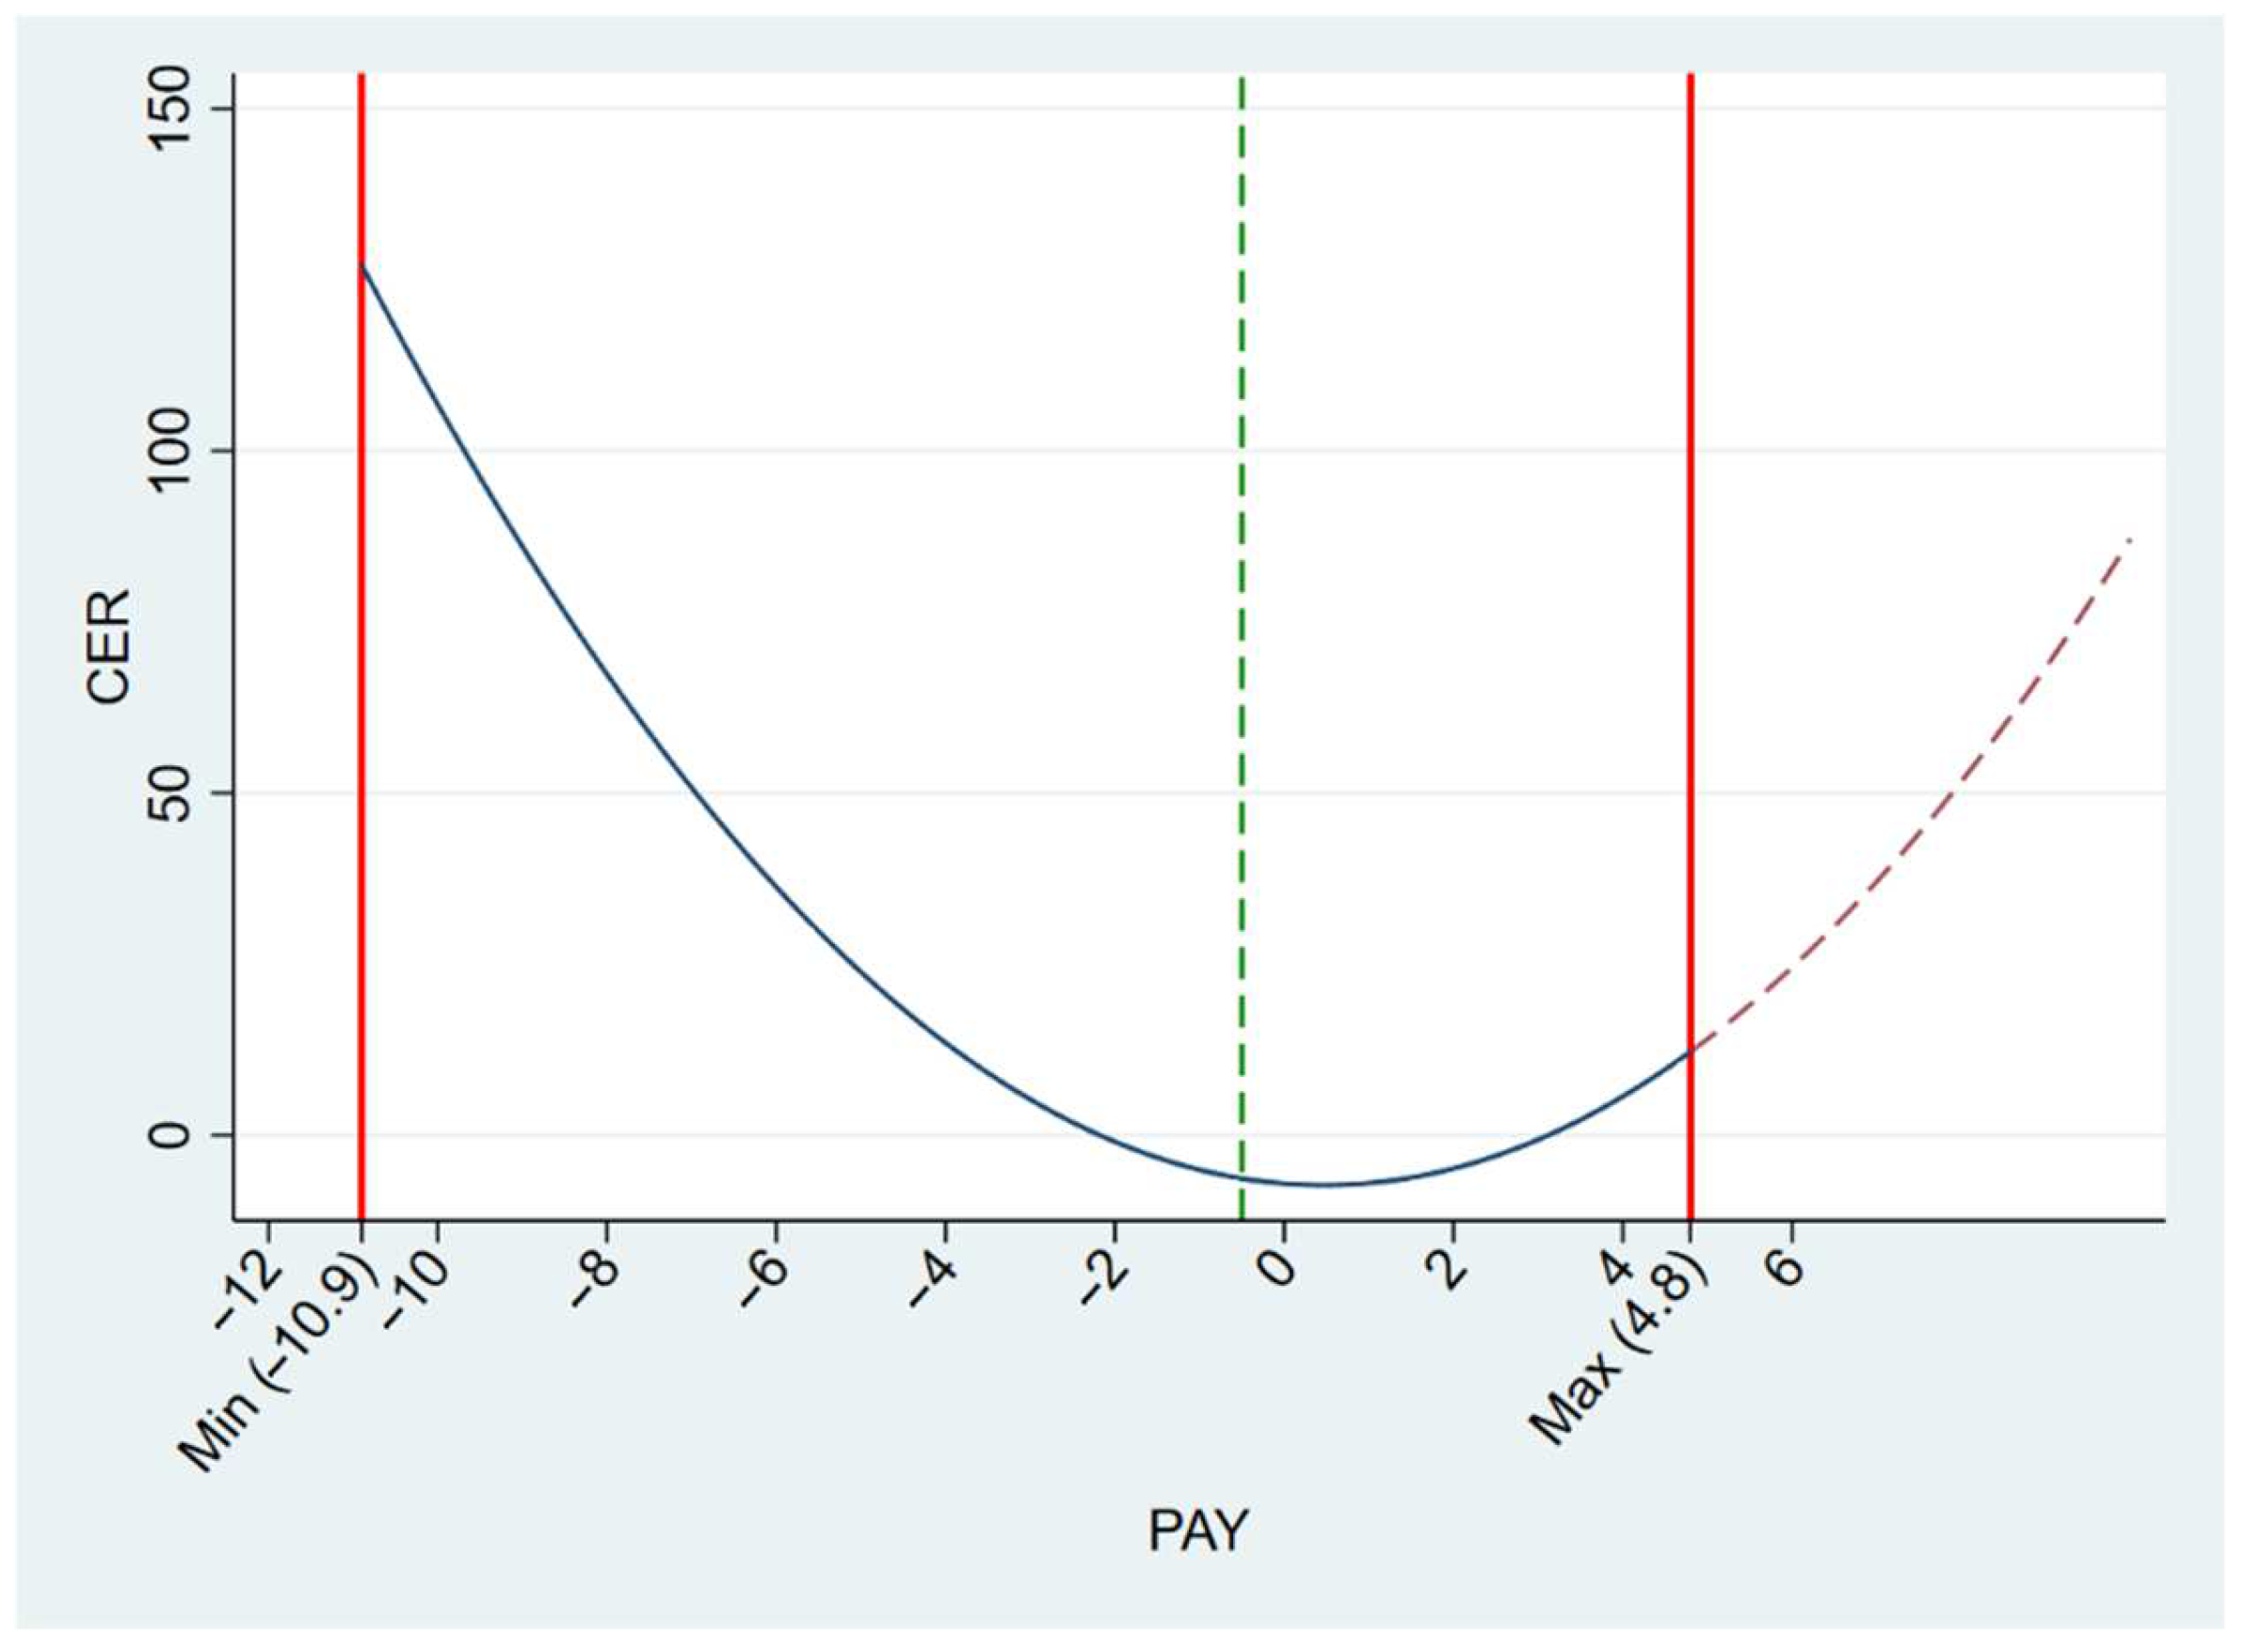
- This study explores the nonlinear relationship between executive compensation and corporate environmental responsibility, provides a new perspective for the study of executive compensation and corporate environmental responsibility, and constructs a unique analysis framework by introducing industry competition. The upper echelon theory holds that executives, as decision makers and executors of corporate environmental responsibility, are motivated by marginal benefits and costs [5]. Executive compensation is a key factor affecting corporate environmental responsibility. Increases in compensation enhance the self-confidence of executives, who will actively engage in corporate environmental responsibility and other social welfare activities. In addition, the ERG theory believes that low-level needs can gradually develop into high-level needs. Salary incentives are a crucial factor in the living standards of executives. When executives’ salaries are low, they will only pay attention to the financial performance and economic benefits of the company and ignore the implementation of other indicators of the company (such as corporate environmental responsibilities). When executive compensation crosses a certain boundary, the material living standards of executives are greatly improved, and executives whose material desires are satisfied will pursue higher-level needs, such as the fulfillment of corporate environmental responsibilities. Being able to manage higher-level needs and being able to demonstrate to other members of the board of directors and the public media of their noble moral qualities will help increase their reputation and promotion chances [76]. The results here show a U-shaped threshold effect between executive compensation and corporate environmental responsibility.
- (2)
- This study provides a new theoretical basis for industry competition to ease the threshold effect of executive compensation and enhance corporate environmental responsibility, and it further expands the stakeholder theory, agency theory, and other related theories. The stakeholder theory believes that companies should pay attention to stakeholders related to their production and operation, including investors, suppliers, and consumers. The needs and expectations of these stakeholders will directly affect the survival and development of the enterprise [33]. In the process of production and development, enterprises will face many industry competitors who provide similar or substitute products. The ability to survive and grow under industry competition requires enterprises to commit and implement in social welfare activities. Actively fulfilling corporate environmental responsibilities can maximize the interests of stakeholders related to the production and operation, improve the economic benefits, and strengthen the core competitiveness of the enterprise. A reasonable compensation mechanism can effectively promote corporate executive’s environmental awareness, prompting corporate executives to perform corporate environmental responsibilities and improve corporate environment. This paper uses industry competition as a moderating variable to test the U-shaped threshold effect of industry competition that eases executive compensation and enhances corporate environmental responsibility. This enriches expands the connotation of the stakeholder theory.
- (3)
- This paper explores the nonlinear relationship between executive compensation and corporate environmental responsibility, expands previous studies on the linear relationship of corporate environmental responsibility, and is the echo and expansion of the existing research. This paper argues that executive compensation has a significant U-shaped threshold effect on corporate environmental responsibility, and industry competition alleviates this U-shaped threshold effect. The conclusions of this paper expand the current research on CEO compensation and environmental strategies based on linear relationships, including the view based on management theory that the CEO acts in a non-profit rather than a completely selfish manner, so there is no need for explicit compensation measures to motivate the CEO to meet their environmental commitments [12]; that is, there is an inverse relationship between CEO compensation and environmental reputation/social responsibility [11,16,18,77], there seems to be a lack of link between incentives and corporate sustainability [78]. Based on institutional theory, institutional theory and environmental management research, some scholars believe that there is a positive correlation between executive compensation and corporate environmental responsibility [23,41,43]. Some studies have shown that the pay differences between the CEO and other executives prompt the CEO to assume more social responsibility, so limiting the financial incentives of senior executives may damage their motivation to participate in corporate social responsibility [21,44]. In addition, some studies believe that incentive dominance has an inverted U-shaped effect on corporate performance [79], but overall, there is not much literature to explore the u-shaped relationship between executive compensation and corporate environmental responsibility. Most of the existing literature believes that there is a positive or negative linear relationship between executive compensation and corporate environmental responsibility. However, this view may be one-sided, which separates the relationship between executive demand stage and pursuit level. In this paper, based on the theory of demand hierarchy, and through the introduction of industry competition, this paper defines the boundary conditions of executive compensation affecting corporate environmental responsibility from different levels of demand, different degrees of competition in different industries, and under a variety of heterogeneous conditions. The findings of this paper not only provide new empirical evidence for giving full play to the incentive role of executive compensation in corporate environmental responsibility, but also deepen the understanding of corporate governance in eastern emerging economies.
5.2. Practical Contributions
5.3. Limitations
Author Contributions
Funding
Institutional Review Board Statement
Informed Consent Statement
Data Availability Statement
Conflicts of Interest
References
- Zeng, S.; Jiang, X.; Su, B.; Nan, X. China’s SO2 shadow prices and environmental technical efficiency at the province level. Int. Rev. Econ. Financ. 2018, 57, 86–102. [Google Scholar] [CrossRef]
- Fabian, N. Support low-carbon investment. Nature 2015, 519, 27–29. [Google Scholar] [CrossRef] [PubMed] [Green Version]
- Verma, P.V.; Kamble, R.K. Corporate social responsibility and environmental sustainability: Evidence from India using energy intensity as an indicator of environmental sustainability. IIMB Manag. Rev. 2019, 31, 374–384. [Google Scholar]
- Chen, X.H.; Zhang, J.F.; Zeng, H.X. Is corporate environmental responsibility synergistic with governmental environmental responsibility? Evidence from China. Bus. Strategy Environ. 2020, 4, 1–18. [Google Scholar] [CrossRef]
- Hayward, M.; Hambrick, D. Explaining the premiums paid for large acquisitions: Evidence of CEO hubris. Adm. Sci. Q. 1997, 42, 103–127. [Google Scholar] [CrossRef]
- Ben, W.; Lewis, J.L.W.; Glen, W.S.D. Difference in degrees: CEO characteristics and firm environmental disclosure. Strateg. Manag. J. 2014, 35, 712–722. [Google Scholar]
- Olthuis, B.R.; Van Den Oever, K.F. The board of directors and CSR: How does ideological diversity on the board impact CSR? J. Clean. Prod. 2020, 251, 119532. [Google Scholar] [CrossRef]
- Chen, H.; An, M.; Wang, Q.; Ruan, W.; Xiang, E. Military executives and corporate environmental information disclosure: Evidence from china. J. Clean. Prod. 2020, 278, 123404. [Google Scholar] [CrossRef]
- Xu, X.; Shen, T.; Zhang, X.; Chen, H.H. The role of innovation investment and executive incentive on financial sustainability in tech-capital-labor intensive energy company: Moderate effect. Energy Rep. 2020, 6, 2667–2675. [Google Scholar] [CrossRef]
- Liao, L.; Luo, L.; Tang, Q. Gender diversity, board independence, environmental committee and greenhouse gas disclosure. Br. Account. Rev. 2015, 47, 409–424. [Google Scholar] [CrossRef]
- Fabrizi, M.; Mallin, C.; Michelon, G. The role of CEO’S personal incentives in driving corporate social responsibility. J. Bus. Ethics 2014, 124, 311–326. [Google Scholar] [CrossRef] [Green Version]
- Claude, F.; Andrea, M.; Silvia, G.S.A. Green or greed? An alternative look at CEO compensation and corporate environmental commitment. J. Bus. Ethics 2015, 5, 48–65. [Google Scholar]
- Han, W.; Zhuangxiong, Y.; Jie, L. Corporate social responsibility, product market competition, and product market performance. Int. Rev. Econ. Financ. 2018, 56, 75–91. [Google Scholar] [CrossRef]
- Fernandez-Kranz, D.; Santalo, J. When necessity becomes a virtue: The effect of product market competition on corporate social responsibility. J. Econ. Manag. Strategy 2010, 19, 453–487. [Google Scholar] [CrossRef]
- Fisman, R.; Heal, G.; Nair, V.B. A Model of Corporate Philanthropy; Working Paper; Columbia University: New York, NY, USA, 2006. [Google Scholar]
- Jian, M.; Lee, K.W. CEO compensation and corporate social responsibility. J. Multinatl. Financ. Manag. 2015, 29, 46–65. [Google Scholar] [CrossRef]
- Atif, M.; Liu, B.; Huang, A. Does board gender diversity affect corporate cash holdings? J. Bus. Financ. Account. 2019, 46, 1003–1029. [Google Scholar] [CrossRef]
- Rekker, S.A.C.; Benson, K.L.; Faff, R.W. Corporate social responsibility and CEO compensation revisited: Do disaggregation, market stress, gender matter? J. Econ. Bus. 2014, 72, 84–103. [Google Scholar] [CrossRef]
- Jamali, D.; Karam, C. Corporate social responsibility in developing countries as an emerging field. Int. J. Manag. Rev. 2016, 20, 32–61. [Google Scholar] [CrossRef]
- Prasad, M.; Mishra, T. Low-carbon growth for Indian iron and steel sector: Exploring the role of voluntary environmental compliance. Energy Policy 2017, 100, 41–50. [Google Scholar] [CrossRef]
- Ali, S.; Zhang, J.; Usman, M.; Khan, K.M.; Khan, U.F.; Siddique, A.M. Do tournament incentives motivate chief executive officers to be socially responsible? Manag. Audit. J. 2020, 35, 597–619. [Google Scholar] [CrossRef]
- Raithatha, M.; Komera, S. Executive compensation and firm performance: Evidence from Indian firms. IIMB Manag. Rev. 2016, 28, 160–169. [Google Scholar] [CrossRef] [Green Version]
- Berrone, P.; Gomez-Mejia, L.R. Environmental performance and executive compensation: An integrated agency-institutional perspective. Acad. Manag. J. 2009, 52, 103–126. [Google Scholar] [CrossRef]
- Bassyouny, H.; Abdelfattah, T.; Tao, L. Beyond narrative disclosure tone: The upper echelons theory perspective. Int. Rev. Financ. Anal. 2020, 70, 101499. [Google Scholar] [CrossRef]
- Mason, H.P.A. Upper echelons: The organization as a reflection of its top managers. Acad. Manag. Rev. 1984, 9, 193–206. [Google Scholar]
- Rajan, R.G.; Wuif, J. Are Perks Purely Managerial Excess. J. Financ. Econ. 2006, 79, 1–33. [Google Scholar] [CrossRef] [Green Version]
- Heikkurinen, P.; Ketola, T. Corporate responsibility and identity: From a stakeholder to an awareness approach. Bus. Strategy Environ. 2012, 21, 326–337. [Google Scholar] [CrossRef]
- Zou, H.L.; Zeng, S.X.; Xie, L.N.; Zeng, R.C. Are top executives rewarded for environmental performance? The role of the board of directors in the context of china. Hum. Ecol. Risk Assess. Int. J. 2015, 21, 1542–1565. [Google Scholar] [CrossRef]
- Alderfer, C.P. An empirical test of a new theory of human needs. Organ. Behav. Hum. Perform. 1969, 4, 142–175. [Google Scholar] [CrossRef]
- Cao, H.; Chen, Z. The driving effect of internal and external environment on green innovation strategy: The moderating role of top management’s environmental awareness. Nankai Bus. Rev. 2019, 10, 342–361. [Google Scholar] [CrossRef]
- Majid, A.; Yasir, M.; Javed, A. Nexus of institutional pressures, environmentally friendly business strategies, and environmental performance. Corp. Soc. Responsib. Environ. Manag. 2019, 3, 1–11. [Google Scholar] [CrossRef]
- Latan, H.; Jabbour, C.J.C.; Jabbour, A.B.L.D.S.; Wamba, S.F.; Shahbaz, M. Effects of environmental strategy, environmental uncertainty and top management’s commitment on corporate environmental performance: The role of environmental management accounting. J. Clean. Prod. 2018, 180, 297–306. [Google Scholar] [CrossRef]
- Freemann, R.E. Strategic Management: A Stakeholder Approach; Pitman: Boston, MA, USA, 1984; p. 25. [Google Scholar]
- Huang, C.L.; Kung, F.H. Drivers of environmental disclosure and stakeholder expectation: Evidence from Taiwan. J. Bus. Ethics 2010, 96, 435–451. [Google Scholar] [CrossRef]
- Habib, A.; Bhuiyan, M.B.U. Determinants of monetary penalties for environmental violations. Bus. Strategy Environ. 2017, 26, 754–775. [Google Scholar] [CrossRef]
- Joyce, A.; Paquin, R.L. The triple layered business model canvas: A tool to design more sustainable business models. J. Clean. Prod. 2016, 135, 1474–1486. [Google Scholar] [CrossRef]
- Jensen, M.; Meckling, W. Theory of the firm: Management behavior, agency costs and ownership structure. J. Financ. Econ. 1976, 3, 305–360. [Google Scholar] [CrossRef]
- Giroud, X.; Muelle, H. Corporate governance, product market competition, and equity prices. J. Financ. 2011, 66, 563–600. [Google Scholar] [CrossRef] [Green Version]
- Lee, J.H.; Byun, H.S.; Park, K.S. Product market competition and corporate social responsibility activities: Perspectives from an emerging economy. Pac.-Basin. Financ. J. 2018, 49, 60–80. [Google Scholar] [CrossRef]
- Chan, R.Y.; He, H.; Chan, H.K.; Wang, W.Y. Environmental orientation and corporate performance: The mediation mechanism of green supply chain management and moderating effect of competitive intensity. Ind. Mark. Manag. 2012, 41, 621–630. [Google Scholar] [CrossRef]
- Mahoney, L.S.; Thorn, L. An examination of the structure of executive compensation and corporate social responsibilty: A Canadian investigation. J. Bus. Ethics 2006, 69, 149–162. [Google Scholar] [CrossRef]
- Tsang, A.; Wang, K.T.; Liu, S.; Yu, L. Integrating corporate social responsibility criteria into executive compensation and firm innovation: International evidence. J. Corp. Financ. 2021, 70, 102070. [Google Scholar] [CrossRef]
- Haque, F. The effects of board characteristics and sustainable compensation policy on carbon performance of UK firms. Br. Account. Rev. 2017, 49, 347–364. [Google Scholar] [CrossRef]
- Jiang, H.; Hu, Y.; Su, K.; Zhu, Y. Do government say-on-pay policies distort managers’ engagement in corporate social responsibility? Quasi-Exp. Evid. China 2021, 17, 100259. [Google Scholar]
- Ho, H.; Kim, N.; Reza, S. CSR and CEO pay: Does CEO reputation matter? J. Bus. Res. 2022, 149, 1034–1049. [Google Scholar] [CrossRef]
- Xu, X.L.; Chen, H.H.; Li, Y.; Chen, Q.X. The role of equity balance and executive stock ownership in the innovation efficiency of renewable energy enterprises. J. Renew. Sustain. Energy 2019, 11, 055901. [Google Scholar] [CrossRef]
- Qi, G.; Zeng, S.; Tam, C.; Yin, H.; Zou, H. Stakeholders’ influences on corporate green innovation strategy: A case study of manufacturing firms in china. Corp. Soc. Responsib. Environ. Manag. 2013, 20, 1–14. [Google Scholar]
- Lozano, R.G.; Sánchez-Marín, G. Say on pay and executive compensation: A systematic review and suggestions for developing the field. Hum. Resour. Manag. Rev. 2020, 20, 100683. [Google Scholar]
- Cordeiro, J.J.; Sarkis, J. Why dose some firms link environmental performance to executive compensation? Dose it matter? Bus. Adm. Econ. 2007, 8, 1–6. [Google Scholar]
- Stucki, T. Which firms benefit from investments in green energy technologies?—The effect of energy costs. Res. Policy 2019, 48, 546–555. [Google Scholar] [CrossRef]
- Melo, T.; Garrido-Morgado, A. Corporate reputation:A combination of social responsibility and industry. Corp. Soc. Responsib. Environ. Manag. 2012, 19, 11–31. [Google Scholar] [CrossRef]
- Nickell, S.J. Competition and Corporate Performance. J. Political Econ. 1996, 104, 724–746. [Google Scholar] [CrossRef]
- Ikram, A.; Li, Z.F.; Minor, D. CSR-contingent executive compensation contracts. J. Bank. Financ. 2019, 23, 105655. [Google Scholar] [CrossRef]
- Frooman, J. Stakeholder influence strategies. Acad. Manag. Rev. 1999, 24, 191–205. [Google Scholar] [CrossRef]
- Ghoul, S.E.; Guedhami, O.; Kwok, C.C.Y.; Mishra, D.R. Does corporate social responsibility affect the cost of capital? J. Bank. Financ. 2011, 35, 2388–2406. [Google Scholar] [CrossRef]
- Cadogan, J.W.; Cui, C.C.; Li, E.K.Y. Export market-oriented behavior and export performance: The moderating roles of competitive intensity and technological turbulence. Int. Mark. Rev. 2008, 20, 493–513. [Google Scholar] [CrossRef]
- Arikan, E.; Kantur, D.; Maden, C.; Telci, E.E. Investigating the mediating role of corporate reputation on the relationship between corporate social responsibility and multiple stakeholder outcomes. Qual. Quant. 2016, 50, 129–149. [Google Scholar] [CrossRef]
- Hess, J.; Kaouris, M.; Williams, J. What iso 14000 brings to environmental management and compliance. In Environmental Management Strategies: The 21st Century Perspective; Prentice Hall: Upper Saddle River, NJ, USA, 1999; pp. 317–352. [Google Scholar]
- Kohtala, C. Addressing sustainability in research on distributed production: An integrated literature review. J. Clean. Prod. 2015, 106, 654–668. [Google Scholar] [CrossRef] [Green Version]
- Sharma, S.; Vredenburg, H. Proactive corporate environmental strategy and the development of competitively valuable organizational capabilities. Strateg. Manag. J. 1998, 19, 729–753. [Google Scholar] [CrossRef]
- Aragón-Correa, J.A.; Sharma, S. A contingent resource-based view of proactive corporate environmental strategy. Acad. Manag. Rev. 2003, 28, 71–88. [Google Scholar] [CrossRef]
- Klassen, R.D.; Mclaughlin, K.C.P. The impact of environmental management on firm performance. Manag. Sci. 1996, 42, 1199–1214. [Google Scholar] [CrossRef]
- Hsu, C.C.; Tan, K.C.; Zailani, S.H.M. Strategic orientations, sustainable supply chain initiatives, and reverse logistics. Int. J. Oper. Prod. Manag. 2016, 36, 86–110. [Google Scholar] [CrossRef]
- Orsato, R.J. Strategies for corporate social responsibility: When does it pay to be green? Calif. Manag. Rev. 2006, 48, 127–143. [Google Scholar] [CrossRef] [Green Version]
- Conyon, M.J.; He, L. Executive compensation and corporate governance in China. J. Corp. Financ. 2011, 17, 1158–1175. [Google Scholar] [CrossRef] [Green Version]
- Li, D.; Moshirian, F.; Nguyen, P.; Tan, L. Corporate governance or globalization: What determines CEO compensation in China? Res. Int. Bus. Financ. 2007, 21, 32–49. [Google Scholar] [CrossRef]
- Liu, X.; Lu, J.; Chizema, A. Top executive compensation, regional institutions and Chinese OFDI. J. World Bus. 2013, 49, 143–155. [Google Scholar] [CrossRef] [Green Version]
- Tang, Y.; Qian, C.; Chen, G.; Shen, R. How CEO hubris affects corporate social (Ir) responsibility. Strateg. Manag. J. 2015, 36, 1338–1357. [Google Scholar] [CrossRef]
- Li, D.Y.; Huang, M.; Ren, S.G.; Chen, X.H.; Ning, L.T. Environmental legitimacy, green innovation, and corporate carbon disclosure: Evidence from CDP China 100. J. Bus. Ethics 2018, 150, 1089–1104. [Google Scholar] [CrossRef]
- Zhang, Y.; Tong, L.; Li, J. Minding the gap: Asymmetric effects of pay dispersion on stakeholder engagement in corporate environmental (Ir) responsibility. Corp. Soc. Responsib. Environ. Manag. 2020, 27, 2354–2367. [Google Scholar] [CrossRef]
- Miao, Y.; Chen, M.H.; Su, C.H.; Chen, C.C. Philanthropic giving of China’s hotel firms: The roles of state ownership, corporate misconduct and executive remuneration. Int. J. Hosp. Manag. 2021, 95, 102897. [Google Scholar] [CrossRef]
- Haans, R.F.J.; Pieters, C.; He, Z.L. Thinking about U: Theorizing and testing U-and inverted U-shaped relationships in strategy research. Strateg. Manag. J. 2016, 37, 1177–1195. [Google Scholar] [CrossRef]
- Kaiser, H.F.; Rice, J. Little Jiffy, Mark Iv. Educ. Psychol. Meas. 1974, 34, 111–117. [Google Scholar] [CrossRef]
- Heckman, J.J. Sample selection bias as a specification error. Econometrica 1979, 47, 153–161. [Google Scholar] [CrossRef]
- Katmon, N.; Al, F.O. Exploring the impact of internal corporate governance on the relation between disclosure quality and earnings management in the UK listed companies. J. Bus. Ethics 2017, 142, 345–367. [Google Scholar] [CrossRef]
- Flammer, C. Does corporate social responsibility lead to superior financial performance? A regression discontinuity approach. Soc. Ence Electron. Publ. 2015, 61, 2549–2568. [Google Scholar] [CrossRef] [Green Version]
- Coombs, J.E.; Gilley, M.K. Stakeholder management as a predictor of CEO compensation: Main effects and interactions with financial performance. Strateg. Manag. J. 2005, 26, 827–840. [Google Scholar] [CrossRef]
- Hartikainen, H.; Järvenpää, J.; Rautiainen, A. Sustainability in executive remuneration—A missing link towards more sustainable firms? J. Clean. Prod. 2021, 324, 129224. [Google Scholar] [CrossRef]
- Oehmichen, J.; Jacobey, L.; Wolff, M. Have we made ourselves (too) clear?—Performance effects of the incentive explicitness in ceo compensation. Long Range Plan. 2019, 53, 101893. [Google Scholar] [CrossRef]


| Variables | Term | Symbol | Source |
|---|---|---|---|
| Dependent variable | Corporate environmental responsibility | Envrep | The eight indicators of environmental responsibility in (CNRDS) are weighted and averaged to measure corporate environmental responsibility. |
| Independent variable | Executive compensation | Pay | The total salary of the top three executives and take the logarithm. |
| Moderating variable | Industry competition | IC | The ratio of the total sales of the top four companies in the industry to the total sales of the entire industry. To maintain consistency in direction, a minus sign is used as a measure of industry competition. |
| Control variables | Enterprise size | Size | Natural logarithm of total assets. |
| Enterprise age | Age | The cumulative number of years from the establishment of the company to the current year. | |
| Return on total assets | Roa | After-tax net profit to total assets, it is used to measure net profit per unit of assets creates. | |
| Debt to assets ratio | Debt_a | Total debt to total assets. | |
| Revenue growth rate | Grow | The ratio of the increase in business income this year to the total business income of the previous year. | |
| Business nature | Soe | State-owned enterprise is 1, non-state-owned enterprise is 0. | |
| Environmental investment | Env_inv | The proportion of investment in environmental pollution control of each province (city) in local GDP. | |
| Environmental monitoring | Env_moni | The number of provincial (municipal) environmental monitoring agencies, plus 1 before taking the logarithm. | |
| Environmental standards | Env_stad | The number of local environmental protection standards issued by each province (city) that year, plus 1 before taking the logarithm. | |
| Environmental reports | Env_repo | The number of environmental protection reports in each province (city), plus 1 before taking the logarithm. |
| Variable | Mean | SD | Min | Max | Observations |
|---|---|---|---|---|---|
| Envrep | 3.160 | 1.620 | 0 | 8 | 3667 |
| Pay | 0 | 1 | −10.94 | 4.780 | 3667 |
| IC | 0 | 1 | −7.780 | 0.870 | 3667 |
| Size | 22.73 | 1.320 | 20.17 | 26.02 | 3667 |
| Age | 16.96 | 5.230 | 5 | 31 | 3667 |
| Roa | 0.050 | 0.060 | −0.160 | 0.220 | 3667 |
| Debt_a | 0.460 | 0.190 | 0.060 | 0.900 | 3667 |
| Grow | 0.150 | 0.290 | −0.430 | 1.530 | 3667 |
| Soe | 0.560 | 0.500 | 0 | 1 | 3667 |
| Env_inv | 1.250 | 0.680 | 0.060 | 4.660 | 3667 |
| Env_moni | 5.560 | 1.040 | 2.560 | 7.030 | 3667 |
| Env_stad | 0.680 | 0.800 | 0 | 4.600 | 3667 |
| Env_repo | 8.910 | 1.330 | 0 | 11.56 | 3667 |
| Variables | Model 1 | Model 2 | Model 3 | Model 4 |
|---|---|---|---|---|
| Envrep | Envrep | Envrep | Envrep | |
| Pay | 0.046 | −0.978 *** | −0.986 *** | −0.903 *** |
| (1.43) | (−3.22) | (−3.25) | (−2.94) | |
| Pay2 | 1.046 *** | 1.054 *** | 0.971 *** | |
| (3.39) | (3.42) | (3.12) | ||
| IC | 0.031 | 0.057 * | ||
| (1.02) | (1.72) | |||
| IC×Pay2 | 0.045 * | |||
| (1.85) | ||||
| Size | 0.358 *** | 0.344 *** | 0.343 *** | 0.344 *** |
| (12.62) | (11.98) | (11.95) | (12.00) | |
| Age | 0.008 | 0.008 | 0.008 | 0.008 |
| (1.44) | (1.35) | (1.37) | (1.42) | |
| Roa | 0.037 | −0.059 | −0.061 | −0.097 |
| (0.07) | (−0.11) | (−0.12) | (−0.18) | |
| Debt_a | 0.010 | −0.002 | 0.014 | 0.007 |
| (0.06) | (−0.01) | (0.08) | (0.04) | |
| Grow | −0.090 | −0.082 | −0.082 | −0.087 |
| (−1.03) | (−0.94) | (−0.94) | (−0.99) | |
| Soe | 0.047 | 0.062 | 0.061 | 0.062 |
| (0.79) | (1.04) | (1.02) | (1.04) | |
| Env_inv | 0.081 | 0.085 | 0.083 | 0.085 |
| (1.29) | (1.35) | (1.32) | (1.35) | |
| Env_moni | −0.072 | −0.064 | −0.064 | −0.060 |
| (−0.53) | (−0.48) | (−0.47) | (−0.44) | |
| Env_stad | 0.021 | 0.020 | 0.018 | 0.018 |
| (0.54) | (0.51) | (0.48) | (0.46) | |
| Env_repo | 0.049 | 0.049 | 0.050 | 0.048 |
| (1.15) | (1.15) | (1.18) | (1.14) | |
| Constant | −7.326 *** | −7.061 *** | −7.023 *** | −7.051 *** |
| (−6.95) | (−6.69) | (−6.65) | (−6.68) | |
| Year | Yes | Yes | Yes | Yes |
| Industry | Yes | Yes | Yes | Yes |
| Area | Yes | Yes | Yes | Yes |
| Observations | 3667 | 3667 | 3667 | 3667 |
| Stkcd | 561 | 561 | 561 | 561 |
| Variables | Model 1 | Model 2 | Model 3 | Model 4 |
|---|---|---|---|---|
| Envrep_sub | Envrep_sub | Envrep_sub | Envrep_sub | |
| Pay | 0.020 * | −0.330 *** | −0.335 *** | −0.305 *** |
| (1.88) | (−3.31) | (−3.36) | (−3.03) | |
| Pay2 | 0.357 *** | 0.362 *** | 0.332 *** | |
| (3.53) | (3.57) | (3.25) | ||
| IC | 0.019 * | 0.029 *** | ||
| (1.94) | (2.62) | |||
| IC×Pay2 | 0.016 ** | |||
| (2.04) | ||||
| Size | 0.116 *** | 0.111 *** | 0.111 *** | 0.111 *** |
| (12.46) | (11.81) | (11.76) | (11.82) | |
| Age | 0.004 ** | 0.004 ** | 0.004 ** | 0.004 ** |
| (2.35) | (2.27) | (2.30) | (2.36) | |
| Roa | −0.017 | −0.050 | −0.051 | −0.064 |
| (−0.10) | (−0.29) | (−0.29) | (−0.37) | |
| Debt_a | 0.032 | 0.028 | 0.038 | 0.035 |
| (0.56) | (0.49) | (0.66) | (0.61) | |
| Grow | −0.037 | −0.034 | −0.035 | −0.036 |
| (−1.29) | (−1.19) | (−1.20) | (−1.26) | |
| Soe | 0.061 *** | 0.066 *** | 0.065 *** | 0.065 *** |
| (3.08) | (3.34) | (3.31) | (3.33) | |
| Env_inv | 0.025 | 0.026 | 0.025 | 0.025 |
| (1.19) | (1.24) | (1.19) | (1.23) | |
| Env_moni | −0.023 | −0.021 | −0.020 | −0.019 |
| (−0.53) | (−0.47) | (−0.46) | (−0.43) | |
| Env_stad | 0.005 | 0.004 | 0.004 | 0.003 |
| (0.38) | (0.34) | (0.28) | (0.26) | |
| Env_repo | 0.022 | 0.022 | 0.023* | 0.023 |
| (1.60) | (1.60) | (1.66) | (1.62) | |
| Constant | −3.557 *** | −3.466 *** | −3.442 *** | −3.452 *** |
| (−10.25) | (−9.98) | (−9.91) | (−9.94) | |
| Year | Yes | Yes | Yes | Yes |
| Industry | Yes | Yes | Yes | Yes |
| Area | Yes | Yes | Yes | Yes |
| Observations | 3667 | 3667 | 3667 | 3667 |
| Stkcd | 561 | 561 | 561 | 561 |
| Variables | Model 1 | Model 2 | Model 3 | Model 4 |
|---|---|---|---|---|
| Envrep | Envrep | Envrep | Envrep | |
| Pay | 0.045 | −0.967 *** | −0.976 *** | −0.887 *** |
| (1.36) | (−3.11) | (−3.13) | (−2.82) | |
| Pay2 | 1.033 *** | 1.042 *** | 0.953 *** | |
| (3.27) | (3.30) | (2.98) | ||
| IC | 0.033 | 0.061 * | ||
| (1.07) | (1.79) | |||
| IC×Pay2 | 0.048 * | |||
| (1.93) | ||||
| Size | 0.362 *** | 0.347 *** | 0.346 *** | 0.348 *** |
| (12.41) | (11.79) | (11.76) | (11.81) | |
| Age | 0.008 | 0.008 | 0.008 | 0.008 |
| (1.39) | (1.31) | (1.33) | (1.38) | |
| Roa | 0.102 | 0.006 | 0.004 | −0.035 |
| (0.19) | (0.01) | (0.01) | (−0.06) | |
| Debt_a | 0.036 | 0.024 | 0.040 | 0.033 |
| (0.20) | (0.13) | (0.22) | (0.18) | |
| Grow | −0.088 | −0.079 | −0.080 | −0.085 |
| (−0.97) | (−0.88) | (−0.89) | (−0.94) | |
| Soe | 0.053 | 0.067 | 0.066 | 0.068 |
| (0.86) | (1.10) | (1.08) | (1.11) | |
| Env_inv | 0.088 | 0.092 | 0.090 | 0.092 |
| (1.37) | (1.42) | (1.39) | (1.42) | |
| Env_moni | −0.075 | −0.068 | −0.067 | −0.063 |
| (−0.54) | (−0.49) | (−0.48) | (−0.45) | |
| Env_stad | 0.027 | 0.026 | 0.025 | 0.024 |
| (0.69) | (0.66) | (0.63) | (0.61) | |
| Env_repo | 0.052 | 0.052 | 0.053 | 0.052 |
| (1.19) | (1.19) | (1.22) | (1.18) | |
| Constant | −7.669 *** | −7.403 *** | −7.363 *** | −7.387 *** |
| (−7.03) | (−6.78) | (−6.74) | (−6.77) | |
| Year | Yes | Yes | Yes | Yes |
| Industry | Yes | Yes | Yes | Yes |
| Area | Yes | Yes | Yes | Yes |
| Observations | 3667 | 3667 | 3667 | 3667 |
| Stkcd | 561 | 561 | 561 | 561 |
| Panel A: First-Step Regression—Estimating Inverse Mills | ||||||||||||
|---|---|---|---|---|---|---|---|---|---|---|---|---|
| Size | Age | Roa | Debt_a | Tobin | Ebit | Board | Lid_r | Cons | Year and Ind and Area | N | R2 | |
| Envrep | 0.254 *** | 0.006 | 0.070 | −0.029 | 0.003 | −0.014 | 0.031 ** | −0.032 ** | −5.735 *** | Yes | 3702 | 0.129 |
| Dummy | (8.94) | (1.17) | (0.13) | (−0.14) | (0.15) | (−0.85) | (2.11) | (−2.17) | (−8.79) | – | – | – |
| Panel B: Second-Step Regression—Introducing Inverse Mills | ||||||||||||
| Dependent Variable: Corporate Environmental Responsibility | ||||||||||||
| Model 11 | Model 12 | Model 13 | Model 14 | |||||||||
| Pay | 0.043 (1.30) | −0.997 *** (−3.24) | −1.005 *** (−3.26) | −0.918 *** (−2.95) | ||||||||
| Pay2 | – | 1.062 *** (3.40) | 1.069 *** (3.42) | 0.982 *** (3.10) | ||||||||
| IC | – | – | 0.030 (0.96) | 0.057 * (1.65) | ||||||||
| IC×Pay2 | – | – | – | 0.046 * (1.81) | ||||||||
| Size | 0.257 *** (4.62) | 0.233 *** (4.16) | 0.234 *** (4.18) | 0.233 *** (4.16) | ||||||||
| Age | 0.003 (0.52) | 0.002 (0.40) | 0.003 (0.42) | 0.003 (0.45) | ||||||||
| Roa | −0.291 (−0.53) | −0.392 (−0.72) | −0.394 (−0.72) | −0.435 (−0.80) | ||||||||
| Debt_a | −0.071 (−0.38) | −0.094 (−0.50) | −0.077 (−0.41) | −0.088 (−0.47) | ||||||||
| Grow | −0.099 (−1.10) | −0.092 (−1.02) | −0.093 (−1.03) | −0.097 (−1.07) | ||||||||
| Soe | 0.036 (0.58) | 0.050 (0.82) | 0.049 (0.80) | 0.050 (0.82) | ||||||||
| Env_inv | 0.077 (1.19) | 0.081 (1.25) | 0.079 (1.22) | 0.080 (1.24) | ||||||||
| Env_moni | −0.042 (−0.30) | −0.035 (−0.25) | −0.034 (−0.25) | −0.030 (−0.22) | ||||||||
| Env_stad | 0.028 (0.71) | 0.027 (0.68) | 0.025 (0.64) | 0.024 (0.61) | ||||||||
| Env_repo | 0.037 (0.86) | 0.037 (0.85) | 0.038 (0.88) | 0.037 (0.84) | ||||||||
| IMR | −0.766 ** (−2.09) | −0.837 ** (−2.28) | −0.822 ** (−2.24) | −0.846 ** (−2.31) | ||||||||
| Constant | −2.616 (−1.54) | −2.077 (−1.22) | −2.094 (−1.23) | −2.026 (−1.19) | ||||||||
| Year | Yes | Yes | Yes | Yes | ||||||||
| Industry | Yes | Yes | Yes | Yes | ||||||||
| Area | Yes | Yes | Yes | Yes | ||||||||
| Observations | 3561 | 3561 | 3561 | 3561 | ||||||||
| Stkcd | 0.235 | 0.238 | 0.238 | 0.239 | ||||||||
| Variables | Model 1 | Model 2 | Model 3 | Model 4 | Model 5 | Model 6 |
|---|---|---|---|---|---|---|
| Envrep | Envrep | Envrep | Envrep | Envrep | Envrep | |
| Pay | −1.376 *** | −0.593 | −0.725 ** | −0.291 | −1.208 *** | 1.374 |
| (−3.91) | (−0.62) | (−2.19) | (−0.21) | (−3.72) | (1.32) | |
| Pay2 | 1.515 *** | 0.590 | 0.741 ** | 0.448 | 1.378 *** | −1.495 |
| (4.08) | (0.63) | (2.19) | (0.32) | (4.13) | (−1.45) | |
| IC | 0.001 | 0.110 ** | 0.066 | 0.064 | 0.028 | 0.115 * |
| (0.02) | (2.00) | (1.48) | (1.24) | (0.72) | (1.69) | |
| IC×Pay2 | 0.076 * | 0.041 | 0.136 *** | −0.001 | 0.025 | 0.051 |
| (1.73) | (1.22) | (2.78) | (−0.02) | (0.68) | (1.29) | |
| Size | 0.358 *** | 0.324 *** | 0.419 *** | 0.137 ** | 0.307 *** | 0.319 *** |
| (9.57) | (6.40) | (8.55) | (2.19) | (8.31) | (6.66) | |
| Age | 0.018 ** | 0.012 | 0.013 | 0.009 | 0.009 | −0.001 |
| (2.09) | (1.51) | (1.50) | (1.12) | (1.42) | (−0.12) | |
| Roa | −0.135 | −0.137 | −1.314 | 0.692 | −1.271 ** | 2.935 *** |
| (−0.19) | (−0.18) | (−1.60) | (1.00) | (−1.97) | (3.19) | |
| Debt_a | −0.035 | 0.176 | −0.188 | 0.342 | −0.065 | 0.250 |
| (−0.15) | (0.64) | (−0.63) | (1.55) | (−0.30) | (0.81) | |
| Grow | −0.164 | 0.015 | −0.065 | −0.103 | −0.047 | −0.161 |
| (−1.42) | (0.12) | (−0.53) | (−0.85) | (−0.42) | (−1.15) | |
| Soe | 0.134 | −0.061 | 0.008 | 0.029 | ||
| (1.50) | (−0.73) | (0.11) | (0.27) | |||
| Env_inv | 0.239 *** | −0.114 | 0.062 | 0.089 | 0.111 | 0.073 |
| (2.87) | (−1.19) | (0.63) | (1.13) | (1.40) | (0.65) | |
| Env_moni | −0.077 | −0.035 | 0.121 | −0.216 | −0.139 | 0.227 |
| (−0.42) | (−0.17) | (0.58) | (−1.24) | (−0.78) | (0.91) | |
| Env_stad | 0.052 | −0.010 | −0.027 | 0.069 | 0.061 | −0.033 |
| (1.02) | (−0.18) | (−0.51) | (1.30) | (1.22) | (−0.48) | |
| Env_repo | 0.006 | 0.095 | 0.030 | 0.047 | −0.009 | 0.167 ** |
| (0.12) | (1.41) | (0.46) | (0.88) | (−0.16) | (2.34) | |
| Constant | −8.300 *** | −7.411 *** | −9.496 *** | −1.803 | −6.023 *** | −8.589 *** |
| (−5.83) | (−3.93) | (−5.24) | (−1.06) | (−4.07) | (−4.13) | |
| Year | Yes | Yes | Yes | Yes | Yes | Yes |
| Industry | Yes | Yes | Yes | Yes | Yes | Yes |
| Area | Yes | Yes | Yes | Yes | Yes | Yes |
| Observations | 2084 | 1583 | 1855 | 1812 | 2408 | 1259 |
| Stkcd | 272 | 312 | 313 | 381 | 380 | 181 |
Publisher’s Note: MDPI stays neutral with regard to jurisdictional claims in published maps and institutional affiliations. |
© 2022 by the authors. Licensee MDPI, Basel, Switzerland. This article is an open access article distributed under the terms and conditions of the Creative Commons Attribution (CC BY) license (https://creativecommons.org/licenses/by/4.0/).
Share and Cite
Zhang, Y.; Zhang, X. The Threshold Effect of Executive Compensation on Corporate Environmental Responsibility: Based on the Moderating Effect of Industry Competition. Sustainability 2022, 14, 8711. https://doi.org/10.3390/su14148711
Zhang Y, Zhang X. The Threshold Effect of Executive Compensation on Corporate Environmental Responsibility: Based on the Moderating Effect of Industry Competition. Sustainability. 2022; 14(14):8711. https://doi.org/10.3390/su14148711
Chicago/Turabian StyleZhang, Yang, and Xinxin Zhang. 2022. "The Threshold Effect of Executive Compensation on Corporate Environmental Responsibility: Based on the Moderating Effect of Industry Competition" Sustainability 14, no. 14: 8711. https://doi.org/10.3390/su14148711