
Numerical Experiments on Low Impact Development for Urban Resilience Index


Abstract
:1. Introduction
2. Materials and Methods
2.1. Resilience Assessment Index
2.1.1. Structure of the Resilience Assessment Index
2.1.2. Runoff Processes- HFR
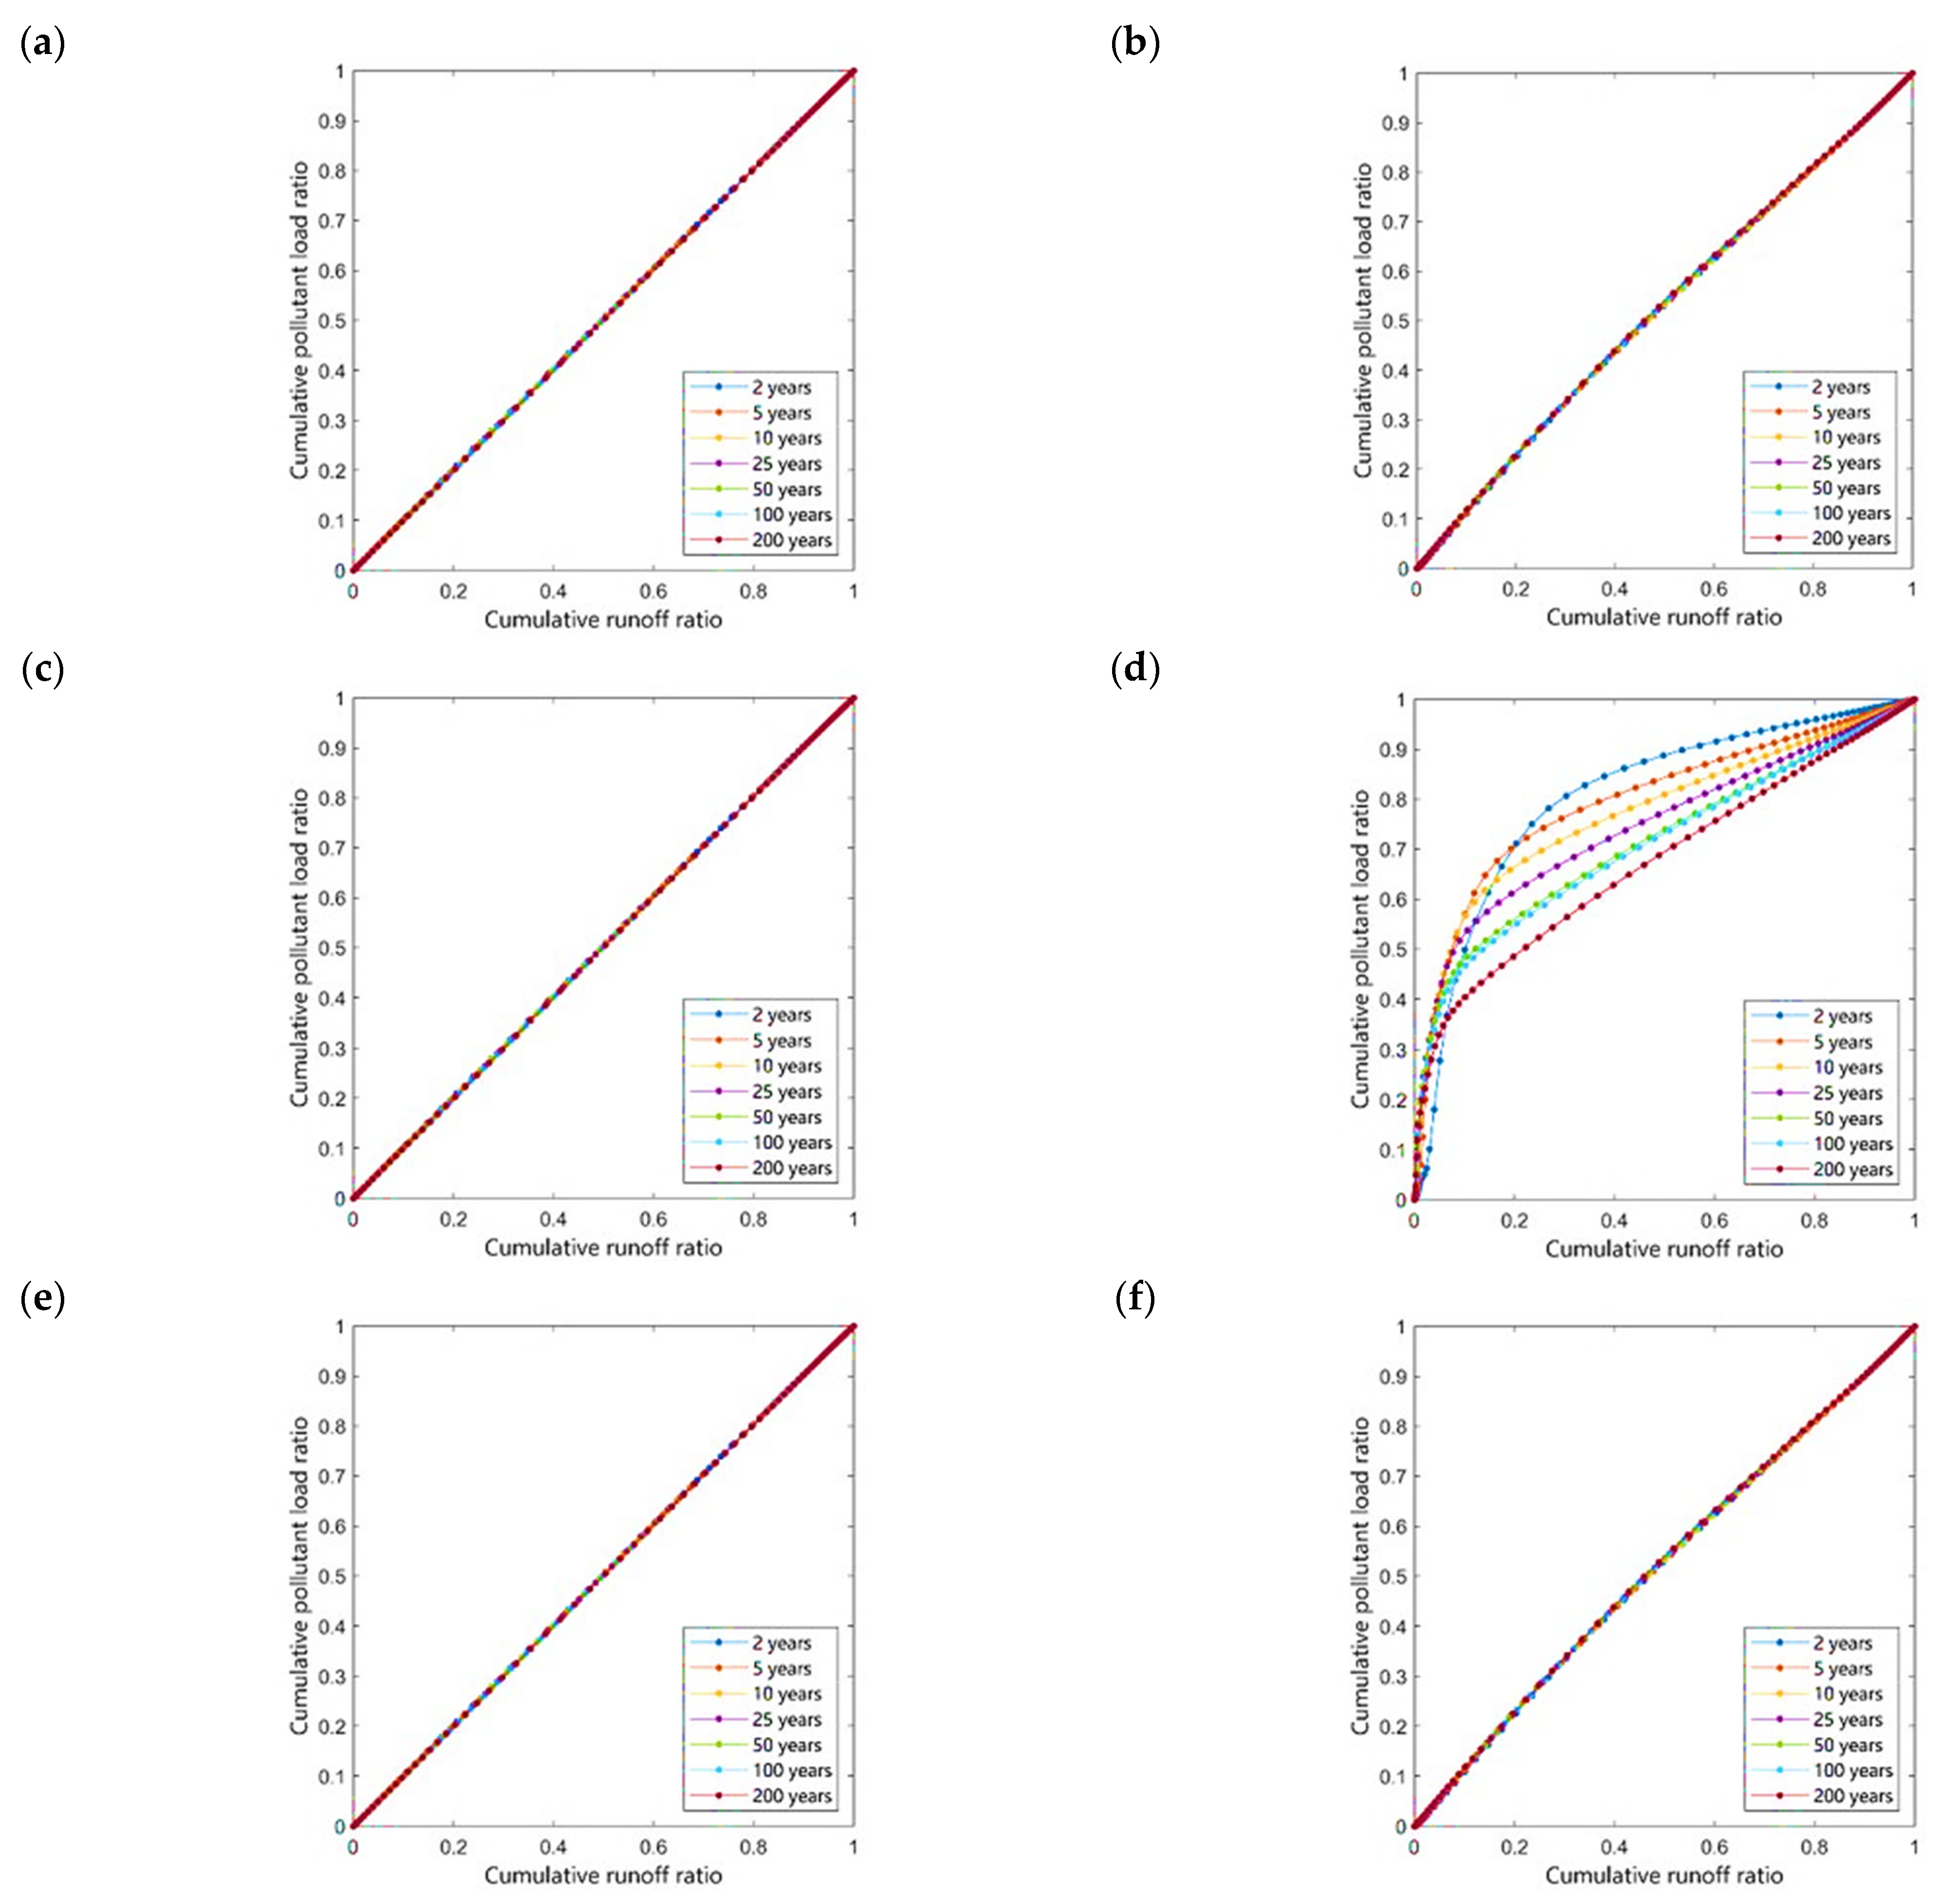
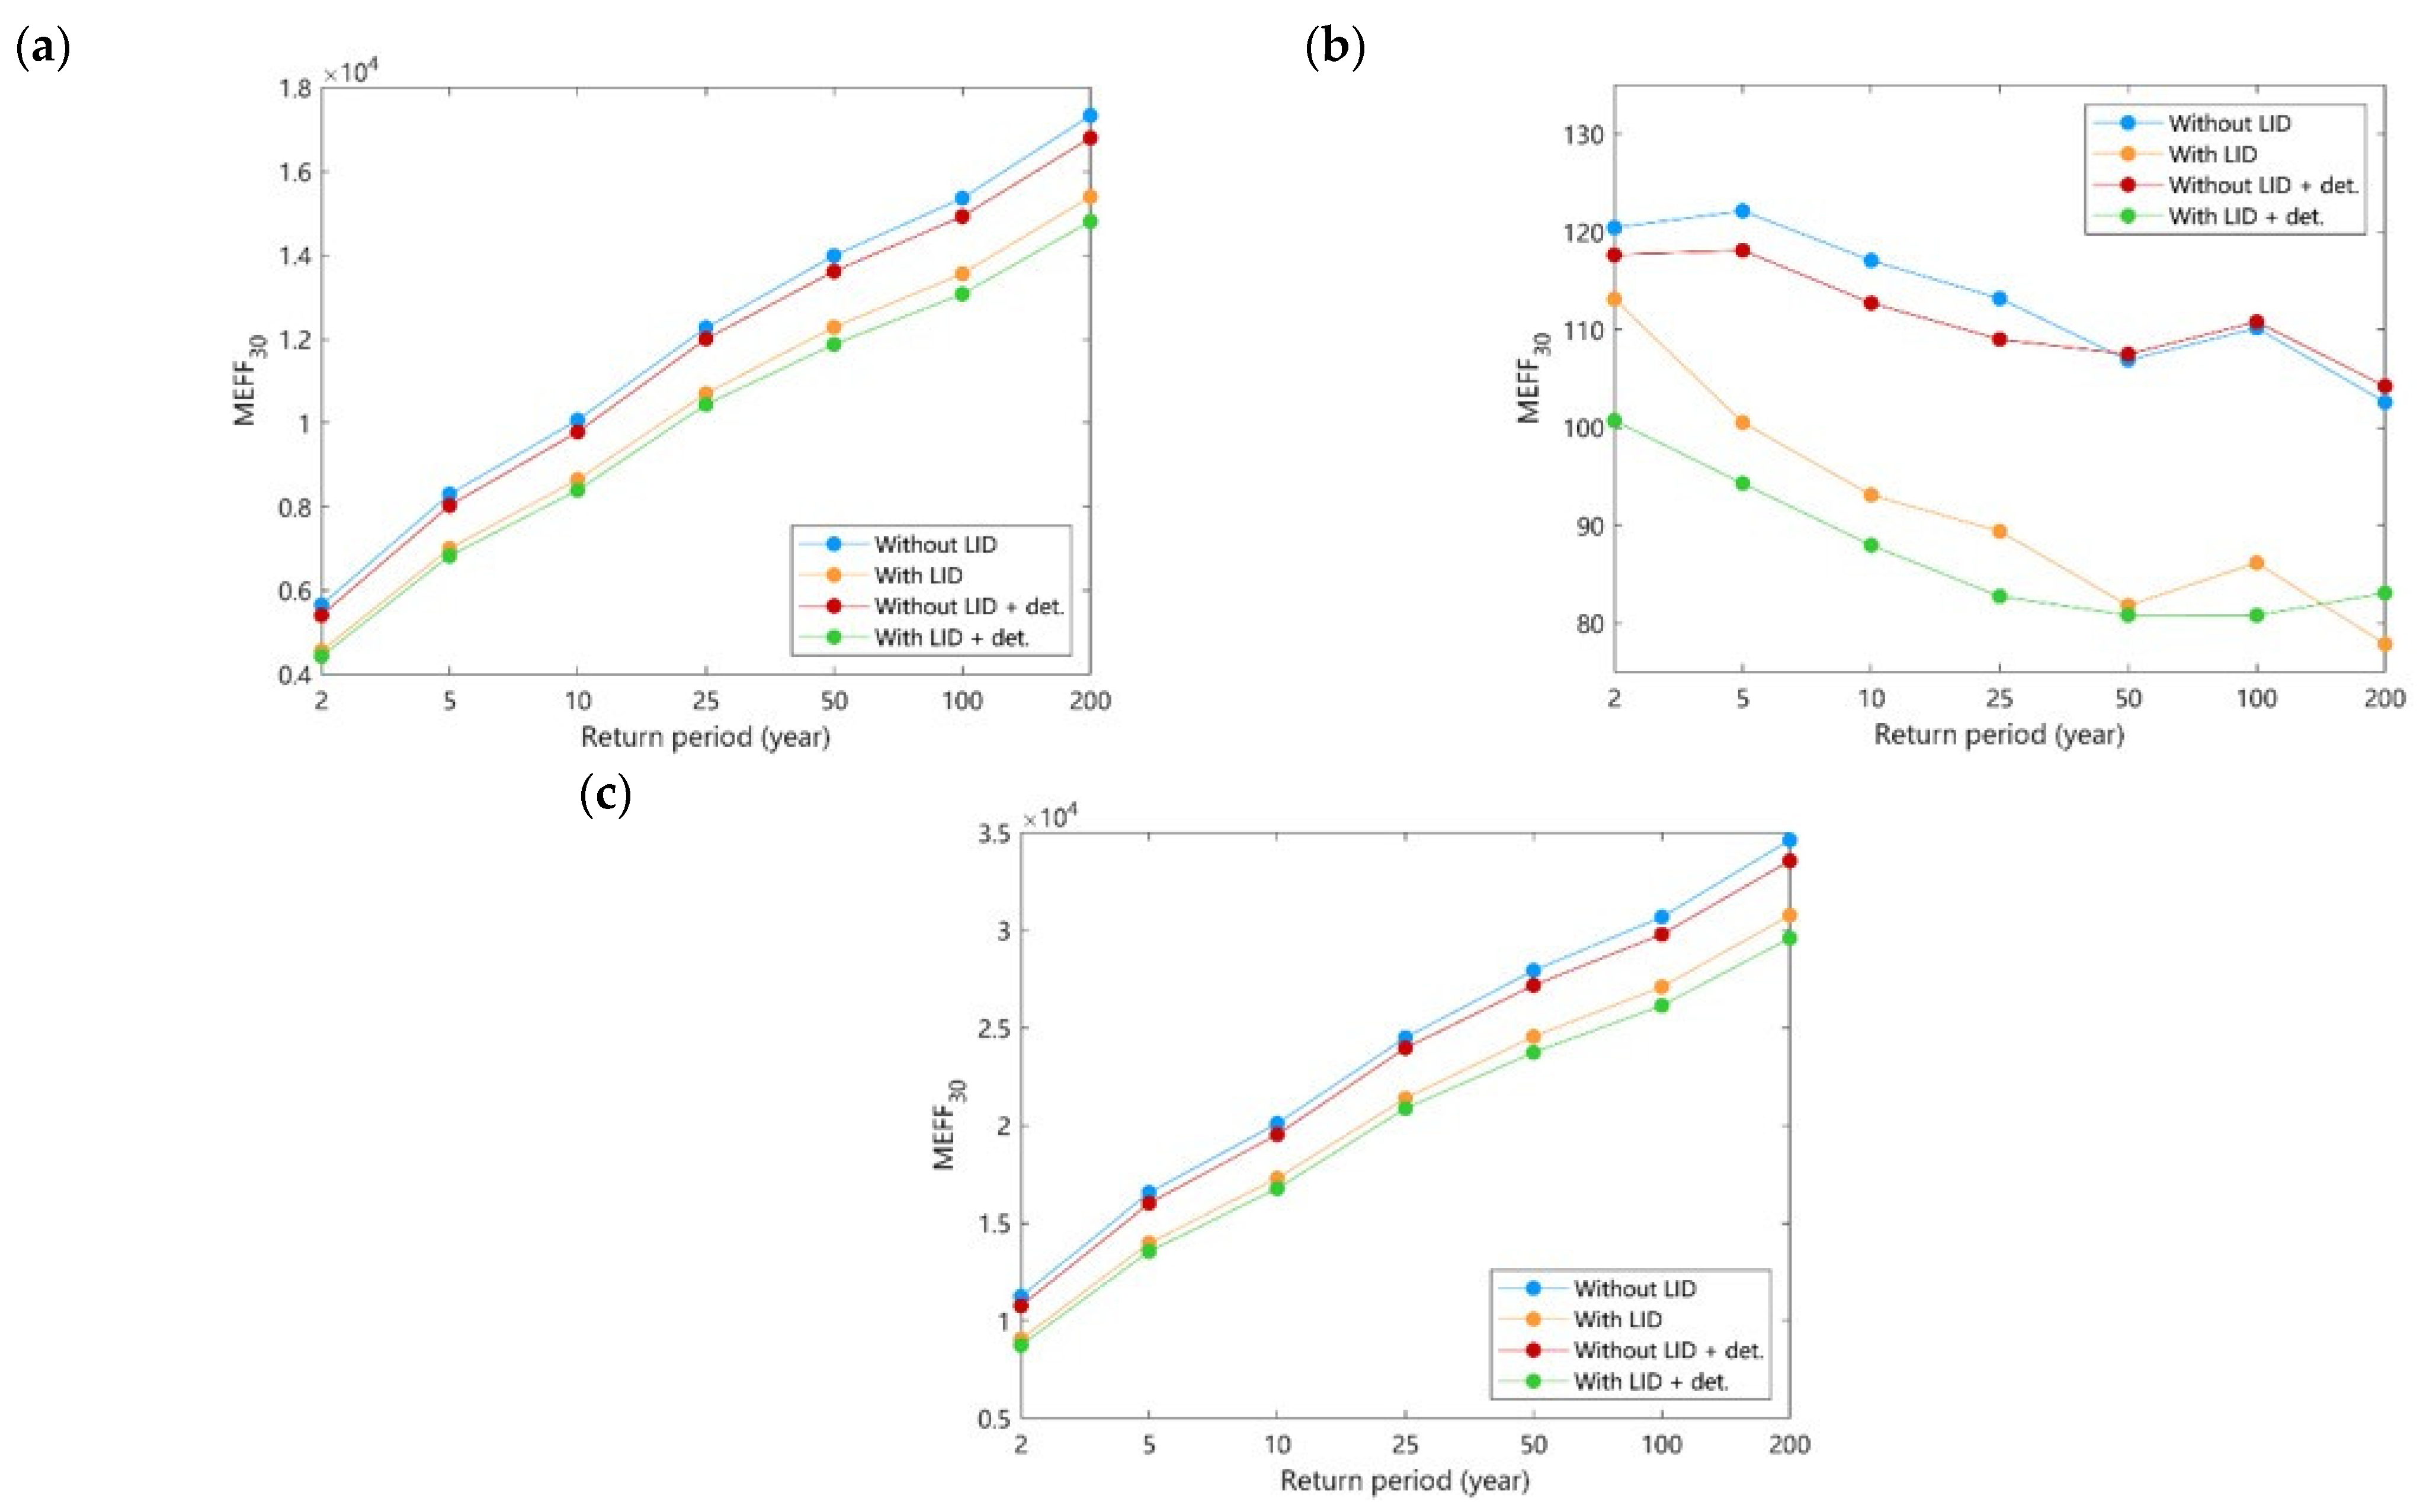
2.1.3. Transport of Contaminants- MEFFn
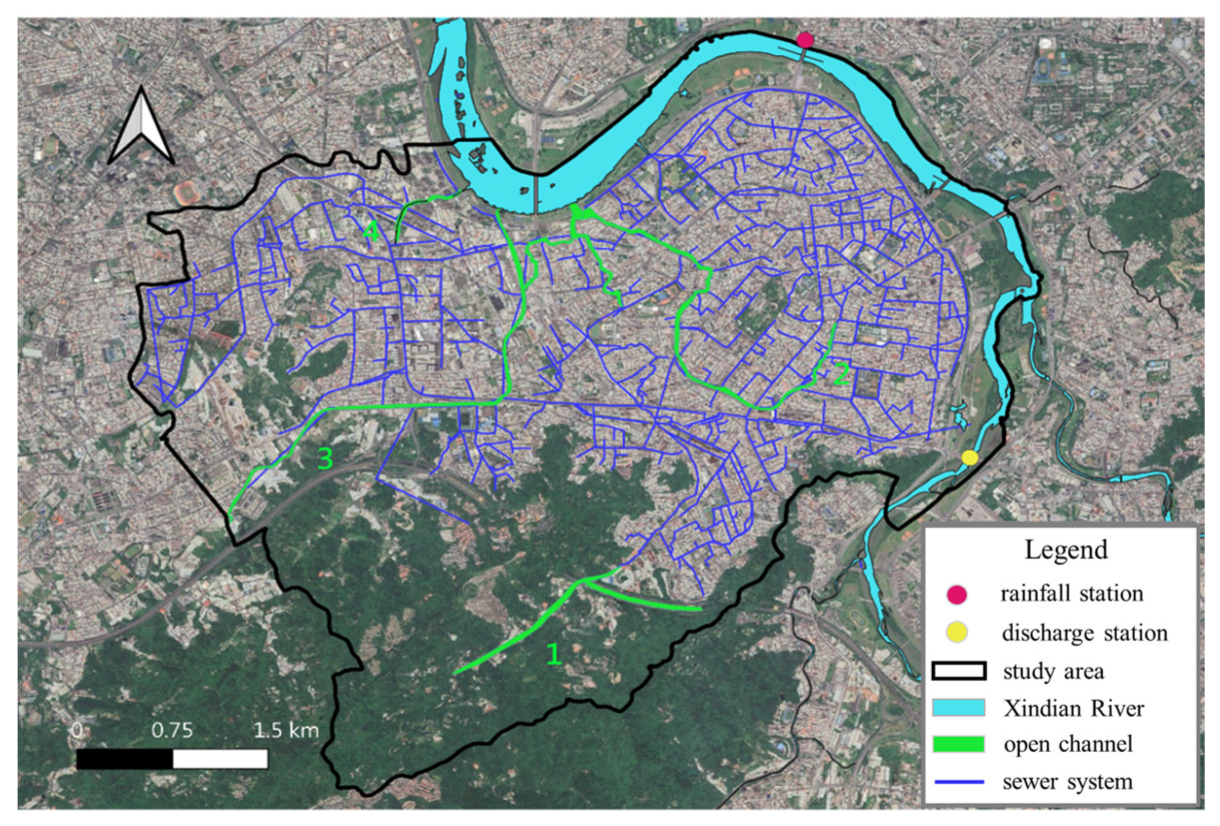
2.2. Study Area
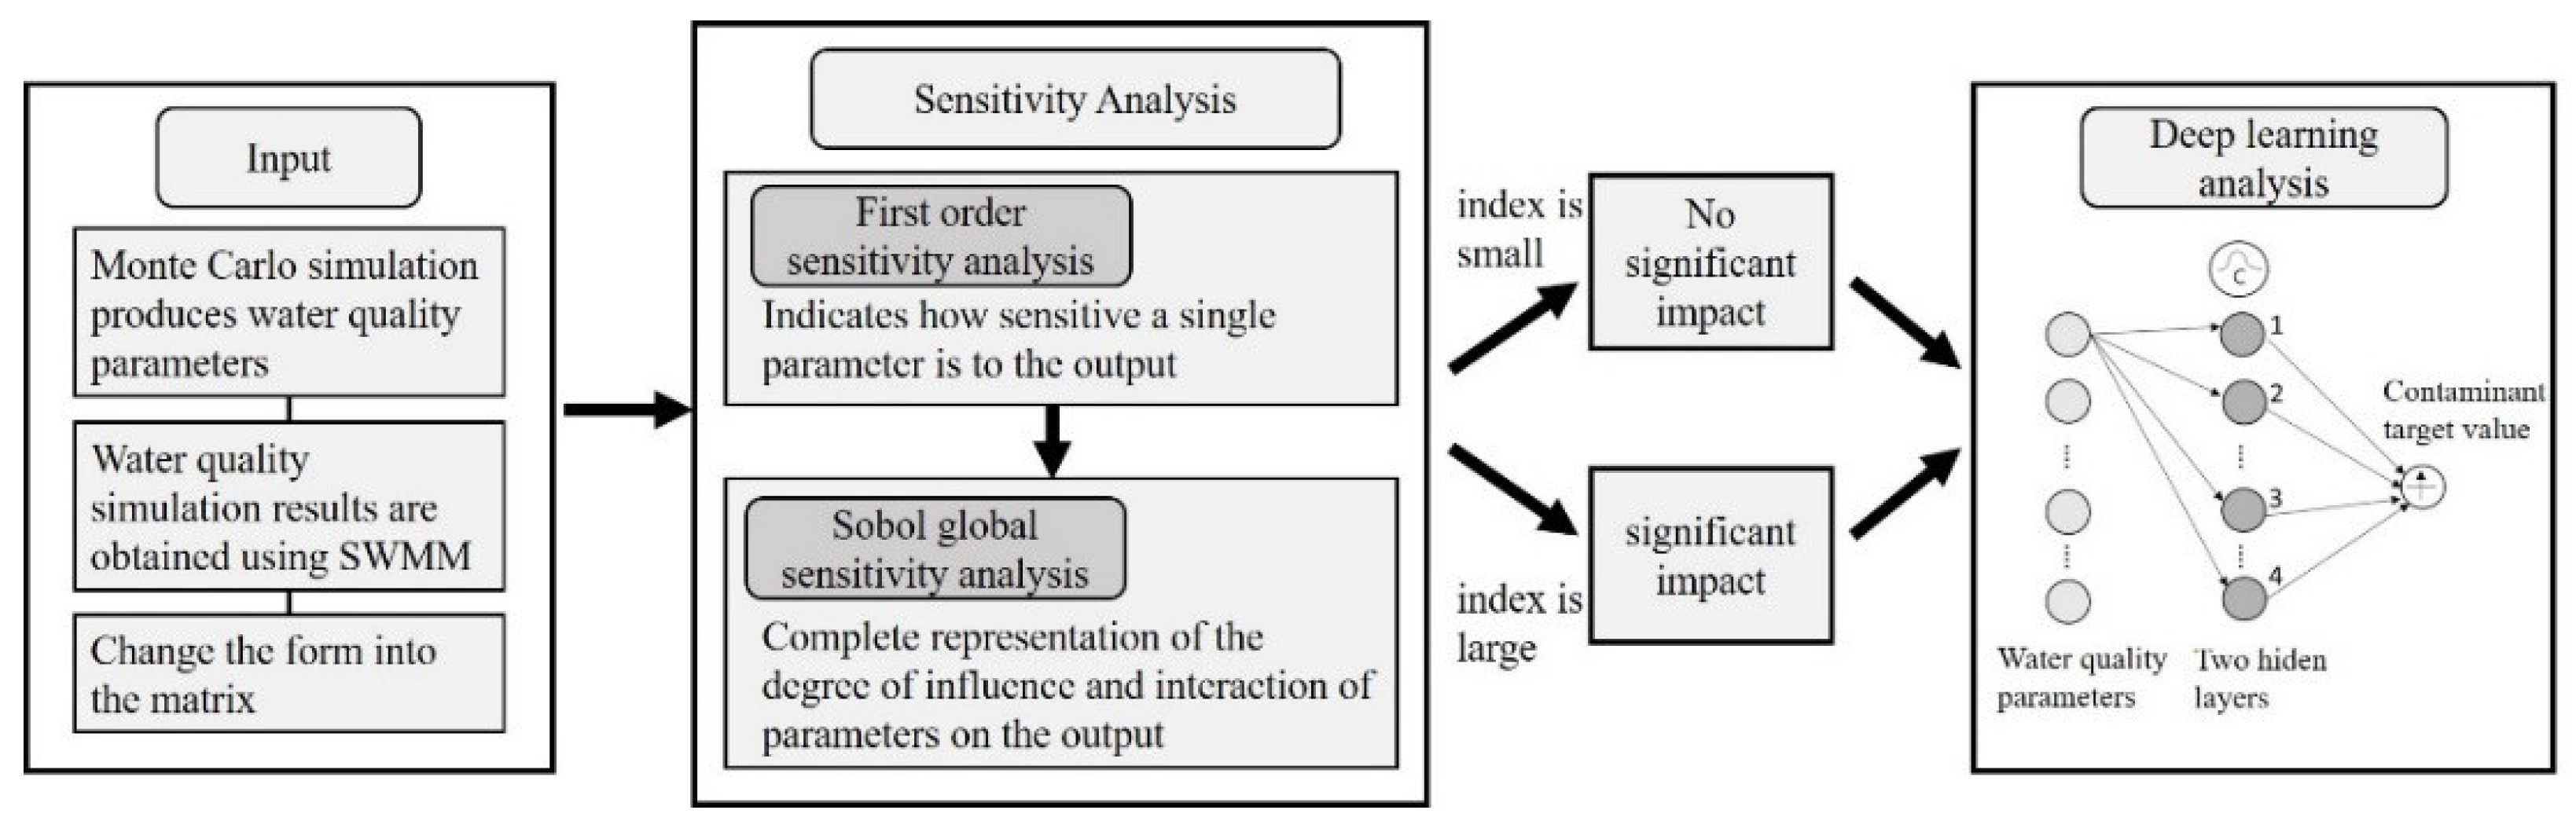
2.3. SWMM Modeling
2.3.1. Introduction to Modeling Computation
2.3.2. Parameter Selection and Calibration
2.3.3. Modelling Process
2.4. LID Configuration and Modeling Setting
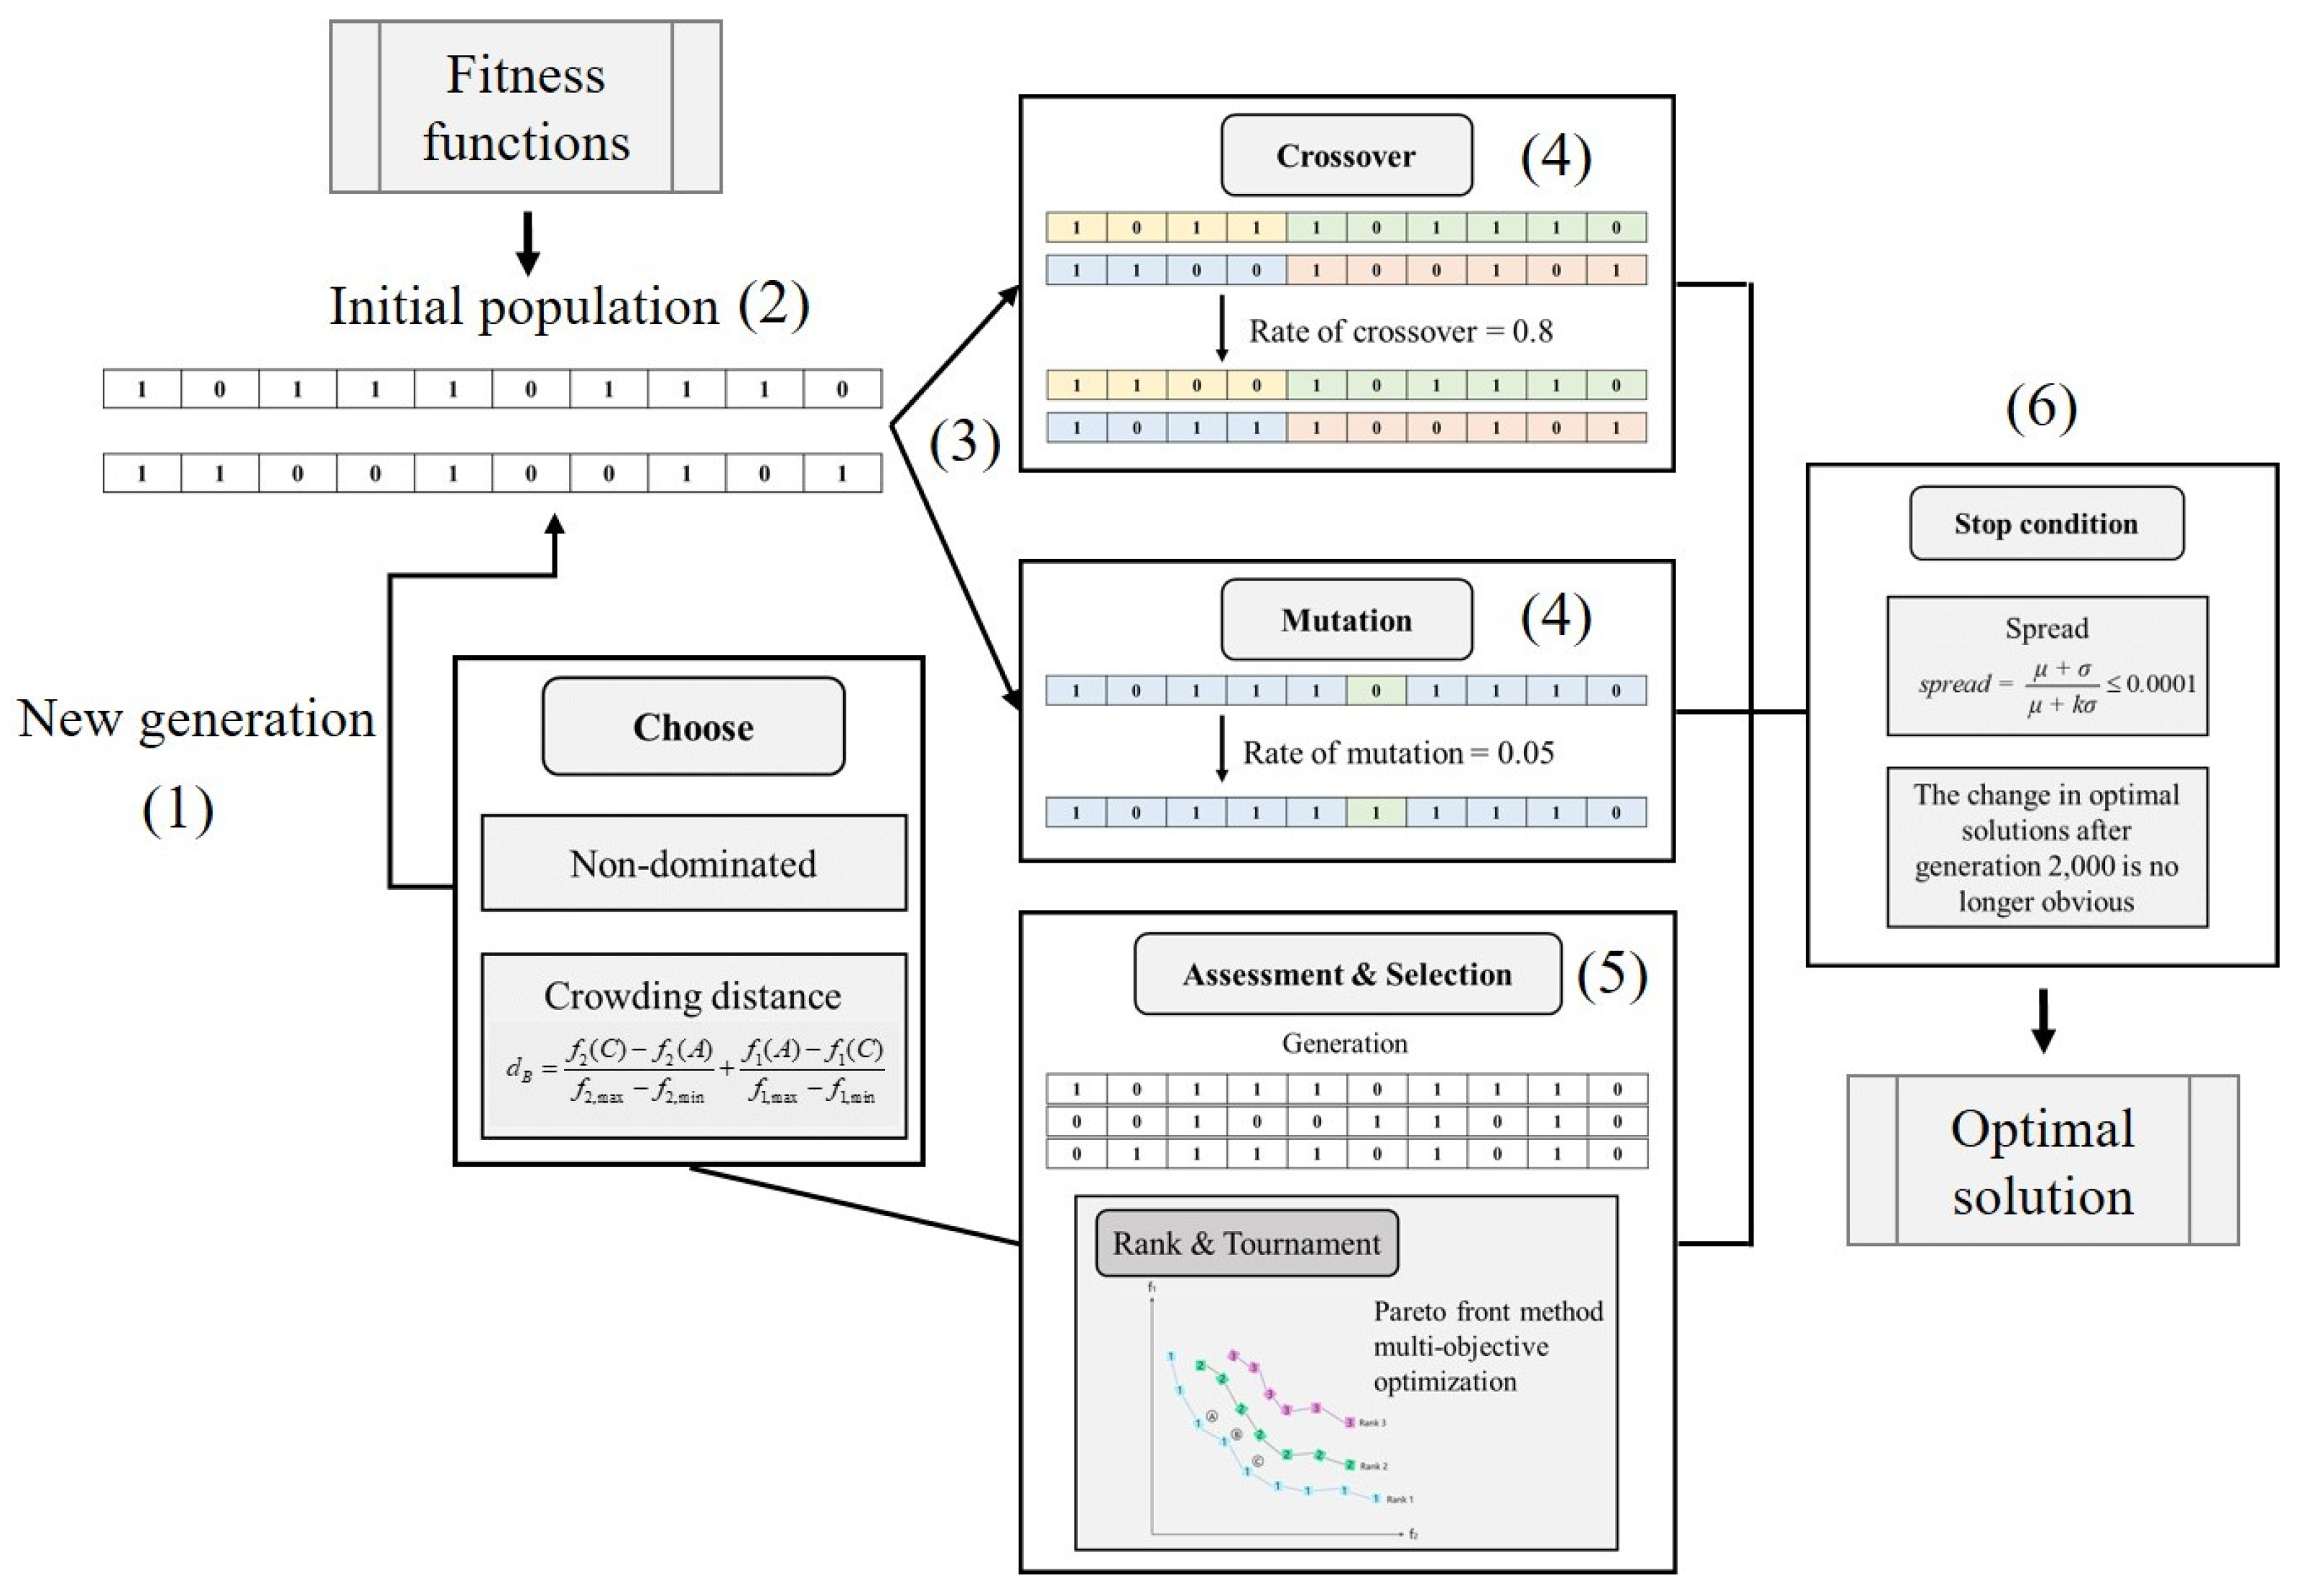
2.5. NSGA-II Optimization
3. Results and Discussion
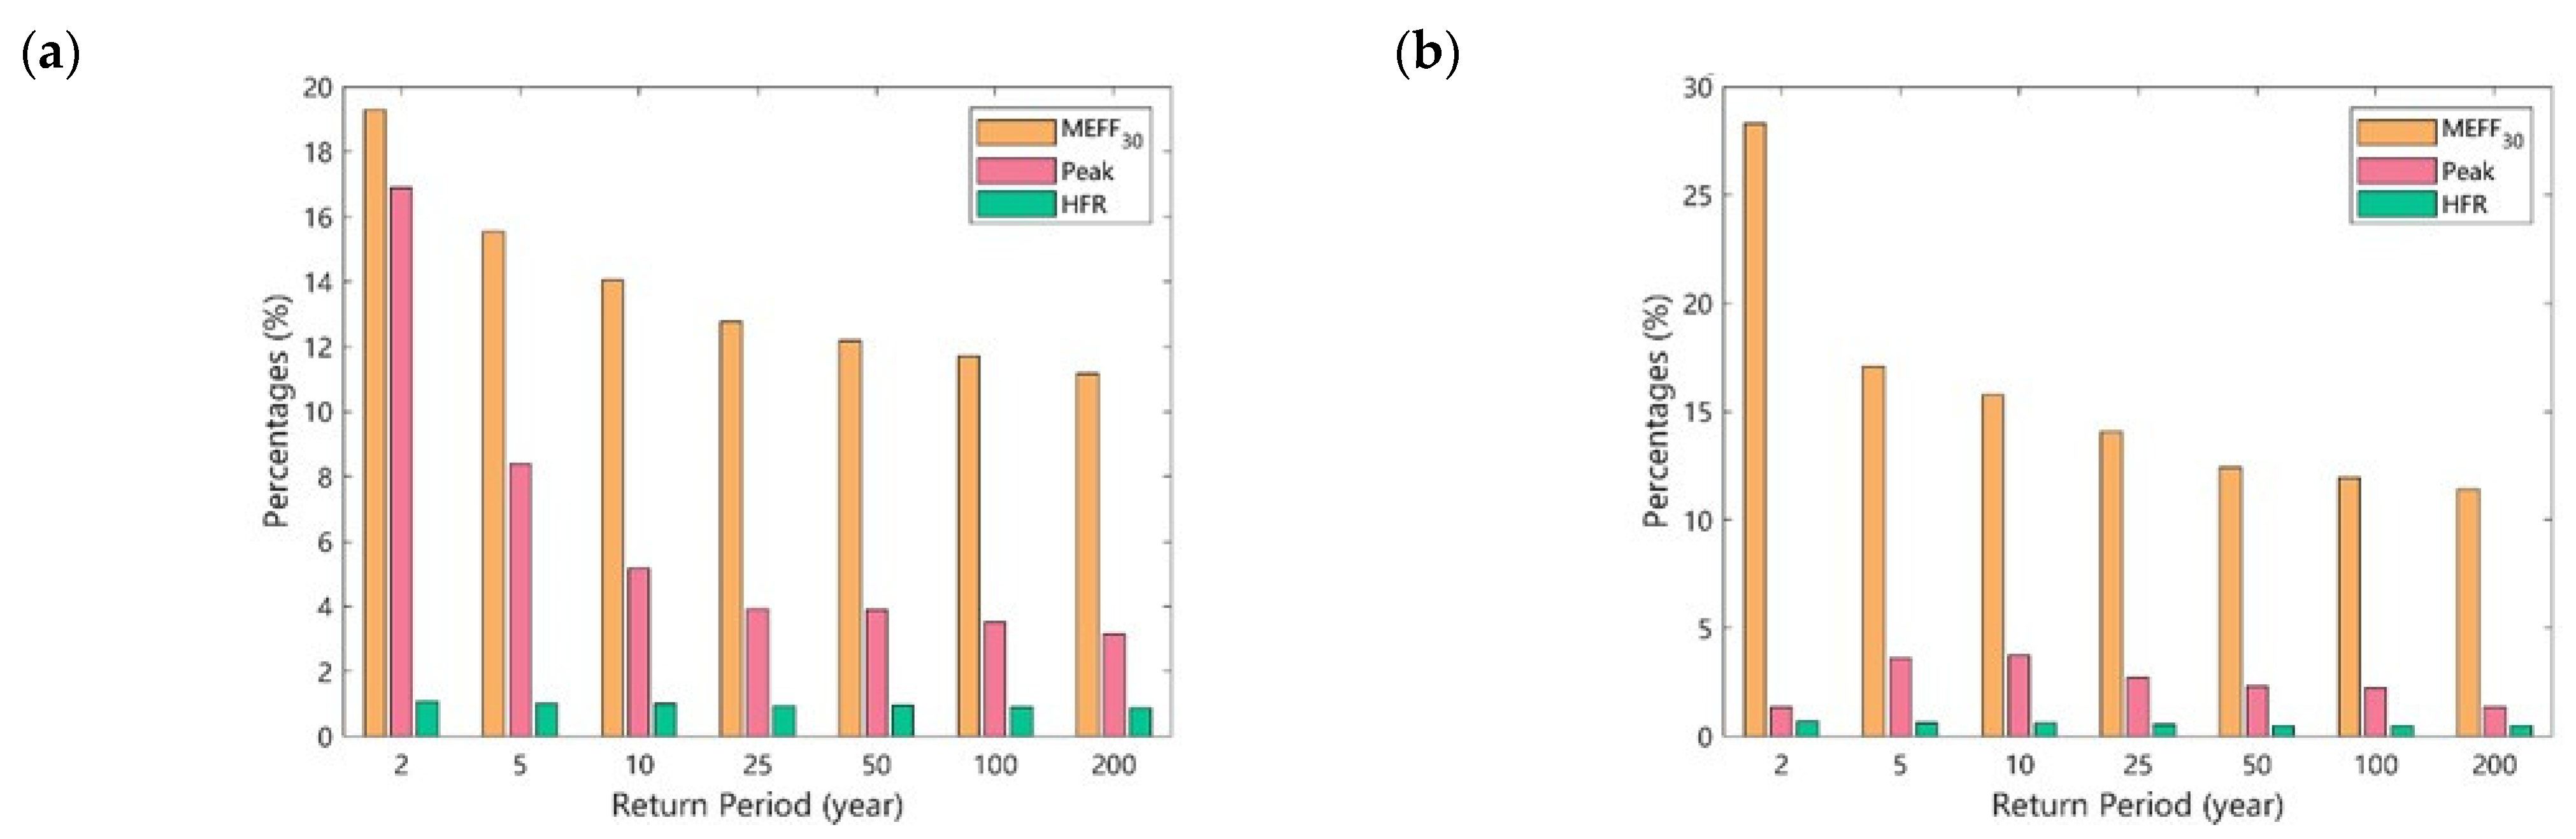
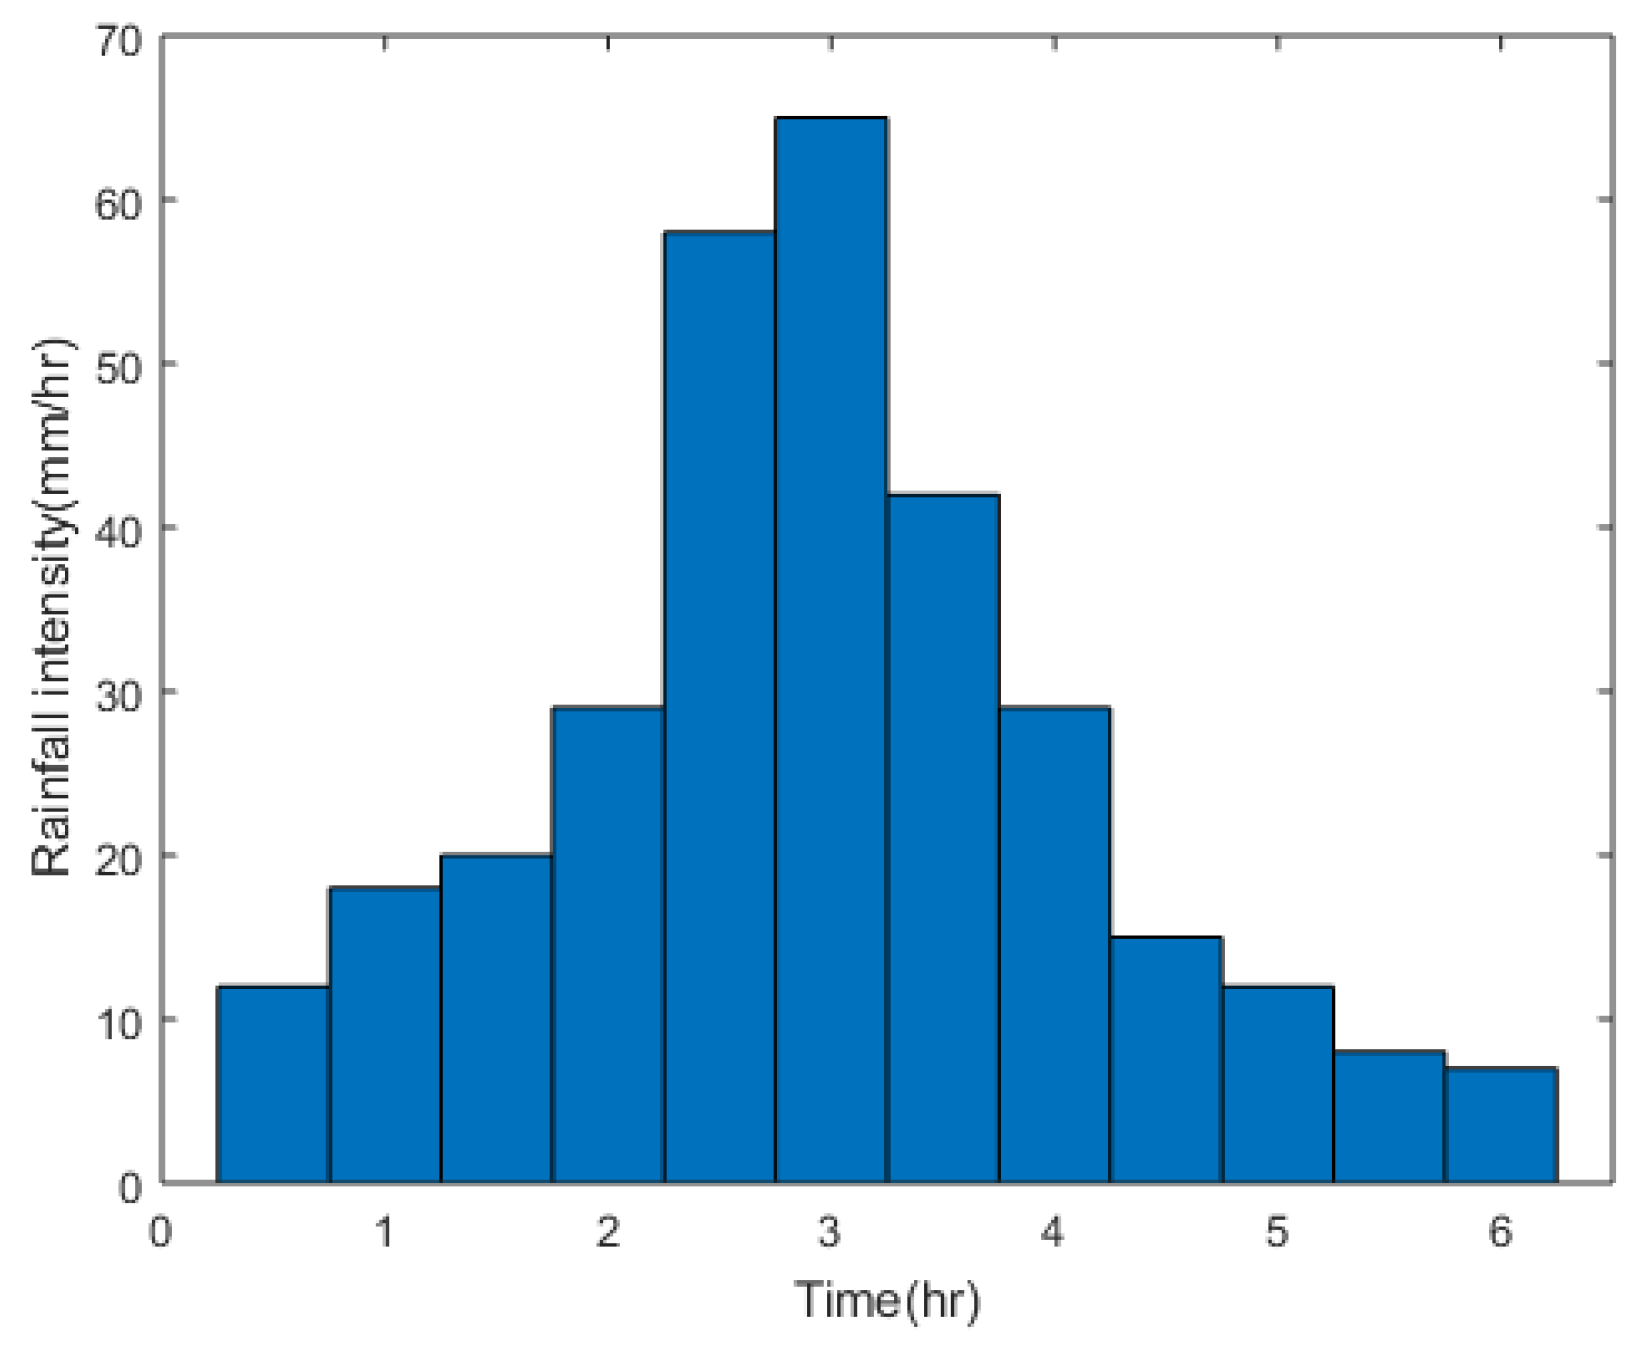
3.1. The Effect of Rainfall Pattern on LID
3.1.1. Considering the Benefits of LID and Retention Ponds
3.1.2. Considering LID Components and Costs
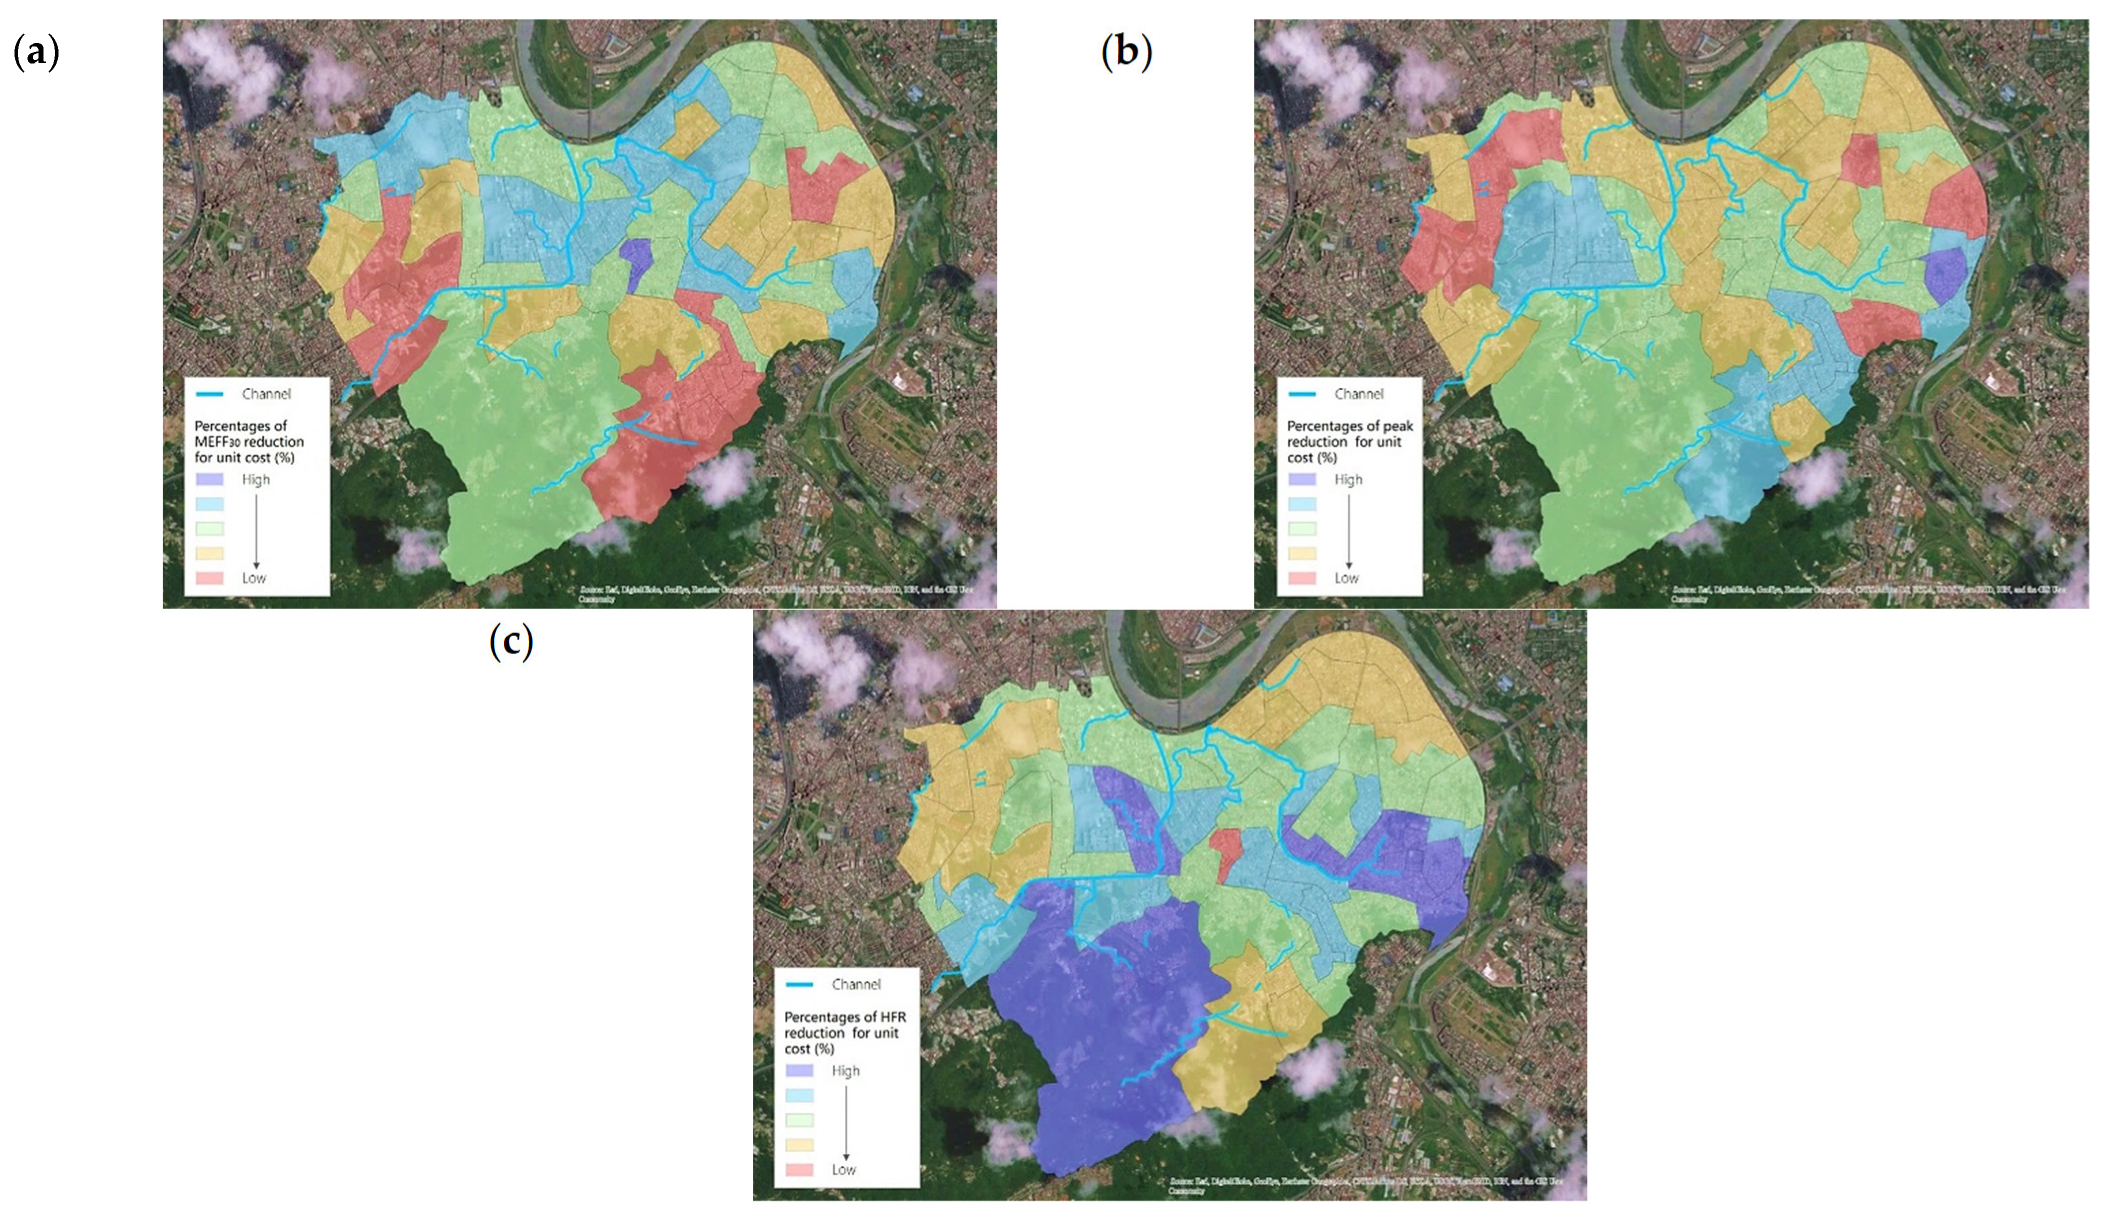
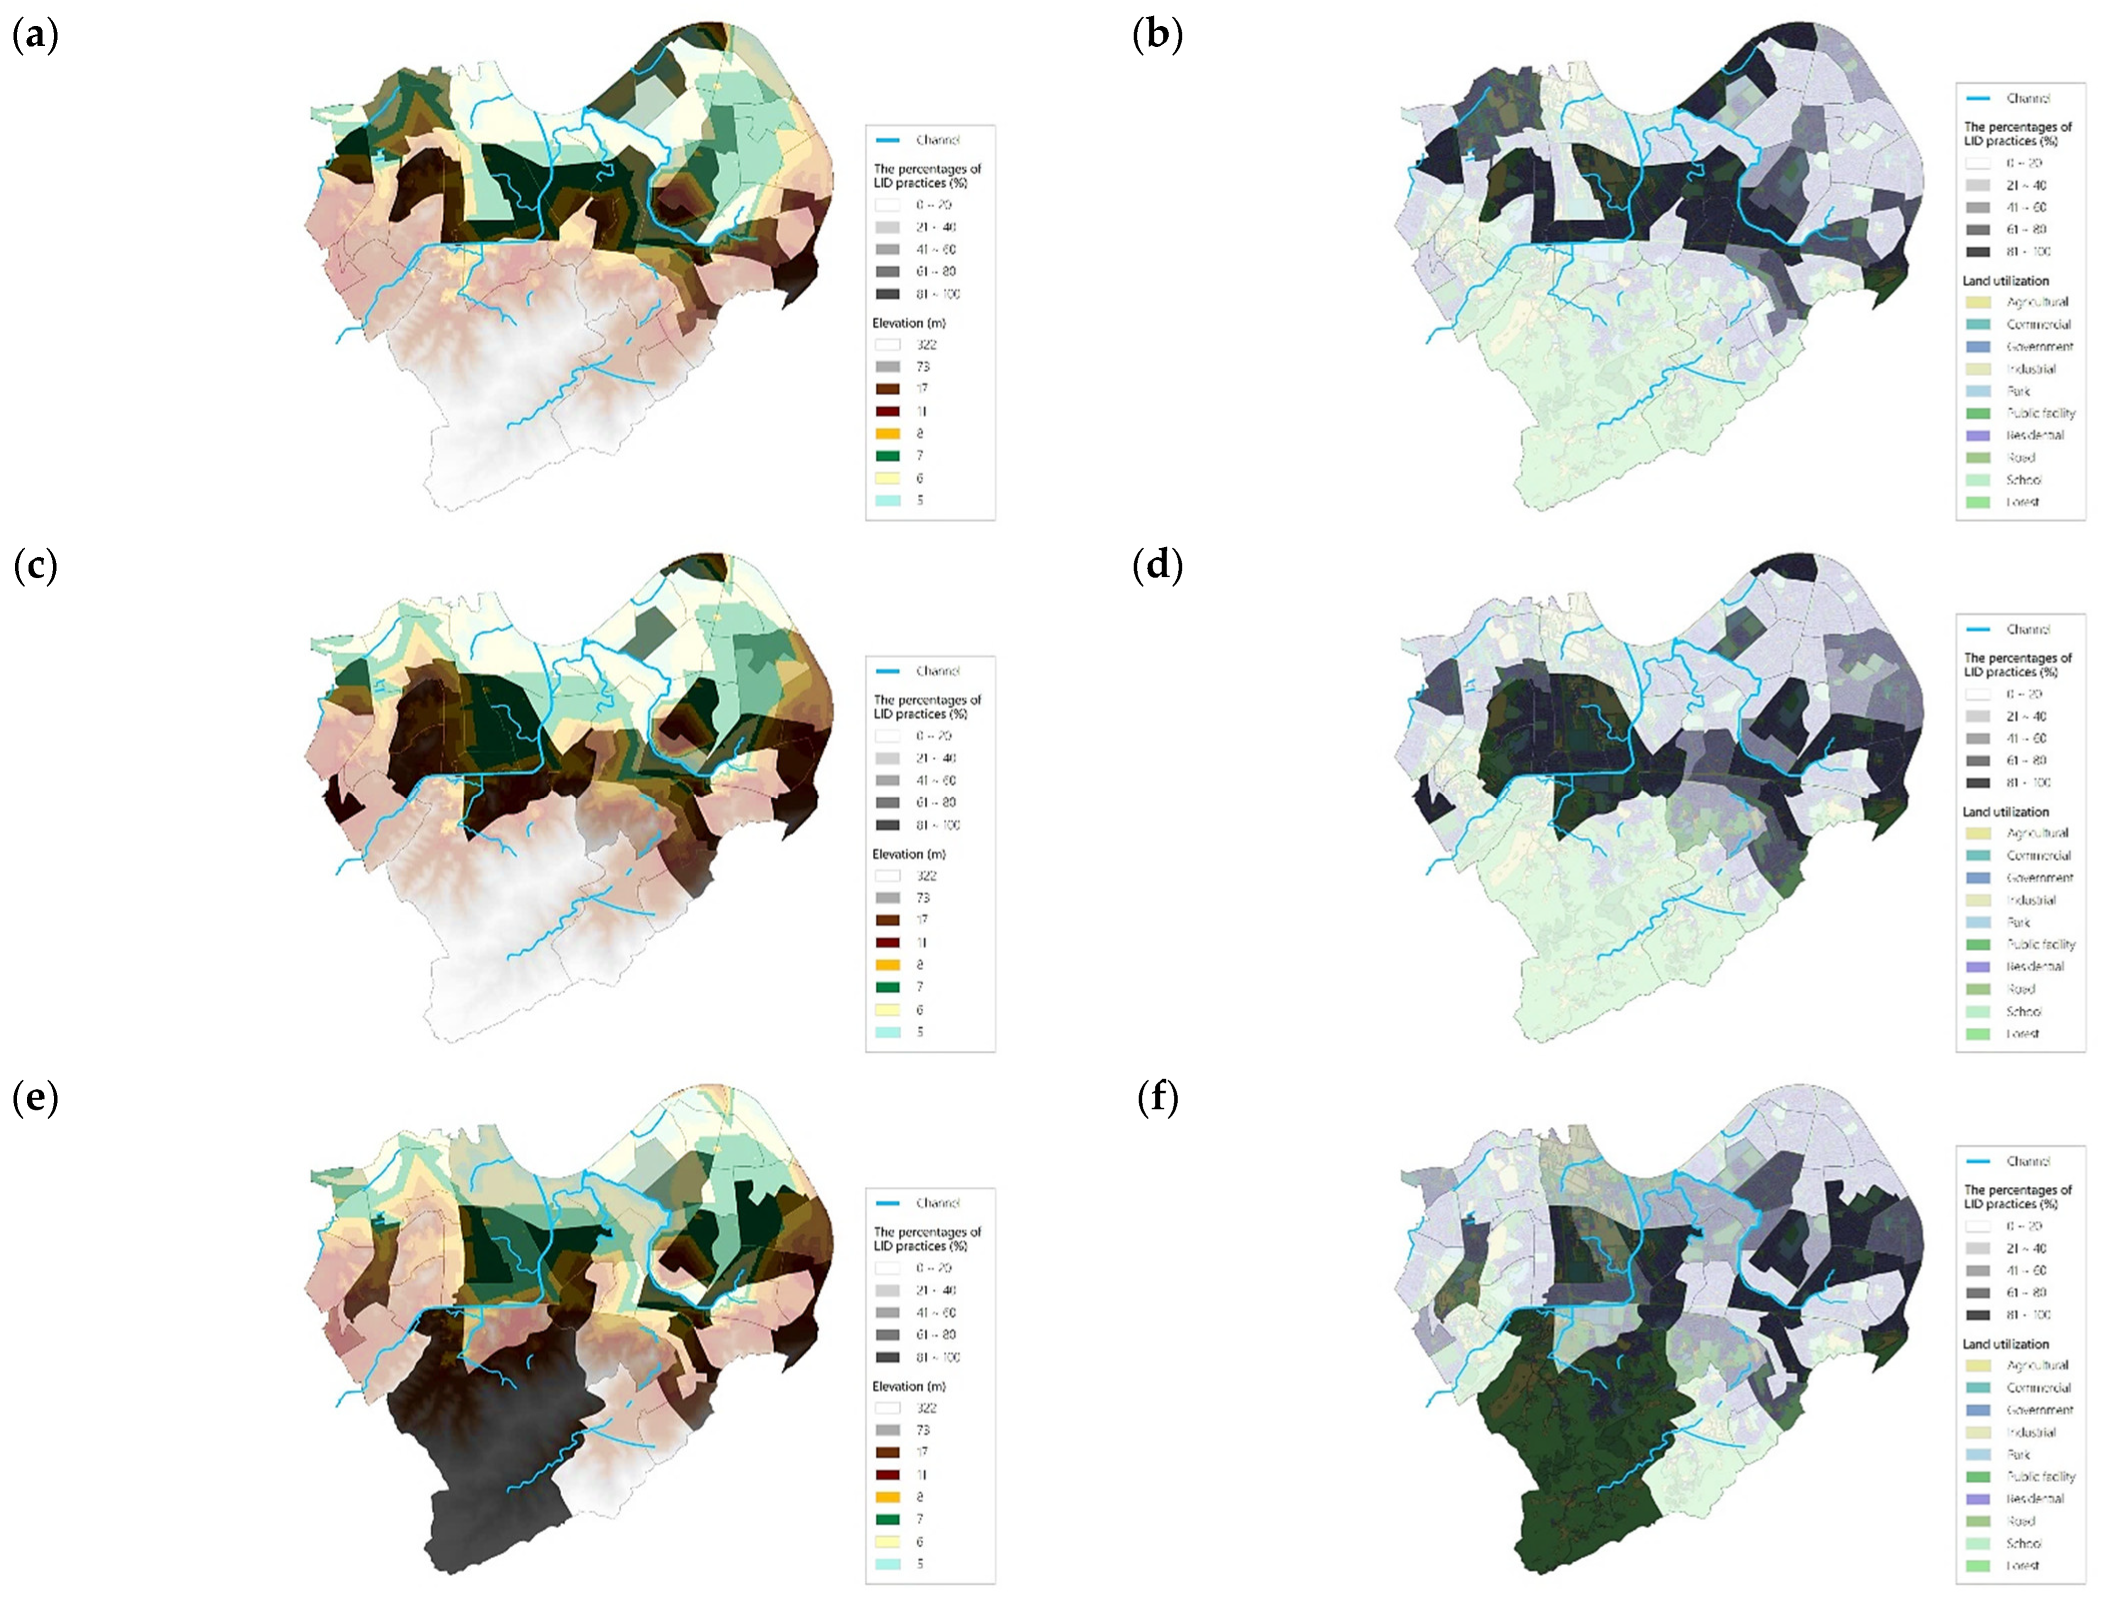
3.2. Optimize the Spatial Configuration of LID
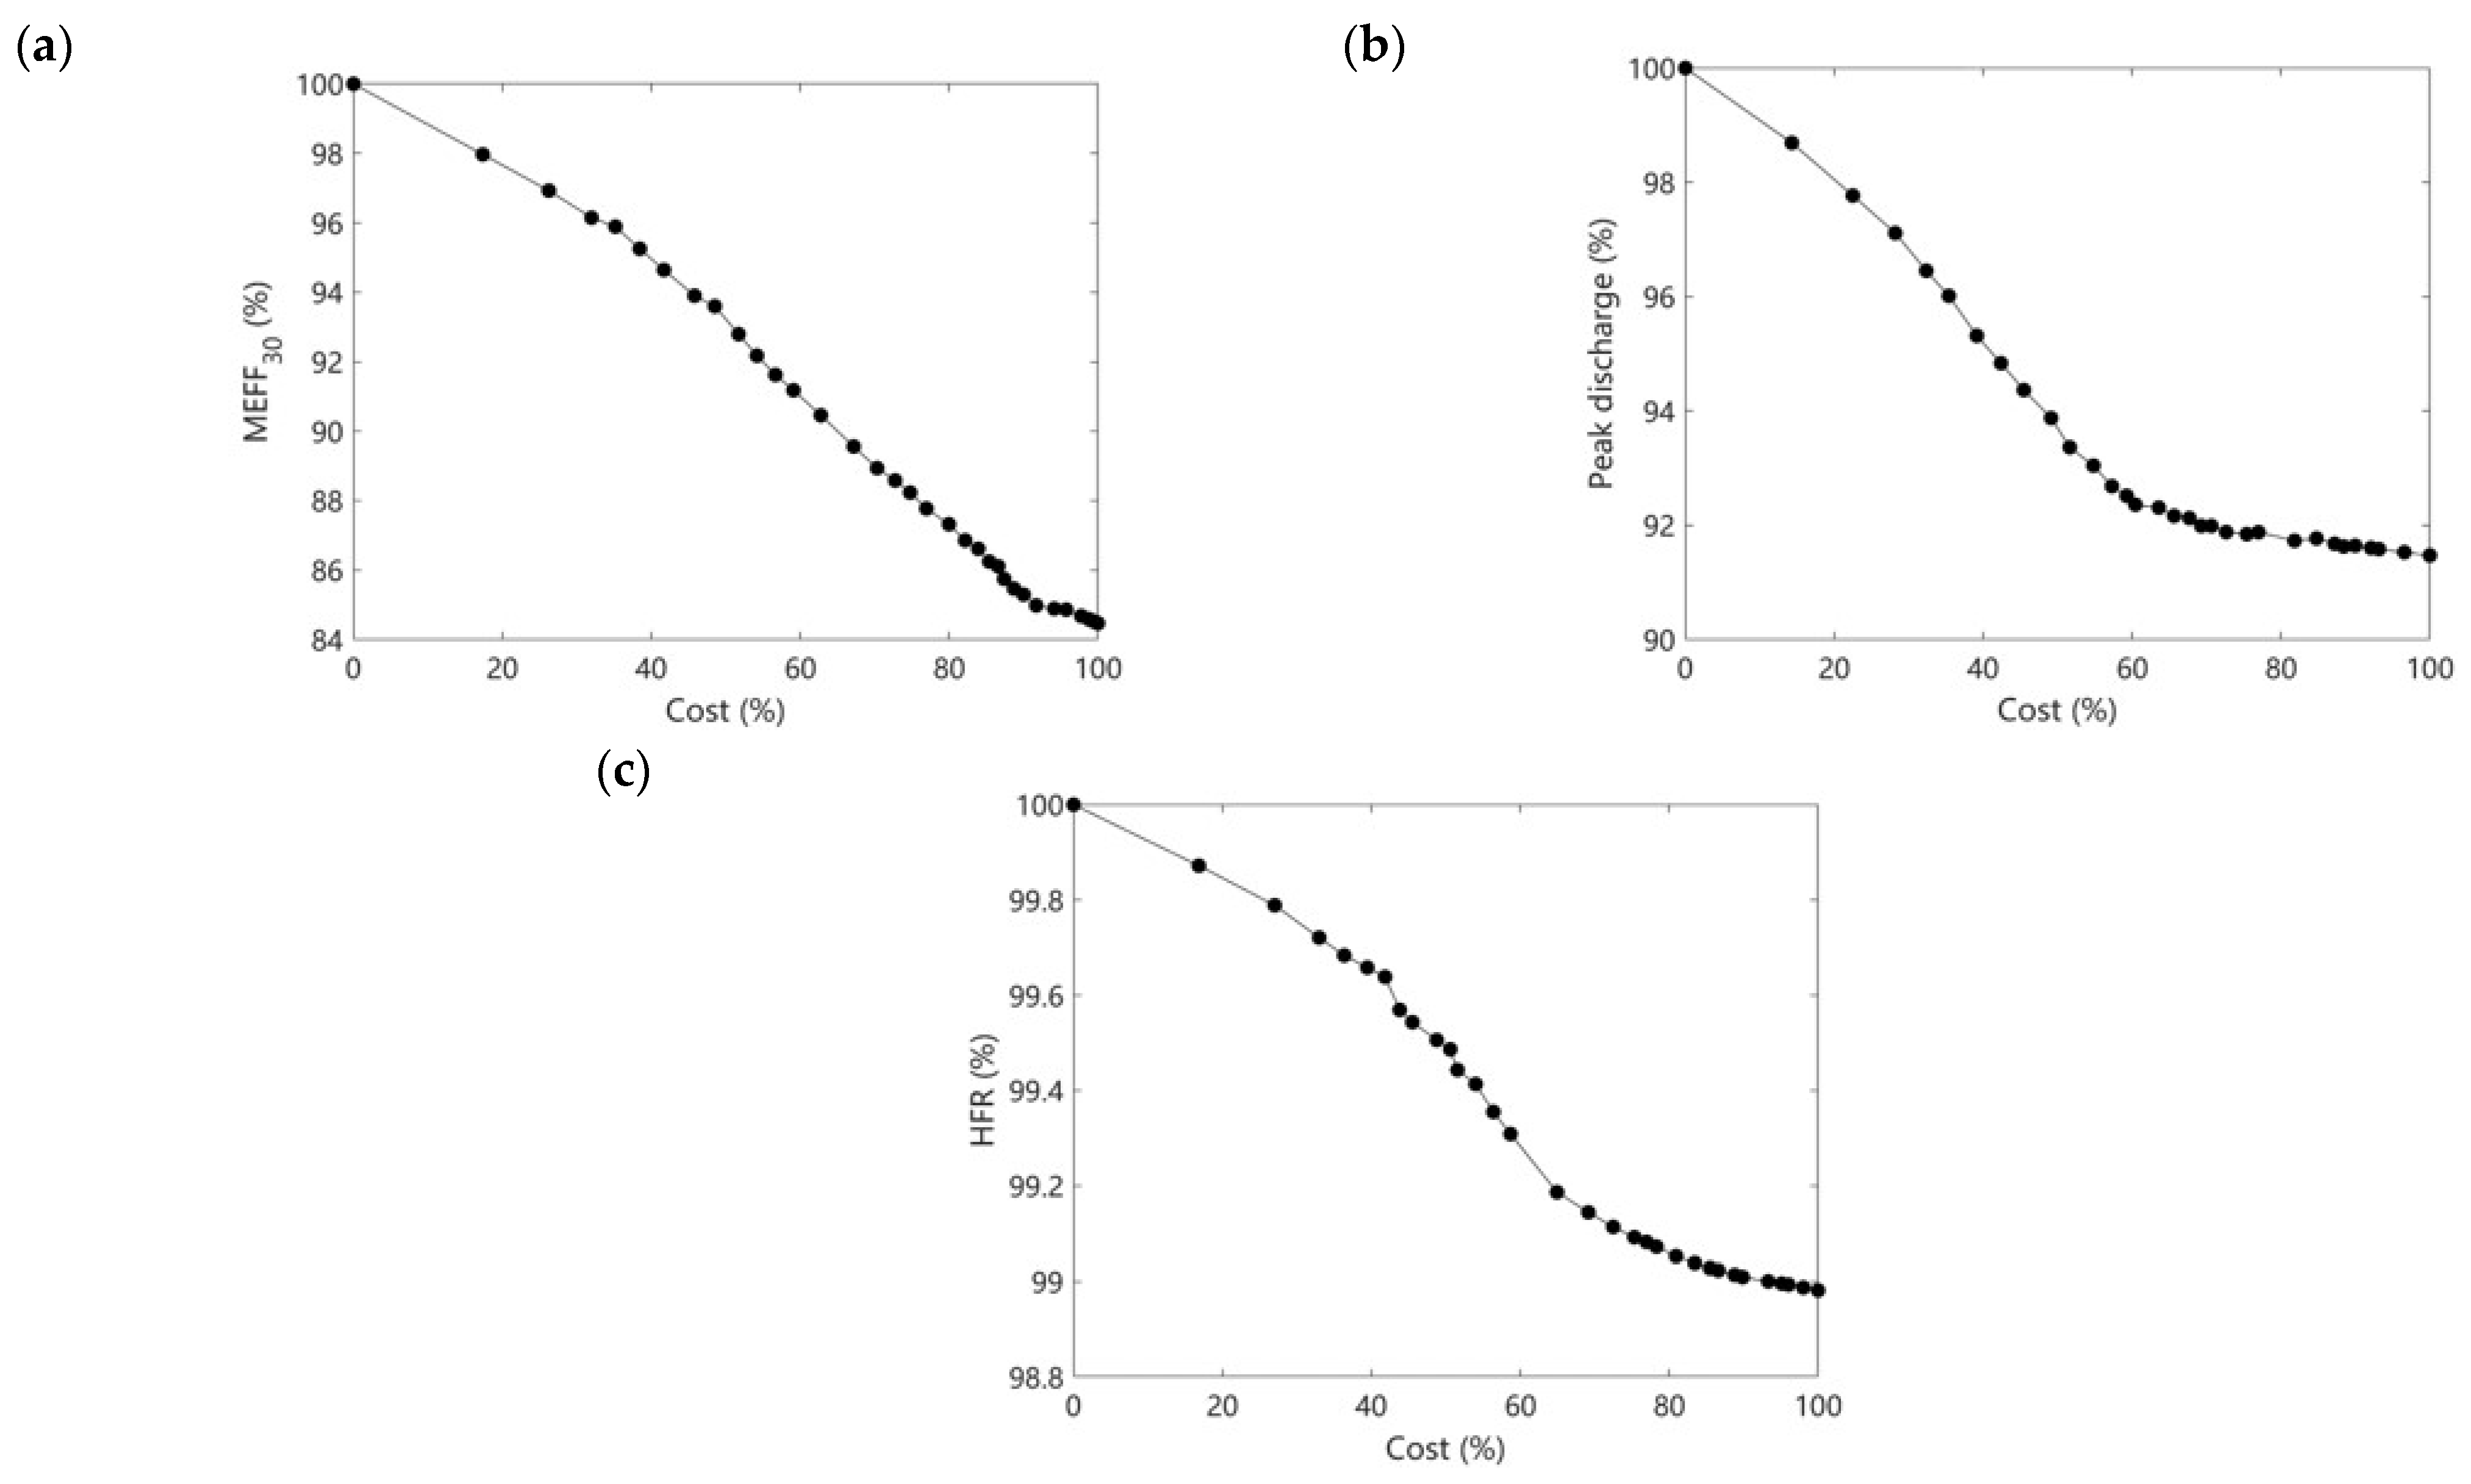
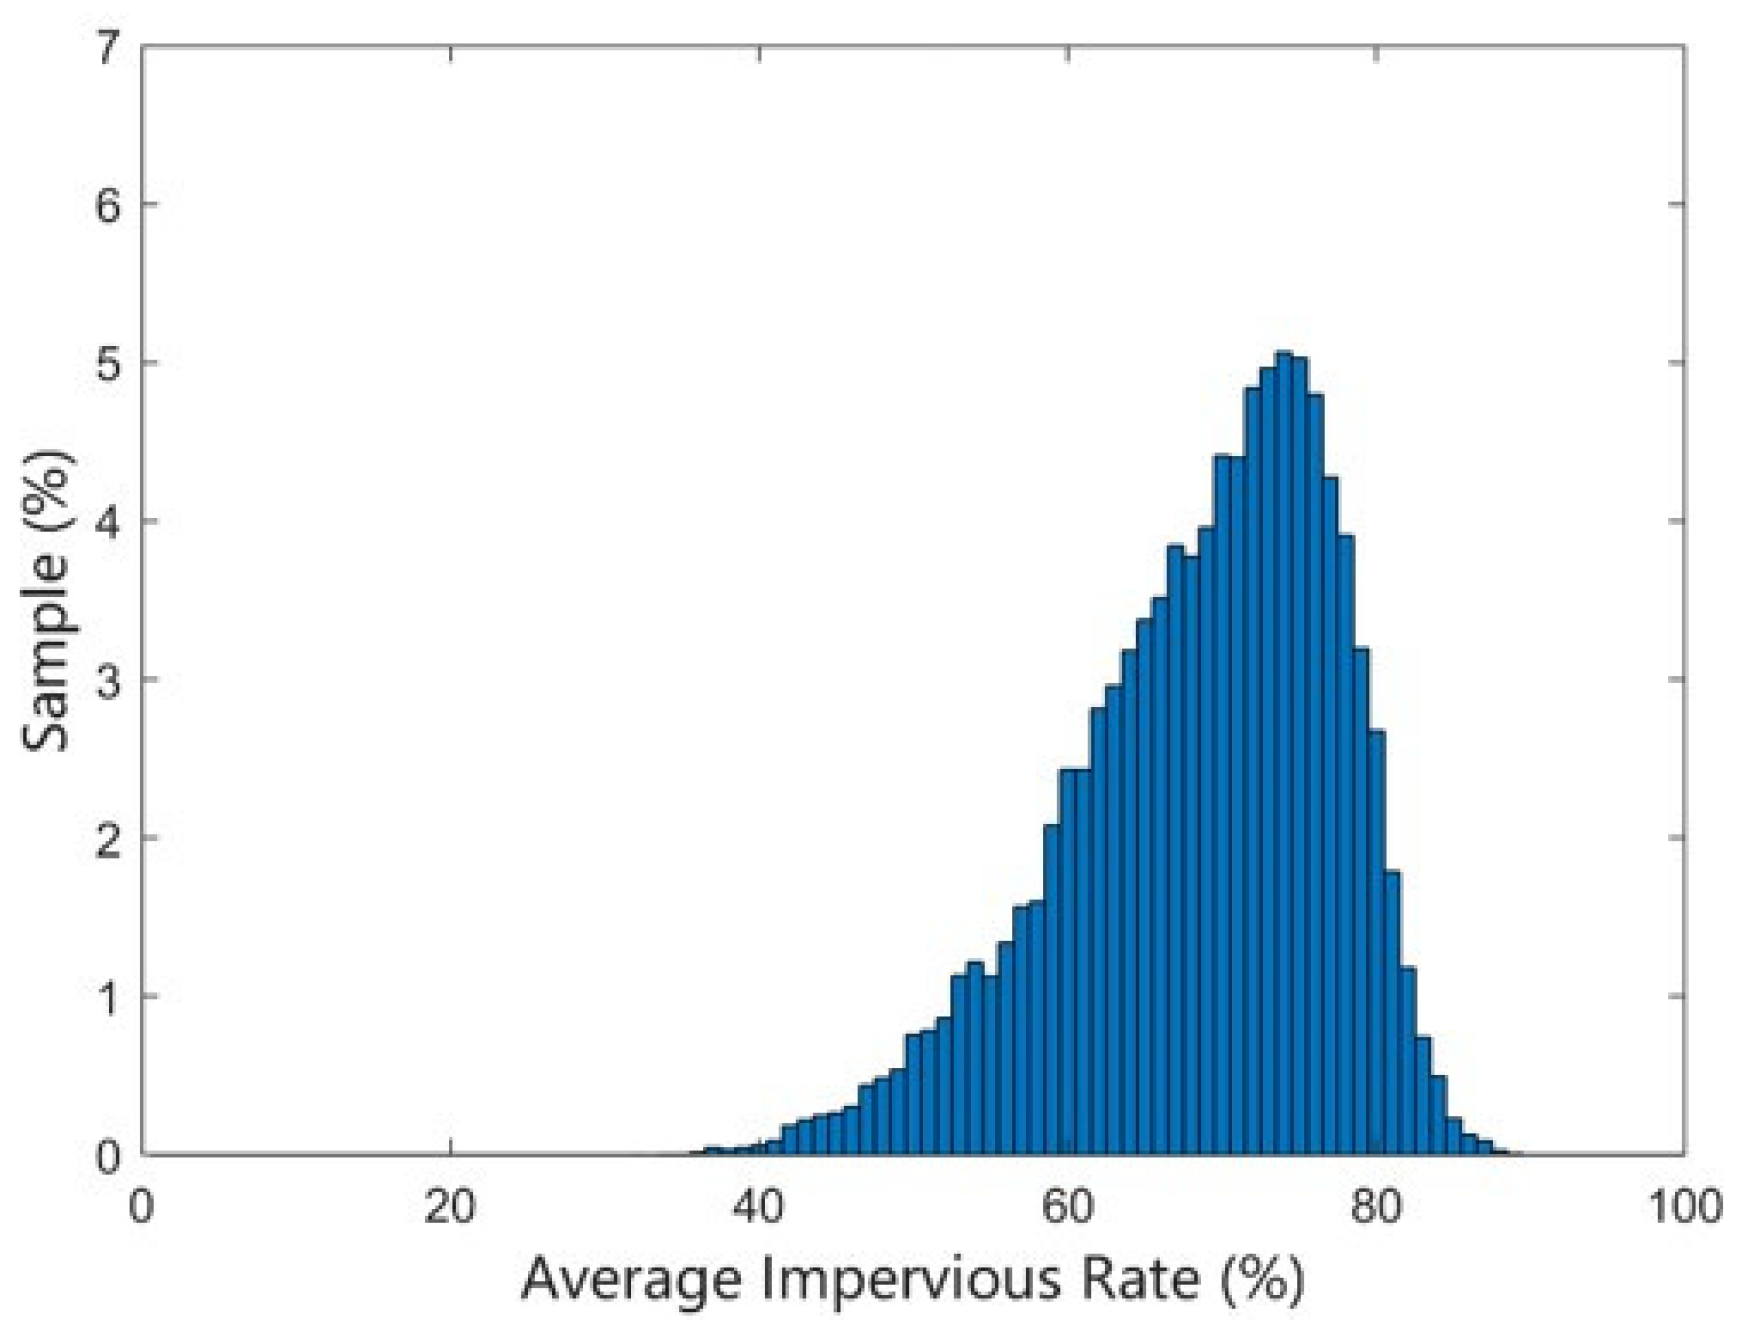
3.2.1. The Benefits of Extreme LID Configurations
3.2.2. Optimal Space Configuration of LID
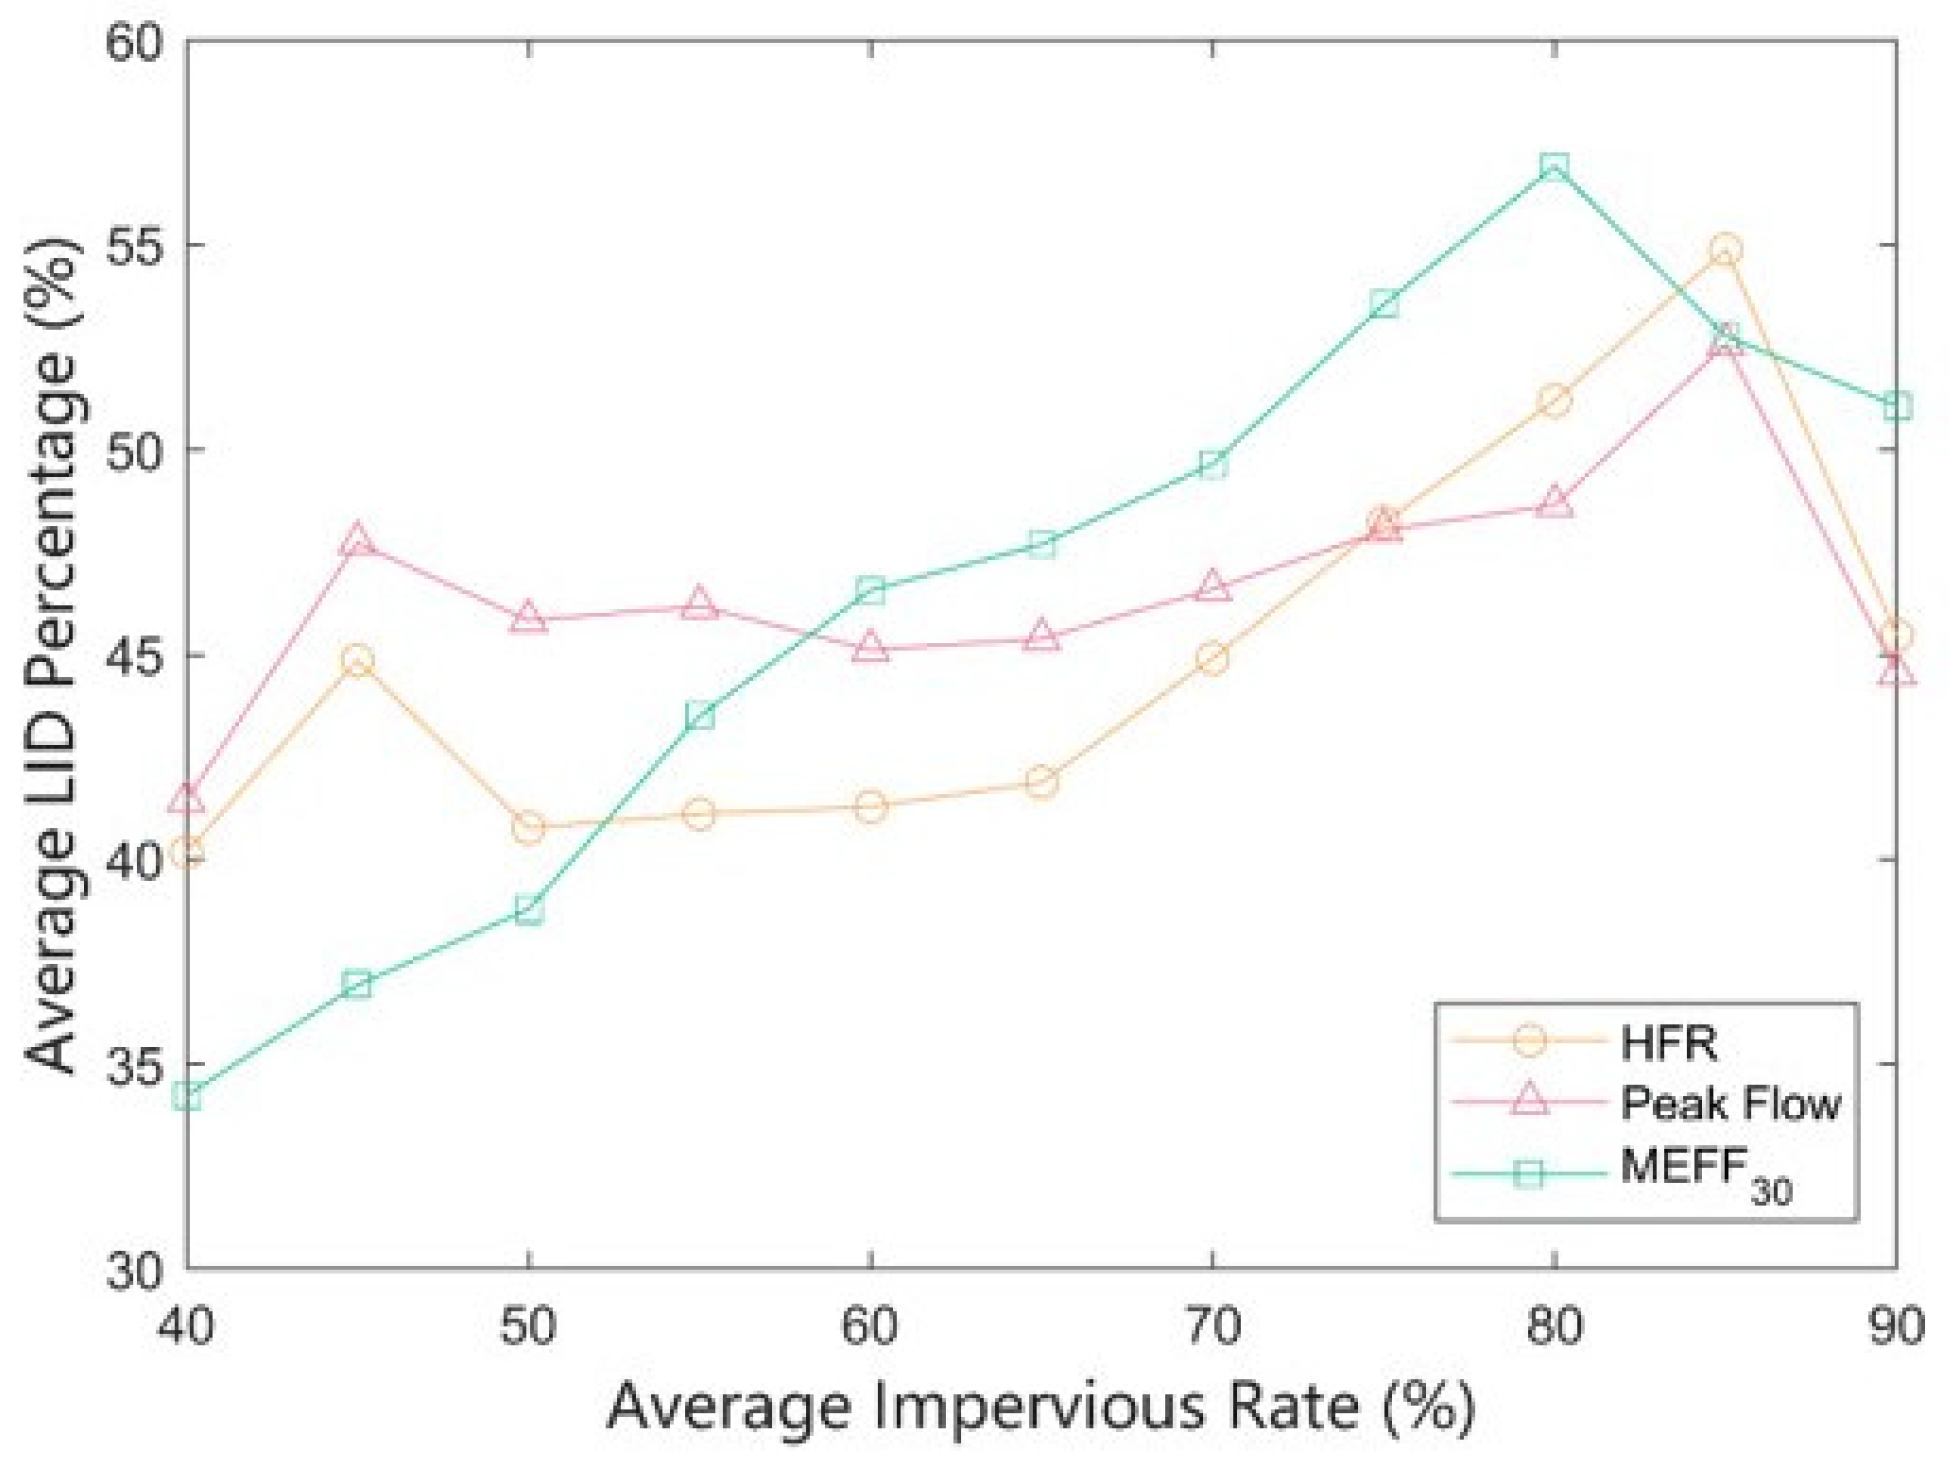
3.2.3. Correlation between the Optimal Configuration of LID and the Type of Land Use
4. Conclusions
Author Contributions
Funding
Institutional Review Board Statement
Informed Consent Statement
Data Availability Statement
Acknowledgments
Conflicts of Interest
References
- United States Environmental Protection Agency. Benefits of Low Impact Development. How LID Can Protect Your Community’s Resources; Office of Wetlands, Oceans, and Watersheds: Washington, DC, USA, 2012.
- Rosa, D.J.; Clausen, J.C.; Dietz, M.E. Calibration and verification of SWMM for low impact development. JAWRA J. Am. Water Resour. Assoc. 2015, 51, 746–757. [Google Scholar] [CrossRef]
- Dietz, M.E.; Clausen, J.C. Stormwater runoff and export changes with development in a traditional and low impact subdivision. J. Environ. Manag. 2008, 87, 560–566. [Google Scholar] [CrossRef] [PubMed]
- Zahmatkesh, Z.; Karamouz, M.; Goharian, E.; Burian, S.J. Analysis of the effects of climate change on urban storm water runoff using statistically downscaled precipitation data and a change factor approach. J. Hydrol. Eng. 2014, 20, 05014022. [Google Scholar] [CrossRef]
- Willems, P.; Olsson, J.; Arnbjerg-Nielsen, K.; Beecham, S.; Assela, P.; Gregersen, I.B.; Madsen, H.; Nguyen, V.-T.-V. Impacts of Climate Change on Rainfall Extremes and Urban Drainage Systems; IWA: London, UK, 2012. [Google Scholar]
- Vörösmarty, C.J.; Green, P.; Salisbury, J.; Lammers, R.B. Global water resources: Vulnerability from climate change and population growth. Science 2000, 289, 284–288. [Google Scholar] [CrossRef] [Green Version]
- United Nations. World Urbanization Prospects: The 2018 Revision; Department of Economic and Social Affairs, United Nations: New York, NY, USA, 2019. [Google Scholar]
- IPCC. Climate Change 2014: Synthesis Report. Contribution of Working Groups I, II and III to the Fifth Assessment Report of the Intergovernmental Panel on Climate Change; IPCC: Geneva, Switzerland, 2014. [Google Scholar]
- Roy, A.H.; Purcell, A.H.; Walsh, C.J.; Wenger, S.J. Urbanization and stream ecology: Five years later. J. N. Am. Benthol. Soc. 2009, 28, 908–910. [Google Scholar] [CrossRef]
- Misra, A.K. Impact of urbanization on the hydrology of Ganga Basin (India). Water Resour. Manag. 2011, 25, 705–719. [Google Scholar] [CrossRef]
- Ahiablame, L.M.; Engel, B.A.; Chaubey, I.J.W. Effectiveness of low impact development practices: Literature review and suggestions for future research. Water Air Soil Pollut. 2012, 223, 4253–4273. [Google Scholar] [CrossRef]
- Emerson, C.H.; Welty, C.; Traver, R.G. Watershed-scale evaluation of a system of storm water detention basins. J. Hydrol. Eng. 2005, 10, 237–242. [Google Scholar] [CrossRef]
- Fekete, A.; Hufschmidt, G.; Kruse, S. Benefits and Challenges of Resilience and Vulnerability for Disaster Risk Management. Int. J. Disaster Risk Sci. 2014, 5, 3–20. [Google Scholar] [CrossRef] [Green Version]
- Eckart, K.; McPhee, Z.; Bolisetti, T. Performance and implementation of low impact development—A review. Sci. Total Environ. 2017, 607–608, 413–432. [Google Scholar] [CrossRef]
- Sørup, H.J.D.; Fryd, O.; Liu, L.; Arnbjerg-Nielsen, K.; Jensen, M.B. An SDG-based framework for assessing urban stormwater management systems. Blue-Green Syst. 2019, 1, 102–118. [Google Scholar] [CrossRef] [Green Version]
- Guo, J.C.; Urbonas, B.; MacKenzie, K. Water quality capture volume for storm water BMP and LID designs. J. Hydrol. Eng. 2014, 19, 682–686. [Google Scholar] [CrossRef] [Green Version]
- Tang, S.; Jiang, J.; Zheng, Y.; Hong, Y.; Chung, E.-S.; Shamseldin, A.Y.; Wei, Y.; Wang, X. Robustness analysis of storm water quality modelling with LID infrastructures from natural event-based field monitoring. Sci. Total Environ. 2021, 753, 142007. [Google Scholar] [CrossRef] [PubMed]
- Hsu, N.S.; Hunag, Y.H.; Liu, H.J.; Cheng, W.M. The Research of Optimal Arrangement of Low Impact Development Infrastructure: A Case Study of Min-Sheng Community. Sinotech Eng. 2016, 131, 77–86. [Google Scholar]
- Liang, C.-Y.; You, J.-Y.; Lee, H.-Y. Investigating the effectiveness and optimal spatial arrangement of low-impact development facilities. J. Hydrol. 2019, 577, 124008. [Google Scholar] [CrossRef]
- Ho, H.-C.; Lin, S.-W.; Lee, H.-Y.; Huang, C.C. Evaluation of a Multi-Objective Genetic Algorithm for Low Impact Development in an Overcrowded City. Water 2019, 11, 2010. [Google Scholar] [CrossRef] [Green Version]
- Taghizadeh, S.; Khani, S.; Rajaee, T. Hybrid SWMM and particle swarm optimization model for urban runoff water quality control by using green infrastructures (LID-BMPs). Urban For. Urban Green. 2021, 60, 127032. [Google Scholar] [CrossRef]
- Giacomoni, M.; Joseph, J. Multi-objective evolutionary optimization and Monte Carlo simulation for placement of low impact development in the catchment scale. J. Water Resour. Plan. Manag. 2017, 143, 04017053. [Google Scholar] [CrossRef]
- Ashley, R.M.; Balmforth, D.J.; Saul, A.J.; Blanskby, J.D. Flooding in the future—Predicting climate change, risks and responses in urban areas. Water Sci. Technol. 2005, 52, 265–273. [Google Scholar] [CrossRef]
- Eckstein, D.; Hutfils, M.-L.; Winges, M. Global Climate Risk Index 2019. Who Suffers Most from Extreme Weather Events; Germanwatch: Bonn, Germany, 2018. [Google Scholar]
- Eckstein, D.; Künzel, V.; Schäfer, L. Global Climate Risk Index 2021. Who Suffers Most from Extreme Weather Events? Weather-Related Loss Events in 2019 and 2000–2019; Germanwatch: Bonn, Germany, 2021. [Google Scholar]
- Walsh, C.J.; Roy, A.H.; Feminella, J.W.; Cottingham, P.D.; Groffman, P.M.; Morgan, R.P. The urban stream syndrome: Current knowledge and the search for a cure. J. N. Am. Benthol. Soc. 2005, 24, 706–723. [Google Scholar] [CrossRef]
- Oraei Zare, S.; Saghafian, B.; Shamsai, A. Multi-objective optimization for combined quality–quantity urban runoff control. Hydrol. Earth Syst. Sci. 2012, 16, 4531–4542. [Google Scholar] [CrossRef] [Green Version]
- Zhang, G.; Hamlett, J.M.; Reed, P.; Tang, Y. Multi-Objective Optimization of Low Impact Development Designs in an Urbanizing Watershed. J. Optim. 2013, 2, 40368. [Google Scholar] [CrossRef] [Green Version]
- Li, F.; Yan, X.-F.; Duan, H.-F. Sustainable design of urban stormwater drainage systems by implementing detention tank and LID measures for flooding risk control and water quality management. Water Resour. Manag. 2019, 33, 3271–3288. [Google Scholar] [CrossRef]
- Baek, S.-S.; Ligaray, M.; Pyo, J.; Park, J.-P.; Kang, J.-H.; Pachepsky, Y.; Chun, J.A.; Cho, K.H. A novel water quality module of the SWMM model for assessing low impact development (LID) in urban watersheds. J. Hydrol. 2020, 586, 124886. [Google Scholar] [CrossRef]
- Goonetilleke, A.; Thomas, E.; Ginn, S.; Gilbert, D. Understanding the role of land use in urban stormwater quality management. J. Environ. Manag. 2005, 74, 31–42. [Google Scholar] [CrossRef] [Green Version]
- Ma, Z.-B.; Ni, H.-G.; Zeng, H.; Wei, J.-B. Function formula for first flush analysis in mixed watersheds: A comparison of power and polynomial methods. J. Hydrol. 2011, 402, 333–339. [Google Scholar] [CrossRef]
- Li, L.-Q.; Yin, C.-Q.; He, Q.-C.; Kong, L.-L. First flush of storm runoff pollution from an urban catchment in China. J. Environ. Sci. 2007, 19, 295–299. [Google Scholar] [CrossRef]
- Park, I.; Kim, H.; Chae, S.-K.; Ha, S. Probability mass first flush evaluation for combined sewer discharges. J. Environ. Sci. 2010, 22, 915–922. [Google Scholar] [CrossRef]
- Baek, S.-S.; Choi, D.-H.; Jung, J.-W.; Lee, H.-J.; Lee, H.; Yoon, K.-S.; Cho, K.H. Optimizing low impact development (LID) for stormwater runoff treatment in urban area, Korea: Experimental and modeling approach. Water Res. 2015, 86, 122–131. [Google Scholar] [CrossRef]
- Feng, W.; Wang, J.; Che, W. Analysis on characteristics of stormwater runoff flush on different land surfaces. Chin. J. Environ. Eng. 2012, 6, 817–822. [Google Scholar]
- Gupta, K.; Saul, A.J. Specific relationships for the first flush load in combined sewer flows. Water Res. 1996, 30, 1244–1252. [Google Scholar] [CrossRef]
- Stenstrom, M.K.; Kayhanian, M. First Flush Phenomenon Characterization; California Department of Transportation Division of Environmental Analysis: Sacramento, CA, USA, 2005.
- Giacomoni, M.H.; Zechman, E.M.; Brumbelow, K. Hydrologic footprint residence: Environmentally friendly criteria for best management practices. J. Hydrol. Eng. 2011, 17, 99–108. [Google Scholar] [CrossRef]
- Scott, T.J.; Politte, A.; Saathoff, S.; Collard, S.; Berglund, E.; Barbour, J.; Sprintson, A. An evaluation of the Stormwater Footprint Calculator and the Hydrological Footprint Residence for communicating about sustainability in stormwater management. Sustain. Sci. Pract. Policy 2014, 10, 14–27. [Google Scholar] [CrossRef] [Green Version]
- Giacomoni, M.; Gomez, R.; Berglund, E. Hydrologic impact assessment of land cover change and stormwater management using the hydrologic footprint residence. JAWRA J. Am. Water Resour. Assoc. 2014, 50, 1242–1256. [Google Scholar] [CrossRef]
- Huong, H.T.L.; Pathirana, A. Urbanization and climate change impacts on future urban flooding in Can Tho city, Vietnam. Hydrol. Earth Syst. Sci. 2013, 17, 379–394. [Google Scholar] [CrossRef] [Green Version]
- Chow, M.F.; Yusop, Z. Sizing first flush pollutant loading of stormwater runoff in tropical urban catchments. Environ. Earth Sci. 2014, 72, 4047–4058. [Google Scholar] [CrossRef]
- Carpenter, S.R.; Caraco, N.F.; Correll, D.L.; Howarth, R.W.; Sharpley, A.N.; Smith, V.H. Nonpoint pollution of surface waters with phosphorus and nitrogen. Ecol. Appl. 1998, 8, 559–568. [Google Scholar] [CrossRef]
- Singh, R.; Baz, M.; Gehlot, A.; Rashid, M.; Khurana, M.; Akram, S.V.; Alshamrani, S.S.; AlGhamdi, A.S. Water Quality Monitoring and Management of Building Water Tank Using Industrial Internet of Things. Sustainability 2021, 13, 8452. [Google Scholar] [CrossRef]
- Bertrand-Krajewski, J.-L.; Chebbo, G.; Saget, A. Distribution of pollutant mass vs volume in stormwater discharges and the first flush phenomenon. Water Res. 1998, 32, 2341–2356. [Google Scholar] [CrossRef]
- Kingma, D.P.; Ba, J. Adam: A Method for Stochastic Optimization; Cornell University: New York, NY, USA, 2017. [Google Scholar]
- Glorot, X.; Bengio, Y. Understanding the difficulty of training deep feedforward neural networks. In Proceedings of the Thirteenth International Conference on Artificial Intelligence and Statistics, Chia Laguna Resort, Sardinia, Italy, 13–15 May 2010. [Google Scholar]
- Ishigami, T.; Homma, T. An importance quantification technique in uncertainty analysis for computer models. In Proceedings of the First International Symposium on Uncertainty Modeling and Analysis, College Park, MD, USA, 3–5 December 1990. [Google Scholar]


| Land Use | LID Component | Proportion of Impermeable Areas | Area Reduction Factor | Setup Cost (NTD per m2) |
|---|---|---|---|---|
| Agricultural land | No LID | - | - | - |
| Right-of-way | Permeable pavement | 10% | 0.1 | 3000 |
| Slope area | No LID | - | - | - |
| Residential land | Green roof | 60% | 0.6 | 3300 |
| Commercial land | Rain barrel | 95% | 0.1 | 20,000 |
| Industrial land | Permeable pavement | 20% | 0.1 | 3000 |
| Land used for agency | Rain garden | 50% | 0.2 | 6800 |
| School land | Bioretention cell | 90% | 0.2 | 6800 |
| Park & Recreation land | Bioretention cell | 90% | 0.5 | 6800 |
Publisher’s Note: MDPI stays neutral with regard to jurisdictional claims in published maps and institutional affiliations. |
© 2022 by the authors. Licensee MDPI, Basel, Switzerland. This article is an open access article distributed under the terms and conditions of the Creative Commons Attribution (CC BY) license (https://creativecommons.org/licenses/by/4.0/).
Share and Cite
Ho, H.-C.; Lee, H.-Y.; Tsai, Y.-J.; Chang, Y.-S. Numerical Experiments on Low Impact Development for Urban Resilience Index. Sustainability 2022, 14, 8696. https://doi.org/10.3390/su14148696
Ho H-C, Lee H-Y, Tsai Y-J, Chang Y-S. Numerical Experiments on Low Impact Development for Urban Resilience Index. Sustainability. 2022; 14(14):8696. https://doi.org/10.3390/su14148696
Chicago/Turabian StyleHo, Hao-Che, Hong-Yuan Lee, Yao-Jung Tsai, and Yuan-Shun Chang. 2022. "Numerical Experiments on Low Impact Development for Urban Resilience Index" Sustainability 14, no. 14: 8696. https://doi.org/10.3390/su14148696