Article

Evaluation of Agricultural Machinery Using Multi-Criteria Analysis Methods

by
Adis Puška
1,*,
Miroslav Nedeljković
2,
Živče Šarkoćević
3,
Zoran Golubović
3,
Vladica Ristić
4 and
Ilija Stojanović
5
1
Faculty of Agriculture, Bijeljina University, Pavlovića put bb, 76300 Bijeljina, Bosnia and Herzegovina
2
Institute of Agricultural Economics, Volgina 15, 11060 Belgrade, Serbia
3
Faculty of Technical Sciences, University of Pristina, Knjaza Milosa 7, 38220 Kosovska Mitrovica, Serbia
4
Faculty of Applied Ecology (FUTURA), University Metropolitan, Požeška 83a, 11000 Belgrade, Serbia
5
College of Business Administration, American University in the Emirates, Dubai International Academic City, Dubai P.O. Box 503000, United Arab Emirates
*
Author to whom correspondence should be addressed.
Sustainability 2022, 14(14), 8675; https://doi.org/10.3390/su14148675
Submission received: 22 June 2022 / Revised: 12 July 2022 / Accepted: 12 July 2022 / Published: 15 July 2022

Abstract

:
To achieve the highest possible agricultural production, it is necessary to procure the appropriate agricultural machinery. A tractor is the most useful machine in agriculture that performs various functions. Therefore, the selection of a tractor is one of the key decisions in the agriculture-production process. This study aims to evaluate heavy tractors for agricultural production in Bosnia and Herzegovina. Since this is a selection between different tractors, which are evaluated using several criteria, the methods of multi-criteria analysis (MCDA) were used in this study. Five different methods were used to determine the weight of the criteria, of which a modified standard-deviation method is a new method used in practice, while the tractor ranking was performed using the CRADIS (compromise ranking of alternatives from distance to ideal solution) method. The results showed that the best-ranked tractor is A4, while the most deviations from the ranking occur when the entropy method is used. The contribution of this study is in the systematization of the methods for the objective determination of the criteria weights and the development of new methods to facilitate decision-making in agriculture and other industries.

1. Introduction

Agriculture is a branch of the economy with a high research focus nowadays. As with other industries, the introduction of technological innovation has become imperative for agriculture, so much attention is paid to the modernization of agricultural production [1]. Agricultural mechanization is an important factor in increasing the productivity of agricultural production and the quality development of agriculture [2]. In addition, the low supply of labor in agriculture requires that agricultural activities should be carried out using agricultural machinery [3]. Much attention should be paid to the selection of appropriate machinery in agriculture [4]. The basic requirement in agriculture is to reduce the costs of land cultivation [5], because it is necessary to reduce production costs to achieve higher revenues through the sale of agricultural products [6]. Based on that, productivity is the key economic indicator in achieving the set goals in agriculture. Agricultural production is under the influence of uncertainty, because the annual yield is affected by precipitation, temperature, and other natural conditions. Therefore, in order to reduce the impact of uncertainty on agricultural production, it is necessary to use the economy of scale and plant large quantities of agricultural crops.
Recent emergencies, such as the COVID-19 virus pandemic and local war conflicts, have shown that countries with rich agricultural production are more capable to withstand market fluctuations. To increase agricultural production, it is necessary to select the appropriate agricultural machinery. The purpose of agricultural mechanization is to achieve high income while minimizing costs, which is the basic postulate of agricultural production [7]. Tractors are the basic means of agricultural machinery used in agricultural production. They perform the most important operations in agriculture such as plowing, planting, cultivating, fertilizing, harvesting, and spraying [8]. Today, tractors are the main traction and propulsion tool in agricultural production. The OECD (Organization for Economic Cooperation and Development) defines tractors as self-propelled vehicles with wheels and at least two axles, with a basic use in agriculture, which are designed and constructed to meet the following two operations [9]:
To tow trailers;
To carry, tow, or move agricultural and forestry tools and machines, and, where necessary, hand over power for their work while the tractor is moving or stationary.
Buying tractors is a big investment for farmers, so it is necessary to choose from the multitude of the alternatives that exist on the market. When selecting a tractor, the criteria are first determined and then the alternatives are evaluated [10]. The choice of the criteria and alternatives is the basis for the application of multi-criteria analysis methods (MCDA) [11,12]. To cultivate large areas, farmers must choose tractors that fall into the category of heavy tractors [13].
When selecting a tractor using the MCDA method, the criteria for evaluating the alternatives must first be determined, followed by the alternatives. The most important criteria for farmers when buying a tractor are the brand, power, price, and characteristics of the tractor [8]. The selected criteria need to be evaluated, and the weights need to be determined [14]. Two approaches are used in determining the weights, namely the subjective determination of the criteria weights and the objective determination of the criteria weights [15]. When subjectively determining the weight of the criteria, the opinion of decision-makers (DM) is used for the importance of a certain criterion [16]. In the objective determination of the importance of criteria [17], the values of the alternatives are taken and based on these values, and the weights of the criteria are calculated using certain methods [18]. In these methods, there is no effect of DM on the value of the criterion weight [19].
In this study, an objective approach was used for calculating the weight because the values of the alternatives themselves are objectively determined, i.e., they are not determined subjectively. When using objective determination of weighting factors, there are various methods such as CRITIC (CRiteria Importance Through Inter-criteria Correlation), entropy, standard deviation, and MEREC (MEthod based on the Removal Effects of Criteria) [20]. In addition to these methods, the modified standard deviation method was used to determine the weight of the criteria. This method aims to facilitate the calculation of a criterion weight, while obtaining similar weights to the other methods.
Based on the previous, the following goals are set for this study:
Evaluation of heavy tractors for agricultural production in Bosnia and Herzegovina (BiH) using MCDA methods;
Determining the influence of criteria weights obtained through methods for the objective determination of criteria weights on tractor evaluation;
Comparison of the modified standard deviation method with other methods for the objective determination of criteria weights.
In addition to the introduction, the paper is divided into five selections. In Section 2, a review of the literature is performed that focuses on the selection of tractors and on the use of objective methods in agriculture. Section 3 presents the research methodology and research methods. In Section 4, the ranking of different tractors and the selection of the tractor that best meets the set criteria are presented. The results obtained are also discussed. Section 5 presents the most important results and provides guidelines for future research.

2. Literature Review

Within the literature review, a review of the literature on tractor selection is shown first, followed by a review of the literature on the application of objective methods for determining weights in agriculture.

2.1. Selection of Tractors in Agriculture

Gürsoy et al. [21] selected the tractor based on its power to optimize mechanization in agriculture. Shorkpor and Asakereh [22] selected the best tractor in the Saral region of the Dyvandara district. According to their results, the best tractor was a medium-range BMI 285. When selecting a tractor, they used the following criteria: driving wheel, gearbox, PTO (RPM), number of cylinders, and power (hp). Zhu et al. [23] evaluated tractor propulsion and introduced a mechanical–electronic–hydraulic powertrain system in tractors to improve tractor performance. Xia et al. [24] investigated how power transmission is performed in tractors and proposed a new power-cycle hydro–mechanical continuously variable transmission to optimize tractor performance. Baek et al. [25] tested gears in a tractor to reduce maintenance costs. Ruiz-Garcia and Sanchez-Guerrero [8] conducted research using a web-based decision-support tool.
Mishra and Satapathy [26] surveyed farms on the maintenance of agricultural machinery with an emphasis on the maintenance of tractor attachments, and they used the SWARA (Step-wise Weight Assessment Ratio Analysis) method. Lalremruata et al. [27] analyzed the impact of the noise of six tractors on the driver’s ear during tillage operations. When selecting a tractor, they used the following criteria: engine, power drive, power, rated engine speed, weight, and number of gears. Okoko and Ajav [28] examined how different ways of plowing affect tractor operation and obtained results on how tractor speed and tillage depth affect their operation. Fargnoli and Lombardi [29] reviewed work on examining the safety of tractor use in everyday agricultural activities because of the high rate of injuries to farmers. Hou et al. [30] examined how much the use of tractors in Beijing districts emits harmful particles into the atmosphere. Mutlu [31] researched which tractors are the best-selling on the market.
Russini et al. [32] conducted a study of the traction performance of agricultural tractors and observed a high correlation between the power obtained in the test and the estimated power. Lee et al. [33] tested the engine speed-control system to maximize fuel efficiency in tractors. Lagnelöv et al. [34] investigated the application of autonomous tractors to batteries in agriculture. They pointed out that the biggest costs are related to batteries, but in addition, these tractors have proven to be competitive compared to classic tractors. Malik and Kohli [35] examined the application of electric tractors in agriculture to apply sustainable agricultural production. Lipkovich et al. [36] considered the application of the fifth generation of tractors based on mobile powertrains. Sunusi et al. [37] reviewed the possibility of applying online control over tractors in agriculture.
Perez-Domnguez et al. [38] evaluated tractors using dimensional analysis and aggregated intuitionistic fuzzy dimensional (AIFDA) techniques. Ormond et al. [39] conducted an experiment with soybean sowing using a tractor and found that the density of sowing leads to a higher prevalence of Asian rust. They used the area under the disease progress curve (AACPD) method. Hu et al. [40] used the ANP (analytic network process) and BSC (balanced scorecard) methods in order to develop a network of machinery maintenance for agricultural production. Hoose et al. [41] used the AHP and DEA (data envelopment analysis) methods to select tractor-trailers for grain transportation. Lu et al. [42] used the TOPSIS (Technique for Order of Preference by Similarity to Ideal Solution) method to select suppliers for new agricultural machinery for the development of agricultural production.
Yang et al. [43] applied multi-objective disassembly of harvester production to reduce the carbon footprint of production. For this purpose, they used the MDFOA method (multi-objective disassembly line balancing fruit fly optimization algorithm). Lalghorbani and Jahan [44] evaluated combined harvesters using the MULTIMOORA (multi-objective optimization on the basis of ratio analysis) method in order to optimize agricultural production. Han et al. [45], using the multi-objective mixed integer program (MIP) method, which optimized the use of agricultural mechanization during production in such a way that more work can be accomplished with fewer visits to service centers. Houshyar et al. [46] evaluated the distribution of agricultural machinery for the needs of agricultural production in Iran using fuzzy AHP and weight-restriction DEA methods. Shoaei et al. [47] made a selection of places for the service of agricultural machinery using a GIS system in order to improve agricultural production.

2.2. Application of Objective Methods for Determining the Weight of Criteria in Agriculture

Objective methods for determining the weight of criteria have been used in various fields of agriculture. Table 1 presents some papers in the last five years in which the methods to be used in this paper were applied. Objective methods for determining the weight of criteria have been used in various fields of agriculture.
Based on the above papers, it can be concluded that in the objective determination of the weight of the criteria, the entropy and CRITIC methods were mostly used in agriculture. The MERAC method is new and has not yet been used in the field of agriculture. In determining the weight by standard deviation, it is difficult to find papers because in one part of the CRITIC calculation the standard deviation is used and these two terms overlap.

3. Research Methodology and Methods

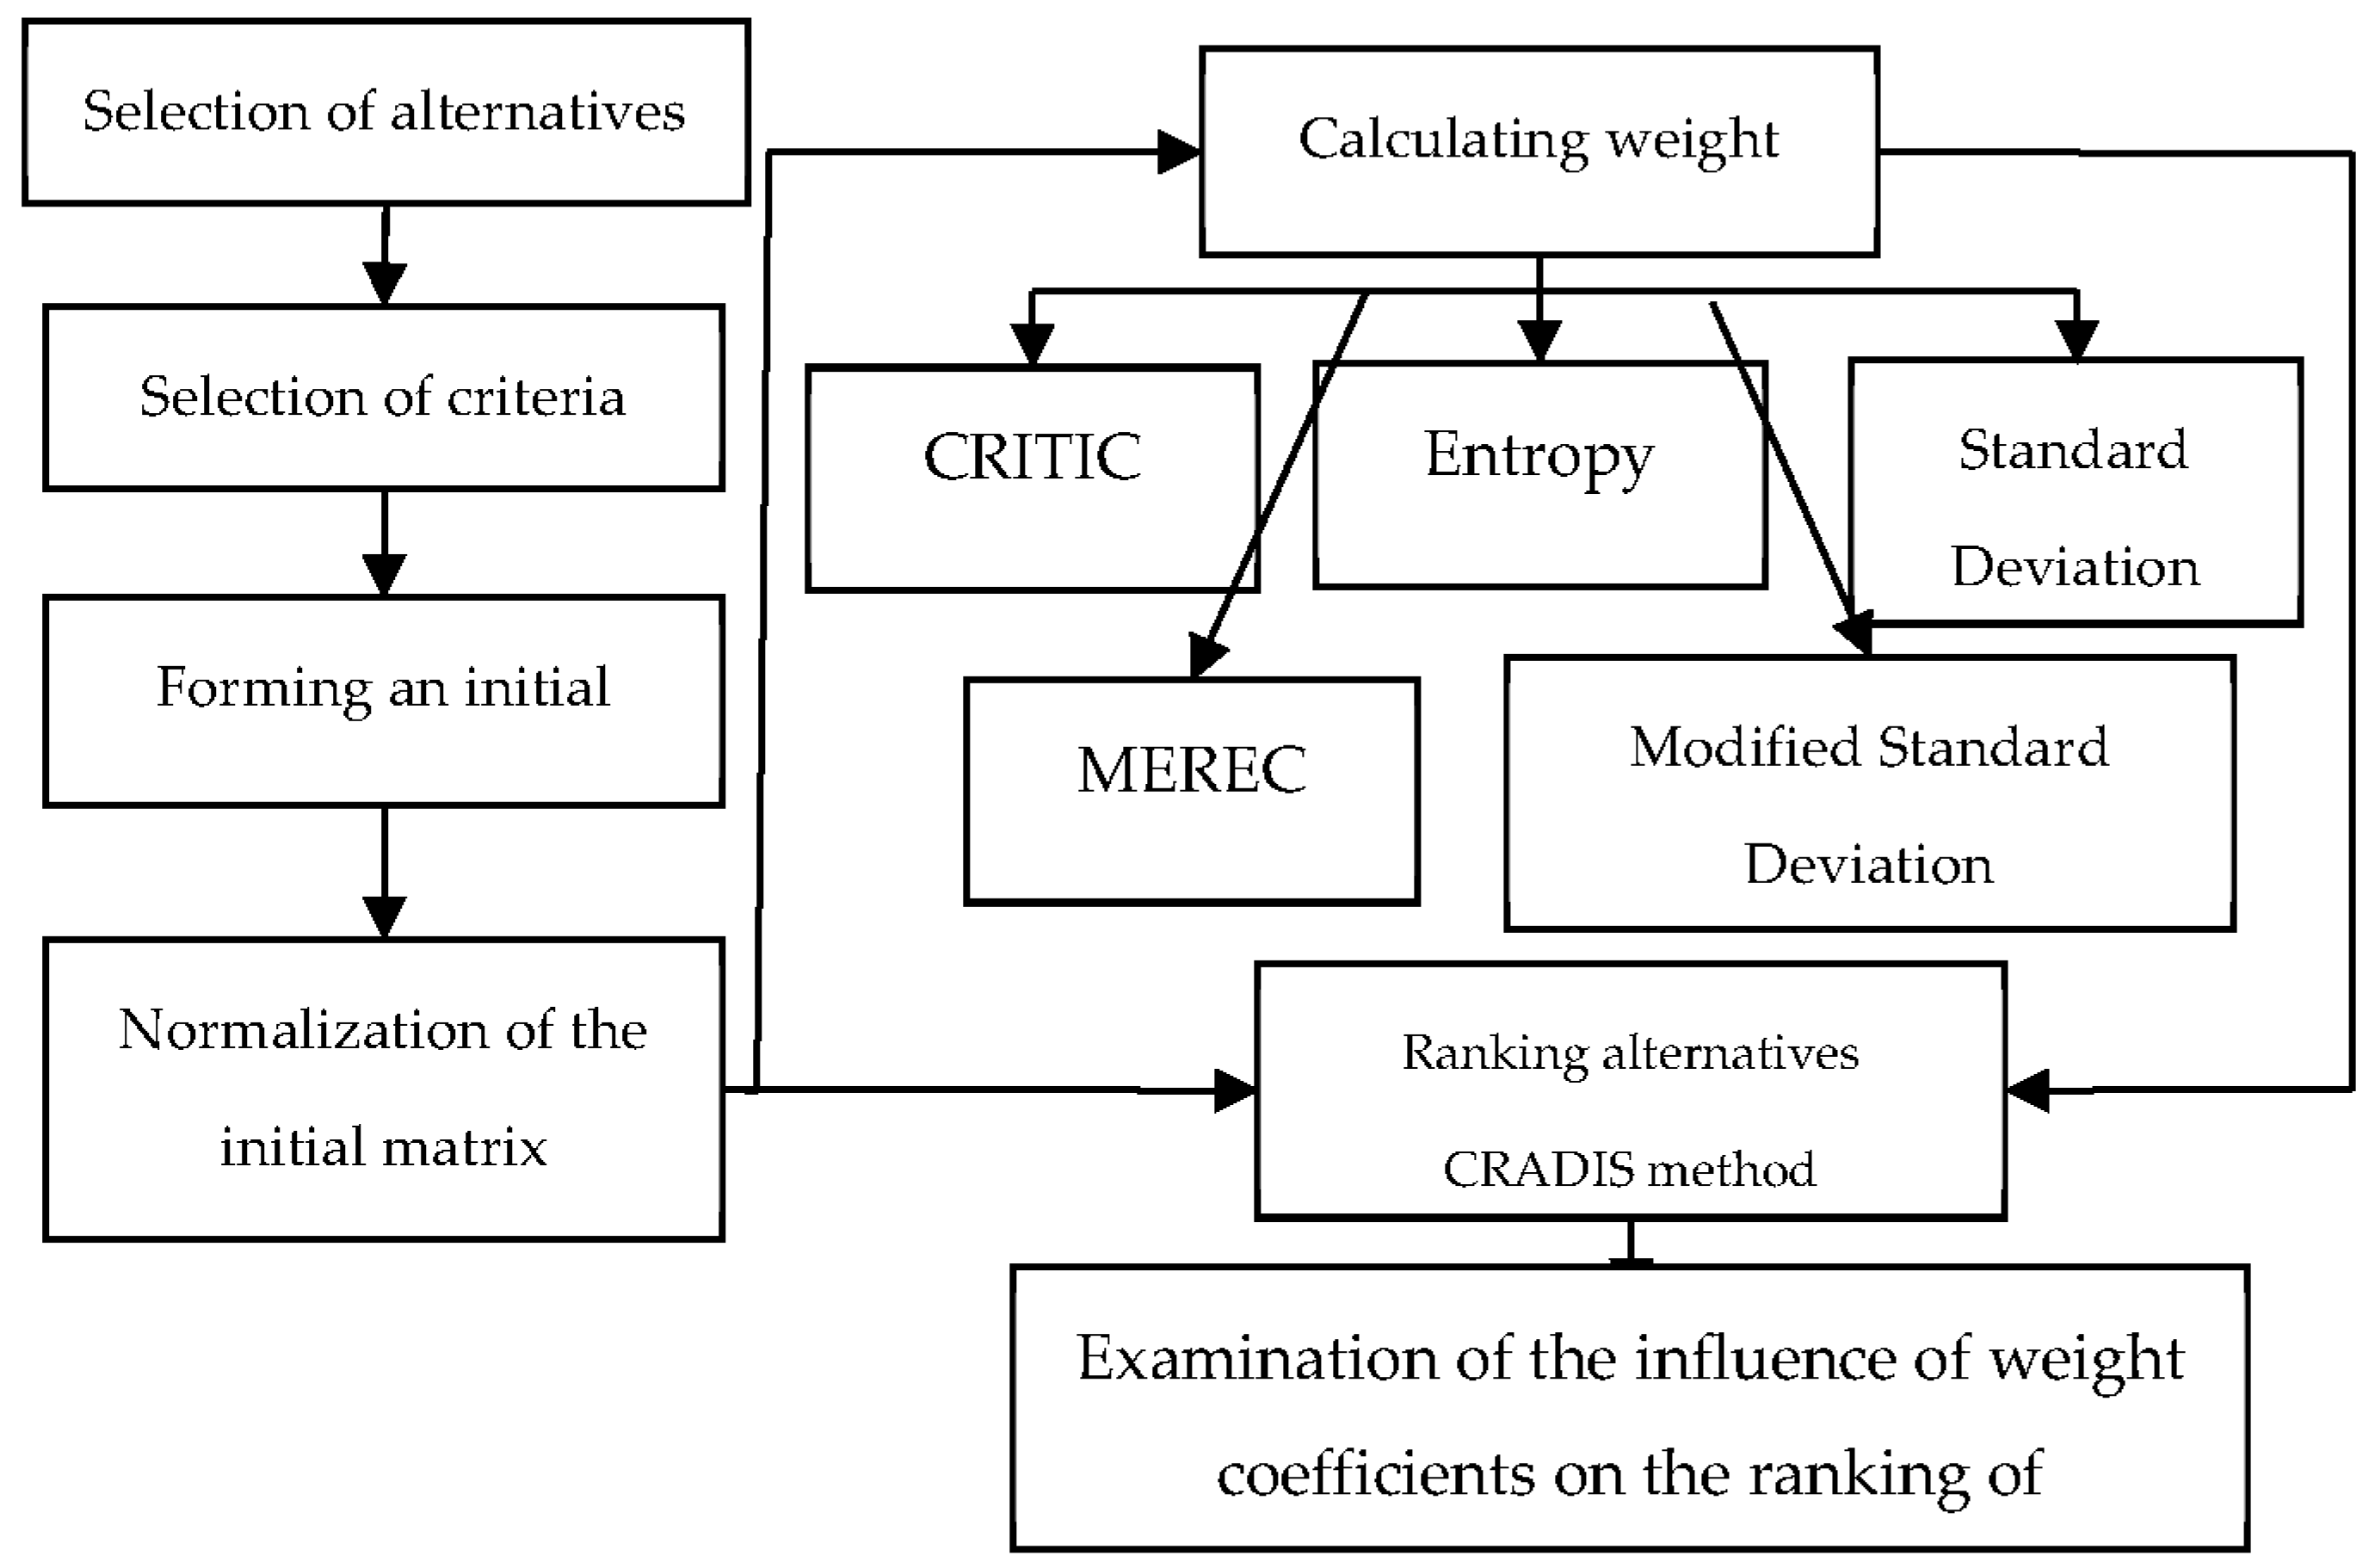
Modern agriculture requires the use of advanced types of tractors, i.e., tractors with a role that is multiple. Therefore, there are different design solutions when it comes to determining the characteristics of the tractors used. When selecting tractors for the needs of agricultural production in BiH, the methodology presented in Figure 1 was used.
According to this methodology, the selection of the alternatives was accomplished first. When selecting the alternatives, a study was conducted to assess which tractors are represented on the BiH market and which belong to the category of heavy tractors. Based on this, the alternatives were formed and marked from A1 to A6. This was accomplished because this paper is primarily conceptual and aims to present a new method of objectively determining weights. In addition, the experiences of the users of these tractors were not taken, only seven of their characteristics were. These tractors, which are agricultural machines of the latest generation, belong to the category of heavy tractors based on the power of the installed engine. Germany and the USA were chosen as the countries of origin of these tractors, given the current presence (availability) in the market of BiH.
To evaluate these tractors, it was necessary to select criteria. When choosing the criteria, all relevant criteria necessary for the implementation of agricultural production were taken into account. Based on this, the following criteria were selected: power (C1), torque (C2), tank capacity (C3), tractor weight (C4), cubic capacity (C5), price (C6), and fuel consumption (C7). It should be emphasized that the cubic-capacity criterion does not directly affect the performance of the engine and the tractor, but it can still have an effect, which is why this criterion was taken. The second reason is that this criterion is a numerical criterion and, as such, is suitable for the analysis in this study. In addition to technical criteria, the criteria also included economic criteria (price) and environmental criteria (fuel consumption) to make decision-making more comprehensive.
Once the alternatives and criteria for evaluating the alternatives were determined, an initial-decision matrix was formed. The first step in any method of multi-criteria analysis is to normalize the initial-decision matrix [64]. Normalization is performed, so that all data are uniform [65] to perform the steps from the MCDA method [66]. For all criteria, there is a different unit of measure for determining the value of the alternatives, according to certain criteria, so this is another reason why normalization is performed (Table 1).
Since five different methods were used in this study to determine the criteria, the same normalization was used to reduce the difference in their use. In addition, the same normalization was used with the CRADIS method for ranking the alternatives. However, when normalizing the data, it was necessary to determine which type of criteria was used when evaluating the alternatives. When observing the type of criteria, it was necessary to determine DM preferences. E.g., each DM prefers to have the lowest possible price and fuel consumption, and these criteria fall into the category of “cost” criteria, while cubic capacity and tank capacity should be as high as possible, and these criteria fall into the category of “benefit” criteria. Based on this, it was necessary to assign the type of criterion for each criterion to perform the correct normalization. Table 2 presents the criteria with definitions and the types of criteria used to perform the appropriate normalization.
Before the alternatives are ranked, it was necessary to calculate the weights of the criteria. This study was performed using five methods: CRITIC, entropy, standard deviation, MEREC, and modified standard deviation. The reason for using these methods was to examine the impact of criteria weights on the ranking of the alternatives. In addition, using additional different methods and weighting criteria provided more information for DMs, which they can use when buying a tractor. Finally, the CRADIS method was used to examine how the weight coefficients have an impact on the ranking of tractors and which tractors should be the first choice for farmers in BiH.

3.1. Objective Methods for Determining Weight Criteria

Five methods for determining the weights of the criteria were applied in the study. The CRITIC, entropy, standard deviation, and MEREC methods are presented only in brief outlines, while the modified standard deviation method is explained in more detail, as it represents a new method.

3.1.1. CRITIC Method

Step 1. Normalization of the initial-decision matrix. The same normalization will be used for all methods:
n i j = x i j x j   m a x ,   for   benefit   criteria
n i j = x j   m i n x i j ,   for   cost   criteria
Step 2. Calculation of standard deviation and linear correlation matrix by columns.
Step 3. Determining the amount of information.
C j = σ k = 1 m ( 1 r j k )
where r represents a correlation coefficient for particular criteria.
Step 4. Calculation of the final weights of the criteria.
w j = C j j = 1 m C j

3.1.2. Entropy Method

The entropy method consists of the following steps:
Step 1. Normalization of the initial-decision matrix.
Step 2. Determining the entropy value (ej).
e j = k i = 1 n r i j ,   j = 1 , 2 , , m
Step 3. Calculation of the degree of diffraction (dj).
d j = 1 e j ,   j = 1 , 2 , , m
Step 4. Calculation of the final weights of the criteria.
w j = d j j = 1 m d j

3.1.3. Standard Deviation Method

The standard deviation method has the following steps:
Step 1. Normalization of the initial-decision matrix.
Step 2. Calculation of standard deviation (σ).
Step 3. Calculation of the final weights of the criteria.
w j = σ j j = 1 m σ j

3.1.4. MEREC Method

The MEREC method has the following steps:
Step 1. Normalization of the initial-decision matrix.
Step 2. Calculation of the overall performance of the alternatives (Si).
S i = ln ( 1 + ( 1 m j | ln ( n i j x ) | ) )
Step 3. Calculate the effects of the alternatives for each criterion.
S i j = ln ( 1 + ( 1 m k , k j | ln ( n i k x ) | ) )
Step 4. Calculate the sum of the deviations from the absolute values.
E j = i | S i j S i |
Step 5. Calculate the final weights of the criteria.
w j = E j k E k

3.1.5. Modified Standard Deviation Method

The modified standard deviation method is an extension of the standard deviation method and, unlike it, uses two additional steps, which are to calculate the sum of the column and correct the value of the standard deviation with this indicator. This method has the following steps:
Step 1. Normalization of the initial-decision matrix.
Step 2. Calculation of the standard deviation (σ).
Step 3. Calculation of the sum of the sum of the columns j m x i j .
Step 4. Calculate the corrected value of the standard deviation.
σ = σ j m x i j
Step 5. Calculation of the final weights of the criteria.
w j = σ j j = 1 m σ j
In this way, the values of the criteria after normalization are compared. If the values of the criteria are approximately the same, the value of the sum of the column will be higher, so the value of the corrected standard deviation ( σ ) will be lower. If the values of the criteria are different, the value of the sum of the column will be smaller, so the value of the corrected standard deviation ( σ ) will be higher. Applying the modified standard deviation additionally takes into account the existence of a larger deviation in the data within the criteria. Applying this method, the criteria for which the data have a larger deviation will get a higher value. The logic of this method is that if the values of the alternatives within one criterion are similar, the weight of that criterion will be less, and vice versa. Thus, diversity within one criterion is evaluated.

3.2. CRADIS Method

Once the weights of the criteria have been determined, it is necessary to rank the alternatives. The ranking of the alternatives will be accomplished using the CRADIS method. The CRADIS method was developed by Puška et al. [71] and has the following steps:
Step 1. Formation of a decision matrix.
Step 2. Normalization of the decision matrix.
Step 3. Computing the normalized-decision matrix. In this step, the value of the normalized-decision matrix is multiplied by the corresponding weights.
v i j = n i j · w j
Step 4. Determination of ideal and anti-ideal solutions. The ideal solution is the greatest value v i j in an aggravated-decision matrix, while the anti-ideal solution is the smallest value v i j in an aggravated-decision matrix.
t i = max v i j
t a i = min v i j
Step 5. Calculation of the deviation from the ideal and anti-ideal solutions.
d + = t i v i j
d = v i j t a i
Step 6. Calculation of the deviation of the individual alternatives from the ideal and anti-ideal solutions.
s i + = j = 1 n d +
s i = j = 1 n d
Step 7. Calculation of the utility function for each alternative in relation to the deviations from the optimal alternatives.
K i + = s 0 + s i +
K i = s 0 s i
where s 0 + is the optimal alternative that has the smallest distance from the ideal solution, s 0 is the optimal alternative that has the greatest distance from the anti-ideal solution.
Step 8. Ranking the alternatives. The final order is obtained by looking for the average deviation of the alternatives from the degree of utility.
Q i = K i + + K i + 2

4. Results and Discussion

After the tractors and the evaluation criteria are selected, the initial-decision matrix was formed (Table 3). In this study, six alternatives for heavy tractors and seven evaluation criteria were observed. The next step was to calculate the maximum and minimum values of the criteria, to normalize the data. Depending on the type of criteria, different formulas were applied for normalization, whether expression 1 was used for benefit criteria or expression 2 was used for cost criteria.
By applying the appropriate formula for normalization to the initial-decision matrix, a normalized-decision matrix was formed (Table 4). This decision matrix was used to calculate criterion weights and to rank the alternatives. All methods used the same normalized-decision matrix.
Once the normalized-decision matrix was determined, the weights of the criteria were calculated first using the CRITIC method (Table 5). The first step in calculating the CRITIC method is to calculate the standard deviation value. This standard deviation value was used for both the standard deviation method and the modified standard deviation method. The correlation value for the criteria was calculated. Correlation values for all observed criteria (1 − r) were then subtracted from the value of 1. These values were summed for the criteria and the value of the amount of information (C_j) was calculated. The last step was to calculate the weighting criteria (expression 4).
After the weights were calculated using the CRITIC method, the weights of the criteria were calculated using the entropy method (Table 6). When calculating the weights of the criteria using the entropy method, the values of the natural logarithm (ln) were first calculated for all values of the normalized-decision matrix. This value was multiplied by the value of the normalized-decision matrix. When this value was obtained, its sum was calculated according to the criteria. To carry out the next step, it was necessary to calculate the natural logarithm for the number 6 (ln (6)). The number six was selected because there are so many alternatives in this example. Then, the negative reciprocal of the natural logarithm of number 6 (−0.5581) was calculated. This was needed to calculate the entropy value (ej), which was obtained by multiplying the sum of the criteria by the previously obtained value. The divergence rate was then calculated (dj = 1 – ej), and the weight-value criterion is calculated (wj) (expression 7).
The next method for calculating criteria weights was the standard deviation (SD) method (Table 7). This method is the simplest of all methods and has the fewest steps. First, the value of the standard deviation for the criteria was calculated, and then the obtained value was used to calculate the weights of the criteria (expression 8)
The next method to calculate the weights of the criteria applied in this study was the MEREC method (Table 8). The first step in computing the MEREC method was to compute the absolute number from the natural logarithm for a normalized-decision matrix. The total performance of the alternatives was then found ( S i ), by calculating the natural logarithm from the value of the sum of number 1 and by dividing the sum of the absolute values of the natural logarithms by the number of criteria (m). The next step was to calculate the effects of the alternatives for each criterion ( S i j ). The procedure is similar in that for each criterion, calculating the effects of the alternatives is not taken into account. The absolute value of the difference between the effects of the alternatives for each criterion and the overall performance of the alternatives was then calculated ( | S i j S i | ), and the sum of that for the criteria was calculated. The last step was to calculate the weight of the criteria (expression 12).
The last method used to calculate criteria weights was the modified standard deviation (MSD) method (Table 9). Unlike the standard deviation method, this method divides the value of the standard deviation (σ) by the sum of the values of an individual criterion. ( j m x i j ). When the modified value of the standard deviation was obtained, the value of the weight of each criterion was calculated (expression 14).
After calculating the weights using different methods, it can be seen that the largest deviation in the weights of the criteria is in the results obtained by the entropy method (Table 10). Criteria that have low weights with other methods have high weights with the entropy method. The reason for this should be sought in the calculation of weights, because the entropy method utilizes neither the criteria nor the alternatives for calculating the weights of the criteria. The calculation of weights was performed using the values of the elements of the decision matrix, and the values of the columns were added, and based on that, the weights were obtained. If the values of the alternatives are higher for a certain criterion, the greater the weight of that criterion is, and vice versa. Other methods take into account the diversity of values within the criteria.
Based on the application of these methods, the weights of the criteria used to rank the alternatives were obtained. A complete calculation of the ranking order of the alternatives was performed for the weights obtained by the CRITIC method, while for the other weights only the value of the CRADIS method and the ranking order of the alternatives were given.
The first step in the CRADIS method was the normalization of the decision matrix (Table 3), then these normalized values were multiplied by the weight of the criteria and an aggravated-normalized-decision matrix was obtained (Table 11). To calculate the ideal and anti-ideal solutions, it was necessary to calculate the minimum and maximum values of the aggravated-normalized-decision matrix.
The next step was to calculate the deviation between the ideal and anti-ideal solutions. For each element of the aggravated matrix, the deviation from the ideal and anti-ideal solutions was calculated. This was followed by the calculation of the assessment of the deviation of the individual alternatives from the ideal and anti-ideal solutions, which was accomplished by calculating the sum of the deviations for the individual alternatives. Before ranking the alternatives, it was necessary to calculate the utility function for the optimal alternative. The alternatives should be as close as possible to the optimal alternative, to be better ranked. The last step was to calculate the ranking of the alternatives, which was accomplished by calculating the average deviation of the alternatives from the degree of utility (Table 12).
Based on the results obtained using the weights calculated by the CRITIC method, the best alternative is A4, and the second-ranked alternative is A1, while the worst-ranked alternative is A5.
To determine the impact of the criteria weights obtained by the different methods, the alternatives were ranked with the weights obtained using these methods. The procedure is the same, the only difference is in the weights of the criteria. The obtained results (Table 13) show that for all obtained criteria weights, the best alternative is A1, while the worst-ranked alternatives are A2 and A5 for the weights obtained by the entropy method.
To perform the analysis of the obtained results, a correlation analysis was used for the values of the CRADIS method using individual weights and the value of the ranking rank (Table 14). This analysis shows that there is the greatest correlation between SD and MSD methods (r = 0.9999) for ranking the alternatives. The reason for this is that the MSD method is only a slightly modified SD method. However, what is characteristic of the MSD method is that the values of the CRADIS method are more related to the values obtained by the CRITIC methods yet are less related to the values obtained by the MEREC method compared to the SD method. This analysis shows that the value of the CRADIS method of the obtained weight of the entropy method is the least related to the other methods. The same is the case in the ranking of the alternatives, where the alternative has the same ranking in terms of the weight that was obtained by the CRITIC, SD, and MEREC methods. The ranking order of the obtained weight of the MDS method deviates from these (r = 0.9429), due to the different ranks of the alternatives, A2 and A3. The reason for this should be sought in the values of these alternatives, which are approximate, and there is very little difference between them. It is noticeable that the results obtained using the calculated weights of the entropy method deviated the most from the other results. However, in addition to the different ranking order, A4 is the best.

5. Conclusions

This study was conducted to select the tractor that best meets the set criteria. Six types of tractors were used in this study, which were evaluated using seven criteria. The evaluation of the tractors was accomplished using MCDA methods. Objective methods for determining the weights of the criteria and the CRADIS method for tractor ranking were used.
The obtained results showed that the best tractor is A4 because this tractor best meets the objectives of this study. The worst-ranked tractor of the used tractors is A5. These results were confirmed using the different weights obtained by the different methods. The results showed that the weights obtained by the entropy method were the highest.
The new modified standard deviation method does not deviate significantly from other methods and can be used in further research. In addition, this method is one of the simpler methods for determining the weight coefficients. In the standard deviation method, only the standard deviation is calculated, while in the modified standard deviation method, the sum of the criteria elements is used.
In addition to the presented modified standard deviation method and the standard deviation method, the new modified standard deviation method does not differ significantly from other methods and is the easiest to calculate, thus, it is recommended for use in similar studies. It should be emphasized that the entropy method differs from most of the other methods, and it is not recommended to be used primarily in similar decision-making problems, only as a method for weight comparison.
The limitations of this study are that more tractors with similar characteristics were not taken into account. However, the tractors that were evaluated can be found on the BiH market, thus, only these tractors were used. Furthermore, another limitation can be considered, which is that more criteria have not been used (according to which the alternatives could be evaluated). However, taking more criteria would only complicate the decision-making process. The aim here was to show the influence of objective methods for determining the weights of criteria on the ranking of the alternatives, thus, the focus of the study was on that aim.
In future research, this new method needs to be compared with other methods for objectively calculating the weights of criteria that were not used in this research. It is necessary to use this method in other examples where decision-making is represented, because it has shown great flexibility and simplicity in work. Furthermore, in future research, it is necessary to use a combination of subjective and objective methods, for the example of multi-criteria decision-making in agriculture.

Author Contributions

Conceptualization, A.P. and M.N.; methodology, A.P.; software, M.N.; validation, A.P.; formal analysis, M.N.; investigation, A.P.; resources, A.P.; data curation, A.P.; writing—original draft preparation, M.N.; writing—review and editing, A.P.; visualization, M.N.; supervision, A.P.; project administration, Ž.Š. and I.S.; funding acquisition, Z.G., V.R. and I.S. All authors have read and agreed to the published version of the manuscript.

Funding

This research received no external funding.

Institutional Review Board Statement

Not applicable.

Informed Consent Statement

Informed consent was obtained from all subjects involved in the study.

Data Availability Statement

Not applicable.

Conflicts of Interest

The authors declare no conflict of interest.

References

  1. Yatribi, T. Factors affecting precision agriculture adoption: A systematic litterature review. Econ.-Innov. Econ. Res. 2020, 8, 103–121. [Google Scholar] [CrossRef]
  2. Zhu, Y.; Zhang, Y.; Piao, H. Does Agricultural Mechanization Improve the Green Total Factor Productivity of China’s Planting Industry? Energies 2022, 15, 940. [Google Scholar] [CrossRef]
  3. da Silva, C.A.G.; Rodrigues de Sá, J.L.; Menegatti, R. Diagnostic of Failure in Transmission System of Agriculture Tractors Using Predictive Maintenance Based Software. AgriEngineering 2019, 1, 10. [Google Scholar] [CrossRef] [Green Version]
  4. Zvyagina, E.; Selemenev, M.; Frolenkova, L.; Kravchenko, I.; Kuznetsov, Y.; Velichko, S.; Ašonja, A.; Kalashnikova, L. Modeling of the Mechanism of Action of Epilame Film in the Process of Processing. Adv. Eng. Lett. 2022, 1, 8–15. [Google Scholar] [CrossRef]
  5. Jaleta, M.; Baudron, F.; Krivokapic-Skoko, B.; Erenstein, O. Agricultural mechanization and reduced tillage: Antagonism or synergy? Int. J. Agric. Sustain. 2019, 17, 219–230. [Google Scholar] [CrossRef]
  6. Popović, G.; Erić, O.; Bjelić, J. Factor analysis of prices and agricultural production in the European Union. Econ.-Innov. Econ. Res. 2020, 8, 73–81. [Google Scholar] [CrossRef]
  7. Cupiał, M.; Kowalczyk, Z. Optimization of Selection of the Machinery Park in Sustainable Agriculture. Sustainability 2020, 12, 1380. [Google Scholar] [CrossRef] [Green Version]
  8. Ruiz-Garcia, L.; Sanchez-Guerrero, P. A Decision Support Tool for Buying Farm Tractors, Based on Predictive Analytics. Agriculture 2022, 12, 331. [Google Scholar] [CrossRef]
  9. Kostić, M.M.; Rakić, D.Z.; Savin, L.Đ.; Dedović, N.M.; Simikić, M.Đ. Application of an original soil tillage resistance sensor in spatial prediction of selected soil properties. Comput. Electron. Agric. 2016, 127, 615–624. [Google Scholar] [CrossRef]
  10. Özdağoğlu, A.; Öztaş, G.Z.; Keleş, M.K.; Genç, V. An Integrated PIPRECIA and COPRAS Method under Fuzzy Environment: A Case of Truck Tractor Selection. Alphanumeric J. 2021, 9, 269–298. [Google Scholar] [CrossRef]
  11. Račić, Ž.V. Fuzzification-decision making in terms of uncertainty. Econ.-Innov. Econ. Res. 2018, 6, 87–94. [Google Scholar] [CrossRef] [Green Version]
  12. Guarini, M.R.; Battisti, F.; Chiovitti, A. A Methodology for the Selection of Multi-Criteria Decision Analysis Methods in Real Estate and Land Management Processes. Sustainability 2018, 10, 507. [Google Scholar] [CrossRef] [Green Version]
  13. Amanor, K.S.; Iddrisu, A. Old tractors, new policies and induced technological transformation: Agricultural mechanisation, class formation, and market liberalisation in Ghana. J. Peasant. Stud. 2022, 49, 158–178. [Google Scholar] [CrossRef]
  14. Jokić, Ž.; Božanić, D.; Pamučar, D. Selection of fire position of mortar units using LBWA and fuzzy MABAC model. Oper. Res. Eng. Sci. Theory Appl. 2021, 4, 115–135. [Google Scholar] [CrossRef]
  15. Vinogradova, I.; Podvezko, V.; Zavadskas, E.K. The Recalculation of the Weights of Criteria in MCDM Methods Using the Bayes Approach. Symmetry 2018, 10, 205. [Google Scholar] [CrossRef] [Green Version]
  16. Žižović, M.; Pamucar, D. New model for determining criteria weights: Level Based Weight Assessment (LBWA) model. Decis. Mak. Appl. Manag. Eng. 2019, 2, 126–137. [Google Scholar] [CrossRef]
  17. Kravchenko, I.; Kartsev, I.; Kartsev, S.; Velichko, S.; Kuznetsov, Y.; Prokhorov, D.; Ašonja, A.; Kalashnikova, L. The Study of Characteristics of Elasticity and Residual Stresses in Coatings Applied by Plasma Methods. Appl. Eng. Lett. J. Eng. Appl. Sci. 2022, 7, 25–31. [Google Scholar] [CrossRef]
  18. Pamučar, D.; Božanić, D.; Milić, A. Selection of a course of action by Obstacle Employment Group based on a fuzzy logic system. Yugosl. J. Oper. Res. 2016, 26, 75–90. [Google Scholar] [CrossRef]
  19. Zhou, M.; Liu, X.-B.; Chen, Y.-W.; Qian, X.-F.; Yang, J.-B.; Wu, J. Assignment of attribute weights with belief distributions for MADM under uncertainties. Knowl.-Based Syst. 2019, 189, 105110. [Google Scholar] [CrossRef]
  20. Keshavarz-Ghorabaee, M.; Amiri, M.; Zavadskas, E.K.; Turskis, Z.; Antucheviciene, J. Determination of Objective Weights Using a New Method Based on the Removal Effects of Criteria (MEREC). Symmetry 2021, 13, 525. [Google Scholar] [CrossRef]
  21. Gürsoy, S.; Kara, A.; Akın, S. Factors Affecting the Farmers’ Decision-Making on Tractor Power Selection in Pistachio Farms: The Case of Siirt Province in Turkey. J. Agronomy. Technol. Eng. Manag. 2021, 4, 591–597. [Google Scholar]
  22. Shorkpor, S.; Asakereh, A. Evaluation of Conventional Tractors in Terms of Agricultural and Climatic Conditions in Saral Region in Divandarreh County. Agric. Mech. 2021, 6, 21–29. [Google Scholar] [CrossRef]
  23. Zhu, Z.; Lai, L.; Sun, X.; Chen, L.; Cai, Y. Design and Analysis of a Novel Mechanic- Electronic-Hydraulic Powertrain System for Agriculture Tractors. IEEE Access 2021, 9, 153811–153823. [Google Scholar] [CrossRef]
  24. Xia, Y.; Sun, D.; Qin, D.; Zhou, X. Optimisation of the power-cycle hydro-mechanical parameters in a continuously variable transmission designed for agricultural tractors. Biosyst. Eng. 2020, 193, 12–24. [Google Scholar] [CrossRef]
  25. Baek, S.-M.; Baek, S.-Y.; Jeon, H.-H.; Kim, W.-S.; Kim, Y.-S.; Kim, N.-H.; Sim, T.; Kim, H.; Kim, Y.-J. Improvement of Gear Durability for an 86 kW Class Agricultural Tractor Transmission by Material Selection. Agriculture 2022, 12, 123. [Google Scholar] [CrossRef]
  26. Mishra, D.; Satapathy, S. Reliability and maintenance of agricultural machinery by MCDM approach. Int. J. Syst. Assur. Eng. Manag. 2022, in press. [CrossRef]
  27. Lalremruata, N.A.; Dewangan, K.N.; Patel, T. Noise exposure to tractor drivers in field operations. Int. J. Veh. Perform. 2019, 5, 430–442. [Google Scholar] [CrossRef]
  28. Okoko, P.; Ajav, E. Draft and power requirements for some tillage implements operating in loamy soil. J. Agric. Eng. Technol. 2019, 24, 10–20. [Google Scholar]
  29. Fargnoli, M.; Lombardi, M. Safety Vision of Agricultural Tractors: An Engineering Perspective Based on Recent Studies (2009–2019). Safety 2020, 6, 1. [Google Scholar] [CrossRef] [Green Version]
  30. Hou, X.; Xu, C.; Li, J.; Liu, S.; Zhang, X. Evaluating agricultural tractors emissions using remote monitoring and emission tests in Beijing, China. Biosyst. Eng. 2022, 213, 105–118. [Google Scholar] [CrossRef]
  31. Mutlu, N. Technical and Economic Features of Tractors in the Second Hand Market in Sanliurfa Province. Int. J. Agric. Environ. Food Sci. 2020, 4, 384–393. [Google Scholar] [CrossRef]
  32. Russini, A.; Schlosser, J.F.; Farias, M.S.D. Estimation of the traction power of agricultural tractors from dynamometric tests. Ciência Rural. 2018, 48, e20170532. [Google Scholar] [CrossRef]
  33. Lee, J.W.; Kim, S.C.; Oh, J.; Chung, W.-J.; Han, H.-W.; Kim, J.-T.; Park, Y.-J. Engine Speed Control System for Improving the Fuel Efficiency of Agricultural Tractors for Plowing Operations. Appl. Sci. 2019, 9, 3898. [Google Scholar] [CrossRef] [Green Version]
  34. Lagnelöv, O.; Dhillon, S.; Larsson, G.; Nilsson, D.; Larsolle, A.; Hansson, P.-A. Cost analysis of autonomous battery electric field tractors in agriculture. Biosyst. Eng. 2021, 204, 358–376. [Google Scholar] [CrossRef]
  35. Malik, A.; Kohli, S. Electric tractors: Survey of challenges and opportunities in India. Mater. Today Proc. 2020, 28, 2318–2324. [Google Scholar] [CrossRef]
  36. Lipkovich, E.; Nesmiyan, A.; Nikitchenko, S.; Shchirov, V.; Kormiltsev, Y. Agricultural tractors of the fifth generation. Sci. Iran. 2020, 27, 745–756. [Google Scholar] [CrossRef] [Green Version]
  37. Sunusi, I.I.; Zhou, J.; Zhen Wang, Z.; Sun, C.; Eltayeb Ibrahim, I.; Opiyo, S.; Korohou, T.; Soomro, S.A.; Sale, L.A.; Olanrewaju, T.O. Intelligent tractors: Review of online traction control process. Comput. Electron. Agric. 2020, 170, 105176. [Google Scholar] [CrossRef]
  38. Perez-Domnguez, L.; Alvarado-Iniesta, A.; Garca-Alcaraz, J.; Valles-Rosales, D. Intuitionistic Fuzzy Dimensional Analysis for Multi-Criteria Decision Making. Iran. J. Fuzzy Syst. 2018, 15, 17–40. [Google Scholar] [CrossRef]
  39. Ormond, A.T.S.; Polizel, A.C.; Menezes, P.C.; Lima, M.A.; Mion, R.L. soybean culture under soil management and sowing systems. Rev. Eng. Na Agric. 2018, 26, 574–581. [Google Scholar] [CrossRef]
  40. Hu, Y.; Xiao, S.; Wen, J.; Li, J. An ANP-multi-criteria-based methodology to construct maintenance networks for agricultural machinery cluster in a balanced scorecard context. Comput. Electron. Agric. 2019, 158, 1–10. [Google Scholar] [CrossRef]
  41. Hoose, A.; Yepes, V.; Kripka, M. Selection of Production Mix in the Agricultural Machinery Industry Considering Sustainability in Decision Making. Sustainability 2021, 13, 9110. [Google Scholar] [CrossRef]
  42. Lu, J.; Wei, C.; Wu, J.; Wei, G. TOPSIS Method for Probabilistic Linguistic MAGDM with Entropy Weight and Its Application to Supplier Selection of New Agricultural Machinery Products. Entropy 2019, 21, 953. [Google Scholar] [CrossRef] [Green Version]
  43. Yang, Y.; Yuan, G.; Zhuang, Q.; Tian, G. Multi-objective low-carbon disassembly line balancing for agricultural machinery using MDFOA and Fuzzy AHP. J. Clean. Prod. 2019, 233, 1465–1474. [Google Scholar] [CrossRef]
  44. Lalghorbani, H.; Jahan, A. Selection of a Wheat Harvester according to Qualitative and Quantitative Criteria. Sustainability 2022, 14, 1313. [Google Scholar] [CrossRef]
  45. Han, J.; Hu, Y.; Mao, M.; Wan, S. A multi-objective districting problem applied to agricultural machinery maintenance service network. Eur. J. Oper. Res. 2020, 287, 1120–1130. [Google Scholar] [CrossRef]
  46. Houshyar, E.; Azadi, H.; Mirdehghan, S.M. Farm Power and Machinery Distribution in Iran: Fuzzy Analytical Hierarchy Process (FAHP) and Weight Restriction Data Envelopment Analysis (WR-DEA) Models. J. Agric. Sci. Technol. 2020, 22, 639–652. [Google Scholar]
  47. Shoaei, M.; Pourdarbani, R.; Dolat-abad, S.F. Identifying the Suitable Areas for Establishment of Agricultural Machinery Repair Center Using GIS in Rudsar. Emir. J. Eng. Res. 2019, 25, 4. [Google Scholar]
  48. Deepa, N.; Ganesan, K. Multi-class classification using hybrid soft decision model for agriculture crop selection. Neural Comput. Appl. 2018, 30, 1025–1038. [Google Scholar] [CrossRef]
  49. de Araujo, F.H.A.; Bejan, L.; Rosso, O.A.; Stosic, T. Permutation Entropy and Statistical Complexity Analysis of Brazilian Agricultural Commodities. Entropy 2019, 21, 1220. [Google Scholar] [CrossRef] [Green Version]
  50. Deepa, N.; Ganesan, K.; Srinivasan, K.; Chang, C.-Y. Realizing Sustainable Development via Modified Integrated Weighting MCDM Model for Ranking Agrarian Dataset. Sustainability 2019, 11, 6060. [Google Scholar] [CrossRef] [Green Version]
  51. Lu, H.; Zhao, Y.; Zhou, X.; Wei, Z. Selection of Agricultural Machinery Based on Improved CRITIC-Entropy Weight and GRA-TOPSIS Method. Processes 2022, 10, 266. [Google Scholar] [CrossRef]
  52. Sadeghi Ravesh, M.H. Evaluation of de-desertification alternatives in Ardakan-khezr abad plain by using shannon entropy method and ORESTE model. Environ. Eros. Res. 2019, 8, 19–40. [Google Scholar]
  53. Gomes, L.A.; Santos, A.F.; Pinheiro, C.T.; Góis, J.C.; Quina, M.J. Screening of waste materials as adjuvants for drying sewage sludge based on environmental, technical and economic criteria. J. Clean. Prod. 2020, 259, 120927. [Google Scholar] [CrossRef]
  54. Sabzevari, A.; Rajabipour, A.; Bagheri, N.; Omid, M. Determining the pattern of crop agriculture as a strategy to reduce food security disaster in the country. Environ. Hazards Manag. 2020, 7, 23–38. [Google Scholar] [CrossRef]
  55. Khodaei, D.; Hamidi-Esfahani, Z.; Rahmati, E. Effect of edible coatings on the shelf-life of fresh strawberries: A comparative study using TOPSIS-Shannon entropy method. NFS J. 2021, 23, 17–23. [Google Scholar] [CrossRef]
  56. Nedeljković, M.; Puška, A.; Đokić, M.; Potrebić, V. Selection of apple harvesting machine by the use of fuzzy method of multicriteria analyses. In Sustainable Agriculture and Rural Development; Book of Abstracts; Institute of Agricultural Economics: Belgrade, Serbia, 2021; pp. 227–242. [Google Scholar]
  57. Wichapa, N.; Khokhajaikiat, P.; Chaiphet, K. Aggregating the results of benevolent and aggressive models by the CRITIC method for ranking of decision-making units: A case study on seven biomass fuel briquettes generated from agricultural waste. Decis. Sci. Lett. 2021, 10, 79–92. [Google Scholar] [CrossRef]
  58. Polcyn, J. Eco-Efficiency and Human Capital Efficiency: Example of Small- and Medium-Sized Family Farms in Selected European Countries. Sustainability 2021, 13, 6846. [Google Scholar] [CrossRef]
  59. Polcyn, J.; Stępień, S.; Kwiliński, A. Relationship between education and production value of small and medium family farms in Poland. Conf. Proc. Determ. Reg. Dev. 2021, 2, 513–525. [Google Scholar] [CrossRef]
  60. Dabkiene, V.; Balezentis, T.; Streimikiene, D. Development of agri-environmental footprint indicator using the FADN data: Tracking development of sustainable agricultural development in Eastern Europe. Sustain. Prod. Consum. 2021, 27, 2121–2133. [Google Scholar] [CrossRef]
  61. Mitra, A. Grading of Raw Jute Fibres Using Criteria Importance through Intercriteria Correlation (CRITIC) and Range of Value (ROV) Approach of Multi-criteria Decision Making. J. Nat. Fibers 2022, in press. [Google Scholar] [CrossRef]
  62. Puška, A.; Nedeljković, M.; Prodanović, R.; Vladisavljević, R.; Suzić, R. Market Assessment of Pear Varieties in Serbia Using Fuzzy CRADIS and CRITIC Methods. Agriculture 2022, 12, 139. [Google Scholar] [CrossRef]
  63. Kaghazchi, A.; Hashemy Shahdany, S.M.; Firoozfar, A. Prioritization of agricultural water distribution operating systems based on the sustainable development indicators. Sustain. Dev. 2022, 30, 23–40. [Google Scholar] [CrossRef]
  64. Božanić, D.; Jurišić, D.; Erkić, D. LBWA-Z-MAIRCA model supporting decision making in the army. Oper. Res. Eng. Sci. Theory Appl. 2020, 3, 87–110. [Google Scholar] [CrossRef]
  65. Puška, A.; Beganović, A.; Šadić, S. Model for investment decision making by applying the multi-criteria analysis method. Serb. J. Manag. 2018, 13, 7–28. [Google Scholar] [CrossRef] [Green Version]
  66. Pamučar, D.; Ćirović, G.; Božanić, D. Application of interval valued fuzzy-rough numbers in multi-criteria decision making: The IVFRN-MAIRCA model. Yugosl. J. Oper. Res. 2019, 29, 221–247. [Google Scholar] [CrossRef] [Green Version]
  67. Morris, G.L. Classification of Management Alternatives to Combat Reservoir Sedimentation. Water 2020, 12, 861. [Google Scholar] [CrossRef] [Green Version]
  68. Lobos, G.; Baettig, R.; Schnettler, B.; Saens, R. Estimating the market value of farm tractors in Chile: An econometric approach. Chil. J. Agric. Anim. Sci. 2021, 37, 92–98. [Google Scholar] [CrossRef]
  69. Moinfar, A.; Shahgholi, G.; Gilandeh, Y.A.; Gondoshmian, T.M. The effect of the tractor driving system on its performance and fuel consumption. Energy 2020, 202, 117803. [Google Scholar] [CrossRef]
  70. Lovarelli, D.; Fiala, M.; Larsson, G. Fuel consumption and exhaust emissions during on-field tractor activity: A possible improving strategy for the environmental load of agricultural mechanisation. Comput. Electron. Agric. 2018, 151, 238–248. [Google Scholar] [CrossRef]
  71. Puška, A.; Stević, Ž.; Pamučar, D. Evaluation and selection of healthcare waste incinerators using extended sustainability criteria and multi-criteria analysis methods. Environ. Dev. Sustain. 2022, in press. [Google Scholar] [CrossRef]
Figure 1. Research methodology.
Sustainability 14 08675 g001
Table 1. Review of papers on the application of objective methods for determining the weight of criteria in agriculture.
No.AuthorsYearMethodApplication/Development
1Deepa and Ganesan [48]2018EntropySelection of agricultural crops
2de Araujo et al. [49]2019EntropyPrice analysis of agricultural products
3Deepa et al. [50]2019CRITICRanking of agricultural data
4Lu et al. [51]2019EntropySelection of agricultural machinery
5Sadeghi Ravesh [52]2019EntropyDesertification and remediation plans for degraded land in agriculture
6Gomes et al. [53]2020CRITICApplication of sewage sludge in agriculture
7Sabzevari et al. [54]2020EntropyChoice of vegetable growing
8Khodaei et al. [55]2021EntropyStrawberry storage
9Nedeljković et al. [56]2021CRITICSelection of harvesting machine
10Wichapa et al. [57]2021CRITICAgricultural waste management
11Polcyn [58]2021CRITICEco-efficiency and human capital on farms
12Polcyn et al. [59]2021CRITICThe relationship between education and production on farms
13Dabkiene et al. [60]2021EntropyEvaluation of farm and orchard efficiency
14Mitra et al. [61]2022CRITICEvaluation of crude fiber
15Lu et al. [42]2022CRITIC EntropySelection of agricultural machinery
16Puška et al. [62]2022bCRITICSelection of pear varieties
17Kaghazchi et al. [63]2022EntropyIrrigation systems
Table 2. Criteria in tractor selection.
IdCriterionUnitDefinitionTypeReferences
C1PowerkWTorque function, multiplication of the torque and speed of the motor.Benefit [22,23,24,27,33]
C2TorqueNmThe product of the force (by generating the action of combustion gases on the piston head) and the arm on which that force acts.Benefit [23,24,32]
C3Reservoir capacityLThe place of collection (refueling) of motor fuel depends on the power (type) of the tractor.Benefit [28,67]
C4Tractor
weight
kgTractor weight depends on the type of tractor, engine power, purpose of the tractor, tractor transmission, towing, or mounted implement.Benefit [25,27,32]
C5Cubiccm3Cylinder working space size in motor vehicles (tractors).Benefit [28,32]
C6PriceeuroThe market unit of measure is expressed in a certain currency and depends on many technical characteristics of the tractor.Cost [8,34,68]
C7Consumptiong/kWhFuel consumption depends on the power and purpose and other technical characteristics of the tractor as a motor vehicle.Cost [27,69,70]
Table 3. Initial-decision matrix.
Power (C1)Torque (C2)Reservoir
Capacity
(C3)
Tractor
Weight (C4)
Cubic (C5)Price
(C6)
Consumption (C7)
Alternative A116695550593006057182,000192
Alternative A218193440091006057168,385264
Alternative A315189645582996728175,723248
Alternative A419483555010,8006728189,371258
Alternative A518084031066406600175,000265
Alternative A616594039581406728169,518233
Table 4. Normalized-decision matrix.
C1C2C3C4C5C6C7
A10.90960.87430.61390.86111.00000.96110.7245
A20.83430.89400.77500.84261.00000.88920.9962
A31.00000.93190.68130.76840.90030.92790.9358
A40.77841.00000.56361.00000.90031.00000.9736
A50.83890.99401.00000.61480.91770.92411.0000
A60.91520.88830.78480.75370.90030.89520.8792
Table 5. Calculation of criterion weight using the CRITIC method.
C1C2C3C4C5C6C7
σ0.07820.05470.15630.12860.04960.04190.1052
Correlation (r)C11.0000−0.53800.09980.3986−0.0716−0.3591−0.4145
C2−0.53801.00000.04480.0356−0.59760.48080.6464
C30.09980.04481.00000.9064−0.0436−0.75490.3999
C40.39860.03560.90641.0000−0.1674−0.60380.1726
C5−0.0716−0.5976−0.0436−0.16741.0000−0.1656−0.4396
C6−0.35910.4808−0.7549−0.6038−0.16561.0000−0.2391
C7−0.41450.64640.39990.1726−0.4396−0.23911.0000
1 − rC10.00001.53800.90020,60141.07161.35911.4145
C21.53800.00000.95520,96441.59760.51920.3536
C30.90020.95520.00000,09361.04361.75490.6001
C40.60140.96440.09360.00001.16741.60380.8274
C51.07161.59761.04361,16740.00001.16561.4396
C61.35910.51921.75491,60381.16560.00001.2391
C71.41450.35360.60010,82741.43961.23910.0000
sum (1 − r)6.88485.92805.34765.25807.48547.64175.8742
C j = σ k = 1 m ( 1 r j k ) 0.53840.32400.83610.67620.37120.32010.6180
wj0.14610.08790.22690.18360.10080.08690.1677
Table 6. Calculation of criterion weights using the entropy method.
C1C2C3C4C5C6C7
C1−0.15590.0000−0.0854−0.1495−0.1051−0.07780.0000
C2−0.0694−0.0222−0.3185−0.1713−0.10510.0000−0.3185
C3−0.2506−0.0638−0.1896−0.26340.0000−0.0427−0.2559
C40.0000−0.13430.00000.00000.0000−0.1175−0.2955
C5−0.0749−0.1283−0.5733−0.4864−0.0192−0.0385−0.3222
C6−0.1619−0.0158−0.3310−0.28280.0000−0.0067−0.1935
C1−0.13340.0000−0.0784−0.1288−0.0946−0.07190.0000
C2−0.0647−0.0217−0.2316−0.1443−0.09460.0000−0.2316
C3−0.1950−0.0598−0.1569−0.20240.0000−0.0409−0.1981
C40.0000−0.11740.00000.00000.0000−0.1044−0.2199
C5−0.0695−0.1129−0.3232−0.2991−0.0188−0.0371−0.2335
C6−0.1377−0.0156−0.2377−0.21310.0000−0.0067−0.1595
sum−0.6003−0.3274−1.0277−0.9877−0.2080−0.2610−1.0426
ej0.33510.18270.57360.55120.11610.14570.5819
dj0.66490.81730.42640.44880.88390.85430.4181
wj0.14730.18110.09450.09940.19580.18930.0926
Table 7. Calculation of criteria weights using the standard deviation method.
C1C2C3C4C5C6C7
σ0.07820.05470.15630.12860.04960.04190.1052
wj0.12730.08890.25440.20930.08070.06820.1712
Table 8. Calculation of the weight of the criteria using the MEREC method.
C1C2C3C4C5C6C7sum
A10.15590.00000.08540.14950.10510.07780.00000.0788
A20.06940.02220.31850.17130.10510.00000.31850.1341
A30.25060.06380.18960.26340.00000.04270.25590.1417
A40.00000.13430.00000.00000.00000.11750.29550.0753
A50.07490.12830.57330.48640.01920.03850.32220.2108
A60.16190.01580.33100.28280.00000.00670.19350.1325
C10.05800.07880.06740.05880.06480.06840.0788 S i j
C20.12540.13140.09350.11250.12090.13410.0935
C30.11020.13380.11800.10850.14170.13640.1095
C40.07530.05730.07530.07530.07530.05960.0353
C50.20210.19590.14220.15290.20860.20640.1728
C60.11200.13050.09020.09650.13250.13170.1080
C10.02080.00000.01130.01990.01400.01030.0000 | S i j S i |
C20.00870.00280.04060.02160.01320.00000.0406
C30.03160.00790.02380.03320.00000.00530.0322
C40.00000.01800.00000.00000.00000.01570.0399
C50.00870.01500.06860.05790.00220.00450.0380
C60.02050.00200.04230.03600.00000.00080.0245
E j 0.09020.04560.18670.16870.02940.03660.1753
wj0.12320.06230.25480.23030.04010.05000.2393
Table 9. Calculation of the weight of the criteria using the method of modified standard deviation.
C1C2C3C4C5C6C7
σ0.07820.05470.15630.12680.04960.04190.1052
j m x i j   5.34545.65454.75454.84065.78155.72814.7942
σ′0.01460.00970.03290.02660.00860.00730.0219
wj0.12030.07950.27050.21850.07060.06020.1805
Table 10. Criteria weight values.
C1C2C3C4C5C6C7
CRITIC0.14610.08790.22690.18360.10080.08690.1677
Entropy0.14730.18110.09450.09940.19580.18930.0926
SD0.12730.08890.25440.20930.08070.06820.1712
MEREC0.12320.06230.25480.23030.04010.05000.2393
MSD0.12030.07950.27050.21850.07060.06020.1805
Table 11. Aggravated-normalized-decision matrix.
C1C2C3C4C5C6C7
A10.10300.07950.24830.18820.06350.05570.1805
A20.11230.07780.19670.18410.06350.06020.1313
A30.09370.07460.22370.16790.07060.05760.1397
A40.12030.06950.27050.21850.07060.05350.1343
A50.11160.06990.15240.13440.06920.05790.1308
A60.10230.07830.19420.16470.07060.05980.1487
max0.12030.07950.27050.21850.07060.06020.18050.2705
min0.09370.06950.15240.13440.06350.05350.13080.0535
Table 12. Results of the CRADIS method.
s i + K i + s i K i Q i Rank
A10.97460.91650.54420.86990.89322
A21.06740.83680.45140.72150.77914
A31.06540.83840.45340.72480.78163
A40.95600.93430.56280.89960.91691
A51.16700.76540.35180.56240.66396
A61.07460.83120.44410.71000.77065
A00.8932 0.6256
Table 13. Results when applying different criteria weights.
CRITICEntropySDMERECMSD
Q i Rank Q i Rank Q i Rank Q i Rank Q i Rank
A10.884420.847520.881920.902520.89322
A20.777530.800840.766130.788530.77914
A30.776240.782950.765840.785740.78163
A40.920610.860210.908710.914110.91691
A50.660960.724160.645560.680260.66396
A60.766150.813330.757150.778650.77065
Table 14. Value of correlation analysis.
Value of Methods
CRITICEntropySDMERECMSD
CRITIC1.00000.96000.99930.99660.9990
Entropy 1.00000.96320.95990.9609
SD 1.00000.99870.9999
MEREC 1.00000.9989
MSD 1.0000
Value of Rank
CRITICEntropySDMERECMSD
CRITIC1.00000.82861.00001.00000.9429
Entropy 1.00000.82860.82860.7714
SD 1.00001.00000.9429
MEREC 1.00000.9429
MSD 1.0000
Publisher’s Note: MDPI stays neutral with regard to jurisdictional claims in published maps and institutional affiliations.

