Article

Experimental and Numerical Investigation of the Flow Behaviour of Fractured Granite under Extreme Temperature and Pressure Conditions

by
Wanniarachchige Gnamani Pabasara Kumari
1,* and
Pathegama Gamage Ranjith
2
1
School of Civil, Mining and Environmental Engineering, Faculty of Engineering and Information Sciences, University of Wollongong, Wollongong, NSW 2522, Australia
2
Department of Civil Engineering, Faculty of Engineering, Monash University, Clayton, VIC 3800, Australia
*
Author to whom correspondence should be addressed.
Sustainability 2022, 14(14), 8587; https://doi.org/10.3390/su14148587
Submission received: 8 June 2022 / Revised: 2 July 2022 / Accepted: 11 July 2022 / Published: 13 July 2022

Abstract

:
As a result of negligible connected porosity—and thus, minimal matrix permeability—the fluid-transport characteristics of crystalline rocks are strongly influenced by the fractures at all scales. Understanding the flow behaviour of fractured rock under extreme stress and temperature conditions is essential for safe and effective deep geo-engineering applications, such as deep geothermal recovery, geological nuclear waste disposal, oil and gas extraction, geological storage and deep mining operations. Therefore, this study aims to investigate the flow characteristics of mechanically fractured Australian Strathbogie granite under a wide range of stress (confining pressures 1–80 MPa) and temperature conditions (20 °C to 350 °C). The study utilised a sophisticated high-temperature, high-pressure tri-axial setup capable of simulating extreme geological conditions, followed by a numerical simulation. According to the experimental results, a linear increment in the steady-state flow rate was observed, with increased injection pressure for the experimental conditions considered. Therefore, linear laminar Darcy flow was considered, and the fracture permeability was calculated using the cubic law. It was found that stress and temperature strongly depend on the flow of fluid through fractures. The steady-state flow rate decreased exponentially with the increase in normal stress, showcasing fracture shrinkage with an increment in effective stress. With regard to permeability through the fractures, increasing temperature was found to cause an initial reduction in fracture permeability due to an increased interlock effect (induced by thermal overclosure), followed by increments because of the thermally induced damage. Furthermore, the increasing temperature caused significant non-linear increments in the fluid flow rates due to the associated viscosity and density reduction in water. Considering the laboratory-scale flow-through exercises, a fully coupled numerical model that can predict hydro–thermo–mechanical variations in the reservoir rocks was developed using the COMSOL Multiphysics simulator. The developed model was calibrated, utilising the temperature- and pressure-dependent properties of granite rocks and fluid (water); was validated against the experimental results; and was used to predict the permeability, pressure development and strain of rock samples under extreme conditions, which were difficult to achieve in the laboratory.

1. Introduction

Fractures significantly influence a rock’s physical and transportation properties [1,2]. In deep geological systems with minimal interconnected porosity, negligible intrinsic permeability natural and/or man-made rock fractures contribute to the fluid circulation process. Knowledge of rock-transport characteristics and their evolution with changes in temperature, pressure and stress is therefore essential to extreme geo-engineering applications, including geothermal energy extraction, deep mining, deep geological disposal, long-term sub-surface storage of hydrocarbons and coal gasification projects [2,3], and laboratory experiments with the ability to replicate those extreme environments provide fundamental insights into their hydraulic performance. However, due to the limitations of the appropriate experimental facilities, these coupled processes have often been considered using analytical and numerical methods [4,5]. These mathematical approaches have considered several associated governing processes, including conductive heat transfer in the rock matrix, convective heat transfer through a fracture (fluid), heat transfer between a rock matrix and a circulating fluid, single or multiphase fluid flow through a fracture and the theory of poroelasticity and thermoelasticity.
Increases in the pressures and temperature of deep geological formations strongly influence the flow performance of fracture networks due to increases in differential stress (confining pressure–pore pressure) and differential temperature (geothermal gradient) [6]. However, the literature on the fluid-transport behaviour of fractured rocks mainly considers ambient/low-pressure conditions (>10 MPa), and limited experimental research has been performed under elevated temperatures and pressures. Thus, the number of experimental studies that have captured the coupled thermo–hydro–mechanical response and generated complete datasets is meagre [2,7,8,9]. When the fracture is subjected to normal stress, a mechanical closure in the fracture can occur. A non-linear reduction in fracture apertures has been captured with increasing stress [10,11]. In fact, frictional development in fracture surfaces can occur, with shearing further influencing the fluid flow through a fracture, depending on the rock-joint properties under the stress applied, such as the joint roughness coefficient and the joint’s compressive strength [12,13]. Furthermore, the normal effective stress applied changes with the confining stress and injection pressure applied, causing significant permeability variations due to mechanical closure or re-opening [14]. In addition, thermal expansion creating a thermal overclosure can occur in the fractures when the fracture is subjected to elevated temperatures [12,15] due to changes in the fracture aperture. Moreover, the fluid-circulation properties (i.e., density, viscosity and compressibility) are temperature and pressure dependent, and further potential phase transition can significantly alter the fracture permeability [16,17].
Assuming one-dimensional heat conduction normal to the fracture wall, Bodvarsson [18] analysed the thermodynamic characteristics of a single-fracture system. Ghassemi et al. [4] studied coupled poroelastic and thermoelastic effects on the fracture aperture, assuming that the reservoir pressure is evenly distributed. Furthermore, analytical solutions have been proposed for wellbore heating and cooling, considering the temporal–spatial distribution of reservoir stress and temperature conditions and the injection pressure [19,20]. However, these analytical solutions have major limitations, including simple geometry and constant parameter values. Therefore, several numerical models have been developed to study the fracture flow and reservoir-transport characteristics. These numerical models have considered different numerical approaches, including the boundary element method, the poroelastic and thermoelastic displacement discontinuity methods and the finite element method [21]. Furthermore, a number of techniques have been employed to account for the complex fracture geometry, including discrete fracture grids [22] and the fracture continuum method [23]. Different software packages, including TOUGH2, GEOTH3D, FRACSIM-3D, GEOCRACK, FRACTure, NUFT, GEOS, CFRAC, PFLOTRAN and MULTIFLUX, have been utilised for field-scale simulations [24,25,26], and very few studies have focused on the small domains applicable to laboratory-scale experiments [27,28,29]. In addition, analytical solutions have often been used to validate the numerical results, but the number of attempts to validate the numerical work with real data sets (either field experiments or laboratory experiments) is meagre.
This study, therefore, aimed to obtain an understanding of the fracture flow behaviour of deep reservoir rock (granite used here) under various stress and temperature conditions, adopting a newly developed sophisticated high-temperature, high-pressure tri-axial setup which is capable of simulating the extreme geological conditions. Thus, comprehensive experimental programmes were conducted to understand the effect of confining pressure, injection pressure and temperature under a wide range of normal stresses and temperature conditions (confining pressure up to 45 MPa; injection pressure up to 35 MPa and temperature up to 300 °C). The drained condition was employed for fluid injection experiments to understand the effect of large pressure gradients. Laboratory-scale flow-through exercises conducted on fractured rocks are generally limited to low in situ stresses and injection pressures due to the required long-term duration to achieve the steady-state condition. However, numerical modelling approaches eliminate such limitations, and an experimentally validated numerical model can predict hydro–thermo–mechanical variations during hydraulic fracturing over a wide range of temperature and pressure conditions. In addition, the simulations can easily be reproducible under different boundary conditions, and therefore they are efficient in terms of time and cost compared to labour-intensive rigorous laboratory experiments. The present numerical work was motivated by this demand. The developed model was validated using the experimental results and used to predict the permeability, fluid pressure development, stress and strain of rock samples under extreme conditions, which were difficult to perform in the laboratory. The model was developed employing the COMSOL Multiphysics simulator, a commercially available cross-platform finite element simulation software [30]. This software allows modelling conventional physics-based user interfaces, user-defined interfaces and coupled systems of partial differential equations (PDEs). Although COMSOL has been utilised in different electrical, mechanical, fluid, and chemical applications, its potential applicability for the coupled processes associated with extreme geological conditions has been poorly understood. Therefore, prospects for geothermal reservoir simulation with COMSOL have also been demonstrated in this model.

2. Experimental Study

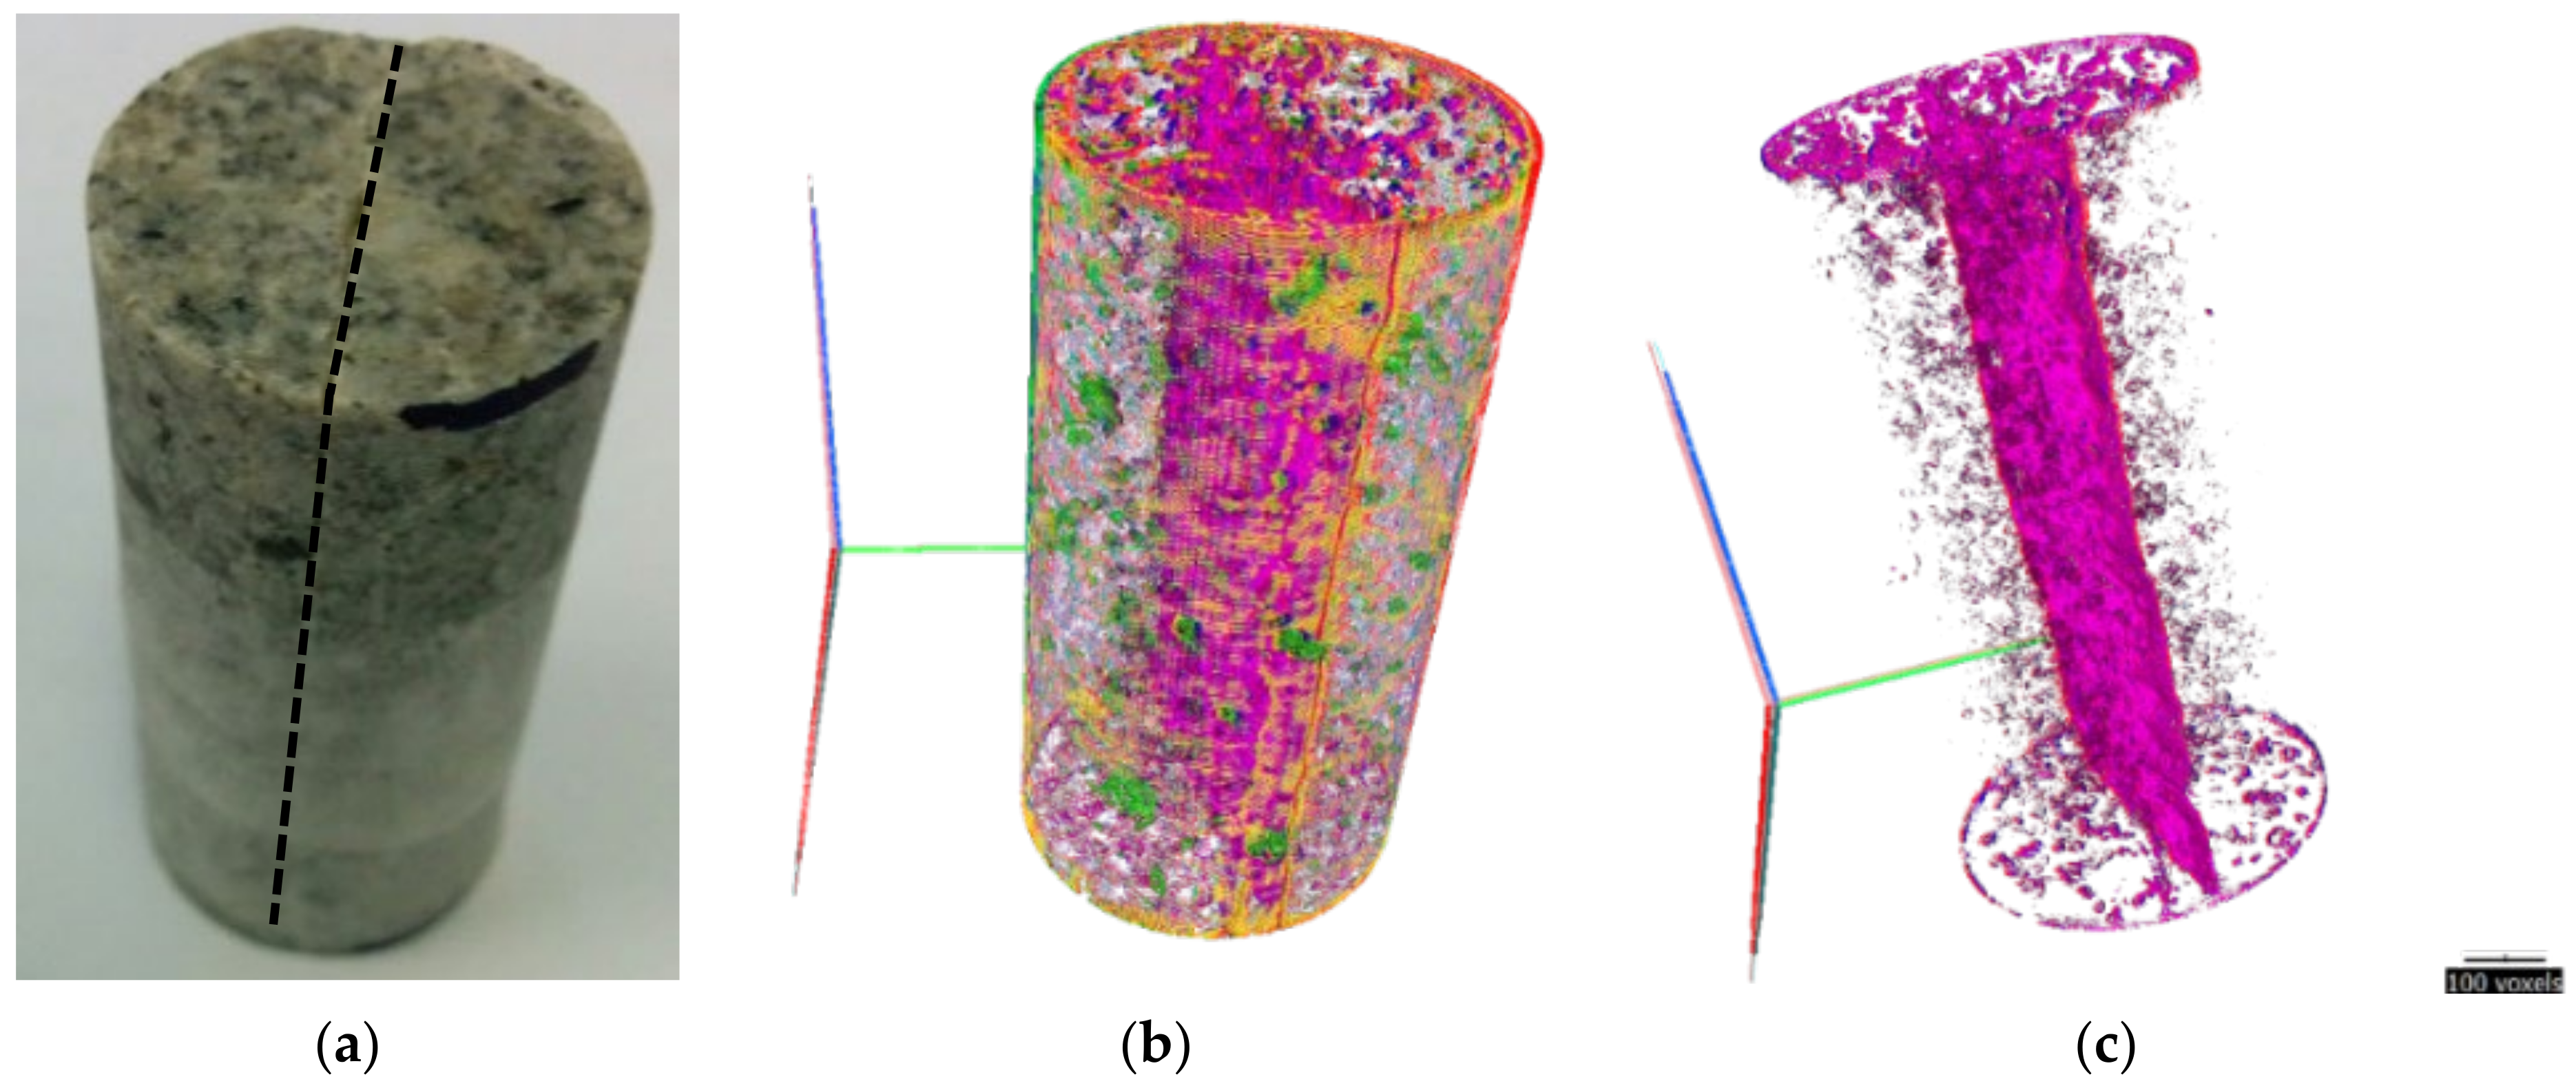
2.1. Sample Description

Granite samples were collected from Strathbogie batholith, a composite granitoid intrusion body available in south-eastern Victoria, Australia. It was constructed through a late Devonian intrusion and mainly consisted of S-type granite [31]. Based on the XRD and SEM analysis, it was found that the selected granite mainly consists of quartz, K-feldspar and plagioclase, with small amounts of biotite, clinochlore, sericite and ankerite (see Table 1) with grains ranging from 0–350 μm [32].
Cylindrical specimens of 22.5 mm diameter and 45 mm height were prepared for the drained permeability experiments. A diametrical fracture was induced along the cylindrical axis of the sample. Figure 1a illustrates the closer view of the sample, and the broken lines indicate the mechanically induced fracture. The fracture surface was then profiled with high-resolution CT scanning imaging using X-ray Microscopy Facility for Imaging Geo-materials (XMFIG) available at 3GDeep Research Laboratory at Monash University. Two-dimensional projections obtained via CT scanning were reconstructed to 3D volumes, and further, those were post-processed using the image processing software Drishti v2.6.1. Applying 3D transfer functions, high-density and low-density regions of the regenerated images were identified and shown in Figure 1b. Here, the bright green colour regions can be identified as high-density regions, such as biotite and quartz minerals, and pink colour regions are low-density regions (or voids), such as pore spaces and the induced fracture. Finally, the fracture surface associated with the low-density region was separated to clearly distinguish the anticipated flow path, as shown in Figure 1c.
Matrix porosity was experimentally found to be very low (1.16%) in the selected granite type, where the obtained CT scanned images also confirmed that these small pores are not well interconnected, resulting in an ultra-low matrix permeability. Under such circumstances, a reasonable assumption was made in this study for the permeability analysis: matrix permeability of the selected granite is negligible compared to the fracture permeability, and therefore the flow in the experiments entirely belongs to the fracture flow.

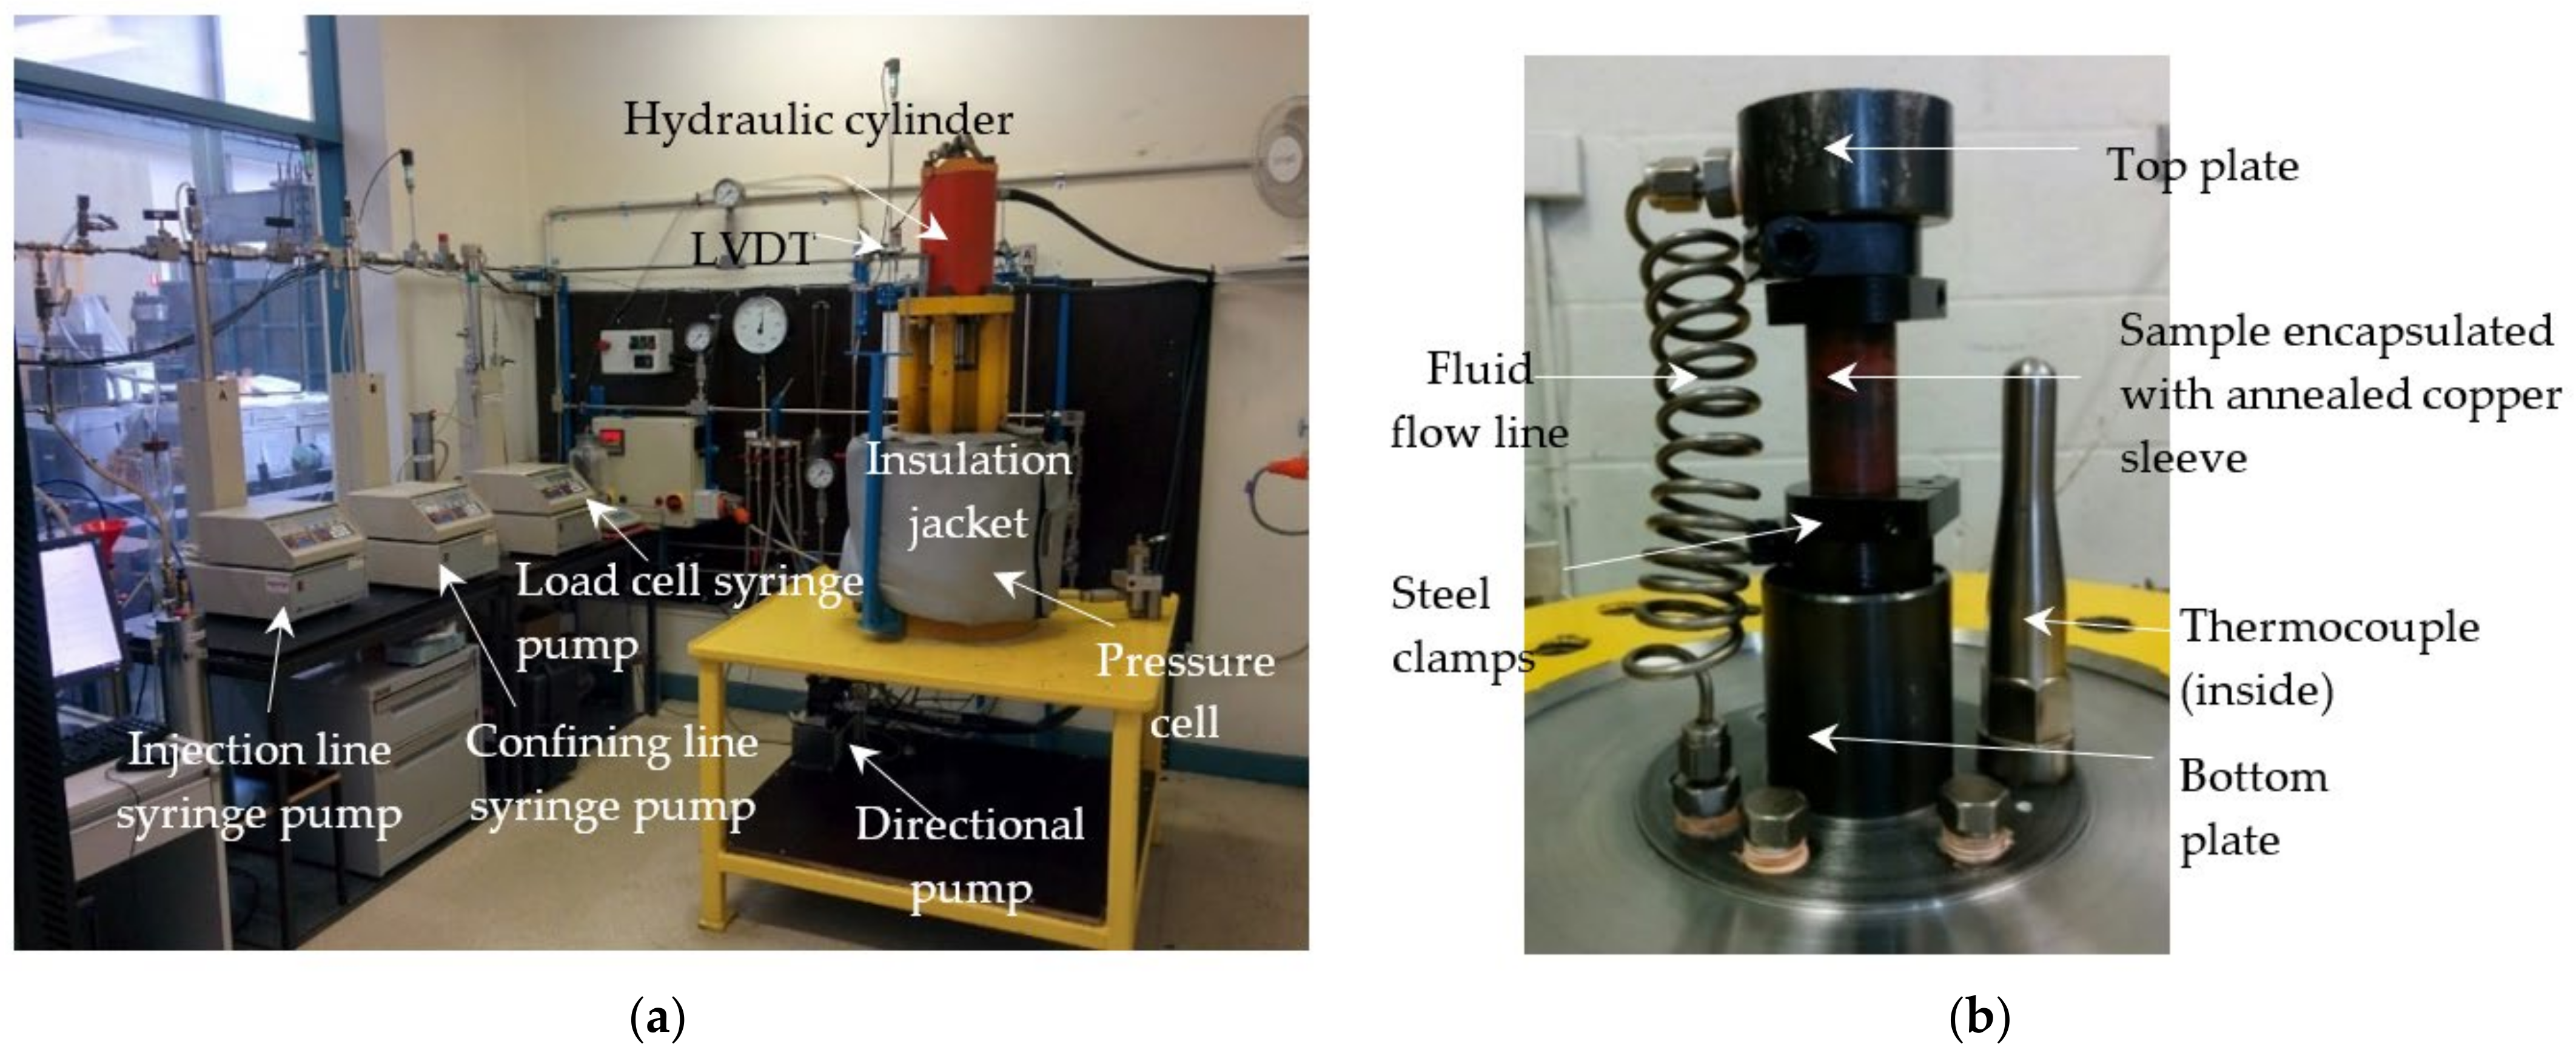
2.2. Experimental Procedure

Next, drained permeability tests were performed utilising the high-pressure, high-temperature triaxial testing apparatus (Figure 2) of the 3GDeep Research Laboratory at Monash University. As shown in Figure 2a, four main systems are available in the triaxial cell: a confinement unit, a loading system, a heating system and a fluid injection unit.
Using a band heater, temperature was applied at a 2.5 °C/min heating rate to avoid structural damage that might occur due to a sudden thermal shock. In order to avoid heat losses in the system, the band heater and the barrel were covered with an insulation blanket. Throughout the tests, the axial load pump was regulated to apply pressure similar to the confining pressure. Fluid injection was started once the system achieved the required temperature and pressure. Once the system achieved the steady-state condition, distilled water was injected until a steady-state flow rate was achieved and maintained. The fluid injection duration depended on the effective stress and temperature, which varied from 10 min to a maximum of 2 days for the considered experimental conditions. The time to achieve a steady-state condition was significantly higher under higher effective stress and lower temperatures. In all the experiments, water was injected from the top to the bottom of the sample, along the long fluid flow line (Figure 2b). Therefore, considering high-temperature experiments, it was assumed that the fluid that enters the sample has the same temperature as the temperature of the confining media, considering the fluid flow line acts as a heat exchanger. All the fluid flow lines were drained before the experiment to remove the air. Accumulating downstream fluid mass was recorded using an electronic balance, and then the corresponding steady-state mass flow rate was calculated. Then, maintaining the confinement pressure constant, the temperature was increased to the next level. This experimental program was repeated with several samples to ensure that the same trend was obtained at different temperatures.

3. Numerical Study

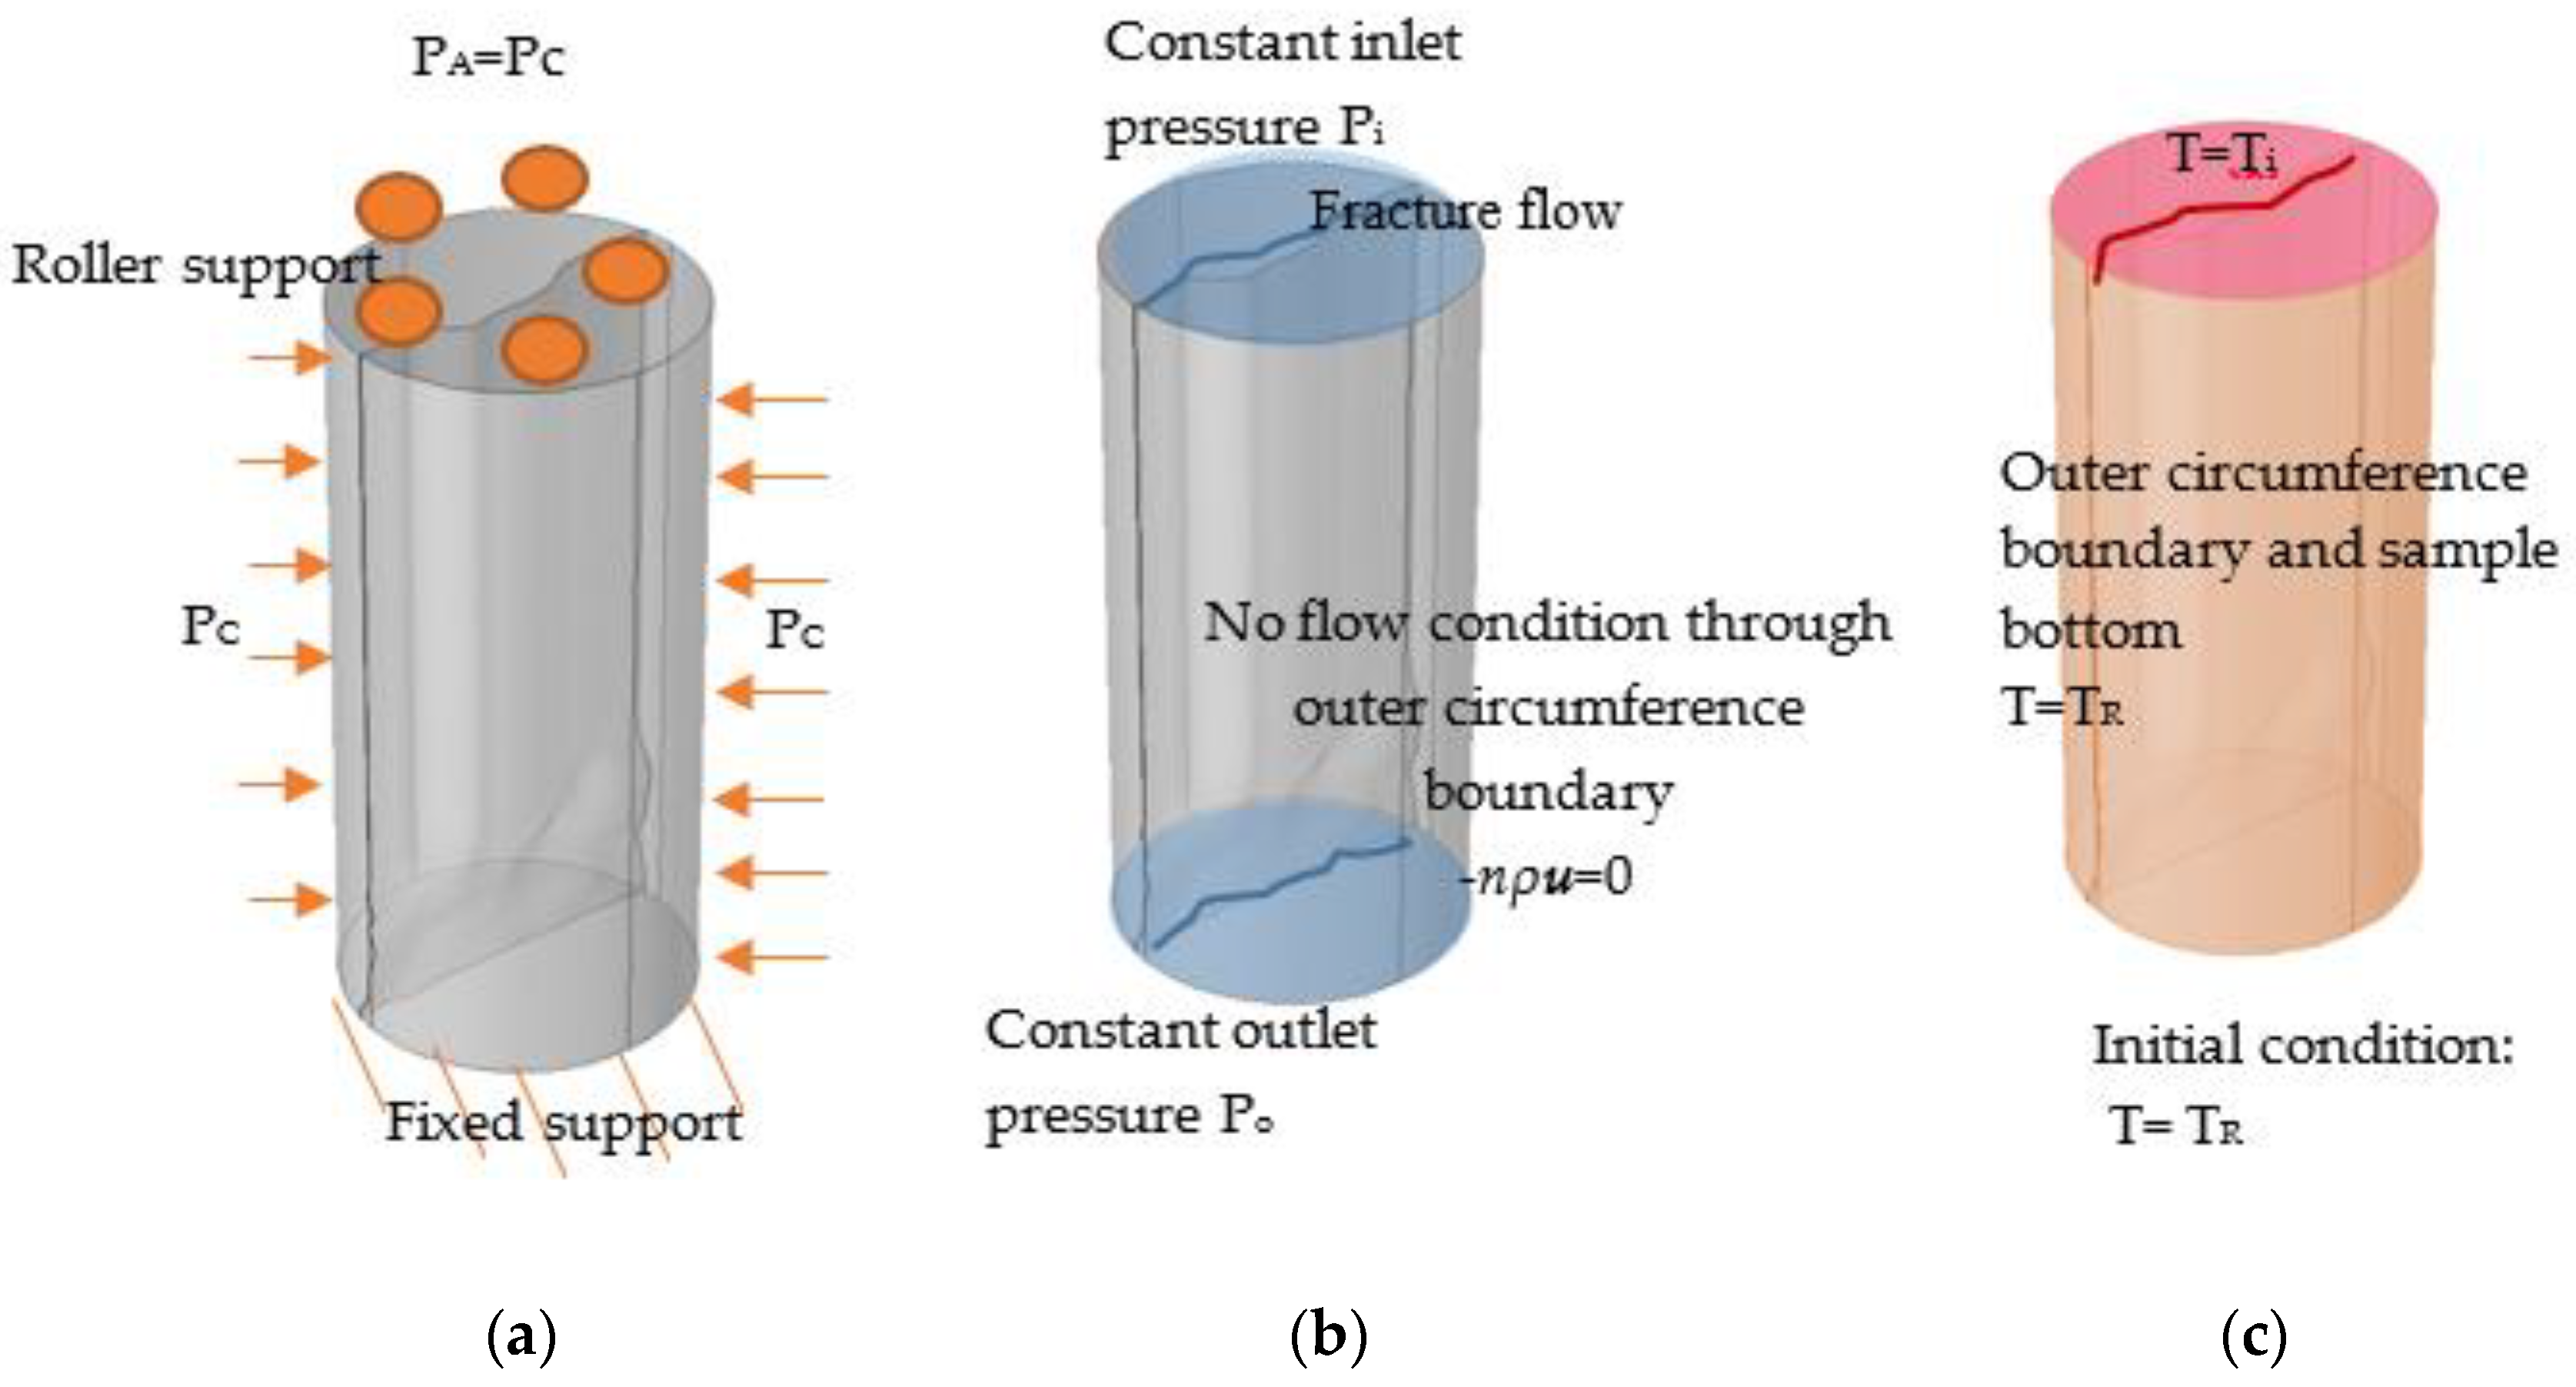
3.1. Model Development

Considering the 3D fracture profile employed, a 3D finite element model was developed simulating drained permeability experiments conducted in the laboratory employing the COMSOL Multiphysics simulator, which is a commercially available cross-platform finite element simulation software [30]. A solid mechanics interface in the structural mechanics module, Darcy’s law in the porous media and subsurface flow sub-module in the fluid flow module and the heat transfer in porous media in the heat transfer module were employed. Solid mechanics and Darcy’s law interfaces were coupled with the poroelasticity interface. Both flow coupling and temperature coupling were employed to couple Darcy’s law and heat transfer in porous media and solid mechanics and heat transfer in porous media, respectively.
The rock sample was simulated with a cylinder of 22.5 mm in diameter and 45 mm in height. The fracture profile separated from CT images was introduced to the model. The overall details of the geometry and boundary conditions of the model are shown in Figure 3.
Considering the boundary conditions of the solid mechanics interface (Figure 3a), the bottom of the sample was assumed to be fixed considering the fixed bottom pedestal, and roller support was introduced to the top of the sample considering the contact between the piston and the top pedestal of the specimen. A boundary load (Pc) was introduced as a radial force along the circumference of the sample, simulating the corresponding confining pressure condition. This was introduced as a parametric sweep for different confining pressure conditions from 10 MPa to 150 MPa in 10 MPa steps. Further, simulating the experimental axial load, which was equal to the confining pressure, the same confining pressure was applied on the top of the sample at each condition. The initial stress and the initial strain were set to zero for all the experiments. As shown in Figure 3b, the injection pressure (Pi) was introduced on the top of the sample, simulating the experimental condition, and the outlet pressure (Po) of 0.1 MPa was introduced to the bottom of the sample. No flow boundary condition (−u = 0) was applied for pore pressure at the sample outer surface. Therefore, the above boundary conditions satisfied the experimental condition and the drained permeability tests. In addition, the sub-interface of fracture flow was introduced to the fracture domain. Initial pressure was set into the atmospheric pressure (Po = 0.1 MPa) in all the experiments. As the initial and boundary conditions in the heat transfer process (Figure 3c), the corresponding rock temperature (TR) was applied through the entire domain (rock matrix and the fracture), representing steady-state thermal conditions prior to the fluid injection for both cases. This was introduced as a parametric sweep for different temperature conditions from room temperature to 350 °C. Higher temperatures were not considered, since water is in the supercritical phase above 374 °C. Next, the top boundary was set to the fluid injection temperature (Ti), which was also introduced as a parametric sweep from room temperature to 350 °C, and the circumference of the rock was set to a constant temperature similar to the rock temperature (TR). This can be represented as the condition where continuous heat flow is provided to the sample from the band heater (i.e., heat from the confining media, as per the present experiment).
The following assumptions were made to solve the model. (1) The rock is homogenous, and the fracture corresponds to a parallel-plate system; (2) the heat transfer between fluid and rock occurs through advection and conduction processes; (3) the rock matrix is thermal elastic and based on small strain assumption; (4) the rock is saturated with water, and both the fracture flow and matrix flow obey Darcy’s Law; (5) single-phase fluid flow occurs in the fracture/porous media, and only the liquid phase of water is considered with temperature-dependent fluid parameters; (6) there is no chemical reaction between the porous medium and injected fluid.

3.2. Governing Equations

The formulation used for structural analysis of small and finite deformation in COMSOL is Lagrangian. Considering the coupled interface of poroelasticity, the material domain consists of the rock matrix and saturated pores/fractures, and both media carries loads. The displacement is considered as a function of the material coordinates in the total Lagrangian configuration, and hence the total strain tensor is written in terms of the displacement gradient, as follows:
ε = 1 2 u + u T + u T u
where u is the displacement vector.
For isotropic linear elastic materials, the total stress tensor can be defined using Duhamel–Hooke’s law, as follows:
S S 0 = C : ε ε 0 ε i n e l
where S0 and ε 0 are the initial stress and strain, which are taken as zero since there is no initial stress or strain. εinel is the sum of all inelastic strains (plasticity and thermal expansion, etc.). C is the fourth-order elasticity tensor.
In order to account for the temperature influence, thermal stresses and strains were introduced to the model. Thermal strain depends on the coefficient of thermal expansion, α and the temperature differential T T r e f , where Tref is the stress-free reference temperature. Therefore, the thermal strain was defined as follows.
ε t h e r m a l = α T T r e f
Thermal expansion affects overall stresses and strains, and as a result of thermal coupling, this effect was added to the model.
The governing equation for fluid flow is:
ϵ p ρ t + · ρ v = 0
where ϵ p is the matrix porosity, ρ is the rock density and v is the volumetric flow rate per unit area of the rocks matrix given by the Darcy velocity, as follows.
v = k μ p
where k is the permeability of the rock matrix and μ is the dynamic viscosity of the fluid.
Additionally, the fracture boundary has been defined as an interior boundary and Darcy’s law [34] has been modified to account for the relatively small flow resistance of the fracture flow and the thickness of the fracture (aperture). The governing equations of fracture flow under steady-state conditions are:
d f ϵ f ρ t + T · d f ρ v = 0
v = k f μ T p
where ϵ f is the fracture porosity and df is the fracture thickness. Here, it should be noted that the matrix block is defined as a 3D element, while the fracture is defined as a 2D element. By accounting fracture thickness df, dimensional consistency has been achieved between the fracture and matrix. Additionally, the T denotes the gradient operator restricted to the fracture plane.
The fracture aperture was incorporated into the model by adopting cubic law [35], such that:
k f = d f 2 12
According to Rutqvist et al. [36], the effect of confinement on fracture permeability can be represented in:
k f = k 0 f e x p ϑ P c
Here, k0f represents the fracture permeability under small reference stress, ϑ is a constant related to the non-linear stiffness of the fracture and Pc is the applied stress.
Therefore, the governing equation of the poroelastic material interface is:
ρ 2 u t 2 = · ( S α B p p r e f I + F v
where ρ is the density of the material, α B is the Biot Wills coefficient, which was defined as 0.47 [19], pref is the reference pressure, which was taken as the atmospheric pressure 0.1 MPa, I is the unit vector and Fv is the load defined as force per unit volume.
The governing equation for the heat transfer in the porous media is:
ρ C p T t + ρ C p v · T + · q = Q
where Cp is the heat capacity at constant pressure, Q contains heat sources other than viscous heating and q is the heat flux, which was defined as:
q = K T
where K is the thermal conductivity of the material.

3.3. Model Input Parameters

Temperature-dependent material properties were obtained from the experimental results. In order to consider the thermally induced damage of the granite sample, it is essential to incorporate the temperature-dependent granite properties (i.e., Young’s modulus and Poisson’s ratio). These properties were included in the model as temperature-dependent functions [32]. The temperature-dependent water properties were employed for the liquid phase considering their considerable variations in the temperature range. Further, the model was calibrated with the fracture aperture data obtained from the experimental work. The input parameters employed for the simulation are shown in Table 2.

4. Results and Discussions

4.1. Experimental Results on Flow Characteristics of Fractured Granite under High Temperatures

In the experiments, a constant temperature condition was maintained inside the pressure cell, and the pressure was dropped from Pi (injection pressure) to Po (outlet pressure which was held under atmospheric conditions due to drain conditions). It should be noted that water was injected into the sample; however, depending on the pressure and temperature conditions, the phase of the water may change into steam (inside the sample) due to the large pressure gradient across the sample. Hence, this exercise is different from steam–water two-phase flow [9]. Therefore, considering the above experimental conditions, it is important to highlight that the properties of the injection fluid are drastically changed under high temperatures, resulting in a significant impact on the flow rate through the sample, which was carefully considered in calculations and numerical simulations.
Conventionally, the variable fluid properties are dealt with as a function of pressure and temperature, and hence it is assumed that permeability is uniform throughout the sample [37]. Therefore, employing this approach, average permeability through the sample was calculated as follows:
k = C d m d t
C = 1 A   μ   T , P ρ   T , P   d P d x 1
where dm/dt is the steady-state mass flow rate, A is the cross-sectional area, μ   T , P and ρ   T , P are the temperature and pressure-dependent dynamic viscosity and density of water. The temperature and pressure-dependent viscosity and density were obtained NIST REFPROP program [38], developed by the National Institute of Standards and Technology, and those were cross-checked with the regression equations (Table 2) utilised in the COMSOL model. Necessary fluid parameters were assigned for Equations (13) and (14), considering the pressure distribution and the sample for the isothermal condition. Then, the average density and viscosity values were obtained, and those were employed for the permeability calculation.

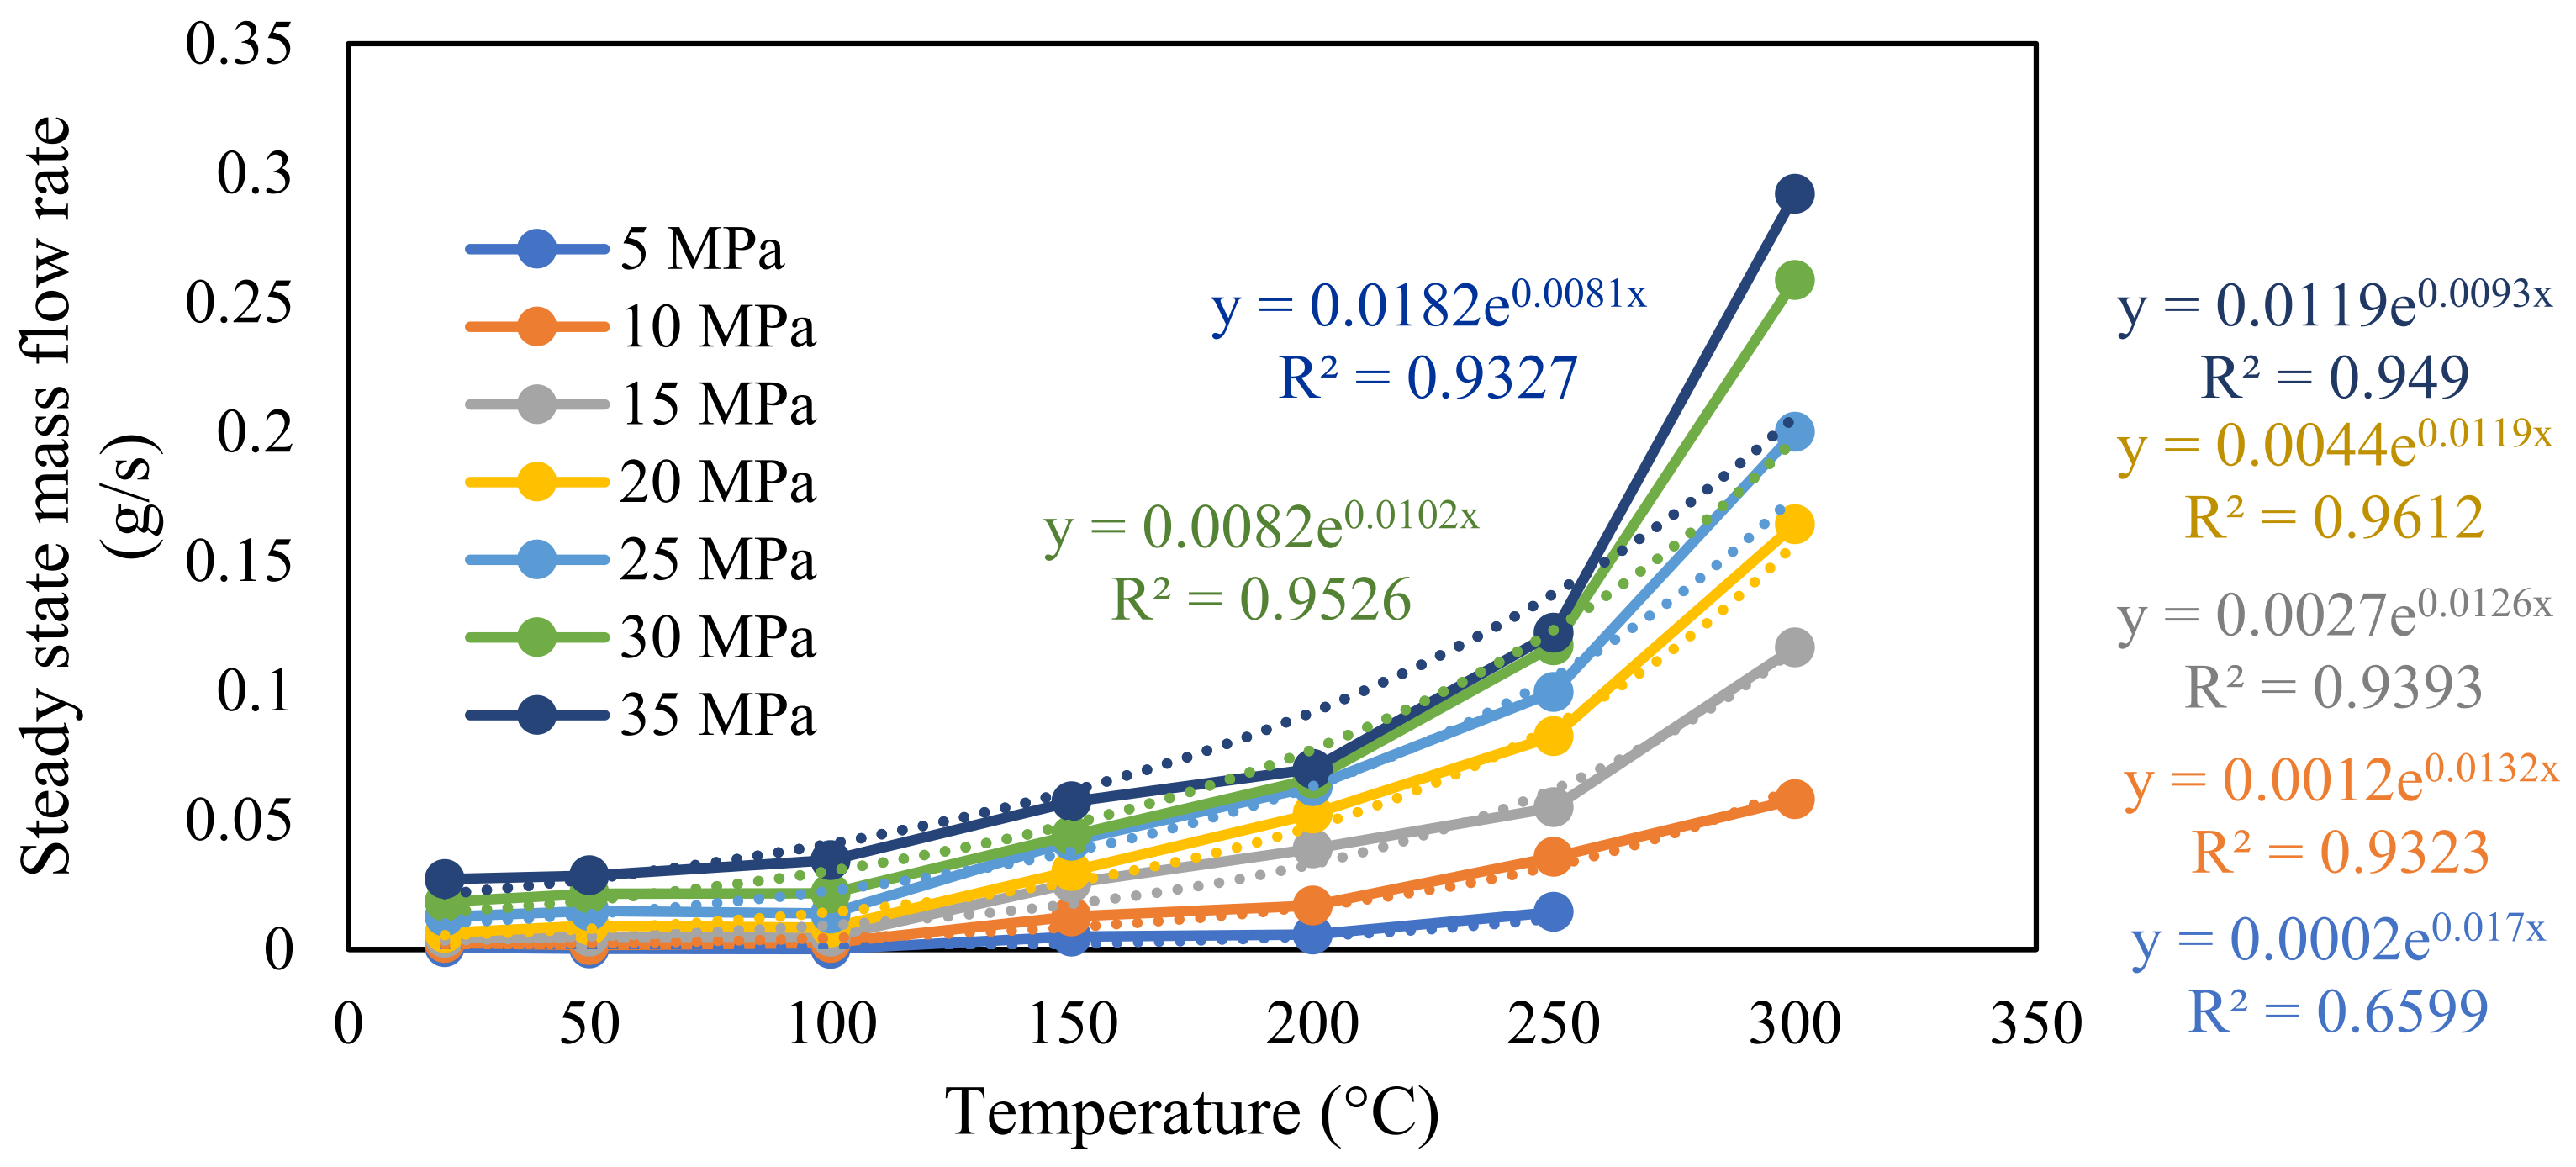
4.1.1. The Effect of Temperature on the Flow Rate of Fractured Granite

Steady-state mass flow rate variation with temperature for 45 MPa confining pressure is depicted in Figure 4. Test results clearly show that increasing temperature causes significant changes in mass flow rate, where mass flow rate exponentially increases with increasing temperature. If an artificially made fracture is considered, flow behaviour through it largely deepens on the roughness of the fracture walls and the contacting asperities [12], properties of the fluid medium [38] and effective stresses applied to the fracture [39]. Under the considered high-temperature conditions, both flow channel and flow properties are changed, and therefore, both attributes need to be considered to fully understand the temperature-dependent flow characteristics through the fracture.
Considering the temperature-dependent material properties of water (Table 2), it is evident that both viscosity and density decrease with increasing temperature. However, viscosity reduction is significant compared to density reduction because density reduction is more evident with the phase changes of water (from liquid to gas state), and mainly occurs at low injection pressures and extreme temperatures. According to the experimental results, this condition was observed at 300 °C and 5 MPa injection pressure, where accurate mass flow rates could not be measured, since steam was observed from the outlet instead of water (liquid); thus, the measurements were not included in Figure 4. Therefore, it can be highlighted that the overall influence of phase change is minimal for the present experiments, since larger injection pressures (>5 MPa) have been employed where water remains as a liquid under higher pressures. Although phase change is less significant, a noticeable viscosity reduction can be identified in the considered test conditions. Lower viscosity results in less frictional resistance and considerably enhances the flow performance [40]. However, although the flow properties are significantly improved even at relatively low temperatures (>100 °C), as a result of thermal overclosure, the flow path has shrunk (i.e., reduction of fracture aperture), resulting in less increment in the steady-state mass flow rate below 100 °C. However, the thermal damage (i.e., thermally induced micro-fractures) at later temperatures and improved viscosity has resulted in an exponential increase in mass flow rate at higher temperatures. This can be further explained via the permeability results presented in Section 4.1.3. Further, the mass flow rate increased with the increase in injection pressure at all the temperatures, as expected due to the reduction of effective stress applied to the sample.

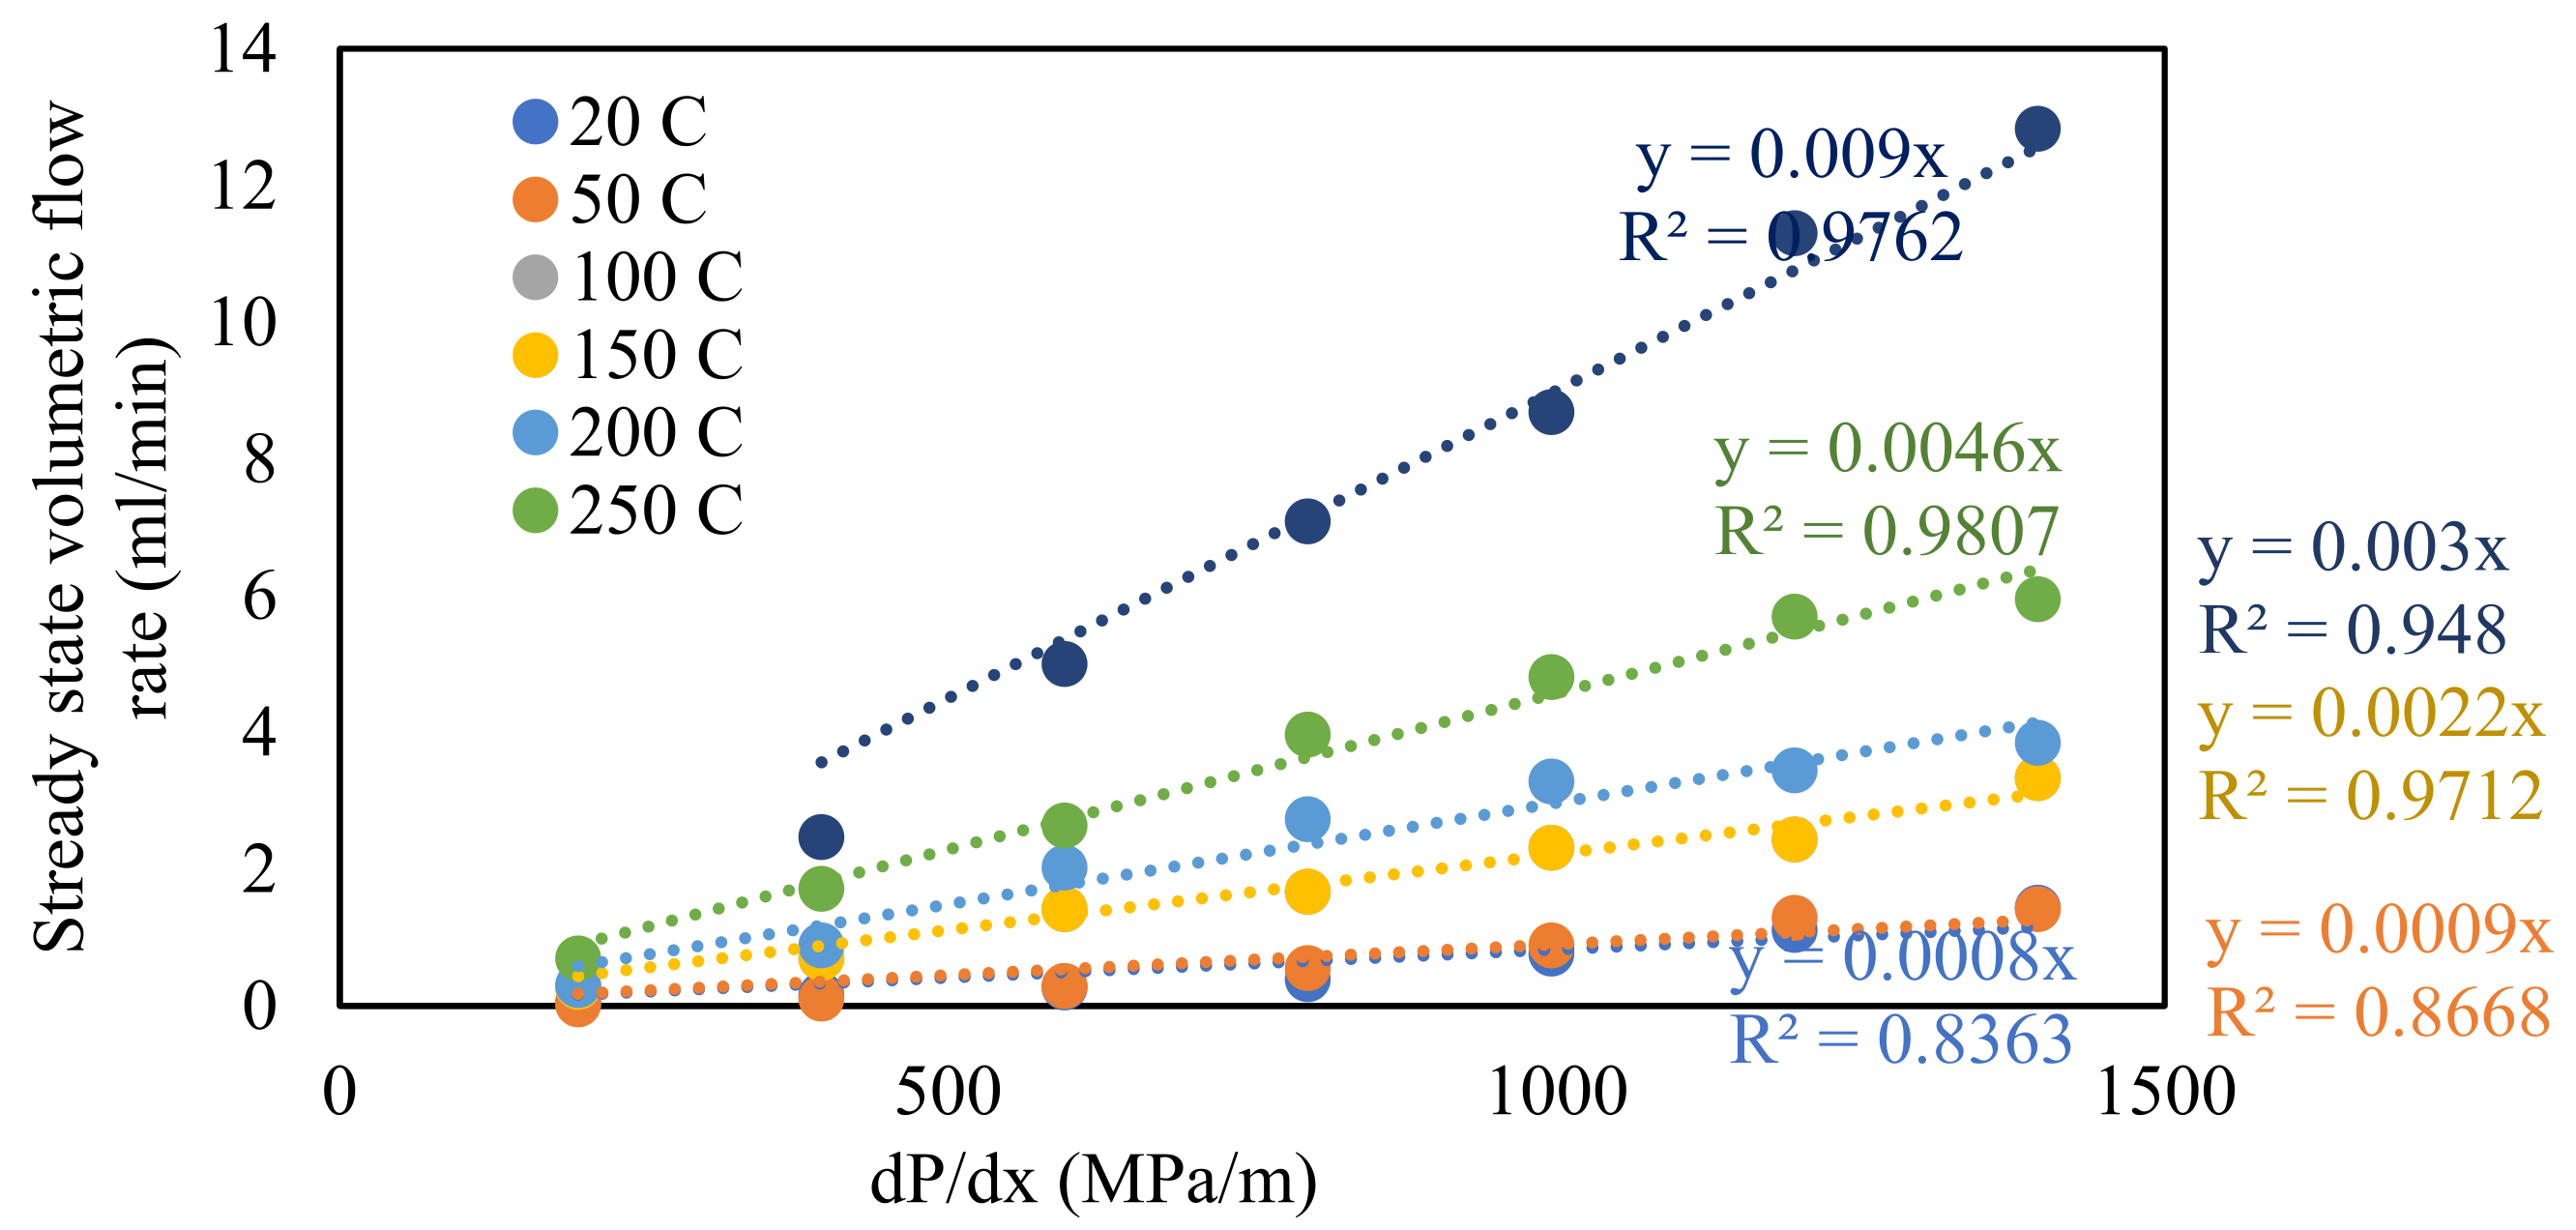
4.1.2. Applicability of Darcy Equation

Before applying the temperature-dependent permeability calculation method, the applicability of Darcy’s law for the test conditions was investigated.
Steady-state volumetric flow rates were calculated by applying average density values at each mean pressure point. Pressure distribution along the sample for the considered temperature was carefully considered to assign relevant temperature-dependent flow properties. Then, as shown in Figure 5, the pressure gradients were plotted against the steady-state volumetric flow rates for different temperatures. A linear relationship of the pressure gradient over steady-state volumetric flow rates could be observed with a coefficient of determination (R2) over 0.83 at all the considered temperatures; surprisingly, the lowest R2 values could be observed at room temperature (20° C), where the lowest flow rates were observed. Further, it should be noted that only a small steady-state mass flow rate could be observed for all the test conditions, including at extremely high injection pressures, because the effective stress at all the conditions was significantly high (>10 MPa) under the applied large confining pressure (45 MPa) (the largest mass flow rate was 0.29 g/s in 300 °C at 35 MPa injection pressure). Therefore, considering the linear laminar relationship, the Darcy equation was applied to calculate the fracture permeability of the tested conditions here.

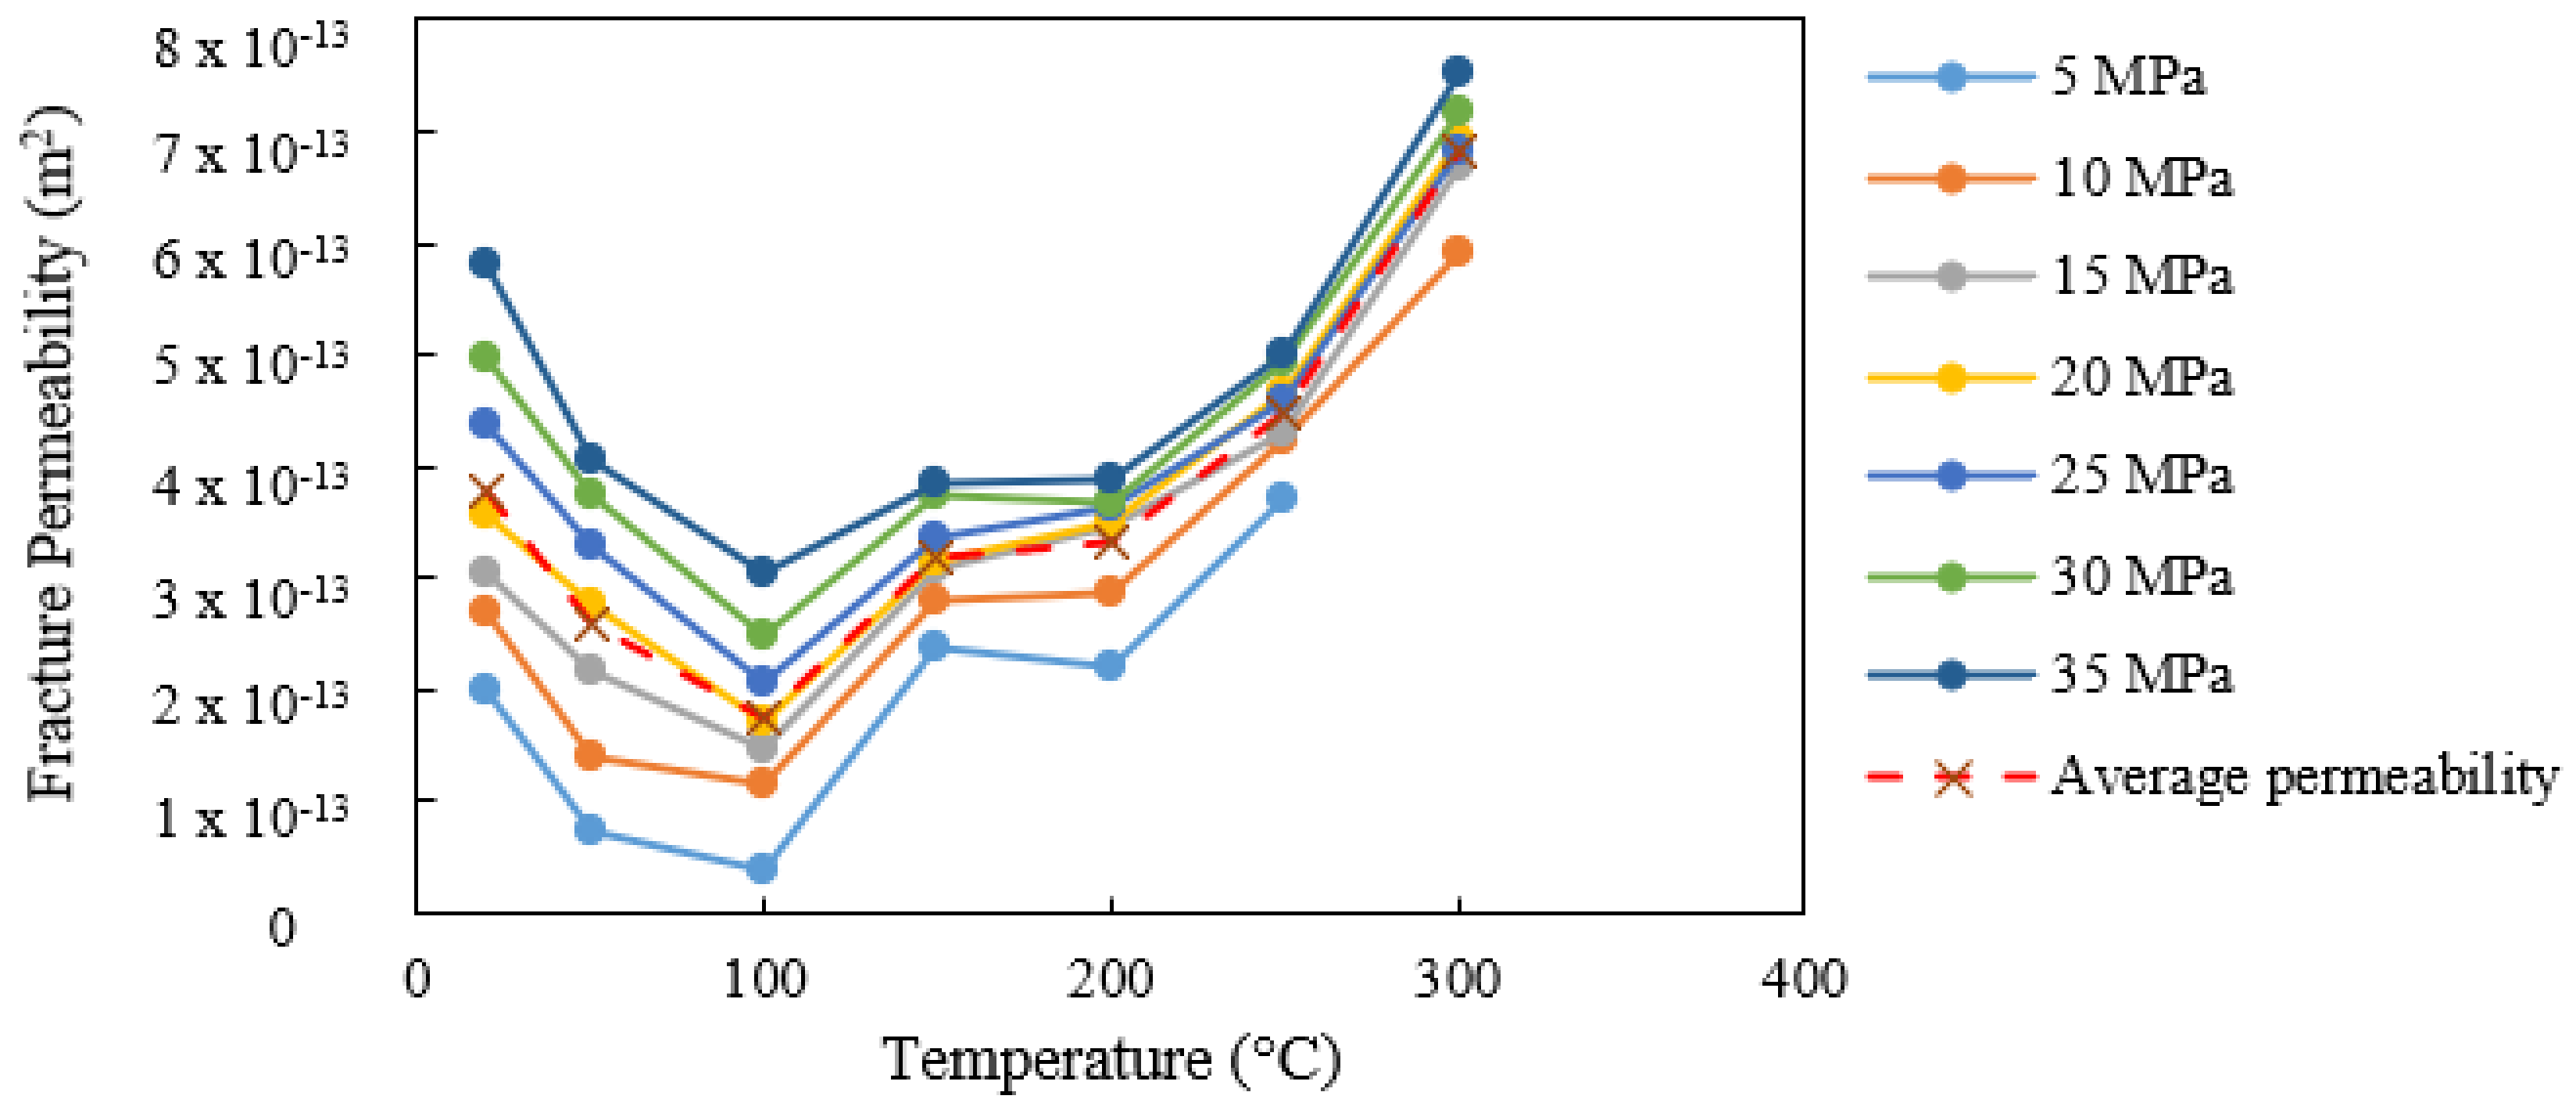
4.1.3. Temperature-Dependent Fracture Permeability

Figure 6 illustrates the calculated fracture permeability values under different temperature and injection pressure conditions based on Equation (13). As shown in Figure 6, two trends can be identified when considering the temperature-dependent fracture permeability under the tested conditions; fracture permeability exhibits a general reduction trend with increasing temperatures up to 100 °C, followed by a considerable increment in higher temperatures.
The reduction of fracture permeability at lower temperatures further emphasises the thermal expansion of the induced fracture and the rock matrix. Thermal expansion of the fracture enhances the interlocking effect, resulting in the closure of the fracture [12]. Further, literature reports that for the same granite types, an increment in uniaxial strength and elastic modulus at relatively low temperatures (<200 °C) leads to potential reduction of pore spaces as a result of the thermally induced volumetric expansion [33]. Therefore, at temperatures below 100 °C, flow through the fracture has been reduced with this thermally induced over-closer effect. Considering the second trend, when the temperature is above 100 °C, a general increment in fracture permeability can be identified at all temperatures. This should be related to the thermally induced structural damage that happened to the rock mass that attributed enhancement of hydraulic aperture and induction of new flow paths. As depicted in Figure 7, due to the anisotropy of the rock matrix, different individual minerals consist of different elastic and thermal properties, resulting in anisotropic expansion of them with increasing temperature, which causes induction of thermal stresses on grain boundaries and weaker grains. Once those thermal stresses exceed the bond strength of a particular grain boundary or mineral, thermally induced fractures are formed along grain boundaries (inter-granular or inter-crystalline cracks) as well as along the large grains (intra-granular or intra-crystalline cracks) [41]. Induction and propagation of those thermally induced cracks are dependent on a threshold temperature of the rock, where thermal cracks can be generated when the temperature exceeds the threshold temperature [42]. This threshold temperature value is dependent on the rock mass properties, mainly the mineralogy and grain size distribution and the deposition history of the rock mass [42]. For the same type of granite, detailed discussion of thermally induced microstructural alterations has been discussed by Kumari et al. [33], and it has been identified that, irrespective of existing cracks, no noticeable thermal damages were created until 200 °C, and then induction and propagation of intra-granular cracks mainly occurred along large quartz and feldspar mineral and grain boundary cracks along quartz–quartz and quartz–feldspar minerals. As a result of these new thermally induced cracks, reduction of strength characteristics beyond 100 °C and enhancement of fluid flow characteristics can be identified in the same study.

4.2. Numerical Simulations on Flow Characteristics of Fractured Granite under High Temperatures

In the next phase of the study, an experimentally validated laboratory-scale numerical model was developed using the COMSOL Multiphysics software to simulate the flow behaviour of fractured reservoir rocks under high temperature and pressure conditions. The model was utilised to predict the permeability, fluid pressure pressures, and stress–strain development of rock samples under extreme conditions, which were difficult to achieve in the laboratory.

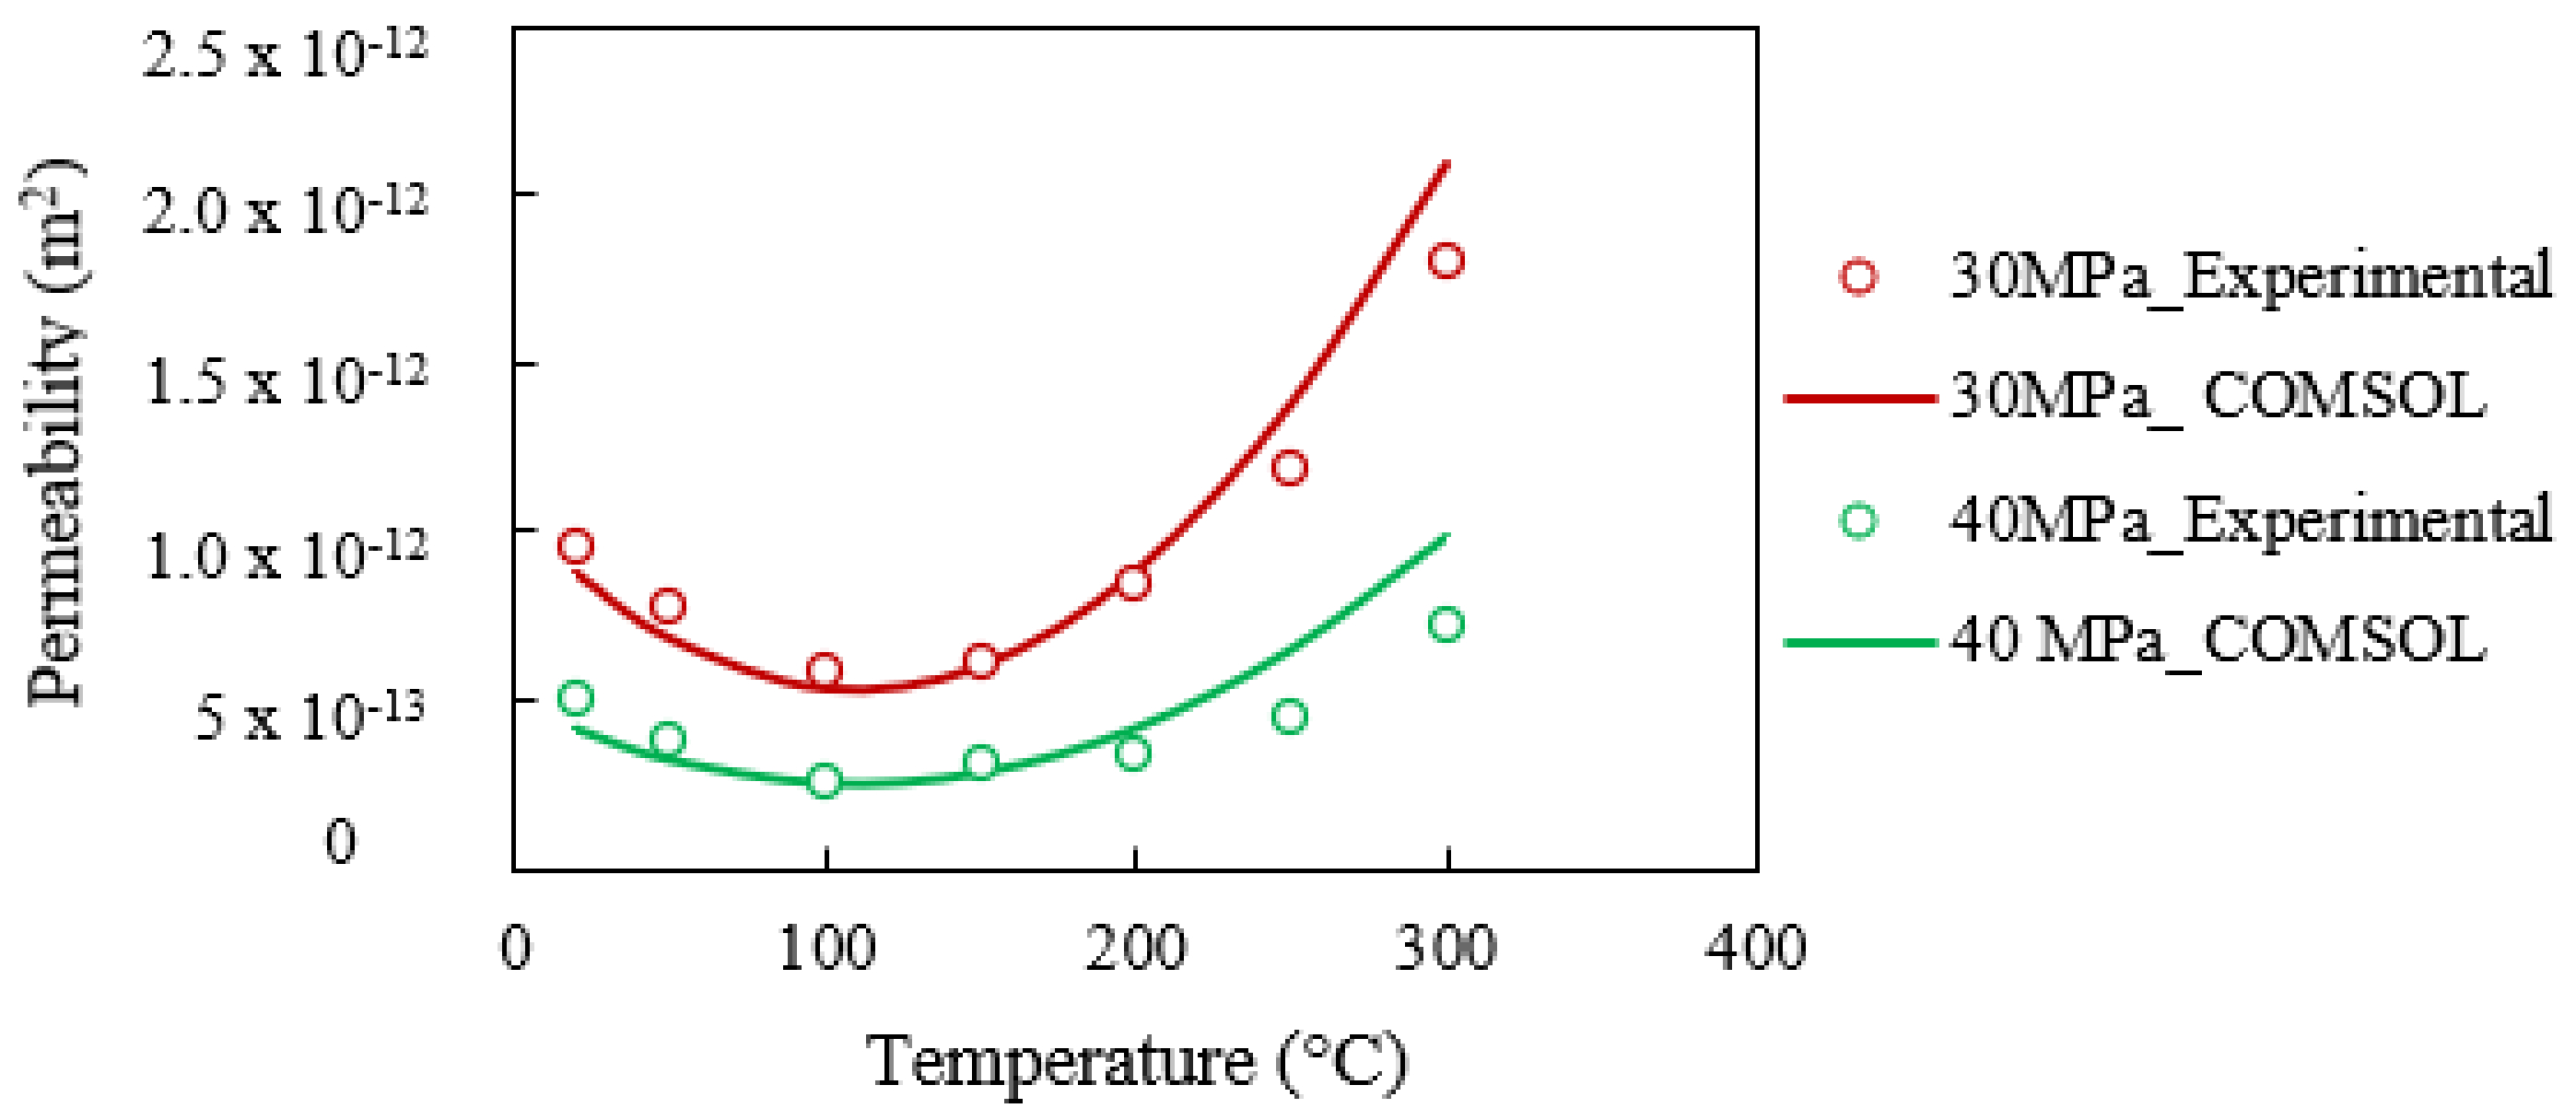
4.2.1. Model Validation

The developed coupled thermo–hydro–mechanical model was validated by the experimental results. Figure 8 illustrates a comparison of permeability values obtained from high-temperature experiments for two different confining pressures, 30 MPa and 40 MPa. According to the figure, the model-predicted permeability values are in good agreement with the experimental results, with a maximum error of 12% compared with the experimental results for all the test conditions. The discrepancies of predicted permeability values in higher temperatures were relatively high compared to the low temperatures (>200 °C). Thermally induced micro-fractures have contributed to the increase in fracture permeability. While the model has captured thermally induced damage mechanisms through applied temperature-dependent physical properties of the rock and the fluid, the results can be further improved by considering an effective fracture aperture that considers both major diametrical fractures and the induced micro-fractures. Further, it is worthwhile to mention that there can be potential errors associated with steady-state mass flow measurements at very high temperatures (<250 °C), particularly under low injection pressures (>10 MPa), as a result of the phase transition from liquid to gas. For example, at 300 °C and 5 MPa injection pressure, steam was observed from the outlet instead of water (liquid); thus, the results were not included, since measurements could not be made precisely, as discussed in Section 4.1.1.

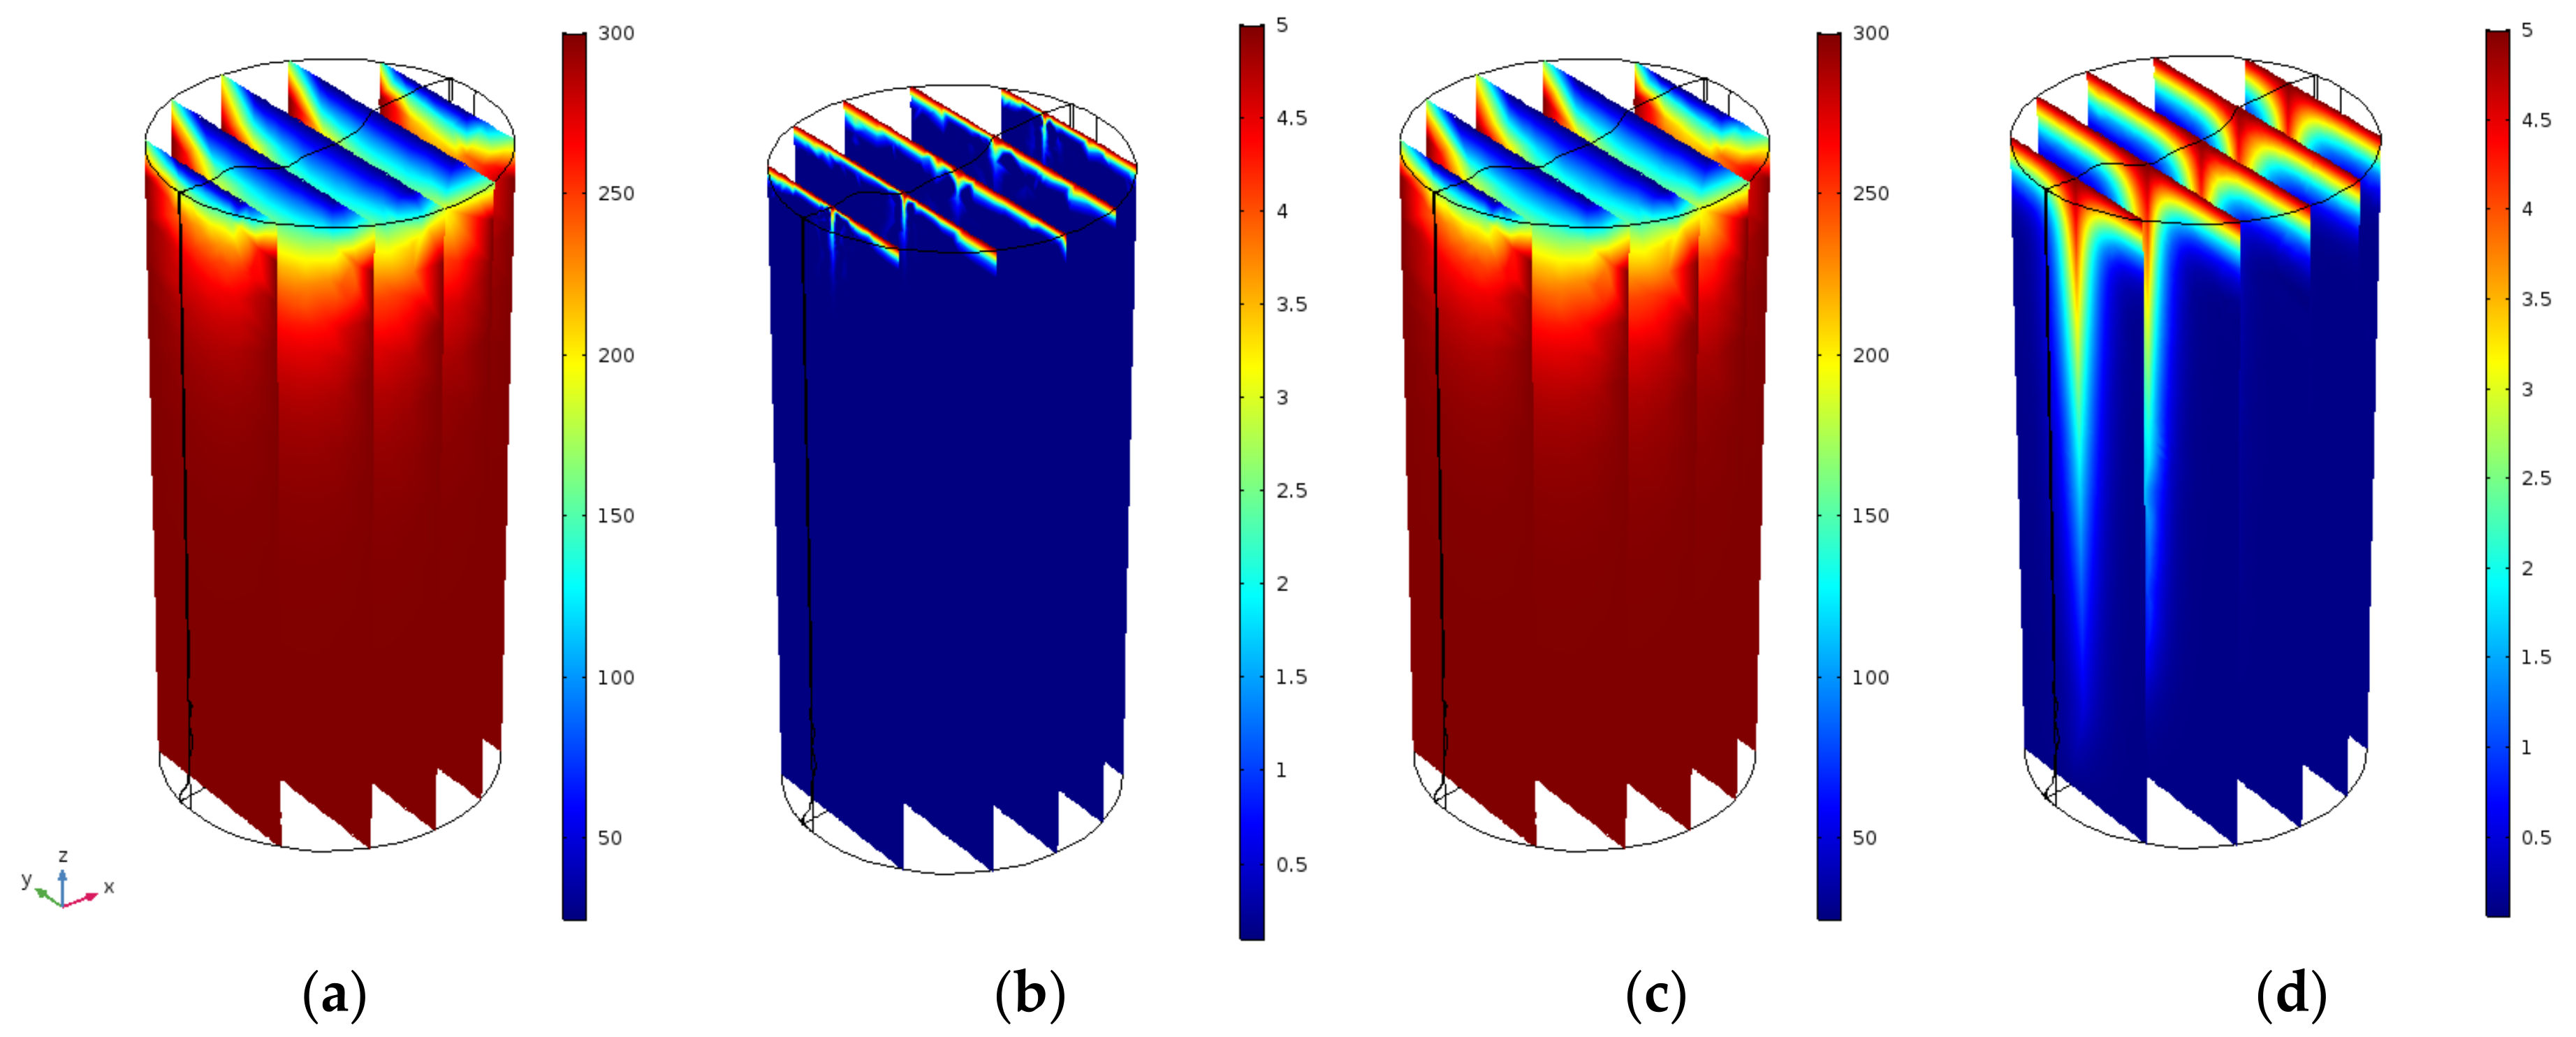
4.2.2. Pressure and Temperature Development on the Rock Matrix and the Fracture

Figure 9 illustrates the temperature distribution and corresponding pressure distribution in the cross-sections of the sample under 300 °C temperatures due to the injection of cold water (25 °C). Simulations were performed under 20 MPa confining pressure and 5 MPa injection pressure after injection of 6 min and after one week. As shown in Figure 9, it was found that the thermal drawdown of the sample was negligible, irrespective of the increment in pressure development with time. This was mainly due to the constant temperature boundary condition representing external heating sources that maintain a uniform temperature along the sample boundary, except for the injection face. It should be noted that in the permeability calculation of the experimental study, it was assumed that the fluid temperature is equal to the rock temperature. This numerical result further confirms this hypothesis, such that we can assume there is a minimal thermal drawdown in the rock (only close to the injection point) due to the constant thermal supply, higher heat conduction of water and slow fluid discharge, which enable a sufficient fluid retention time.

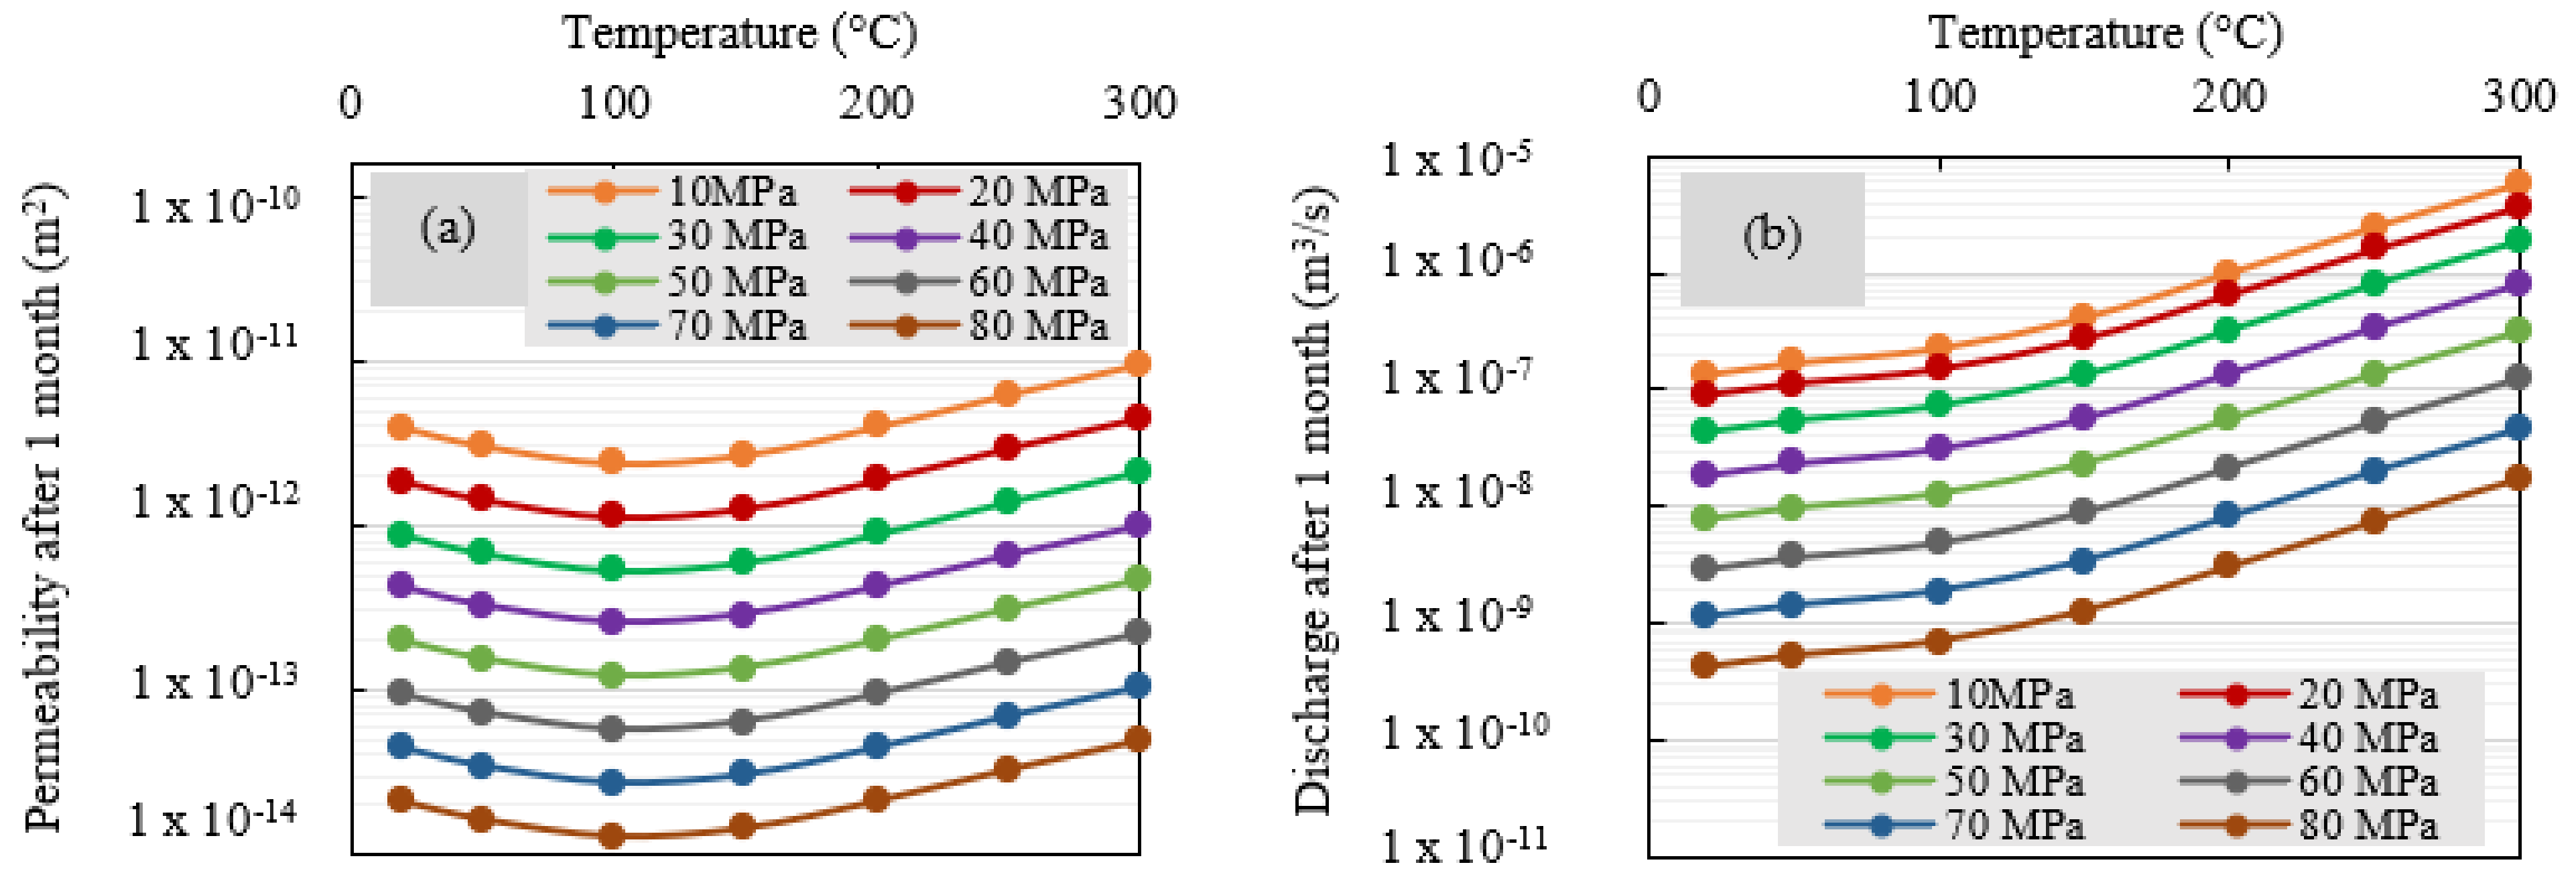
4.2.3. Predicted Flow Characteristics of Fractured Rocks under a Wide Range of Temperature and Stress Conditions

Next, the model was extended to obtain the fracture permeability and steady-state flow rate under higher confining pressures and higher temperatures, which could not be found under laboratory conditions. Figure 10 illustrates predicted permeability and fluid discharge after a 1-month injection under extreme confining pressure conditions at different temperatures.
As shown in Figure 10a, the simulation also captured that with increasing temperature, permeability initially decreased when subjected to low temperatures (>100 °C), followed by considerable increments at the later temperatures. Permeability is the parameter used to represent the changes in the rock matrix, irrespective of the properties of the fluid medium. Decreasing permeability with increasing temperature under low temperatures (>100 °C) implies the shrinkage of the fracture aperture or the decline of the flow path, followed by thermally induced micro-fractures, which attribute enhancement of flow due to the induction of new flow paths discussed previously.
Considering the temperature-dependent fluid discharge (Figure 10b), increasing temperature causes a non-linear increment in the flow rate such that, up to 100 °C, there is a considerable enhancement of flow rate under all confining pressure conditions, and that increasing rate substantially increased at later temperatures. Fluid discharge of the fractured specimen depends on the alteration of the fracture aperture and the properties of the fluid medium [37]. Under the considered high-temperature conditions, both flow channel and flow properties are changed, and therefore, both attributes have attributed to temperature-dependent fluid discharge through the fracture. For example, the temperature-dependent substantial viscosity reduction results in less frictional resistance at high temperatures, enhancing the fluid flow [40]. However, although the viscosity is enhanced at low temperatures, the flow path has shrunk due to thermal overclosure, resulting in a minor increment in the steady-state mass flow rate below 100 °C. However, at later temperatures, thermally induced damage to both the flow path and viscosity improves, resulting in significant enhancement of fluid discharge at higher temperatures. Therefore, considering the temperature-dependent flow-through experiments, it can be concluded that temperature significantly influences the flow performance due to the changes in the rock matrix and alterations of the pore fluid properties.

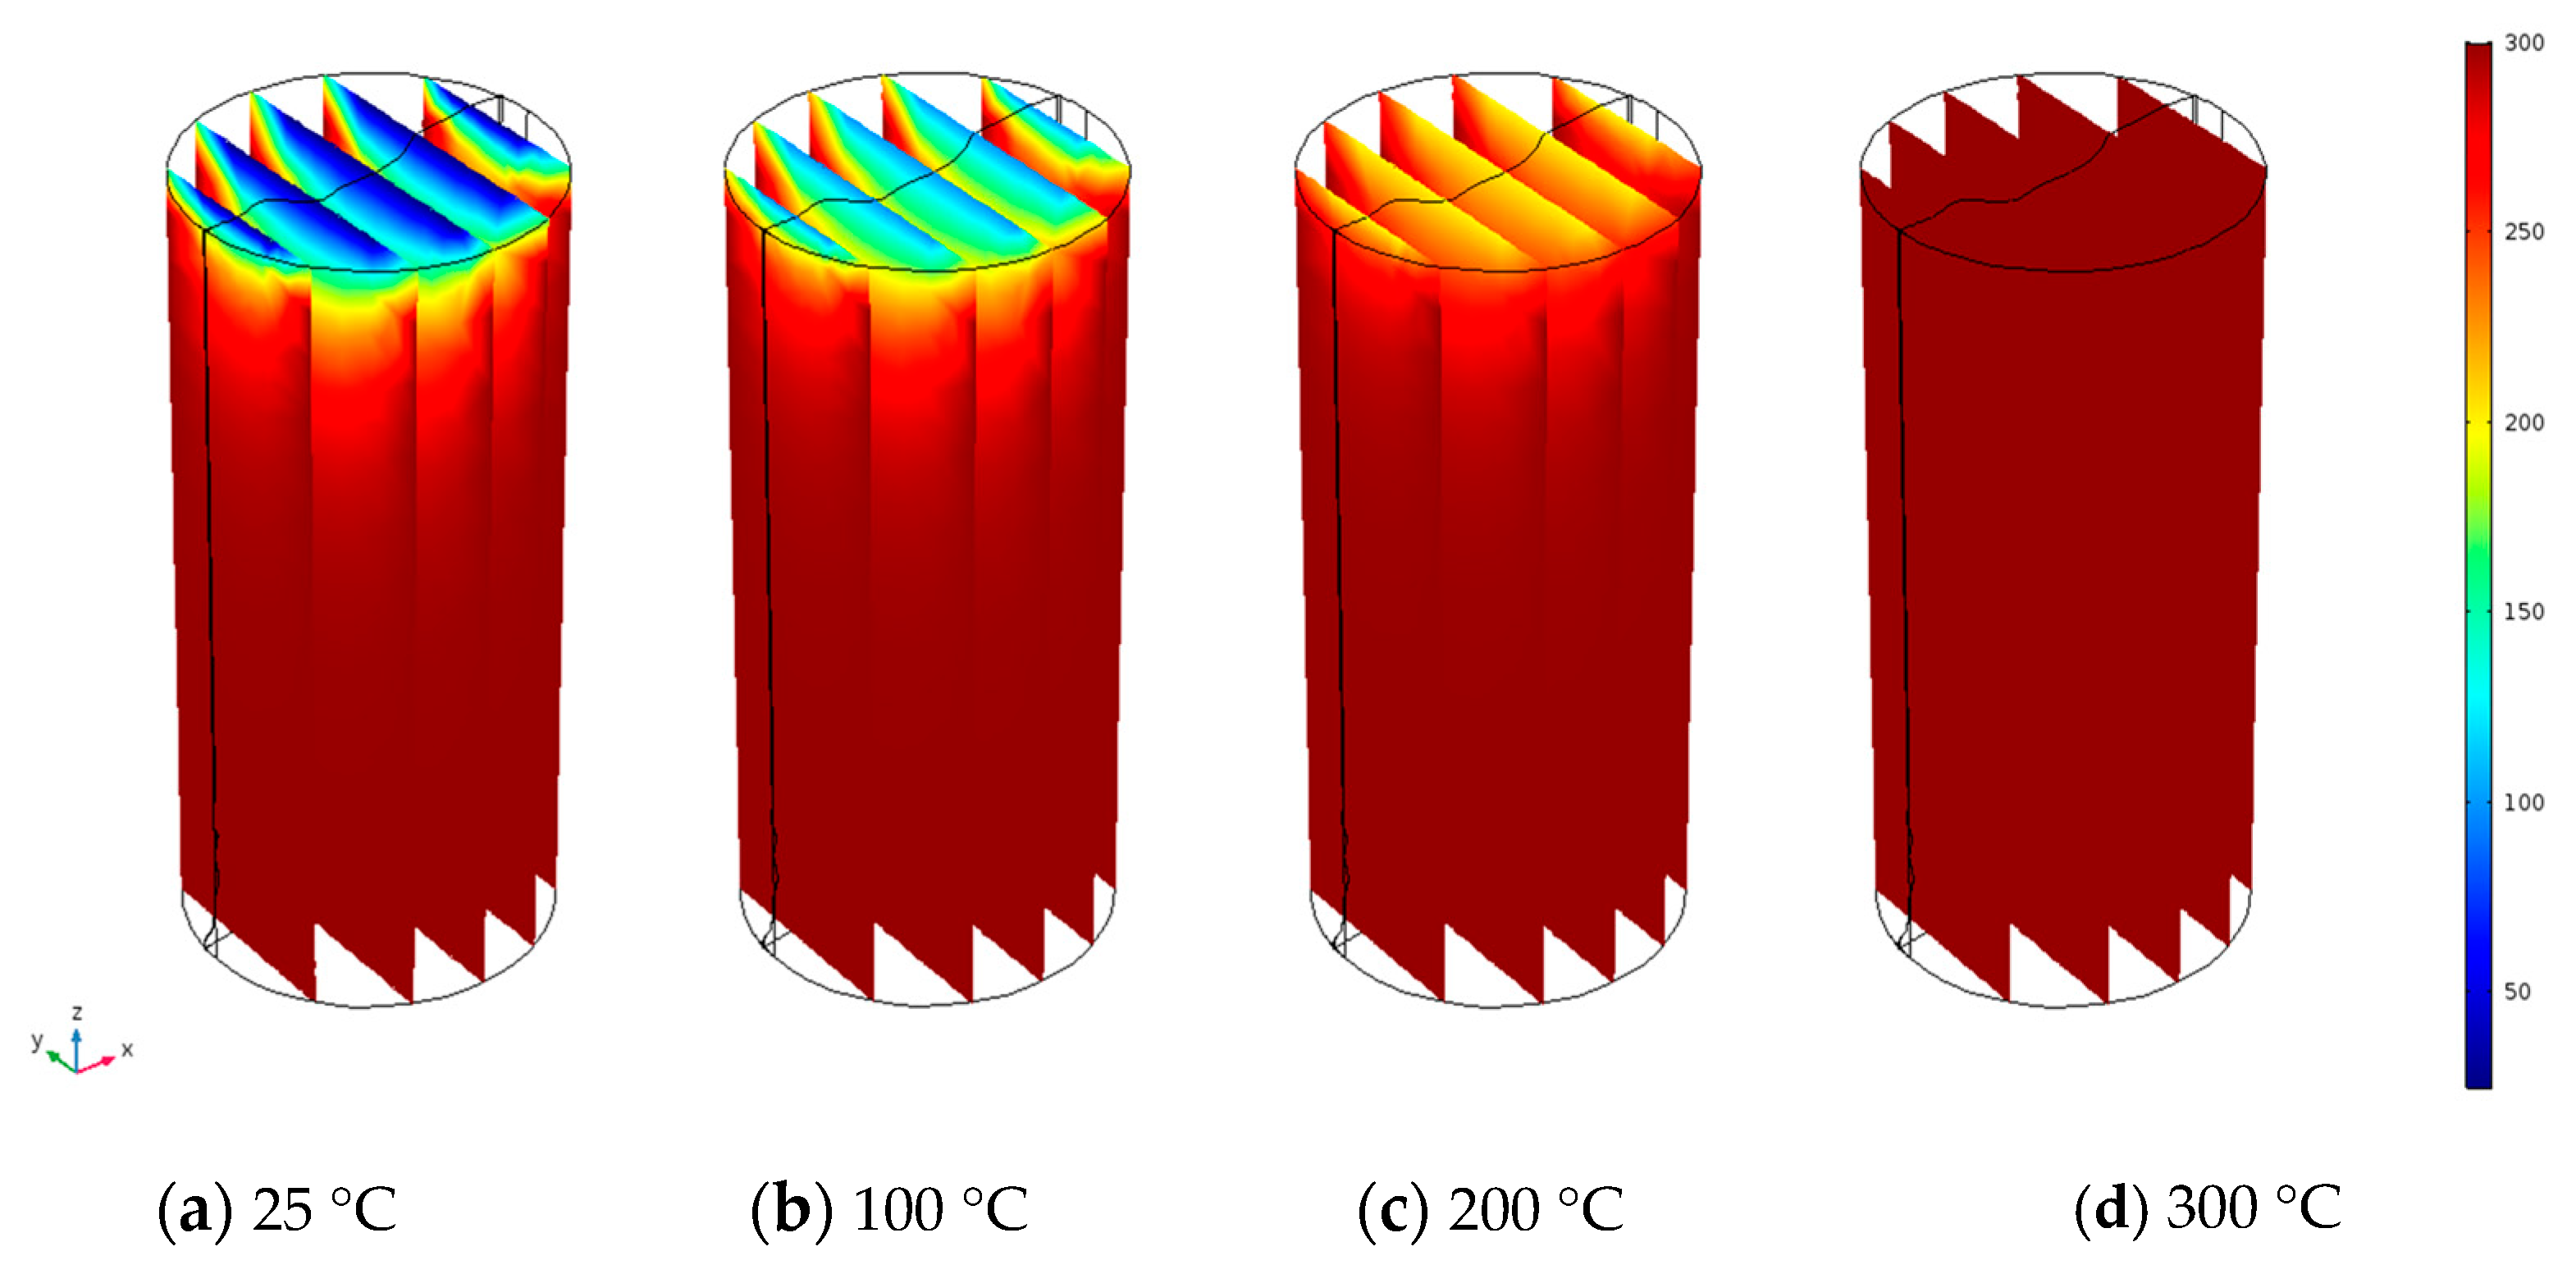
4.2.4. Effect of the Temperature of the Injection Fluid

Due to the difficulty of precise temperature measurement of the circulation fluid at the inlet point, one of the main assumptions of the experimental study was that fluid temperature is equal to the system temperature, since the fluid is travelling along the long spiral fluid flow line, which was inside the pressure cell, which was under the target temperature. It was assumed that this fluid flow line acts as a heat exchanger, and therefore, water enters the fractured rock under the target temperature. This hypothesis was cross-checked with the numerical model by checking the temperature profile of the rock matrix via injection of water under different temperatures.
Figure 11 illustrates temperature distribution in the cross-sections of the sample perpendicular to the fracture once the rock matrix is under 300 °C initial condition. It was found that only the temperature dropped close to the injection point. Injection of cold fluid resulted in a clod region close to the injection point and, with the increase in the fluid temperature, the temperature of the cold region increased until the system reached a constant temperature, which was equal to the rock temperature when the fluid temperature was equal to the rock temperature. This was the condition assumed in the experimental permeability calculation. However, even under injection of water under 25 °C, generally, more than 90% of the rock matrix was under the target (initial) temperature. Therefore, considering this extreme scenario, we can reasonably consider that the fluid temperature is equal to the initial rock temperature under the present experimental conditions.

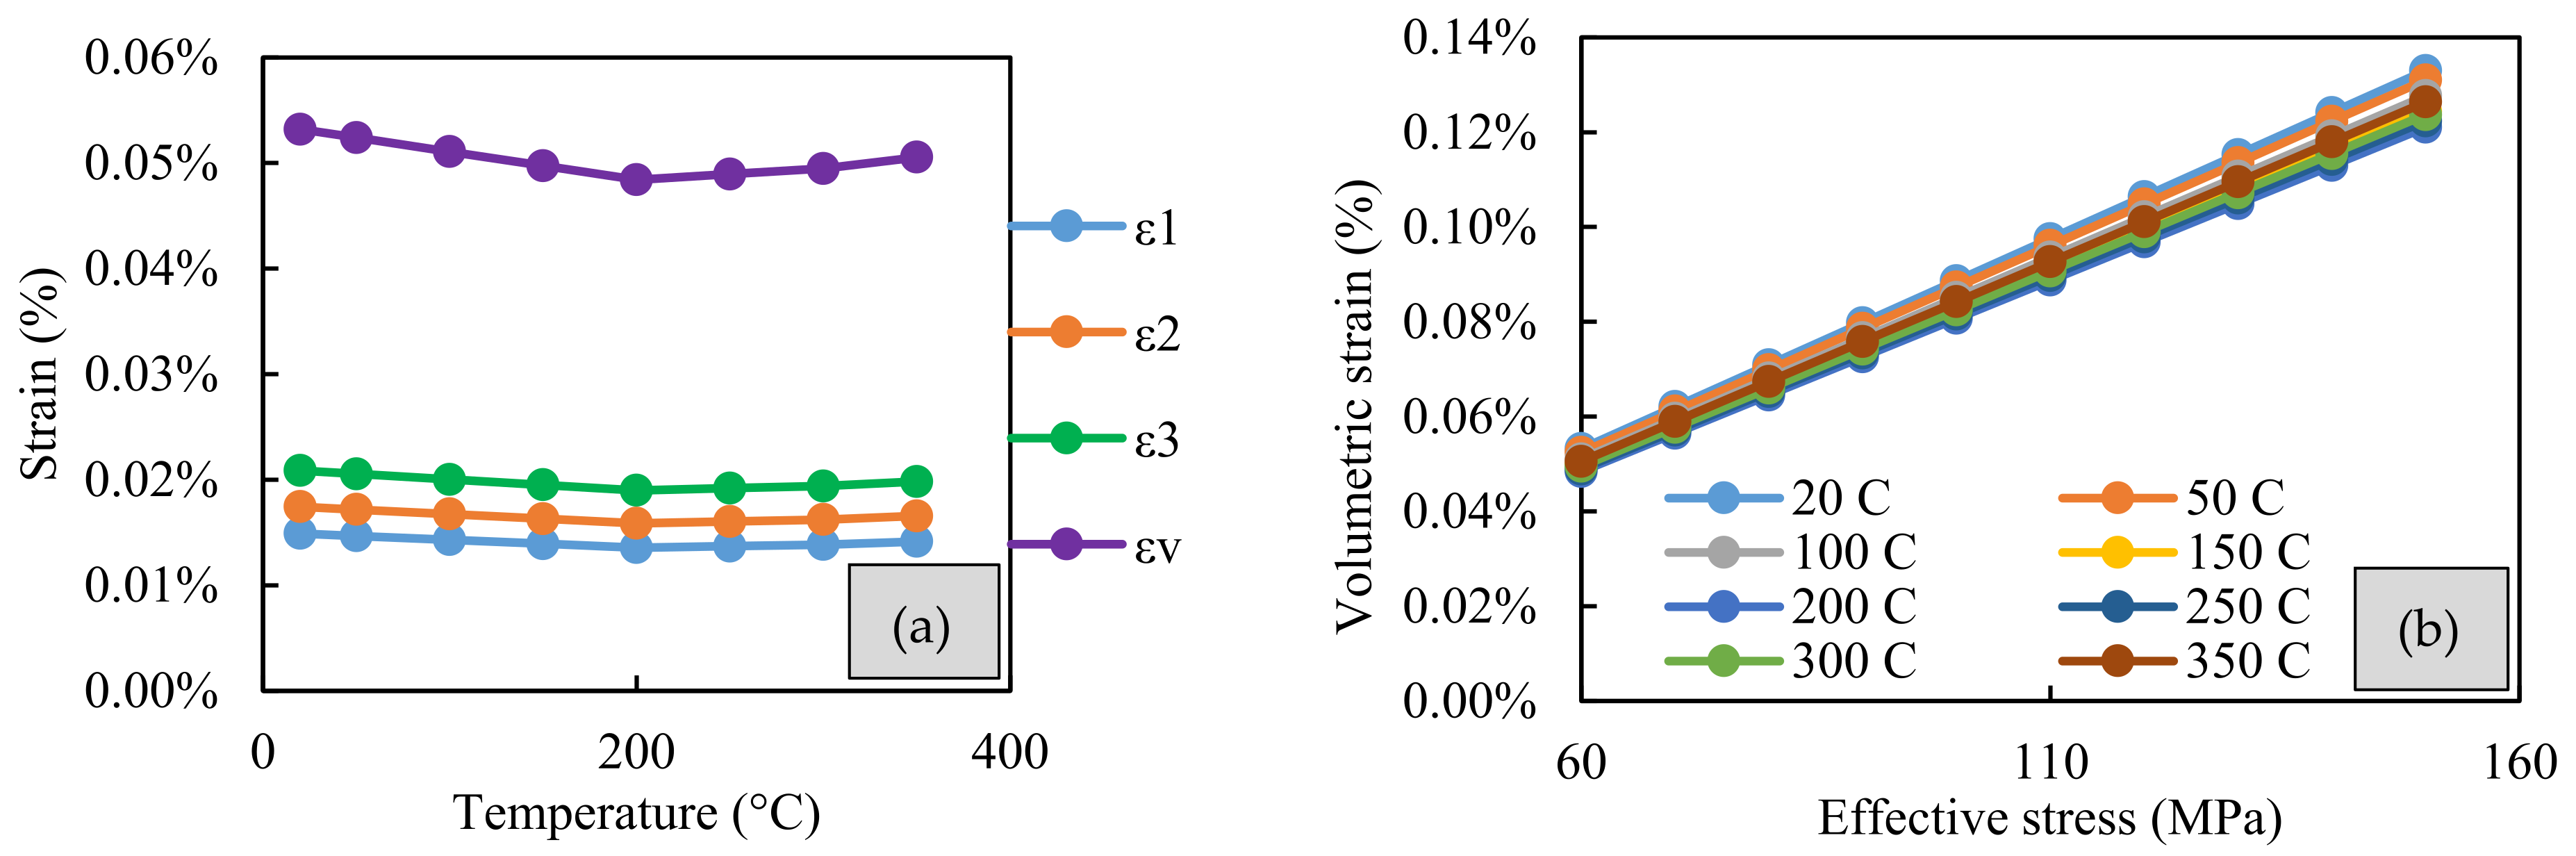
4.2.5. Effect of Temperature on the Mechanical Characteristics of the Fractured Rocks

Next, the effect of temperature on the mechanical behaviour of the fractured sample was considered, and Figure 12 illustrates average strain values in the granite specimen for different temperatures applied to the sample under different stress conditions. Interestingly, it was found that average strain values are initially decreasing under low temperatures (<200 °C), followed by a slight increment under higher temperatures. For example, under 90 MPa effective stress condition (Figure 12a), around a 10% reduction in volumetric strain was found when the temperature increased from room temperature to 200 °C. However, once the temperature increased from 200 °C to 300 °C, around a 5% increment in the volumetric strain was observed. This behaviour was consistent with all effective stresses, as presented in Figure 12b.
It was assumed that the initial reduction in average strain values was attributed to the thermal expansion of the granite, which resulted in an overall decrease in volumetric strain, with the presence of thermal and mechanical strains acting in opposite directions. Therefore, increasing the temperature resulted in a linear reduction in the average strain values under the same stress conditions compared to the room-temperature condition. However, above 200 °C, average strain values non-linearly increased in all the stress conditions, and it was anticipated that this behaviour resulted in a reduction in the stiffness of granite under higher temperatures. It should be noted that the temperature-dependent Young’s modulus and Poisson’s ratio values were incorporated into the model. The increasing temperature resulted in a minor increment in Young’s modulus under low temperatures (>200 °C for Strathbogie granite). However, Young’s modulus significantly decreased at higher temperatures due to thermal damage (formation of inter- and intra-granular thermal cracks). Correspondingly, Poisson’s ratio initially decreased under low temperatures (>200 °C for Strathbogie granite) and non-linearly increased under higher temperatures, resulting in less brittle characteristics under higher temperatures [32]. This thermally induced damage was introduced to the model as temperature-dependent material parameters. This exercise also confirmed the necessity of incorporating thermally induced damage into the material in the numerical simulations under non-isothermal conditions. Thermal expansion, which is widely used, is not the only mechanism associated with non-isothermal conditions, particularly under higher temperatures. In this regard, the temperature-dependent Young’s modulus and Poisson’s ratio can be effectively utilised, and these can be obtained from laboratory experiments.

5. Conclusions

In this study, an experimentally validated numerical model was developed to understand the flow behaviour of fractured granite rocks under a wide range of stress and temperature conditions. The following conclusions are drawn from the research:
  • Flow characteristics in fractured/porous media are significantly dependent on the properties of the fluid media, and therefore, the application of the relevant properties of the fluid media is an essential attribute for high-temperature conditions, since flow properties are significantly altered at higher temperatures.
  • Both flow rate and fracture permeability non-linearly decrease with confining pressure due to the closure of the mechanically induced fracture under the larger effective stresses. Further, increasing the injection pressure results in a linear increment in fracture permeability due to opening the induced fracture.
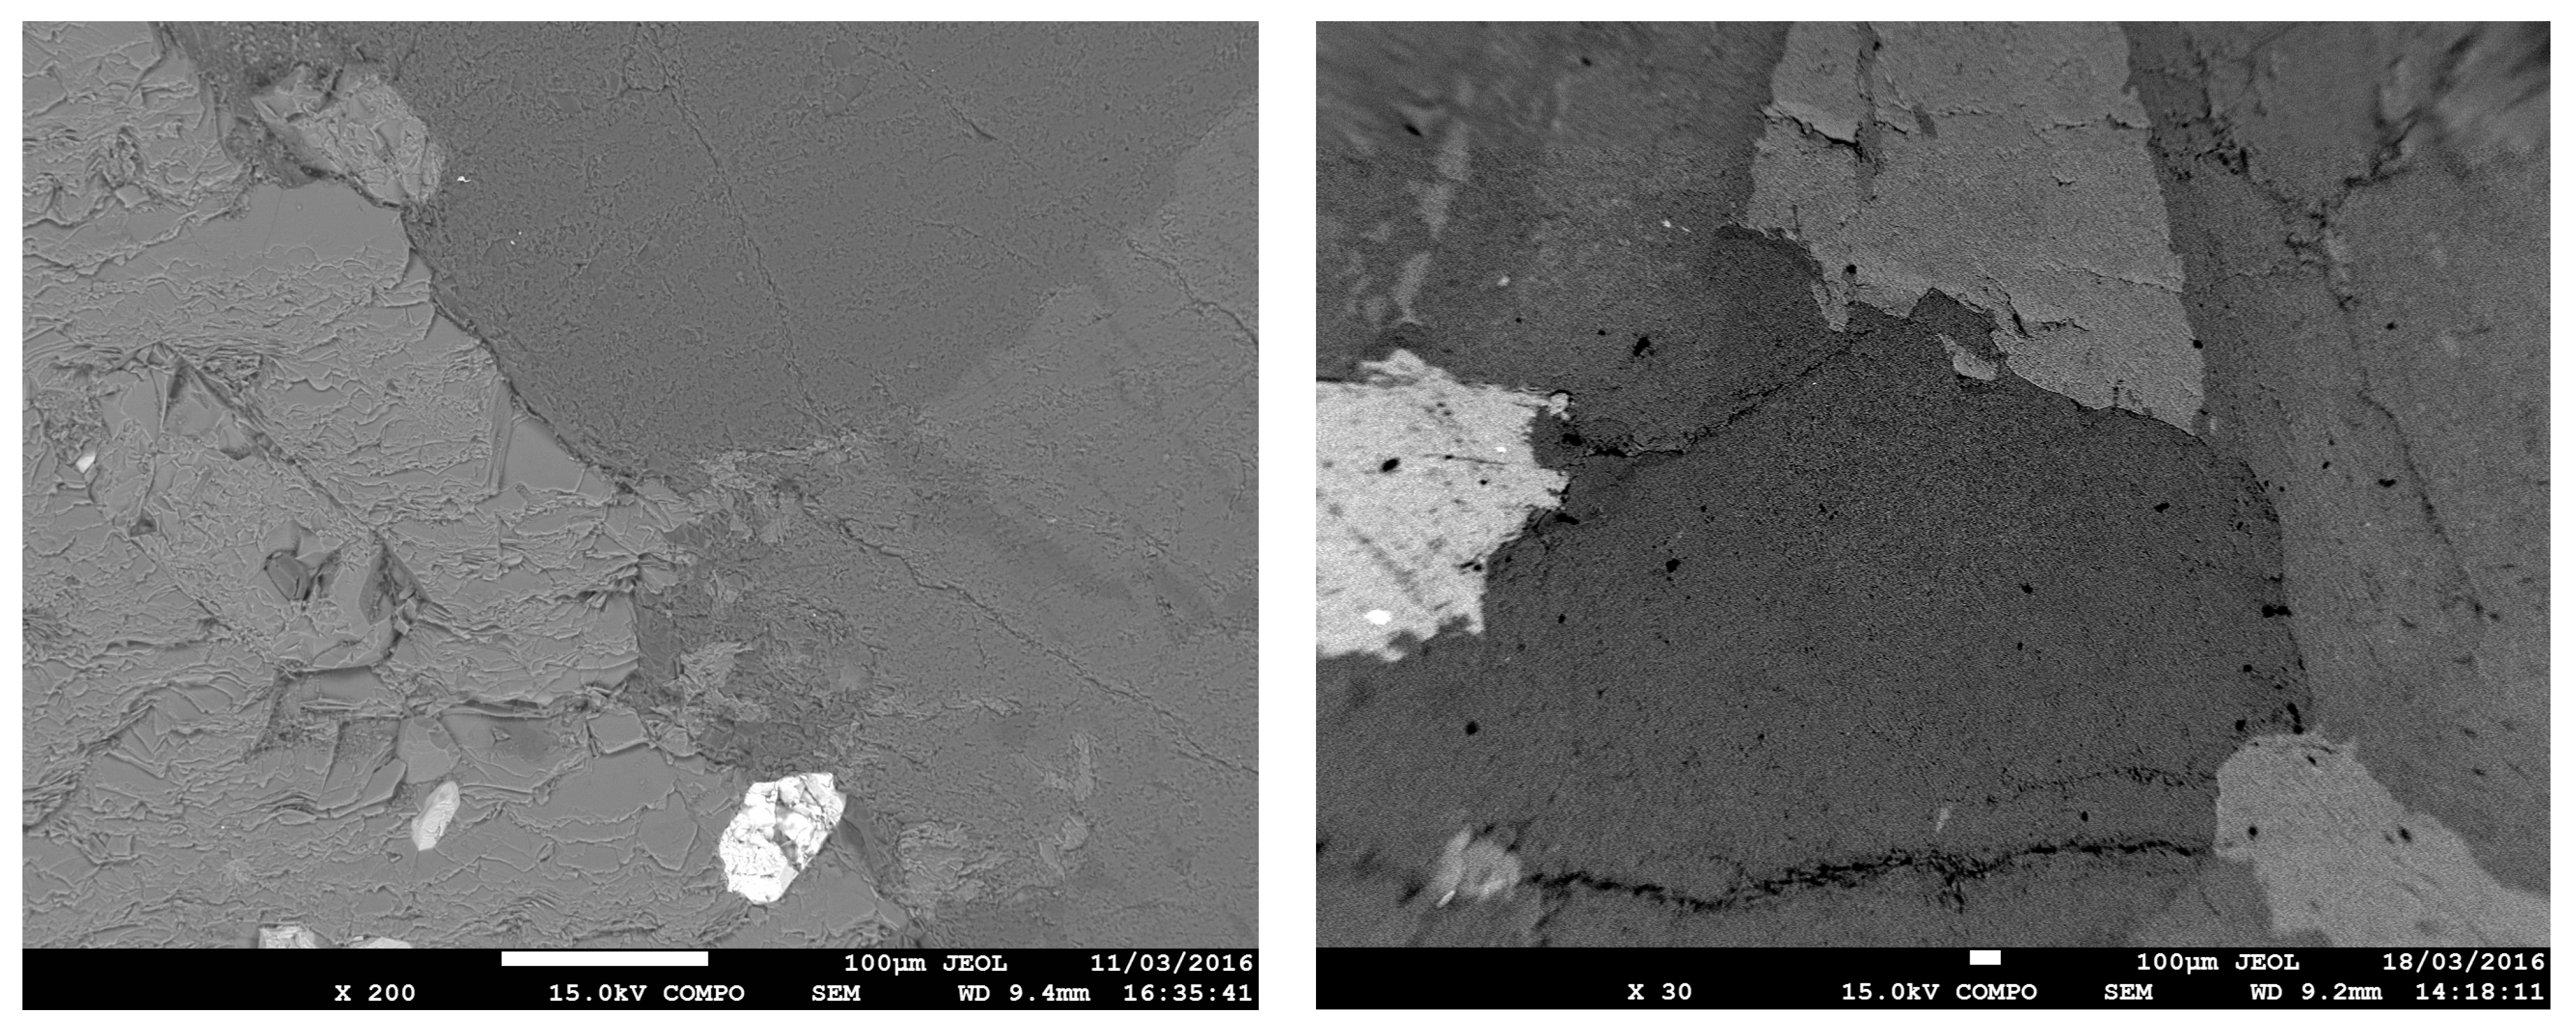
  • Increasing the temperature causes an initial reduction in granite’s fracture permeability up to 100° C due to the possible thermal expansion of the fracture, which attributes enhancement of the interlocking effect due to the thermal overclosure. A further increase in temperature causes enhancement of permeability-inducing thermal cracks, which results in enhancement of new flow paths in the rock matrix.
  • It is essential to consider thermally induced damage to the material in the numerical simulations under non-isothermal conditions. In this regard, the temperature-dependent Young’s modulus and Poisson’s ratio, which can be determined from laboratory experiments, can be effectively utilised.
  • Considering the reservoir-scale flow characteristics, closure of rock fractures can be expected at higher reservoir depths; however, both higher injection pressures and temperatures can enhance the flow characteristics of the deep geological reservoirs. Further, reservoir temperature and pressure are critical parameters when estimating the flow performance; thus, temperature-dependent circulation fluid properties should be incorporated into the analysis.

Author Contributions

Conceptualization, P.G.R. and W.G.P.K.; methodology, W.G.P.K.; software, W.G.P.K.; validation, W.G.P.K.; formal analysis, W.G.P.K.; investigation, W.G.P.K.; resources, P.G.R.; data curation, W.G.P.K.; writing—original draft preparation, W.G.P.K.; writing—review and editing, P.G.R.; supervision, P.G.R.; project administration, P.G.R.; funding acquisition, P.G.R. and W.G.P.K. All authors have read and agreed to the published version of the manuscript.

Funding

This research was funded by University Global Partnership Network (UGPN) 2021.

Institutional Review Board Statement

Not applicable.

Informed Consent Statement

Not applicable.

Data Availability Statement

Data is contained within the article.

Conflicts of Interest

The authors declare no conflict of interest.

References

  1. Walsh, J.B. Effect of pore pressure and confining pressure on fracture permeability. Int. J. Rock Mech. Min. Sci. Geomech. Abstr. 1981, 18, 429–435. [Google Scholar] [CrossRef]
  2. Blaisonneau, A.; Peter-Borie, M.; Gentier, S. Evolution of fracture permeability with respect to fluid/rock interactions under thermohydromechanical conditions: Development of experimental reactive percolation tests. Geotherm. Energy 2016, 4, 1. [Google Scholar] [CrossRef] [Green Version]
  3. Wang, F.; Li, B.; Zhang, Y.; Zhang, S. Coupled thermo-hydro-mechanical-chemical modeling of water leak-off process during hydraulic fracturing in shale gas reservoirs. Energies 2017, 10, 1960. [Google Scholar] [CrossRef] [Green Version]
  4. Ghassemi, A.; Nygren, A.; Cheng, A. Effects of heat extraction on fracture aperture: A poro–thermoelastic analysis. Geothermics 2008, 37, 525–539. [Google Scholar] [CrossRef]
  5. Wu, B.; Zhang, X.; Jeffrey, R.G.; Bunger, A.P.; Huddlestone-Holmes, C. Perturbation analysis for predicting the temperatures of water flowing through multiple parallel fractures in a rock mass. Int. J. Rock Mech. Min. Sci. 2015, 76, 162–173. [Google Scholar] [CrossRef]
  6. Izadi, G.; Elsworth, D. The influence of thermal-hydraulic-mechanical-and chemical effects on the evolution of permeability, seismicity and heat production in geothermal reservoirs. Geothermics 2015, 53, 385–395. [Google Scholar] [CrossRef] [Green Version]
  7. Guo, X.; Zou, G.; Wang, Y.; Wang, Y.; Gao, T. Investigation of the temperature effect on rock permeability sensitivity. J. Pet. Sci. Eng. 2017, 156, 616–622. [Google Scholar] [CrossRef]
  8. Luo, J.; Zhu, Y.; Guo, Q.; Tan, L.; Zhuang, Y.; Liu, M.; Zhang, C.; Xiang, W.; Rohn, J. Experimental investigation of the hydraulic and heat-transfer properties of artificially fractured granite. Sci. Rep. 2017, 7, 39882. [Google Scholar] [CrossRef] [Green Version]
  9. Watanabe, N.; Kikuchi, T.; Ishibashi, T.; Tsuchiya, N. ν-X-type relative permeability curves for steam-water two-phase flows in fractured geothermal reservoirs. Geothermics 2017, 65, 269–279. [Google Scholar] [CrossRef]
  10. Yang, Y.; Liu, Z.; Sun, Z.; An, S.; Zhang, W.; Liu, P.; Yao, J.; Ma, J. Research on Stress Sensitivity of Fractured Carbonate Reservoirs Based on CT Technology. Energies 2017, 10, 1833. [Google Scholar] [CrossRef] [Green Version]
  11. Bandis, S.; Lumsden, A.; Barton, N. Fundamentals of rock joint deformation. Int. J. Rock Mech. Min. Sci. Geomech. Abstr. 1983, 20, 249–268. [Google Scholar] [CrossRef]
  12. Barton, N.; Makurat, A. Hydro-thermo-mechanical over-closure of joints and rock masses and potential effects on the long term performance of nuclear waste repositories. In EUROCK; CRC Press: Liège, Belgium, 2006; pp. 445–450. [Google Scholar]
  13. Fang, Z.; Wu, W. Laboratory friction-permeability response of rock fractures: A review and new insights. Geomech. Geophys. Geo-Energy Geo-Resour. 2022, 8, 15. [Google Scholar] [CrossRef]
  14. Olsson, R.; Barton, N. An improved model for hydromechanical coupling during shearing of rock joints. Int. J. Rock Mech. Min. Sci. 2001, 38, 317–329. [Google Scholar] [CrossRef]
  15. He, M.; Liu, R.; Xue, Y.; Feng, X.; Dang, F. Modeling of Navier–Stokes flow through sheared rough-walled granite fractures split after thermal treatment. Geomech. Geophys. Geo-Energy Geo-Resour. 2022, 8, 96. [Google Scholar] [CrossRef]
  16. Li, W.; Wang, Z.; Qiao, L.; Liu, J.; Yang, J. The effects of hydro-mechanical coupling on hydraulic properties of fractured rock mass in unidirectional and radial flow configurations. Geomech. Geophys. Geo-Energy Geo-Resour. 2021, 7, 87. [Google Scholar] [CrossRef]
  17. Moore, D.E.; Lockner, D.A.; Byerlee, J.D. Reduction of permeability in granite at elevated temperatures. Science 1994, 265, 1558–1561. [Google Scholar] [CrossRef] [Green Version]
  18. Bodvarsson, G. On the temperature of water flowing through fractures. J. Geophys. Res. 1969, 74, 1987–1992. [Google Scholar] [CrossRef]
  19. Fan, Z.; Parashar, R. Analytical solutions for a wellbore subjected to a non-isothermal fluid flux: Implications for optimizing injection rates, fracture reactivation, and EGS hydraulic stimulation. Rock Mech. Rock Eng. 2019, 52, 4715–4729. [Google Scholar] [CrossRef]
  20. Fan, Z.; Parashar, R.; Jin, Z.-H. Impact of convective cooling on pore pressure and stresses around a borehole subjected to a constant flux: Implications for hydraulic tests in an enhanced geothermal system reservoir. Interpretation 2020, 8, SG13–SG20. [Google Scholar] [CrossRef]
  21. Ghassemi, A. A review of some rock mechanics issues in geothermal reservoir development. Geotech. Geol. Eng. 2012, 30, 647–664. [Google Scholar] [CrossRef]
  22. Zeng, Y.-C.; Wu, N.-Y.; Su, Z.; Wang, X.-X.; Hu, J. Numerical simulation of heat production potential from hot dry rock by water circulating through a novel single vertical fracture at Desert Peak geothermal field. Energy 2013, 63, 268–282. [Google Scholar] [CrossRef]
  23. Hadgu, T.; Kalinina, E.; Lowry, T.S. Modeling of heat extraction from variably fractured porous media in Enhanced Geothermal Systems. Geothermics 2016, 61, 75–85. [Google Scholar] [CrossRef] [Green Version]
  24. Fu, P.; Hao, Y.; Walsh, S.D.; Carrigan, C.R. Thermal drawdown-induced flow channeling in fractured geothermal reservoirs. Rock Mech. Rock Eng. 2016, 49, 1001–1024. [Google Scholar] [CrossRef]
  25. Sanyal, S.K.; Butler, S.J.; Swenson, D.; Hardeman, B. Review of the state-of-the-art of numerical simulation of enhanced geothermal systems. In Proceedings of the World Geothermal Congress 2000, Tohoku, Kyushu, Japan, 28 May–10 June 2000; pp. 181–186. [Google Scholar]
  26. White, M.; Fu, P.; McClure, M.; Danko, G.; Elsworth, D.; Sonnenthal, E.; Kelkar, S.; Podgorney, R. A suite of benchmark and challenge problems for enhanced geothermal systems. Geomech. Geophys. Geo-Energy Geo-Resour. 2018, 4, 79–117. [Google Scholar] [CrossRef]
  27. Shao, S.; Ranjith, P.G.; Wasantha, P.L.P.; Chen, B.K. Experimental and numerical studies on the mechanical behaviour of Australian Strathbogie granite at high temperatures: An application to geothermal energy. Geothermics 2015, 54, 96–108. [Google Scholar] [CrossRef]
  28. Wanniarachchi, W.; Ranjith, P.; Perera, M.; Rathnaweera, T.; Zhang, C.; Zhang, D. An integrated approach to simulate fracture permeability and flow characteristics using regenerated rock fracture from 3-D scanning: A numerical study. J. Nat. Gas Sci. Eng. 2018, 53, 249–262. [Google Scholar] [CrossRef]
  29. Zhang, Y.; Wu, Y.; Teng, Y.; Li, P.; Peng, S. Experiment study on the evolution of permeability and heat recovery efficiency in fractured granite with proppants. Geomech. Geophys. Geo-Energy Geo-Resour. 2022, 8, 3. [Google Scholar] [CrossRef]
  30. COMSOL Multiphysics, v. 5.2.; COMSOL AB: Stockholm, Sweden, 2015.
  31. Phillips, G.; Clemens, J. Strathbogie batholith: Field-based subdivision of a large granitic intrusion in central Victoria, Australia. Appl. Earth Sci. 2013, 122, 36–55. [Google Scholar] [CrossRef]
  32. Kumari, W.G.P.; Ranjith, P.G.; Perera, M.S.A.; Chen, B.K.; Abdulagatov, I.M. Temperature-dependent mechanical behaviour of Australian Strathbogie granite with different cooling treatments. Eng. Geol. 2017, 229, 31–44. [Google Scholar] [CrossRef]
  33. Kumari, W.; Ranjith, P.; Perera, M.; Shao, S.; Chen, B.; Lashin, A.; Al Arifi, N.; Rathnaweera, T. Mechanical behaviour of Australian Strathbogie granite under in-situ stress and temperature conditions: An application to geothermal energy extraction. Geothermics 2017, 65, 44–59. [Google Scholar] [CrossRef]
  34. Darcy, H. Les Fontaines Publiques de la Ville de Dijon: Exposition et Application. 1856. Available online: https://gallica.bnf.fr/ark:/12148/bpt6k624312.r=Les%20fontaines%20publiques%20de%20la%20ville%20de%20Dijon%20Exposition%20et%20application?rk=21459;2 (accessed on 7 June 2022).
  35. Witherspoon, P.A.; Wang, J.S.; Iwai, K.; Gale, J.E. Validity of cubic law for fluid flow in a deformable rock fracture. Water Resour. Res. 1980, 16, 1016–1024. [Google Scholar] [CrossRef] [Green Version]
  36. Rutqvist, J.; Wu, Y.-S.; Tsang, C.-F.; Bodvarsson, G. A modeling approach for analysis of coupled multiphase fluid flow, heat transfer, and deformation in fractured porous rock. Int. J. Rock Mech. Min. Sci. 2002, 39, 429–442. [Google Scholar] [CrossRef]
  37. Summers, R.; Winkler, K.; Byerlee, J. Permeability changes during the flow of water through Westerly Granite at temperatures of 100–400 C. J. Geophys. Res. Solid Earth 1978, 83, 339–344. [Google Scholar] [CrossRef]
  38. Lemmon, E.W.; Huber, M.L.; McLinden, M.O. NIST reference fluid thermodynamic and transport properties–REFPROP. NIST Stand. Ref. Database 2002, 23, v7. [Google Scholar]
  39. O’Sullivan, M.J.; Pruess, K.; Lippmann, M.J. State of the art of geothermal reservoir simulation. Geothermics 2001, 30, 395–429. [Google Scholar] [CrossRef]
  40. Judy, J.; Maynes, D.; Webb, B. Characterization of frictional pressure drop for liquid flows through microchannels. Int. J. Heat Mass Transf. 2002, 45, 3477–3489. [Google Scholar] [CrossRef]
  41. Homand-Etienne, F.; Houpert, R. Thermally induced microcracking in granites: Characterization and analysis. Int. J. Rock Mech. Min. Sci. Geomech. Abstr. 1989, 26, 125–134. [Google Scholar] [CrossRef]
  42. Johnson, B.; Gangi, A.; Handin, J. Thermal cracking of rock subjected to slow, uniform temperature changes. In Proceedings of the 19th US Symposium on Rock Mechanics (USRMS), Reno, NV, USA, 1–3 May 1978. [Google Scholar]
Figure 1. Profiled 3D image with the fracture surface from high-resolution CT scanning (sample height 45 mm and diameter 22.5 mm). (a) Closer view of the sample. (b) Re-generated 3D image with high- and low-density regions. (c) Fracture profile with low density regions of the sample.
Sustainability 14 08587 g001
Figure 2. High-pressure, high-temperature triaxial setup (modified after Kumari et al. [33]). (a) Laboratory overview of the high-pressure high-temperature triaxial setup. (b) Closer view of the inside of the cell.
Sustainability 14 08587 g002
Figure 3. Model geometry and boundary conditions. (a) Boundary conditions for solid mechanics module. (b) Boundary conditions for Darcy low module. (c) Boundary conditions for heat transfer in porous media module.
Sustainability 14 08587 g003
Figure 4. Measured steady-state outlet mass flow rates at each temperature and injection pressure.
Sustainability 14 08587 g004
Figure 5. Pressure gradient vs. steady-state volumetric flow rate.
Sustainability 14 08587 g005
Figure 6. Fracture permeability vs. temperature in liquid region and gas region.
Sustainability 14 08587 g006
Figure 7. Thermally induced fractures of granite samples observed from Scanning Electron Microscopy (SEM).
Sustainability 14 08587 g007
Figure 8. Comparison of permeability values obtained from high-temperature experiments (solid points) and COMSOL model (hollow points) for different confining pressures.
Sustainability 14 08587 g008
Figure 9. Temperature distribution (in °C) and corresponding pressure distribution (in MPa) in the cross-sections of the sample under 300 °C temperatures due to the injection of cold water. (a) Temperature distribution (in °C) after 6 min. (b) Pressure distribution (in MPa) after 6 min. (c) Temperature distribution (in °C) after 1 week. (d) Pressure distribution (in MPa) after 1 week.
Sustainability 14 08587 g009
Figure 10. (a) Permeability. (b) Steady-state flow rate prediction for extreme confining pressure conditions under different temperatures.
Sustainability 14 08587 g010
Figure 11. Temperature distribution (in °C) in the cross-sections of the sample under 300 °C rock temperatures due to the injection of water under different temperatures after 1 month of injection.
Sustainability 14 08587 g011
Figure 12. (a) Average strain (ε3—axial strain ε1, ε2—lateral strains and εv—volumetric strain) in the granite specimen for different temperatures applied on the sample (effective stress 90 MPa). (b) Average volumetric strain (εv) in the granite specimen vs. effective stress for different confining stresses applied on the sample.
Sustainability 14 08587 g012
Table 1. Minerology of selected granite.
Mineral% Mass
Alpha quartz52
K-feldspar23
Sodic and intermediate plagioclase16
Biotite—phlogopite4
Clinochlore1
Muscovite—sericite1
Dolomite—ankerite1
Talc, gypsum and clay minerals2
Table 2. The input parameters for the model.
Model ParameterValue
Geometry
Sample diameter (D)22.5 mm
Sample height (H)45 mm
FractureParametric sweep with the corresponding coordinates obtained from CT images
Material properties of granite
Density (ρ)2750 kg/m3
Young’s modulus (E)E(T) = E273(2 × 10⁻¹⁶ T6 − 9 × 10⁻¹³ T5 + 1 × 10⁻⁹ T4 − 1 × 10⁻⁶ T3 + 5 × 10⁻⁴ T2 − 0.1137 T + 11.189) GPa for 293 K–1073 K where E273 = 17.13 GPa
Poisson’s ratio (ν)ν(T) = ν273(−4 × 10⁻¹⁶ T6 + 1 × 10⁻¹² T5 − 2 × 10⁻⁹ T4 + 2 × 10⁻⁶ T3 − 6 × 10⁻⁴ T2 + 0.1305 T − 9.8608) for 293 K–1073 K where ν273 = 0.24
Porosity0.01
Matrix permeability5 × 10−20 m2
Thermal conductivity (K)20 W/(m⋅K)
Heat capacity at constant pressure (Cp)300 J/(kg⋅K)
Coefficient of thermal expansion (α)5 × 10⁻⁶ K−1
Material properties of water
Density (ρw)838.466 + 1.401 T − 0.003 T2 + 3.718 × 10⁻⁷ T3 kg/m3 for 273 K–583 K
Dynamic viscosity (μw)1.380 − 0.021 T + 1.360 × 10⁻⁴ T2 − 4.645 × 10⁻⁷ T3 + 8.904 × 10⁻¹⁰ T4 − 9.079 × 10¹³ T5 + 3.846 × 10⁻¹⁶ T6 Pas for 273 K–413 K
0.004 − 2.10746715 × 10⁻⁵ T + 3.85772275 × 10⁻⁸ T2 − 2.39730284 × 10⁻¹¹ T3 Pas for 413 K–583 K
Heat capacity at constant pressure (Cp)12010.15 − 80.407 T + 0.3108 T2 − 5.382 × 10⁴ T3 + 3.625 × 10⁻⁷ T4 J/kgK for 413 K–583 K
Thermal conductivity (K)−0.869 + 0.0089 T − 1.584 × 10⁻⁵ T2 + 7.9754 × 10⁻⁹ T3 W/mK for 413 K–583 K
Compressibility4.5 × 10−11 1/Pa
Boundary conditions (parametric sweep)
Confining pressure (Pc)10–150 MPa
Vertical stress (PA)PA = Pc
Injection pressure (Pi)5–140 MPa
Outlet pressure (Po)0.1 MPa
Rock temperature (TR)20–350 °C
Fluid temperature (Ti)20–350 °C
Calibration parameters
Fracture permeability under the reference stress (1 MPa) (k0f)4 × 10⁻¹⁴ m2
Constant for the non-linear stiffness of the fracture (ϑ)0.015
Fracture aperture4 × 10−11 T2 − 3.1 × 10⁻⁸ T + 7.8 × 10⁻⁶ for 273 K–413 K
Publisher’s Note: MDPI stays neutral with regard to jurisdictional claims in published maps and institutional affiliations.

