Article

Determination of Fractured Water-Conducting Zone Height Based on Microseismic Monitoring: A Case Study in Weiqiang Coalmine, Shaanxi, China

1
Faculty of Electronic and Information Engineering, Xi’an Jiaotong University, Xi’an 710049, China
2
Shaanxi Yanchang Petroleum Sale Electric Co., Ltd., Xi’an 710065, China
3
State Key Laboratory of Coastal and Offshore Engineering, Dalian University of Technology, Dalian 116024, China
4
State Key Laboratory of Coal Resources and Safe Mining, China University of Mining and Technology, Xuzhou 221116, China
*
Author to whom correspondence should be addressed.
Sustainability 2022, 14(14), 8385; https://doi.org/10.3390/su14148385
Submission received: 7 June 2022 / Revised: 6 July 2022 / Accepted: 6 July 2022 / Published: 8 July 2022

Abstract

:
The NO. 3 coal seam of the Weiqiang coalmine is faced with a water inrush threat caused by two large reservoirs and the upper confined aquifer. However, existing empirical formulas cannot accurately predict the height of the fractured water-conducting zone; thus, it is necessary to investigate the extent of the fractured water-conducting zone according to the geological conditions of the No. 3 coal seam. The microseismic monitoring system (MMS) was used to monitor the surrounding area of the 1311 working face in real time to obtain the microseismic event information during the fracture development. The detailed situation of the fractured water-conducting zone in three-dimensional space was determined by computer analysis. The results show that the height of the fractured water-conducting zone is 110 m, which is consistent with the range (105.4~120.4 m) measured by various field drilling results and the mechanical mechanism analysis based on the key strata theory (112 m). The achievement of microseismic monitoring provides a guarantee for safety production and prevention and control of mine water disaster in the 1311 working face of the No. 3 coal seam, and can also be applied and promoted in coalmines with similar geological conditions, with significant social and economic benefits.

1. Introduction

Coal is an important energy resource in China, and the annual output is gradually approaching 4 billion tons. By 2030, coal may still account for about 50% of primary energy consumption. Such a huge amount of mining and consumption has put forward higher requirements for the safe mining of coal resources [1,2,3]. Mine water inrush accidents represent one of the five major disasters in mining production. Since the 1950s, they have caused huge economic losses of more than 1 billion yuan [4]. In mining engineering, the overlying strata will move and deform in a large range due to the mining effect. At the same time, internal defects and fissures of the rock mass continue to develop, forming an important channel for water from the aquifer to the working face, or the water-conducting zone. Water inrush sources and water inrush channels in mines are two major factors that cause water disasters. The water-conducting zone is the main cause of the water inrush channel [5], which makes it easy for mine water inrush accidents to occur. Therefore, exploring the development of the water-conducting zone is the basic strategy for water disaster prevention and control.
Many scholars have carried out research to confront this problem. On the one hand, the development of the water-conducting zone is closely related to the movement mechanism of the overlying strata above the goaf, and theoretical research in this area is abundant. The key stratum theory proposed by Qian [6,7] emphasizes the controlling effect of key strata on rock formations, which is still widely used and studied. Jiang et al. [8], Xu et al. [9,10], and Qin et al. [11] further discussed the movement law of overlying strata and the method of discriminating key strata. Huang et al. [12] and Hu et al. [13] explored various factors affecting the development height of water-conducting zones. Xu et al. [14] gave a method for predicting the development height by the position of the key strata. Cao et al. [15] and Wang et al. [16] explored the development characteristics of water-conducting fractured zones. Additionally, Zhang et al. [17] and Chen et al. [18] studied the methodologies (theoretical models, numerical simulations, and field measurements) for estimating pillar system loads and strengths. The above research results have laid a solid theoretical foundation for the prediction of the water-conducting zone. On the other hand, there are various methods for predicting the development of water-conducting zones. At present, empirical formulas, numerical simulations, similar physical experiments, microseismic monitoring, and field drilling detection methods are widely used, and most projects use several methods to jointly determine the development height, which can give more accurate and objective results. In engineering, the empirical formulas provided by “The regulations for coal pillar retention and pressed coal mining of buildings, water bodies, railways and main roadways” (hereafter referred to as three lowers) cannot be applied to coal seam mining under some special conditions, and often incur larger errors [13]. Miao et al. [19], Wang et al. [5], Hu et al. [13], and Li et al. [20] pointed out this phenomenon and put forward theoretical formulas suitable for different mining conditions. Du et al. [21], Chen et al. [22], and Lv [23] used RFPA, UDEC, and other software to carry out numerical simulations on the development of the water-conducting zone heights, which is consistent with the actual monitoring results. Therefore, numerical simulations and similar physical experiments are often used to predict the laws of overburden caving zones and to predict development heights. In addition, in view of the water inrush problem faced by coal seams, the risk analysis of aquifers was carried out according to the on-site geological conditions, and it was pointed out that aquifers have an important impact on coal seam mining [24,25,26,27]. Recently, due to the development of new technologies such as computer technology and communication technology, microseismic monitoring has been gradually applied in mining engineering. A large number of researchers have combined microseismic monitoring technology with deep learning, numerical simulation, and other technologies, and applied them in coal mining projects in many places around the world [28,29,30,31,32,33,34,35,36,37]. D’Angiò et al. [28] proposed the Damping Ratio Anomalies Monitoring (DaRtAM) to detect the rock mass damaging. Ma et al. [29] combined microseismic monitoring and numerical simulation (RFPA) to analyze the water inrush problem of the Dongjiahe coal seam. Srinivasan et al. [30], Simser et al. [31], Occhiena et al. [32], Hassani et al. [33], and Mngadi et al. [34] have applied microseismic monitoring technology to mining sites around the world and guided the safe mining of coal resources. Many scholars have applied microseismic monitoring technology in the fracture monitoring of mine strata, the distribution of mining stress fields, and the movement law of overlying strata in the stope [38,39,40,41,42,43,44], which has deepened the cognition of the mining law of the overlying strata. Wang et al. [45], Jiang et al. [46], Liu et al. [47], and Han et al. [48] used microseismic monitoring technology to conduct field measurements and research on the development height of water-conducting zones and the height of fracture damage, and monitoring results show that microseismic monitoring has the advantages of rapid diagnosis, real-time monitoring, and early warning. On-site drilling detection is often limited by funds, manpower, time, and scale, and thus cannot show the characteristics of dynamic development of water-conducting fractured zones. However, as monitoring results are the most credible, on-site drilling detection is often used for the verification of other research methods.
In summary, although the current detection methods are diverse, they each have certain limitations. There are still many limitations in empirical and theoretical formulas, which are difficult to popularize and apply. Numerical simulations and physical experiments are generally only used as auxiliary research methods for conducting height prediction because the parameter settings are too ideal, the artificial parameter adjustment lacks objectivity, and it is difficult to consider the complex construction and geological conditions of the field. As a new technology, microseismic monitoring still needs to be further promoted and applied. On-site drilling detection cannot be carried out on a large scale due to the high cost. Therefore, in practical engineering, the strategy of “complementary advantages and multiple measures” is often adopted to improve the accuracy of the predicted value.
There are two large reservoirs near the No. 3 coal seam in the Weiqiang coalmine, which is facing the threat of water inrush from the roof confined aquifer. Once the water-conducting zone breaks through the aquifer during the mining process, it will cause serious economic losses. In addition, the empirical formula cannot accurately give the height of the water-conducting zone, and the height of the water-conducting fracture zone must be accurately determined according to the existing mining conditions of the No. 3 coal seam. In response to the above problems, microseismic monitoring equipment was installed in the 1311 working face of the No. 3 coal seam. After capturing the microseismic signal, the inversion analysis was obtained, and the monitoring results were verified by on-site drilling and mechanical mechanism analysis. The research results of this article will guide the rock formation control and water hazard prevention in the subsequent mining of the working face, ensure the safe and efficient mining of the mine, and can also be promoted in the surrounding mines, with significant economic and social benefits.

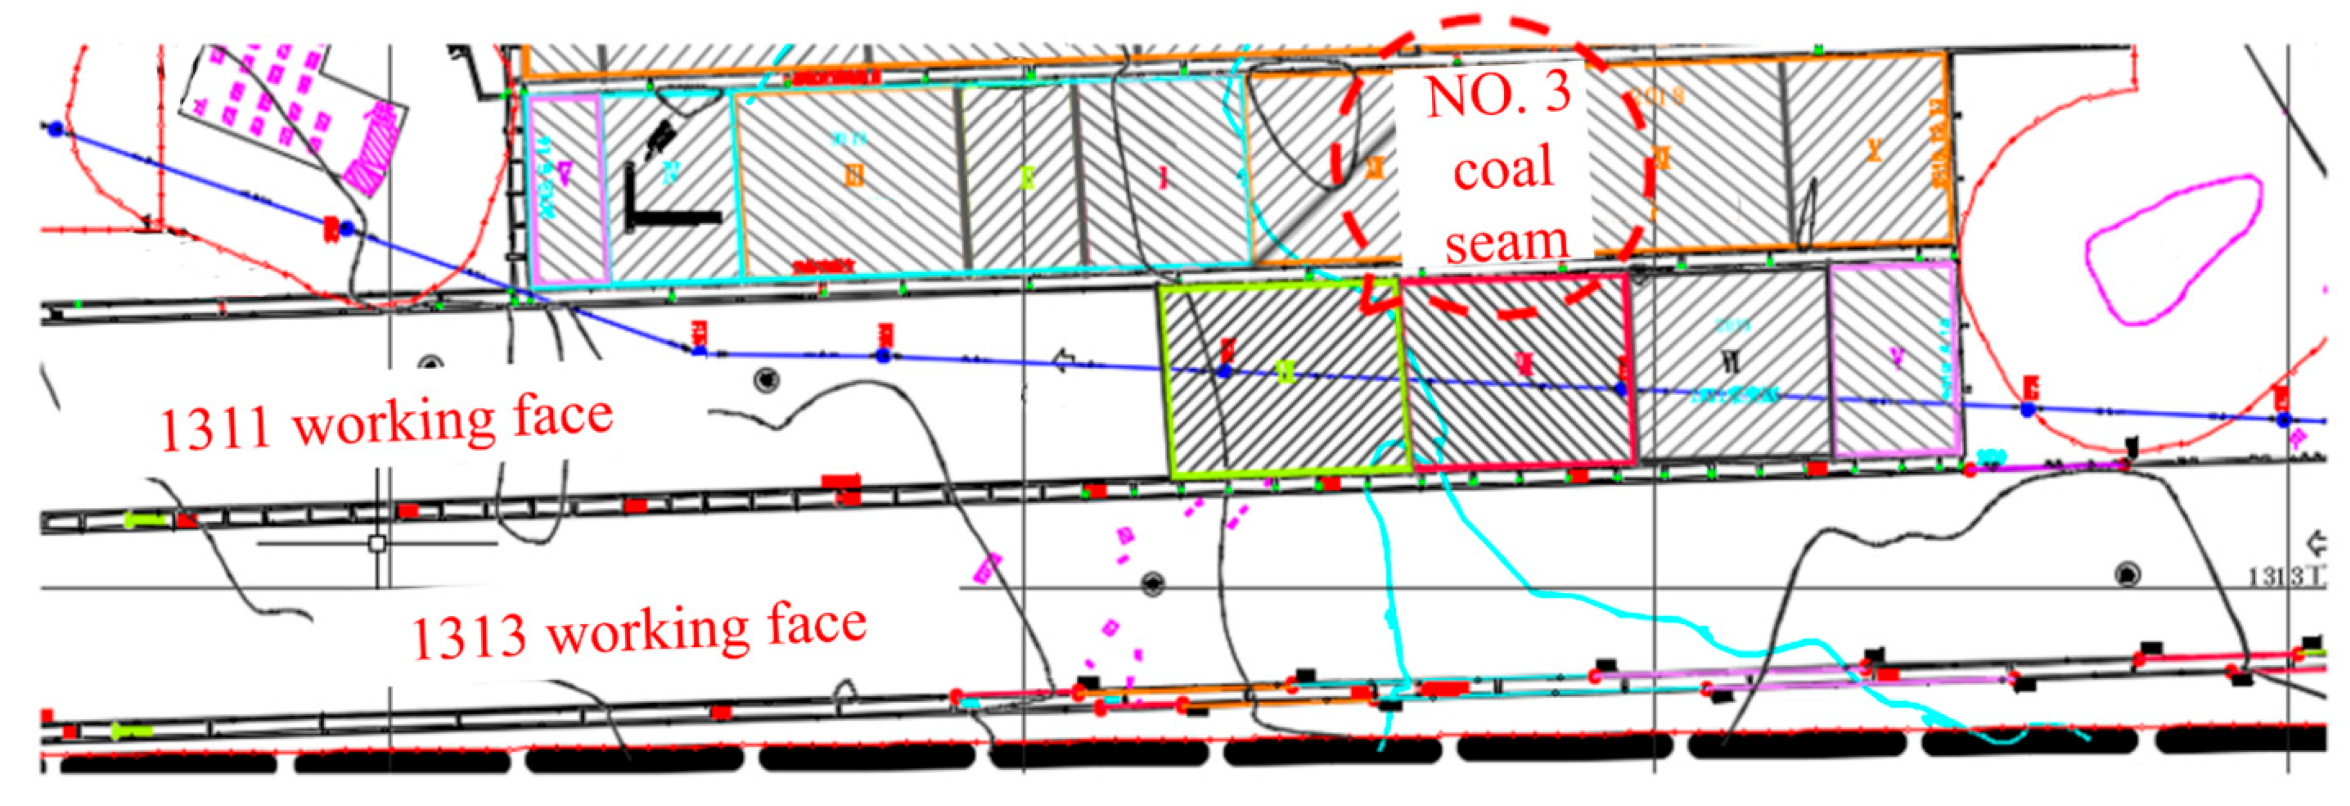
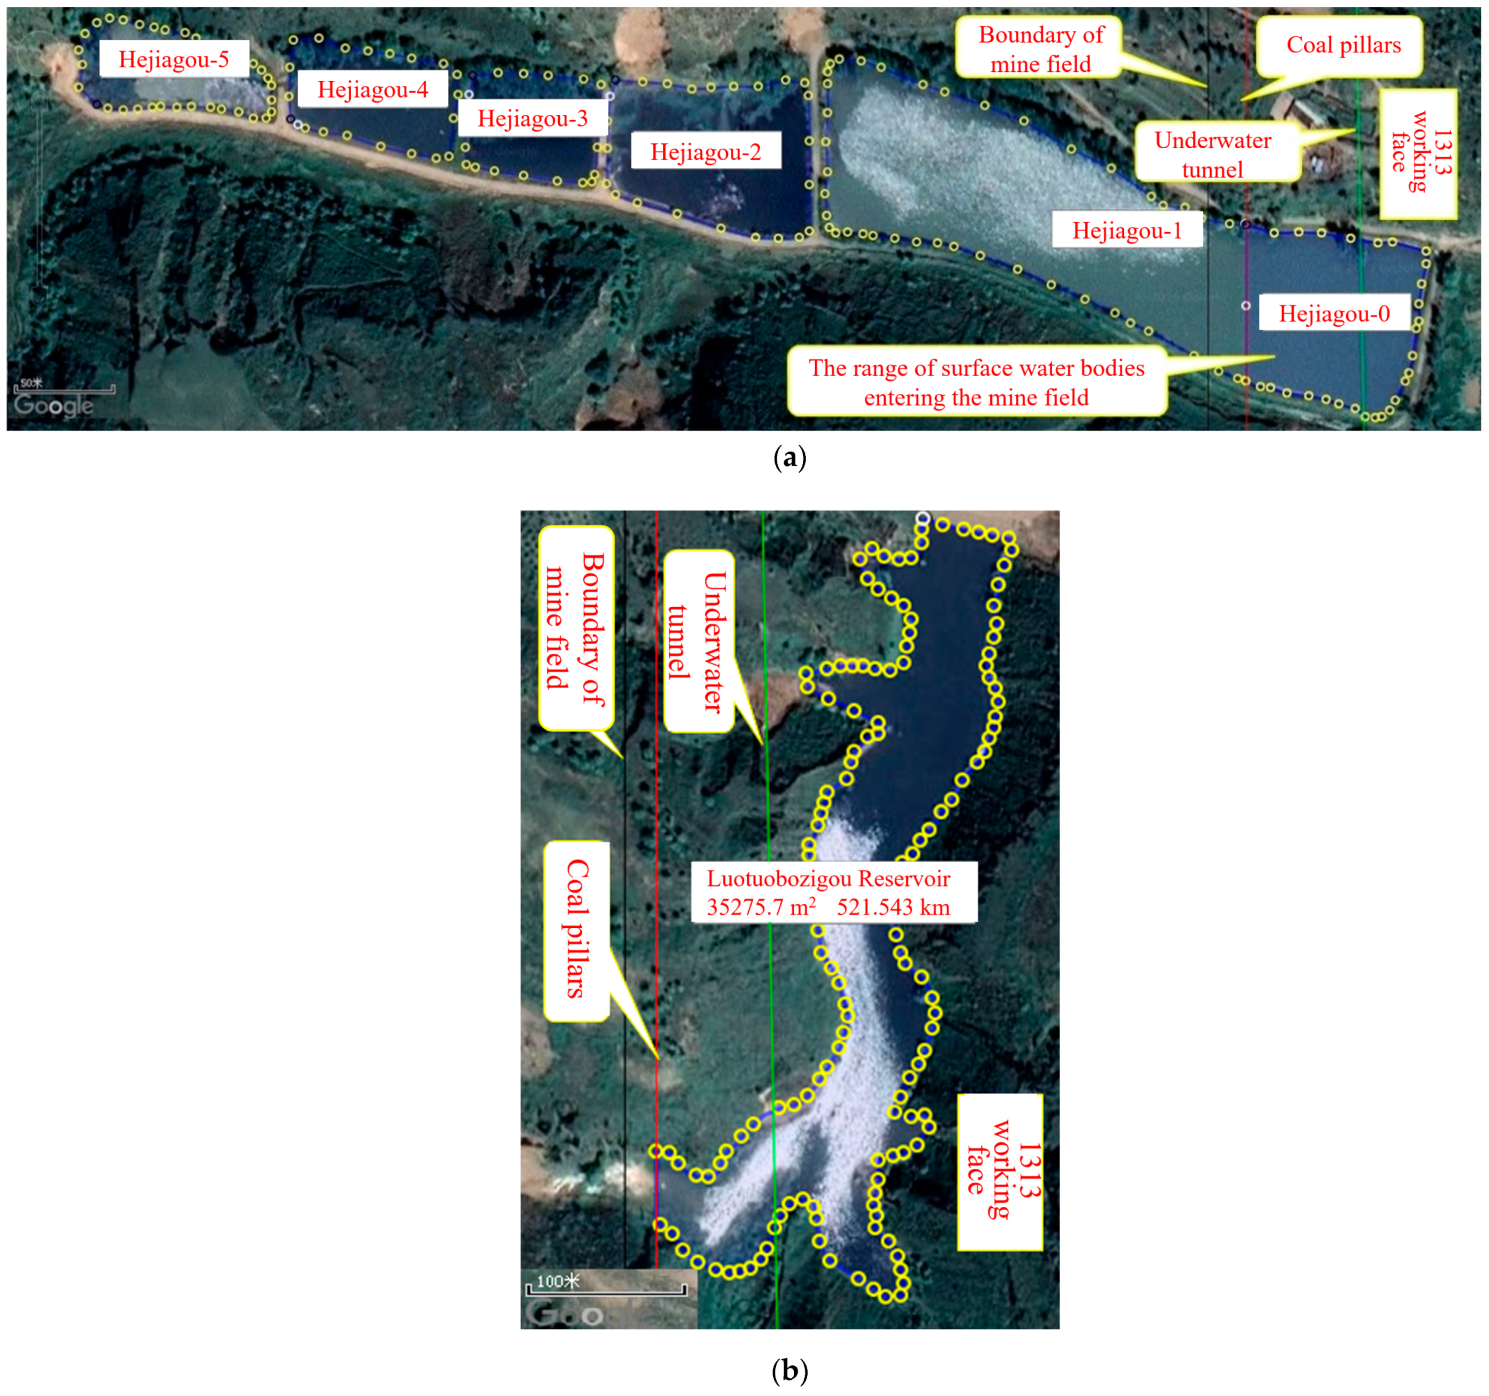
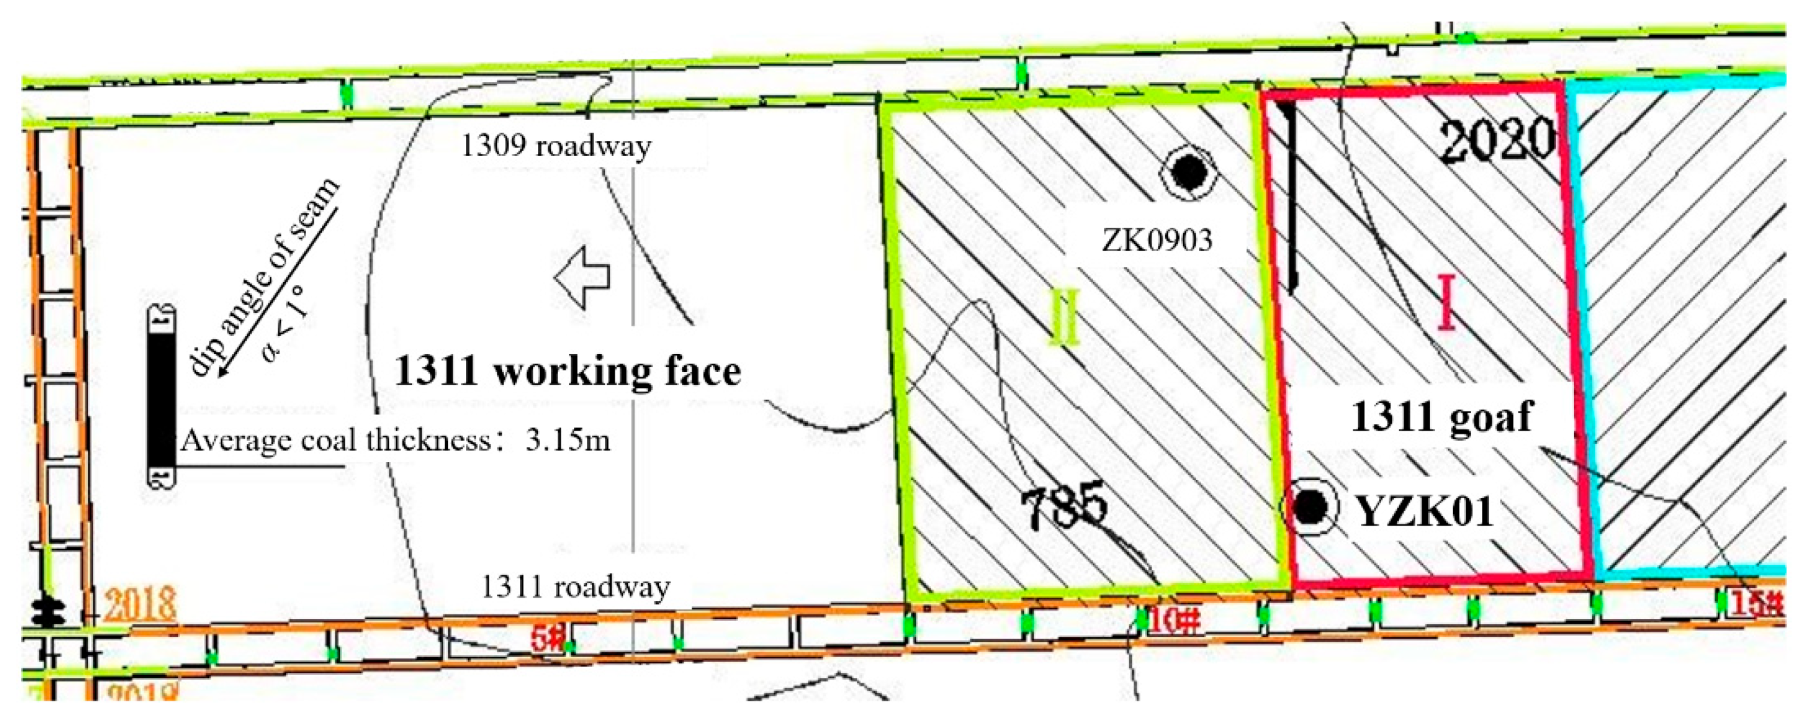
2. Weiqiang Coalmine Overview

The Weiqiang mining field is located in the northwest of the Yuheng mining area of the Jurassic coalfield in northern Shaanxi (Figure 1). The No. 3 coal seam is the mineable coal seam in the whole area of the mine field, among which the coal seam of the 1311 working face is stable and simple in structure. The thickness of the coal seam is between 2.85 and 3.48 m, the average coal thickness is 3.15 m, the actual mining height is 3.32 m, and the dip angle of the coal seam is less than 1°. The longwall fully mechanized mining method is adopted, and the roof is managed by all caving methods. The overlying strata of the No. 3 coal seam are mainly medium-thick-layered siltstone and thick-layered medium-grained feldspar sandstone, with a thickness of 10.2–26.93 m, including the sandstone aquifer at the bottom of the fourth member of the Yan’an Formation. The floor of the coal seam is mainly light gray medium-thick-layered siltstone, 3.82–10.86 m thick, with well-developed horizontal wave bedding.
In the panel area where the mining area is located, there are many ground structures such as water systems, reservoirs, cultural relics, etc. In particular, there are two reservoirs in Dachuangou in the east of the coalmine, namely Hejia Village and Luotuobozigou Reservoir (Figure 2), and the total storage capacity is about 2.37 million m3. According to the previous geological data, when the No. 3 coal seam is mined, the water disaster will mainly affect the confined aquifer of the sandstone fissures on the roof of the coal seam. At this time, the mining of large-area near-horizontal coal seams will inevitably cause large-scale movement of overlying rocks. Once the water-conducting zone develops to the water-resisting layer, it will have a high probability of water inrush disaster. Therefore, the determination of the development height of the water-conducting zone in the overlying rock on the 1311 working face plays an important role in evaluating the safe mining of the No. 3 coal seam.

3. Microseismic Monitoring

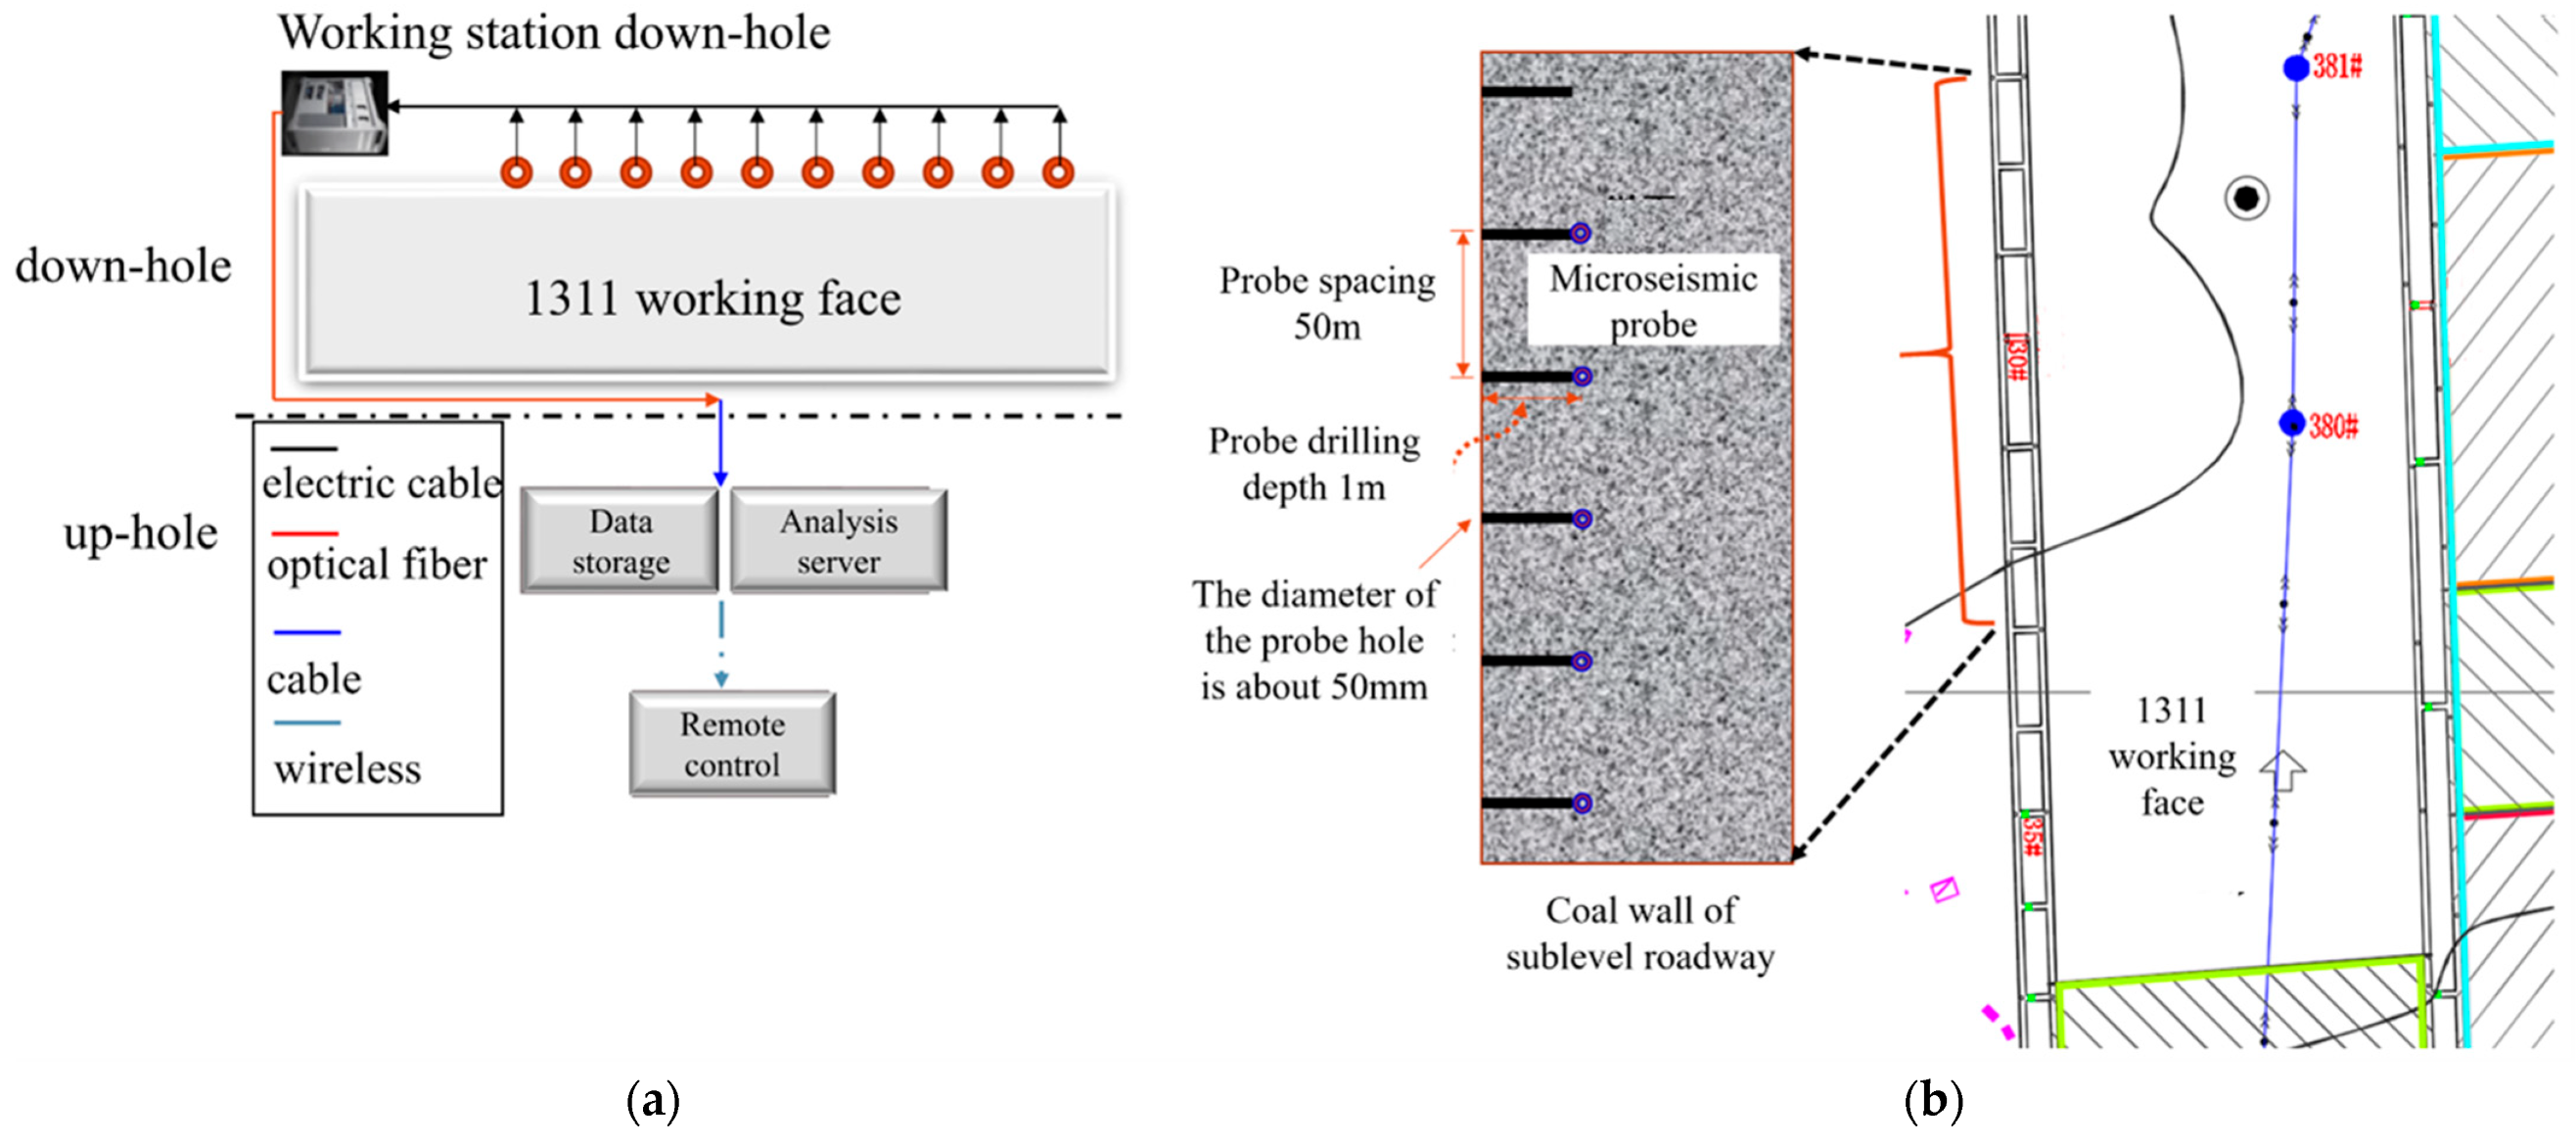
3.1. Principle and Composition of MMS (Mining Microseismic Monitoring)

Under the action of mine pressure, the rock formations in the mining area show different degrees of deformation, cracking, and breaking. This macroscopic damage is actually the result of the gradual evolution of many internal defects and micro-fractures. During the mining process, the local strain energy in the surrounding rock is concentrated, resulting in the compaction of the old micro-cracks in the coal-rock body and the initiation of new micro-cracks. The microseismic event is that the above-mentioned surrounding rock continuously radiates energy outward during the process of microcrack generation and dislocation. Microseismic monitoring technology can collect real-time information of micro-earthquakes in the rock formation by reasonably arranging sensor arrays in the mining area, determining the location of micro-crack ruptures, and using related software to visualize micro-seismic events.
The MMS used on-site is an ESG MMS equipped with three-dimensional visualization software (MMS-View). The system is completed by the Canadian ESG Company, and is used to monitor the microseismic events of weak seismic waves in the process of deformation and rupture of rock mass. The ESG system consists of two parts: software and hardware. The software system consists of Paladin standard version monitoring system, HNAS software (real-time signal acquisition and recording), SeisVis software (3D visualization of events), and WaveVis software (waveform processing and event relocation). The hardware system consists of a 42-channel accelerometer, Paladin sensor interface box, Paladin seismic recorder, Paladin master control time server, software operation monitoring card WatchDog, and other facilities.
Based on computer technology, communication technology, GPS real-time precise positioning technology, and visualization software, MMS can determine the time, location, and magnitude of rock mass microseismic events in real time in the three-dimensional space of the stope rock mass, and then determine the range of rock mass deformation and give a safety assessment. At present, MMS has been effectively used in the stability analysis and monitoring and early warning of slopes, tunnels, mines, dams, and other projects.

3.2. Location Algorithms and Moment Magnitude

The damage of rock mass can be analyzed through microseismic monitoring. First of all, it is necessary to invert and locate the position of the microfracture accurately, and then obtain the parameters such as the moment magnitude of the microseismic event, so that the source parameters reflecting the stability of the rock mass can be calculated and the mechanism of rock formation can be explored. The positioning accuracy of the microseismic monitoring system is 10 m, which can meet the needs of the project. It should be noted that during the microseismic monitoring process, the system will collect various vibration signals, including environmental noise (blasting, car whistle, drilling, impact). The basic principle of signal noise reduction is to determine the type of noise according to the signal characteristics (frequency–amplitude curve) of different noises, so as to identify and determine the microseismic signal of rock mass rupture. For example, the signal characteristic of blasting is large amplitude, small attenuation, and long duration; the signal characteristic of whistle is small amplitude, long duration, and multi-peak; the signal characteristic of drilling is periodic variation and small amplitude; and the signal of impact is characterized by fast decay and short duration. Based on this principle, waveform analysis of different signals can be performed to identify effective microseismic signals and improve monitoring accuracy.
The MMS uses the widely used Geiger positioning method to locate microseismic events through an iterative process. Given the initial space–time coordinates of the test point, θ x , y , z , t , the correction amount Δ θ x , y , z , t is generated based on the least squares method, and the two are added to obtain new coordinates. If the new coordinates satisfy Formula (1), it is the source parameter; otherwise, it needs to iterate until it is satisfied.
x i x 2 + y i y 2 + z i z 2 1 2 = v p t i t
where x , y , z is the spatial coordinate of the test point, t is the time when the microseismic event occurs, x i , y i , z i is the spatial coordinate of the ith sensor, t i is the time when the sensor i captures the elastic wave P wave, and v p is the P wave velocity. The initial values of the above-mentioned variables such as coordinates, time, and wave speed are all manually specified. The first-order Taylor expansion is performed near the time calculated from the spatial coordinates of the test point, and the arrival time of the P wave captured by sensor i is expressed as:
t o , i = t c , i + t i x Δ x + t i y Δ y + t i z Δ z + t i t Δ t
where t c , i is the time that the P wave obtained from the spatial coordinates of the test point is transmitted to the sensor i, and the other parameters are expressed as:
t i x = x i x v p R ;   t i y = y i y v p R ;   t i z = z i z v p R ;   t i t = 1 R = x i x 2 + y i y 2 + z i z 2 1 2
For a microseismic system with N sensors, N equations can be established, and the matrix expression form is:
A Δ θ = B
where
A = t 1 x t 1 y t 1 z 1 t 2 x t 2 y t 2 z 1 t n x t n y t n z 1 , Δ θ = Δ x Δ y Δ z Δ t , B = t o , 1 t c , 1 t o , 2 t c , 2 t o , n t c , n
Solve Equation (3) with the Gaussian elimination method to obtain the corresponding correction:
A T A Δ θ = A T B
Δ θ = A T A 1 A T B
After the correction amount is obtained by Formulas (4) and (5), θ + Δ θ is used as a new test point to continue iterating until the given error requirement is met.
After the microseismic event is located, the source parameter calculation is carried out. The moment magnitude MW can be calculated from the seismic moment M0, which is used to measure the magnitude level. The seismic moment M0 is determined by the low-frequency limit Ω0 of the far-field displacement spectrum of the seismic wave:
M 0 = 4 π ρ 0 c 0 3 R Ω 0 F c R c S C
where ρ0 is the density of the source medium, c0 is the seismic wave velocity, R is the distance between the source position and the measuring point, Fc is the seismic wave radiation coefficient, Rc is the seismic wave free surface amplification coefficient, and Sc is the seismic wave field correction coefficient. In this case, the source cannot be accurately determined, so it is assumed that the radiation coefficients of P-wave and S-wave are both 0.52, and considering that the sensors are often arranged in the borehole, Rc and Sc are taken as 1, then:
M 0 = 4 π ρ 0 c 0 3 R Ω F c
The relationship between the moment magnitude MW and the seismic moment M0 is:
M W = 2 3 log M 0 6.033
According to the source parameters, the activity law of the overlying strata can be analyzed, and the development of the fractured water-conducting zone (fractured zone and caving zone) can be judged by combining the distribution characteristics of the “three-zones” (bending zone, fractured zone, and caving zone).

3.3. On-Site Monitoring System Layout

The monitoring position is selected near the 1311 working face of the No. 3 coal seam in the Weiqiang coalfield, and the data processing equipment and monitoring equipment of the MMS system are arranged up-hole and down-hole, respectively (Figure 3). Real-time monitoring, positioning, and analysis against the coal and rock mass micro-fractures are carried out in the mining-affected area of the working face, and the development height of the water-conducting zone is analyzed in combination with the deformation and stress characteristics of the “three zones”.
As shown in Figure 3, in order to achieve advanced monitoring, a microseismic monitoring system with a range of 400 m was arranged at the transport roadway (at a distance of 560 m from the 1311 working face), and the monitoring duration was 4 months. The site is equipped with six high-precision sensors, and the hole is located at the reserved coal pillar on the left side of the 1311 auxiliary transportation roadway, about 1.5 m away from the bottom plate. In order to improve the quality of on-site monitoring signals and reduce external construction noise interference, each sensor is placed at a depth of 1 m in the hole, and the distance between each sensor is about 50 m. During the sensor installation process, first, the sensor is sent to the bottom of the borehole and firmly attached to the rock wall at the bottom; then, an appropriate amount of cement mortar is slowly injected into the borehole to make the mortar cover the sensor; finally, when the mud begins to solidify, the installation tool is slowly pulled out of the hole, and the hole is filled with cement to fix the sensor at the bottom of the hole. The latitude and longitude coordinates and elevation of each probe position are shown in Table 1.
On-site debugging of the monitoring system is carried out after the hardware equipment is installed: (1) for the initial positioning test, simply tap the anchored sensor and determine whether the difference between the event coordinates calculated by the microseismic event positioning and the actual sensor coordinates is within the error range; (2) set the P wave speed and frequency range to 5500–6500 and 2500–3000, respectively; (3) adjust the threshold to obtain high-quality microseismic events and reduce interference events, which can be dynamically adjusted by the proportion of staged microseismic events to the total events.

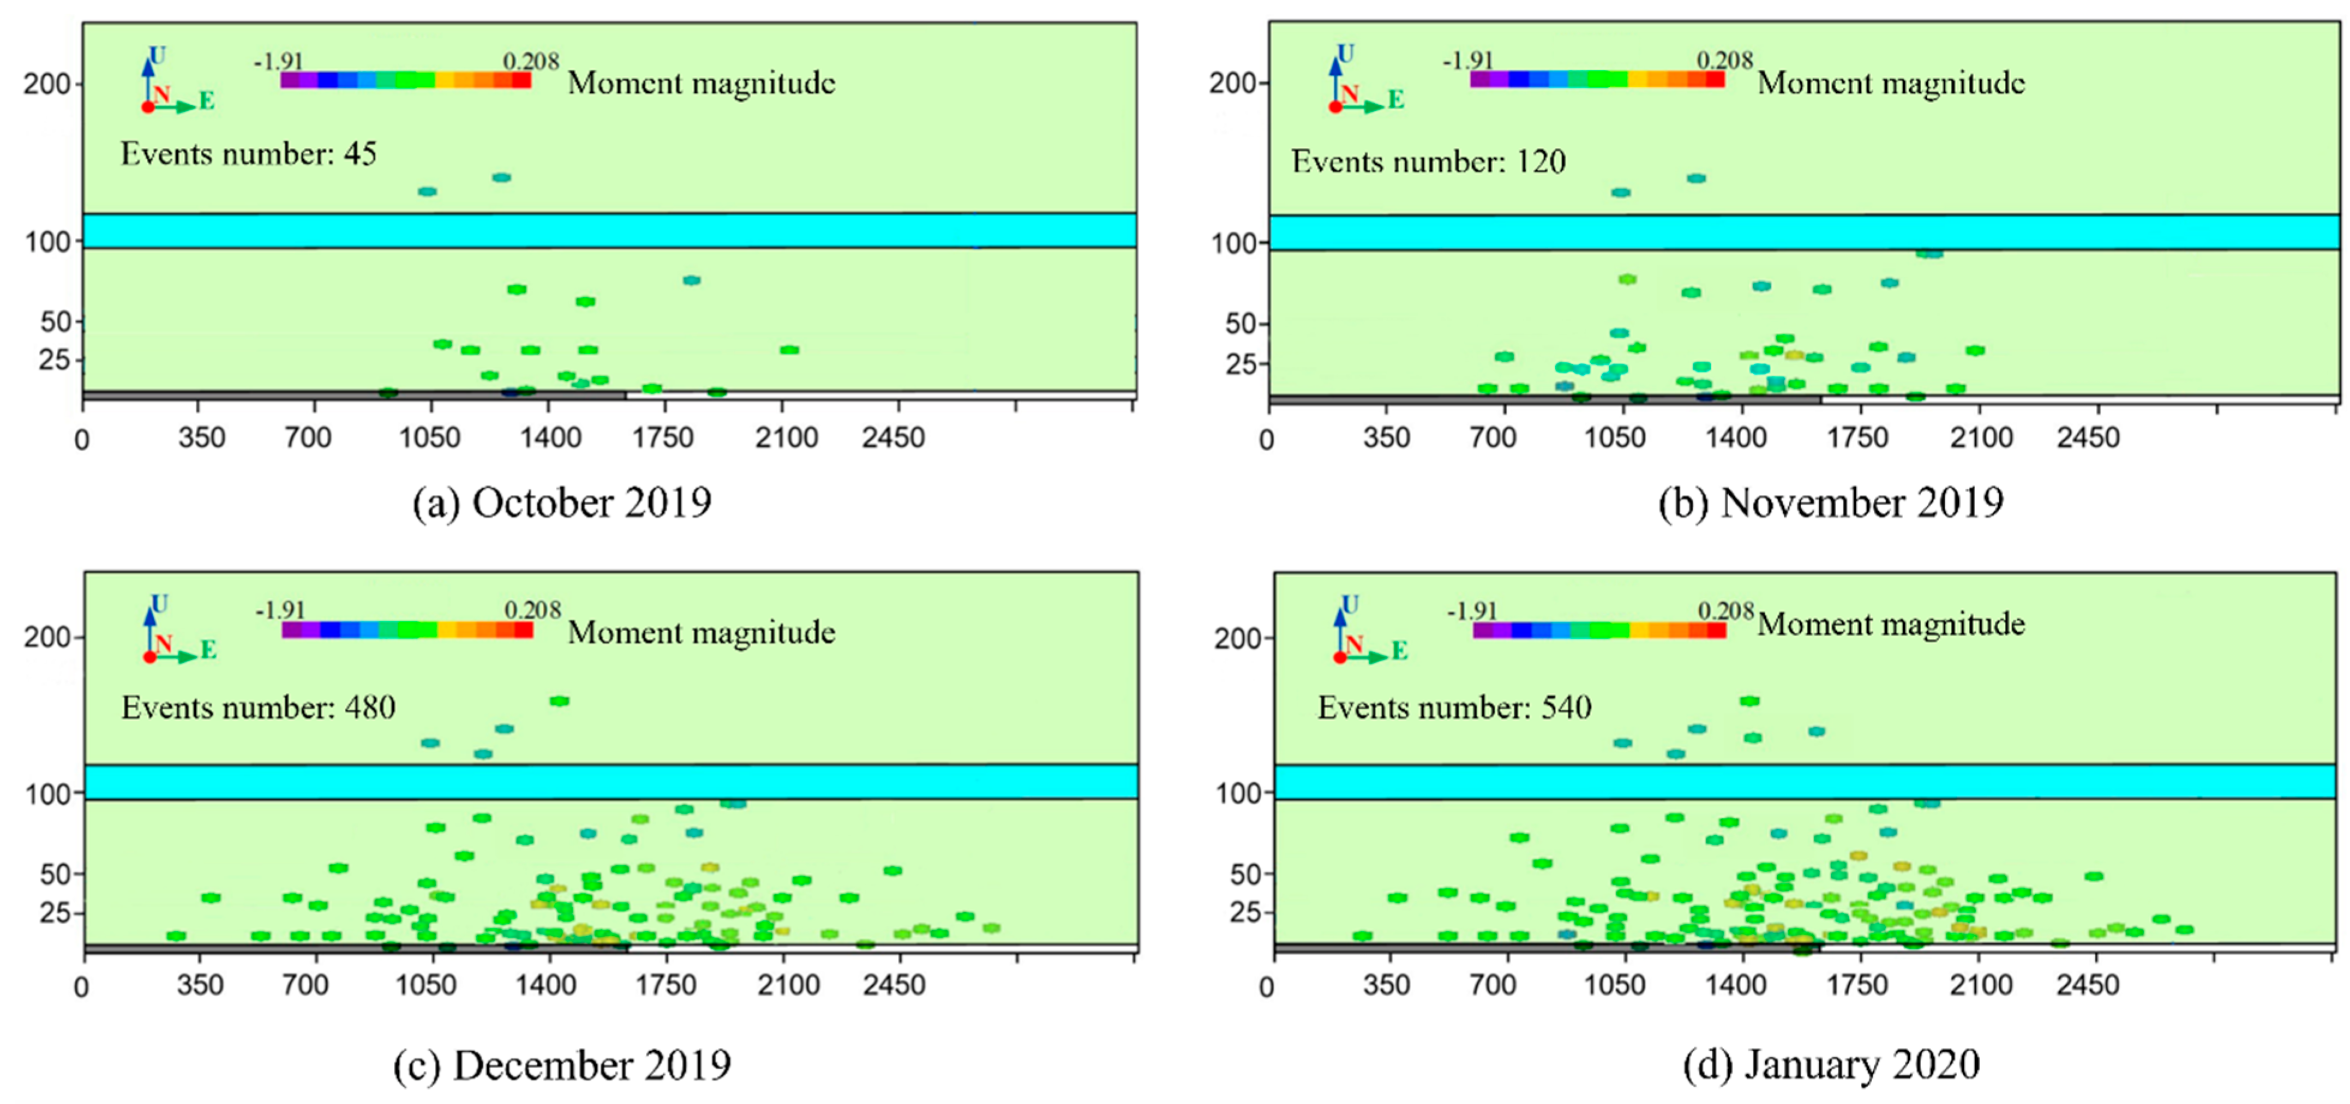
3.4. Analysis of Microseismic Monitoring Results

The microseismic activity characteristics from 24 October 2019 to 15 February 2020 were projected along the strike of the coal seam according to the periodic breaking time of the key strata. The distribution characteristics of microseismic activities in the roof and overlying strata during the fracture process of rock formations are analyzed, with emphasis on the aggregation characteristics of microseismic events along the strike.
Figure 4a,b shows the characteristics of microseismic activity before the low-level key strata are broken. Microseismic events are scattered in the immediate roof and low-level rock formations. After the initiation and gradual expansion of micro-cracks in the coal rock mass and low-level key strata, there is a tendency to form a microseismic event accumulation area in front of the coal wall.
As shown in Figure 4c, as the working face continues to advance, the microseismic events in front of the coal wall increase sharply and form a gathering area, where macroscopic fractures occur in the low-level key strata, and the working face suffers periodic pressure. At the same time, due to the slewing and sinking of the broken rock blocks above the working face, another microseismic event gathering area is formed in the rear goaf. The distribution density of microseismic events between the two gathering areas is relatively small, and the rock blocks above the working face still have good integrity after breaking. In addition, observed from the vertical direction, the accumulation area of the two microseismic events is linearly distributed, which is the fracture line of the stratum formed after the periodic compression of the low-level key strata, and most of the microseismic events initiated by the micro-seismic events of the mid-level key strata are also distributed in this range.
Figure 4d shows that the roof strata experienced a large area of caving and gyration subsidence after the low-level key strata were completely broken, and most of the newly added microseismic events in the strike direction were distributed between the broken key rock blocks, that is, between two clusters of microseismic events. At the same time, the microseismic events were further initiated and expanded in the mid-level key strata, and there was a tendency to form agglomeration areas on the extension line of the fracture line formed after the low-level key strata were broken.
It can be found that the microseismic events occur in pairs along the strike accumulation area during the fracture process of the median and low-level strata, and are located on the stratum breaking line and its extension line formed after the incoming pressure, that is, the two ends of the key stratum breaking. The broken key block and the weak rock formation above it will initiate and expand cracks during the process of gyration and subsidence, which induces microseismic events.
In summary, with the gradual progress of the 1311 working face, the micro-fractures in the overlying stratum continue to develop. From the analysis of the evolution results of microseismic activities and the development characteristics of the water-conducting zone in the “three zones”, it is known that the distribution of microseismic events within 25 m of the overlying stratum is relatively dense, and the fissures are relatively developed, which is regarded as the upper boundary of the caving zone. In addition, the density of microseismic events in the range above 110 m is significantly weakened, which is regarded as the upper boundary of the water-conducting zone of the overlying stratum.

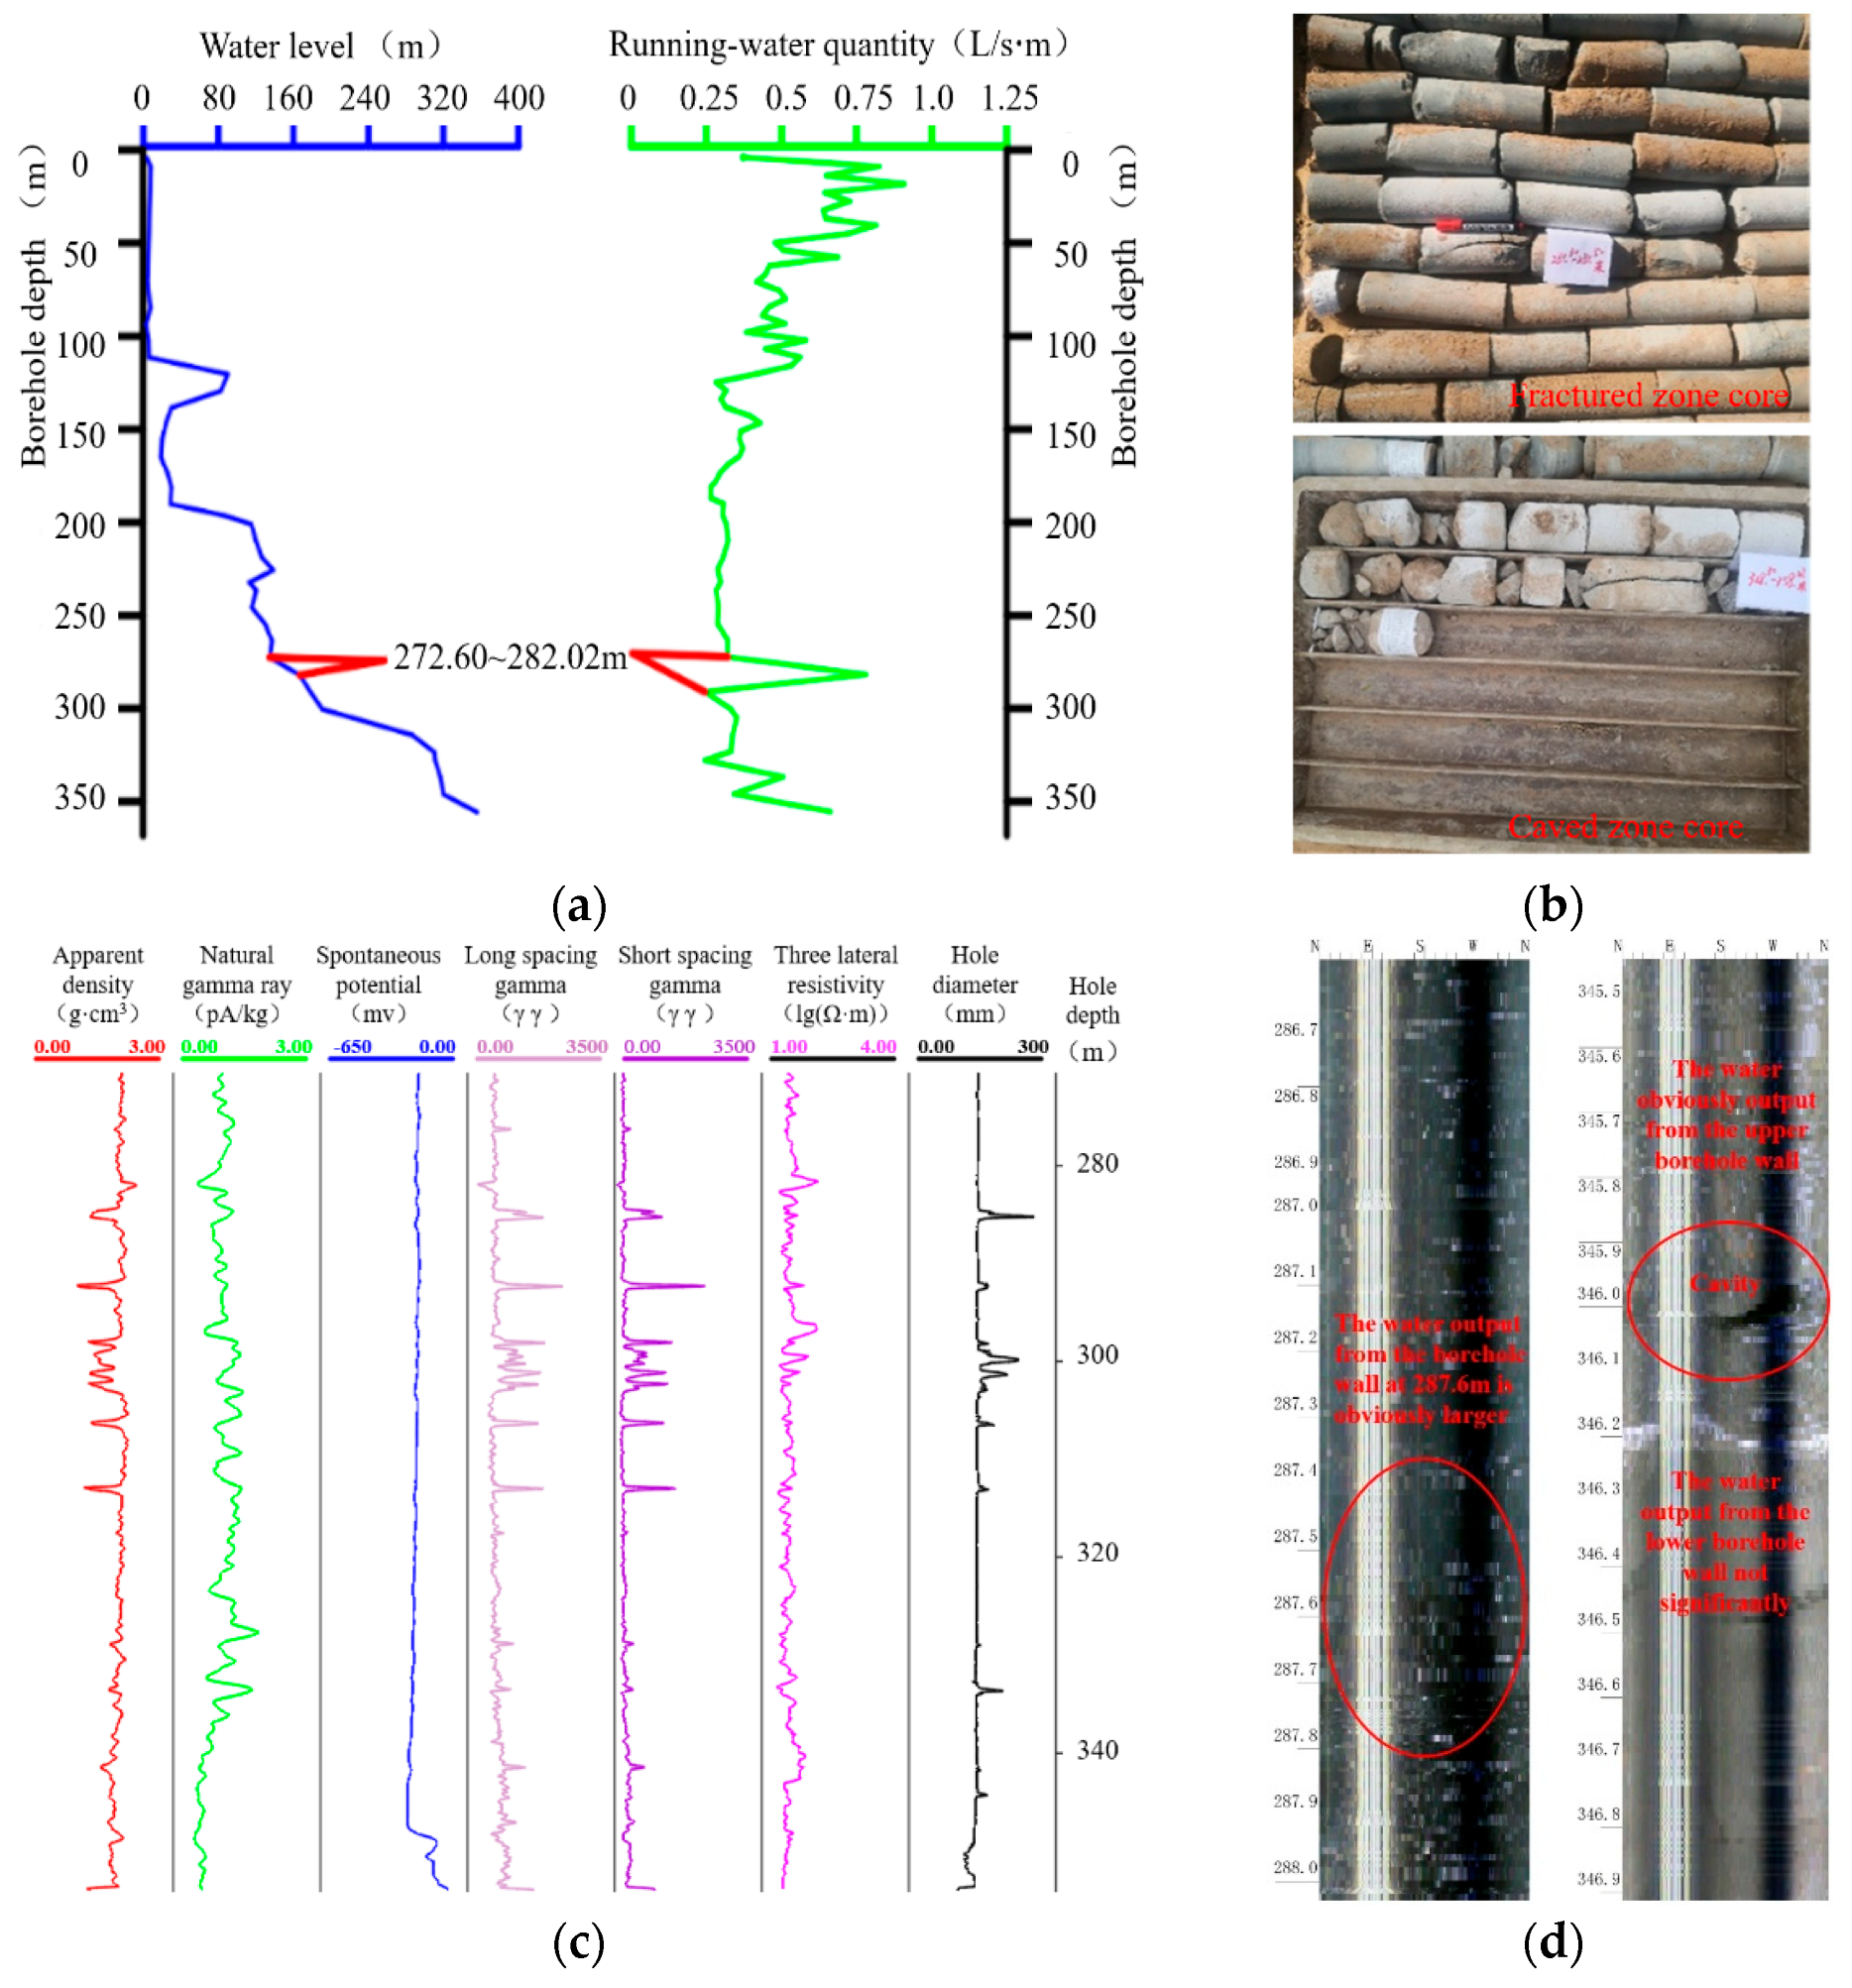
4. Field Drilling Verification

Drilling detection above the 1311 working face of the No. 3 coal seam (Figure 5) and the development range of the water-conducting zone were comprehensively determined by using four methods: simple hydrological observation method, engineering geological catalogue, geophysical logging, and downhole television. Figure 6 shows the results of the four kinds of detections implemented at YZK01.
The simple hydrological observation method entails observing the consumption of flushing fluid, mud water level, and drilling footage during the drilling process. The engineering geology catalogue involves counting the RQD value, which is the quality index, by studying the integrity of the core and the development of fissures. Geophysical logging mainly analyzes rock formations from the perspective of apparent density, three lateral resistivity, spontaneous potential, long and short source distance gamma, natural gamma, acoustic wave, and other parameters that change with burial depth. The downhole television method uses intelligent panoramic imaging logging in the borehole to form a 360° image of the rock wall and identify the development of fractures. The results obtained by the above methods are shown in Table 2.
In summary, the development height of the water-conducting zone obtained by field drilling detection ranges from 105.4 m to 120.4 m.

5. Mechanical Mechanism Analysis

During mining, the overlying rock layer is deformed and ruptured in a large range due to mining. At this time, the rock layer that controls all or part of the rock mass movement is called the key strata, and is generally also a hard rock layer. If the critical layer breaks, the deformation of all or part of the rock layer above it will remain the same; that is, the overall movement will occur. The one that controls all the upper rock layers is called the main key strata, and the breaking law of the main key strata directly affects the law of surface subsidence and movement, and the one that only plays a leading role in part of the rock layer is called the sub-key strata [6,7]. In actual engineering, there is only one main key strata, but the sub-key strata may have multiple layers due to the existence of multiple hard rock layers. At present, the key strata theory is widely used to analyze problems such as overlying rock motion control, pressure relief gas drainage, etc. It is an important means to understand the problems of fracture development and stope pressure.
The development height of the water-conducting zone in the overlying stratum of the 1311 working face is directly affected by the distribution and fracture of key strata. In response to this problem, based on the physical and mechanical parameters of each rock formation in the stope, the KSPB (Key Strata Judging Program) developed by China University of Mining and Technology was used to determine the position of the main/sub-key strata in the overlying strata. The calculation results are shown in Table 3.
It can be seen from Table 3 that there are six hard rock layers above the coal seam, one main key strata, and one sub-key strata. Among them, the main key strata is a siltstone layer with thickness of 15.5 m and depth of 281 m; the sub-key strata is a feldspar sandstone layer with thickness of 22.63 m and depth of 393 m. Xu et al. [14] pointed out that the position of the key strata of the overlying rock will affect the development height of the water-conducting zone. Only when the position of the key strata is less than a certain critical height from the mined coal seam, the fracture of the key strata will penetrate into the water-conducting zone, and at the same time, the ruptured fractures of the overlying strata will also penetrate into the water-conducting zone. However, the height of the main key strata of the No. 3 coal seam in the Weiqiang mine field is 112 m, which exceeds the critical height by 33.2 m (ten times the mining height). According to the calculation method proposed by Xu et al. [14], the height of the water-conducting zone can be determined as the range from above the coal seam top (393 m depth) to the bottom of the main key strata (281 m depth). Therefore, the height of the water-conducting zone is 112 m, and the ratio of the height of the fractured zone to the mining height is 33.73 m.

6. Conclusions

Based on the microseismic monitoring technique applied to monitor the strata movement and breakage of the 1311 working face of the No. 3 coal seam in the Weiqiang coalmine, the following conclusions can be drawn:
(1)
The MMS is used to monitor the microseismic events of the overlying rock in the mining area of the No. 3 coal seam in real time. The results show that the water-conducting zone gradually develops upward with the advancement of the 1311 working face, and the microseismic events at 110 m from the top of the coal seam are significantly weakening. Combined with the characteristics of the “three zones”, the height of the water-conducting zone was determined to be 110 m.
(2)
By comprehensively using four methods—the simple hydrological observation method, engineering geological catalogue, geophysical detection, and downhole television—the range of the water-conducting zone is about 105.4–120.4 m.
(3)
Based on the key strata theory, the mechanical mechanism of the development of the water-conducting zone was analyzed. The KSPB was used to determine the position of the key strata, and the height of the water-conducting zone was determined to be developed to the bottom of the 15.5 m thick siltstone layer, and the height was 112 m.
(4)
The microseismic monitoring is consistent with the theoretical results of on-site drilling detection and key strata theory, and can accurately determine the time, location, and nature of rock mass micro-ruptures. Compared with traditional prediction methods, it has the advantages of safety, high efficiency, accurate prediction, and easy studying of the law of overlying rock movement. Therefore, the promotion of microseismic monitoring technology is conducive to the safe production of mines, and has good social and economic benefits.

Author Contributions

W.G.: data curation, methodology, formal analysis, original draft; Y.L.: supervision, methodology, resources, review and editing; Q.H.: data curation, formal analysis, review and editing. All authors have read and agreed to the published version of the manuscript.

Funding

This research received no external funding.

Institutional Review Board Statement

Not applicable.

Informed Consent Statement

Not applicable.

Data Availability Statement

The data that support the findings of this study are available from the corresponding author (Y.L.), upon reasonable request.

Acknowledgments

The technical staff of the Weiqiang coalmine are appreciated for their field work.

Conflicts of Interest

The authors declare no conflict of interest.

Abbreviations

xi, yi, ziThe spatial coordinate of the ith sensor
x, y, zThe spatial coordinate of the test point
tiThe time when the sensor i captures the elastic wave P wave
tThe time when the microseismic event occurs
vpVelocity of P wave
tc,iThe time that the P wave obtained from the spatial coordinates
of the test point is transmitted to the sensor i
ρ0The density of the source medium
c0The seismic wave velocity
RDistance between the source position and the measuring point
FcThe seismic wave radiation coefficient
RcThe seismic wave free surface amplification coefficient
ScThe seismic wave field correction coefficient
MWThe moment magnitude
M0The seismic moment

References

  1. Qian, M.; Xu, J.; Wang, J. Further on the sustainable mining of coal. J. China Coal Soc. 2018, 43, 1–13. [Google Scholar]
  2. Qian, M.; Xu, J. Behaviors of strata movement in coal mining. J. China Coal Soc. 2019, 44, 973–984. [Google Scholar]
  3. Qian, M.; Mou, X.; Xu, J. Green mining of coal resources harmonizing with environment. J. China Coal Soc. 2007, 32, 1–7. [Google Scholar]
  4. Yang, T.; Tang, C.; Tan, Z.; Zhu, W.; Feng, Q. State of the art of inrush models in rock mass failure and developing trend for prediction and forecast of groundwater inrush. Chin. J. Rock Mech. Eng. 2007, 26, 268–277. [Google Scholar]
  5. Wang, X.; Xu, J.; Zhu, W. Influence of primary key stratum structure stability on evolution of water flowing fracture. J. China Coal Soc. 2012, 37, 606–612. [Google Scholar]
  6. Qian, M.; Mou, X.; Xu, J. Theoretical study of key stratum in ground control. J. China Coal Soc. 1996, 21, 2–7. [Google Scholar]
  7. Xu, J.; Qian, M. Study on the influence of key strata movement on subsidence. J. China Coal Soc. 2000, 25, 122–126. [Google Scholar]
  8. Jiang, F. View point of spatial structures of overlying strata and its application in coalmine. J. Min. Saf. Eng. 2006, 23, 30–33. [Google Scholar]
  9. Xu, J.; Lian, G.; Zhu, W.; Qian, M.-G. Influence of the key strata in deep mining to mining subsidence. J. China Coal Soc. 2007, 32, 686–690. [Google Scholar]
  10. Xu, J.; Zhu, W.; Wang, X.; Ti, M.-S. Classification of key strata structure of overlying strata in shallow coal seam. J. China Coal Soc. 2009, 34, 865–870. [Google Scholar]
  11. Qin, W.; Xu, J. Discussion on Key stratum distinguishing method of overlying strata based on the thin slab theory. J. China Coal Soc. 2010, 35, 194–197. [Google Scholar]
  12. Huang, B.; Liu, Z.; Xu, J. Effect of little fault in working face on water conducted fissure height. J. China Coal Soc. 2009, 34, 1316–1321. [Google Scholar]
  13. Hu, X.; Li, W.; Cao, D.-T.; Liu, M.-C. Index of multiple factors and expected height of fully mechanized water flowing fractured zone. J. China Coal Soc. 2012, 37, 613–620. [Google Scholar]
  14. Xu, J.; Zhu, W.; Wang, X. New method to predict the height of fractured water-conducting zone by location of key strata. J. China Coal Soc. 2012, 37, 762–769. [Google Scholar]
  15. Cao, Z.; Ju, J.; Xu, J. Distribution model of water-conducted fracture main channel and its flow characteristics. J. China Coal Soc. 2019, 44, 3719–3728. [Google Scholar]
  16. Wang, X.; Xu, J.; Han, H.K.; Ju, J.F.; Xing, Y.T. Stepped development characteristic of water flowing fracture height with variation of mining thickness. J. China Coal Soc. 2019, 44, 3740–3749. [Google Scholar]
  17. Zhang, C.; Zhao, Y.; Han, P.; Bai, Q. Coal pillar failure analysis and instability evaluation methods: A short review and prospect. Eng. Fail. Anal. 2022, 138, 106344. [Google Scholar] [CrossRef]
  18. Chen, J.; Liu, P.; Liu, L.; Zheng, B.; Zhao, H.; Zhang, C.; Zhang, J.; Li, D. Anchorage performance of a modified cable anchor subjected to different joint opening conditions. Constr. Build. Mater. 2022, 336, 127558. [Google Scholar] [CrossRef]
  19. Miao, X.; Cui, X.; Wang, J.; Xu, J. The height of fractured water-conducting zone in undermined rock strata. Eng. Geol. 2011, 120, 32–39. [Google Scholar] [CrossRef]
  20. Li, P.; Wang, X.; Cao, W.; Zhang, D.; Qin, D.; Wang, H. Influence of Spatial Relationships between Key Strata on the Height of Mining-Induced Fracture Zone: A Case Study of Thick Coal Seam Mining. Energies 2018, 11, 102. [Google Scholar] [CrossRef] [Green Version]
  21. Gui, H.; Zhou, Q.; Liao, D.; Kang, Q.; Fan, Z.; Zou, H. Prediction of maximum height of the fractured zone by stressing method for sub-level caving mining. J. China Coal Soc. 1997, 22, 41–45. [Google Scholar]
  22. Chen, R.; Bai, H.; Feng, M. Determination of the height of water flowing fractured zone in overburden strata above fully-mechanized top-coal caving face. J. Min. Saf. Eng. 2006, 23, 220–223. [Google Scholar]
  23. Lu, W. Measure and simulation for development height of water conducted crack zone in overburden roof. J. Xi’an Univ. Sci. Technol. 2014, 34, 309–313. [Google Scholar]
  24. Yi, W.; Weifeng, Y.; Ming, L.; Liu, X. Risk assessment of floor water inrush in coal mines based on secondary fuzzy comprehensive evaluation. Int. J. Rock Mech. Min. Sci. 2012, 52, 50–55. [Google Scholar]
  25. Zhang, J. Investigations of water inrushes from aquifers under coal seams. Int. J. Rock Mech. Min. Sci. 2005, 42, 350–360. [Google Scholar] [CrossRef]
  26. Li, T.; Mei, T.; Sun, X.; Lv, Y.; Sheng, J.; Cai, M. A study on a water-inrush incident at Laohutai coalmine. Int. J. Rock Mech. Min. Sci. 2013, 59, 151–159. [Google Scholar] [CrossRef]
  27. Huang, Z.; Jiang, Z.; Zhu, S.; Qian, Z.; Cao, D. Characterizing the hydraulic conductivity of rock formations between deep coal and aquifers using injection tests. Int. J. Rock Mech. Min. Sci. 2014, 71, 12–18. [Google Scholar] [CrossRef]
  28. D’Angiò, D.; Lenti, L.; Martino, S. Microseismic monitoring to assess rock mass damaging through a novel damping ratio-based approach. Int. J. Rock Mech. Min. Sci. 2021, 146, 104883. [Google Scholar] [CrossRef]
  29. Ma, K.; Sun, X.Y.; Tang, C.A.; Yuan, F.Z.; Wang, S.J.; Chen, T. Floor water inrush analysis based on mechanical failure characters and microseismic monitoring. Tunn. Undergr. Space Technol. 2021, 108, 103698. [Google Scholar] [CrossRef]
  30. Wamriew, D.; Charara, M.; Pissarenko, D. Joint event location and velocity model update in real-time for downhole microseismic monitoring: A deep learning approach. Comput. Geosci. 2022, 158, 104965. [Google Scholar] [CrossRef]
  31. Zhang, C.; Jin, G.; Liu, C.; Li, S.; Xue, J.; Cheng, R.; Wnag, X.; Zheng, X. Prediction of rockbursts in a typical island working face of a coal mine through microseismic monitoring technology. Tunn. Undergr. Space Technol. 2021, 113, 103972. [Google Scholar] [CrossRef]
  32. Yi, D.; Xun, L.; Si, G.; Canbulat, I. Seismic source location using the shortest path method based on boundary discretisation scheme for microseismic monitoring in underground mines. Int. J. Rock Mech. Min. Sci. 2022, 149, 104982. [Google Scholar]
  33. Srinivasan, C.; Arora, S.K.; Benady, S. Precursory monitoring of impending rockbursts in Kolar gold mines from microseismic emissions at deeper levels. Int. J. Rock Mech. Min. Sci. 1999, 36, 941–948. [Google Scholar] [CrossRef]
  34. Simser, B.P.; Andrieux, P.P.; Peterson, D.A.; Macdonald, T.A.; Alcott, J.M. Advanced monitoring and analysis of microseismic activity as an aid to mining at Brunswick Mines. Int. J. Rock Mech. Min. Sci. 1998, 35, 389. [Google Scholar] [CrossRef]
  35. Occhiena, C.; Pirulli, M.; Scavia, C. A microseismic-based procedure for the detection of rock slope instabilities. Int. J. Rock Mech. Min. Sci. 2014, 69, 67–79. [Google Scholar] [CrossRef]
  36. Hassani, H.; Hloušek, F.; Alexandrakis, C.; Buske, S. Migration-based microseismic event location in the Schlema-Alberoda mining area. Int. J. Rock Mech. Min. Sci. 2018, 110, 161–167. [Google Scholar] [CrossRef]
  37. Mngadi, S.B.; Durrheim, R.J.; Manzi, M.S.D.; Ogasawara, H.; Yabe, Y.; Yilmaz, H.; Wechsler, N.; van Aswegen, G.; Roberts, D.; Ward, A.K.; et al. Integration of underground mapping, petrology, and high-resolution microseismicity analysis to characterise weak geotechnical zones in deep South African gold mines. Int. J. Rock Mech. Min. Sci. 2019, 114, 79–91. [Google Scholar] [CrossRef]
  38. Fuxing, J. Application of microseismic monitoring technology of strata fracturing in underground coalmine. Chin. J. Geotech. Eng. 2002, 24, 147–149. [Google Scholar]
  39. Fuxing, J.; Xun, L.; Shuhua, Y. Study on microseismic monitoring for spatial structure of overlying strata and mining pressure field in longwall face. Chin. J. Geotech. Eng. 2003, 25, 23–25. [Google Scholar]
  40. Cheng, Y.; Jiang, F.; Zhang, X. C-shaped strata spatial structure and stress field in longwall face monitored by microseismic monitoring. Chin. J. Rock Mech. Eng. 2007, 26, 102–107. [Google Scholar]
  41. Yang, Z.; Yu, R.; Guo, R. Application of microseismic monitoring to deep mines. Chin. J. Rock Mech. Eng. 2008, 27, 1066–1073. [Google Scholar]
  42. Wang, S.; Mao, D.; Pan, J. Measurement on the whole process of abutment pressure evolution and microseismic activities at the lateral strata of goaf. J. China Coal Soc. 2015, 40, 2772–2779. [Google Scholar]
  43. Liu, H.; Yang, T.; Zhang, B. Influence factors of overlying coal strata falling and mine pressure behaviours in western coalmines. J. China Coal Soc. 2017, 42, 460–469. [Google Scholar]
  44. Tang, G.; Zhu, Z.; Han, Y. Relationship between overburden strata movement and strata behavior during dual system seam mining based on microseismic monitoring technology. J. China Coal Soc. 2017, 42, 212–218. [Google Scholar]
  45. Wang, H.; Jiang, F.; Cheng, Y. Research on microseismic (MS) monitoring of the height of fractured water-conducting zone in overlying rock. Eng. Geol. 2006, 120, 74–76. [Google Scholar]
  46. Jiang, F.; Ye, G.; Wang, C. Application of high-precision microseismic monitoring technique to water inrush monitoring in coalmine. Chin. J. Rock Mech. Eng. 2008, 27, 1932–1938. [Google Scholar]
  47. Liu, C.; Li, S.; Xue, J. Identification method of high fractured body for overlying strata in goaf based on microseismic monitoring technology. J. China Univ. Min. Technol. 2016, 45, 709–716. [Google Scholar]
  48. Han, J.; Zhang, H.; Gao, Z. Failure height of weak overburden by layered fully-mechanized mining in extremely thick coal seam. J. Min. Saf. Eng. 2016, 33, 226–230. [Google Scholar]
Figure 1. Schematic diagram of the working faces.
Sustainability 14 08385 g001
Figure 2. Location of the two reservoirs. (a) Satellite map of Hejiagou Reservoir. (b) Satellite map of Luotuobozigou Reservoir.
Sustainability 14 08385 g002
Figure 3. Operation and monitoring plan of MMS in the 1311 working face. (a) Operation schematic diagram of MMS. (b) Field monitoring plan of MMS.
Sustainability 14 08385 g003
Figure 4. Temporal and spatial distribution characteristics of microseismic events from October 2019 to January 2020 (ad).
Sustainability 14 08385 g004
Figure 5. Schematic diagram of YZK01 plane position.
Sustainability 14 08385 g005
Figure 6. The height of “three-zones” measured by field drilling detection. (a) Simple hydrological observation method. (b) Engineering geological catalogue. (c) Geophysical logging. (d) Downhole television.
Sustainability 14 08385 g006
Table 1. Coordinates and elevation of sensors.
Sensor NumberNEElevation (M)
1037:59:55.915306109:15:12.732641788.218
2037:59:57.532875109:15:12.694932787.749
3037:59:59.157386109:15:12.657013788.916
4038:00:00.510342109:15:12.622709786.871
5038:00:02.140542109:15:12.589681786.828
6038:00:03.759413109:15:12.560642785.881
Table 2. Field drilling detection results.
MethodHeight of Water-Conducting Zone (m)The Ratio of the Height of the Fractured Zone to the Mining Height
Simple hydrological observation method120.436.27
Engineering geological catalogue111.733.64
Geophysical logging10832.53
Downhole television105.431.75
Table 3. Discrimination of key strata location.
StrataNo.Depth (m)Thickness (m)NameKey StrataHard Rock FormationThree Zones
Q21168.0068.00Loess bending zone
K1zh269.201.20medium-grained sandstone
3120.6551.45coarse-grained sandstone NO. 5
J2a4127.907.25sandy mudstone
5132.404.50fine-grained sandstone
6136.804.40sandy mudstone
7140.003.20coarse-grained sandstone
8143.903.90sandy mudstone
9149.805.90siltstone
10153.503.70sandy mudstone
11157.103.60siltstone
12162.004.90fine-grained sandstone
13166.304.30medium-grained sandstone
14170.003.70siltstone
15173.503.50sandy mudstone
16175.001.50medium-grained sandstone
17180.405.40sandy mudstone
18182.001.60medium-grained sandstone
J2z19186.604.60siltstone
20191.304.70medium-grained sandstone
21196.505.20siltstone
22207.5011.00coarse-grained sandstone
23220.0012.50siltstone
24221.801.80medium-grained sandstone
25243.3021.50siltstone NO. 4
26245.902.60fine-grained sandstone
27248.302.40siltstone
28252.003.70medium-grained sandstone
29259.407.40fine-grained sandstone
30264.104.70siltstone
31265.501.40coarse-grained sandstone
32281.0015.50siltstonemain key strataNO. 3
33282.801.80medium-grained sandstone fractured zone
34295.8013.00siltstone
35298.102.30medium-grained sandstone
36305.807.70sandy mudstone
37310.004.20siltstone
38313.103.10medium-grained sandstone
39319.606.50siltstone
40321.301.70sandy mudstone
41324.903.60medium-grained sandstone
42329.604.70siltstone
43336.006.40medium-grained sandstone
44341.005.00fine-grained sandstone
45358.2817.28coarse-grained sandstone NO. 2
J2y46360.131.85siltstone
47361.901.77mudstone
48365.793.89siltstone
49366.670.88mudstone
50370.373.70siltstone
51393.0022.63feldspar sandstonesub-key strataNO. 1caving zone
J2y352396.323.32coal
Publisher’s Note: MDPI stays neutral with regard to jurisdictional claims in published maps and institutional affiliations.

