
Challenges of Electric Vehicles and Their Prospects in Malaysia: A Comprehensive Review

 ,
,  and
and
Abstract
:1. Introduction
- Identifying the current EV practices in Malaysia.
- Pointing out the key challenges in implementing EV technology.
- Proposing solutions to address the challenges currently being faced by EV users, manufacturers, and policymakers in Malaysia.
- Investigating the impact of EVs on the lifestyle and power grid structure of Malaysia.
- Modeling the human psychology behind the EV market.
- Outlining the prospects of EVs in Malaysia.
- Highlighting the technological competency to advance EV research and manufacturing across the globe.
2. Methods
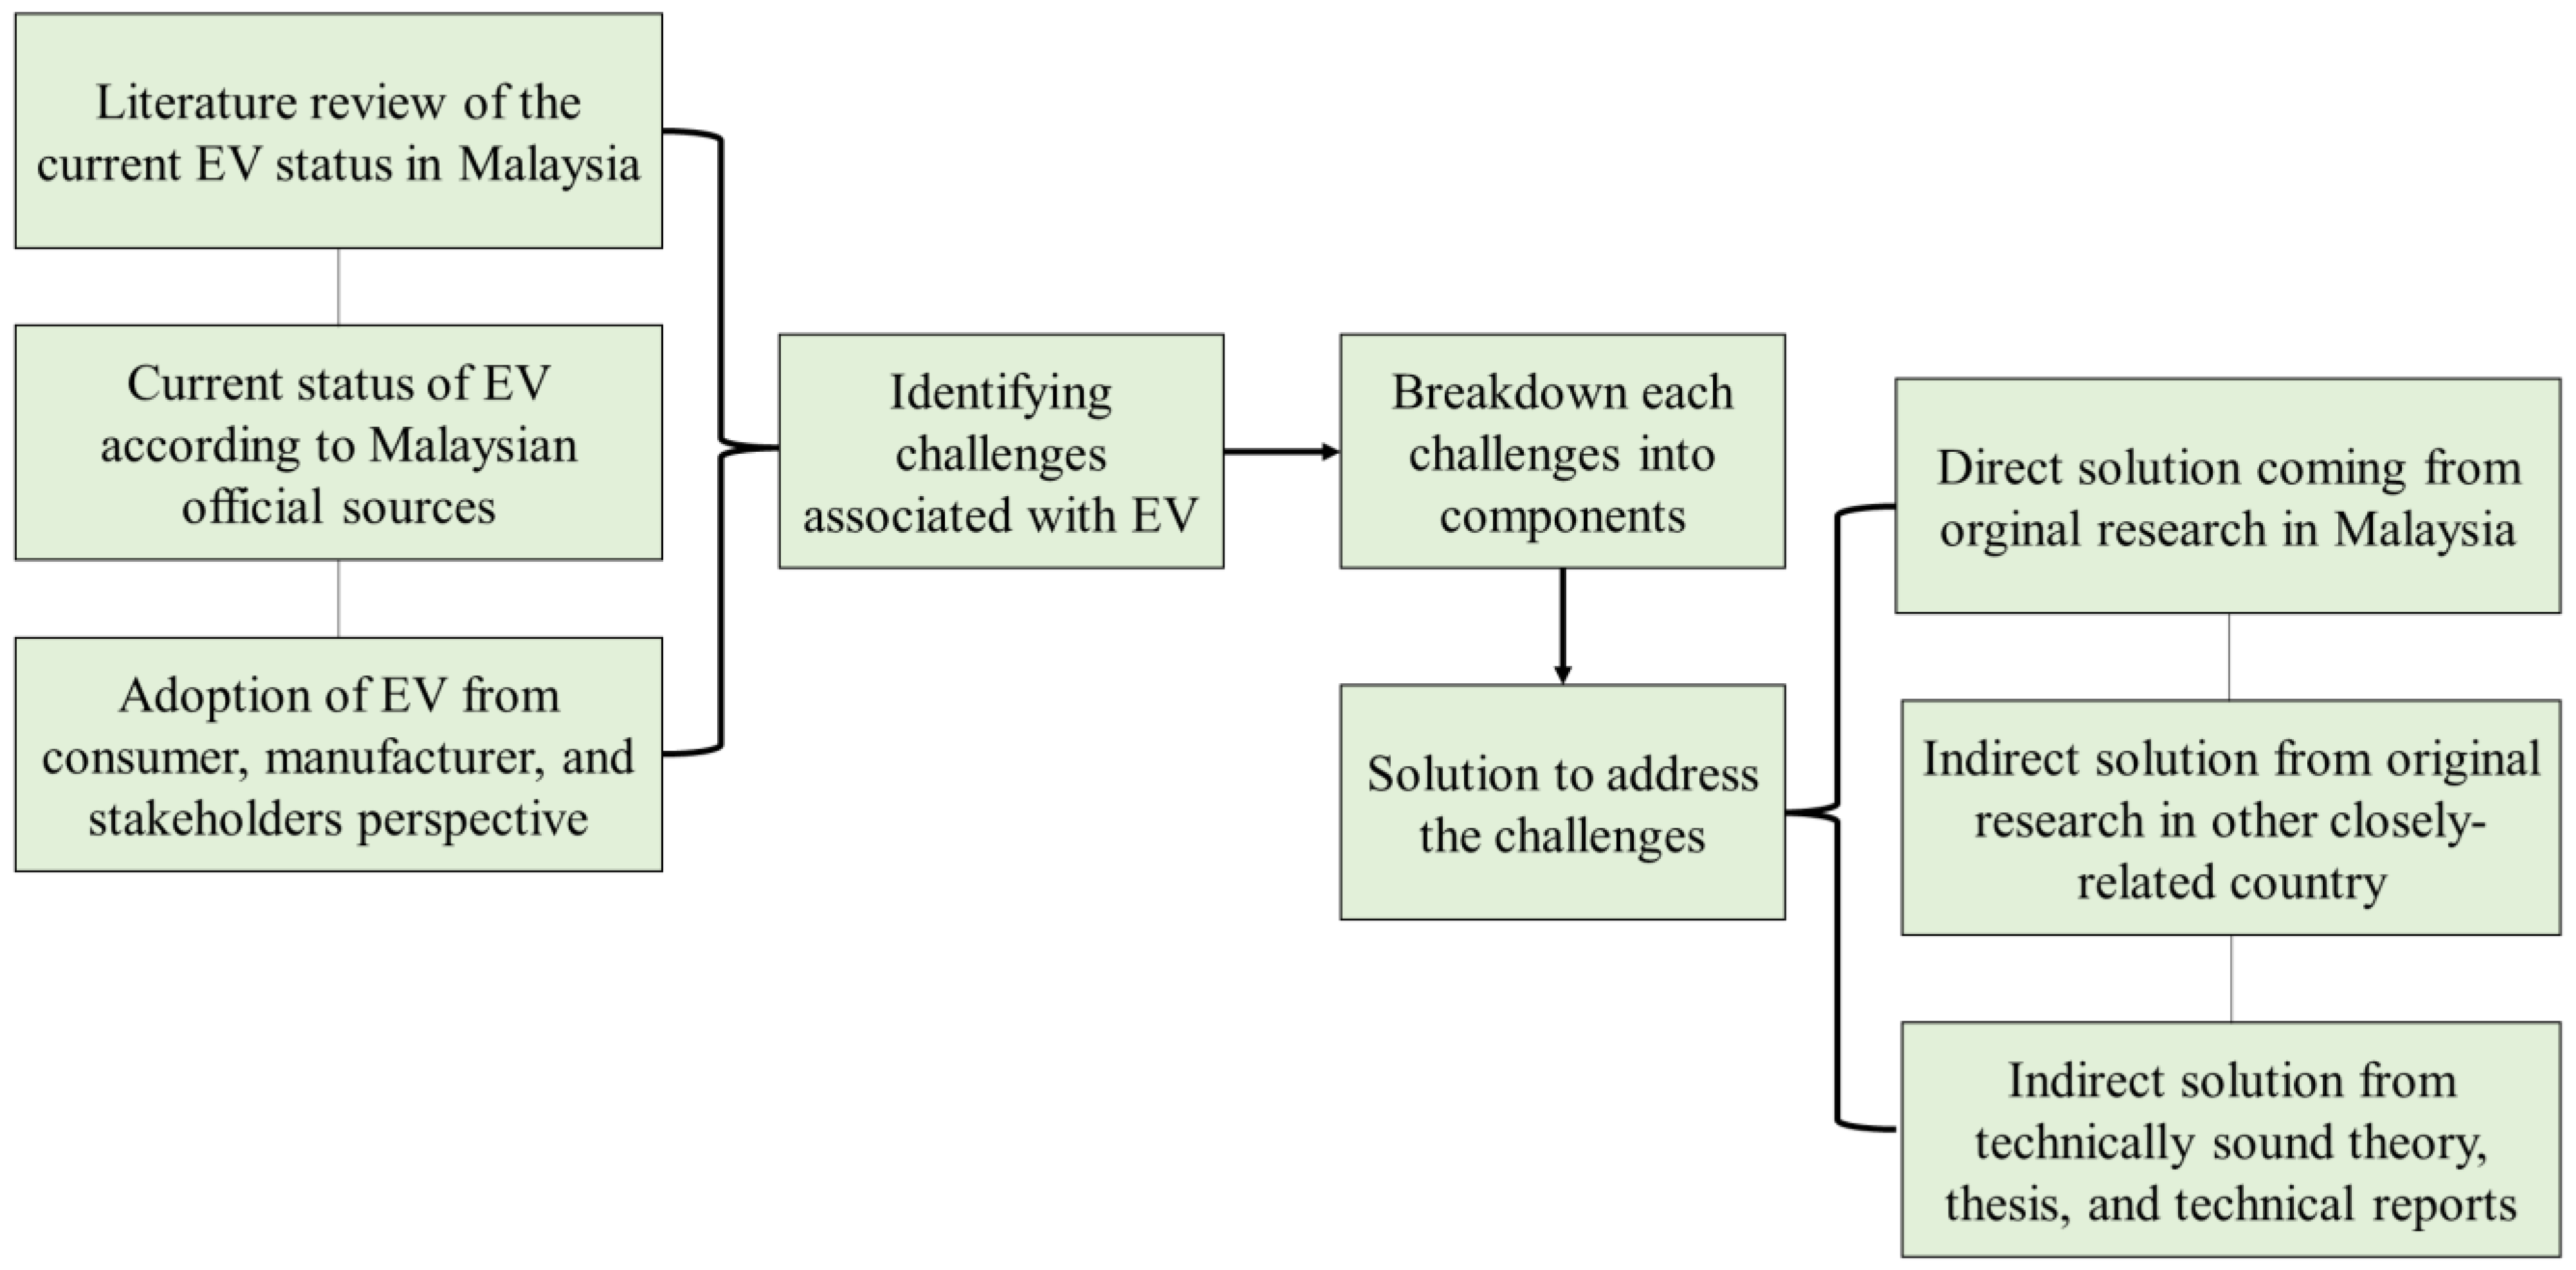
2.1. Scope of Study and Framework
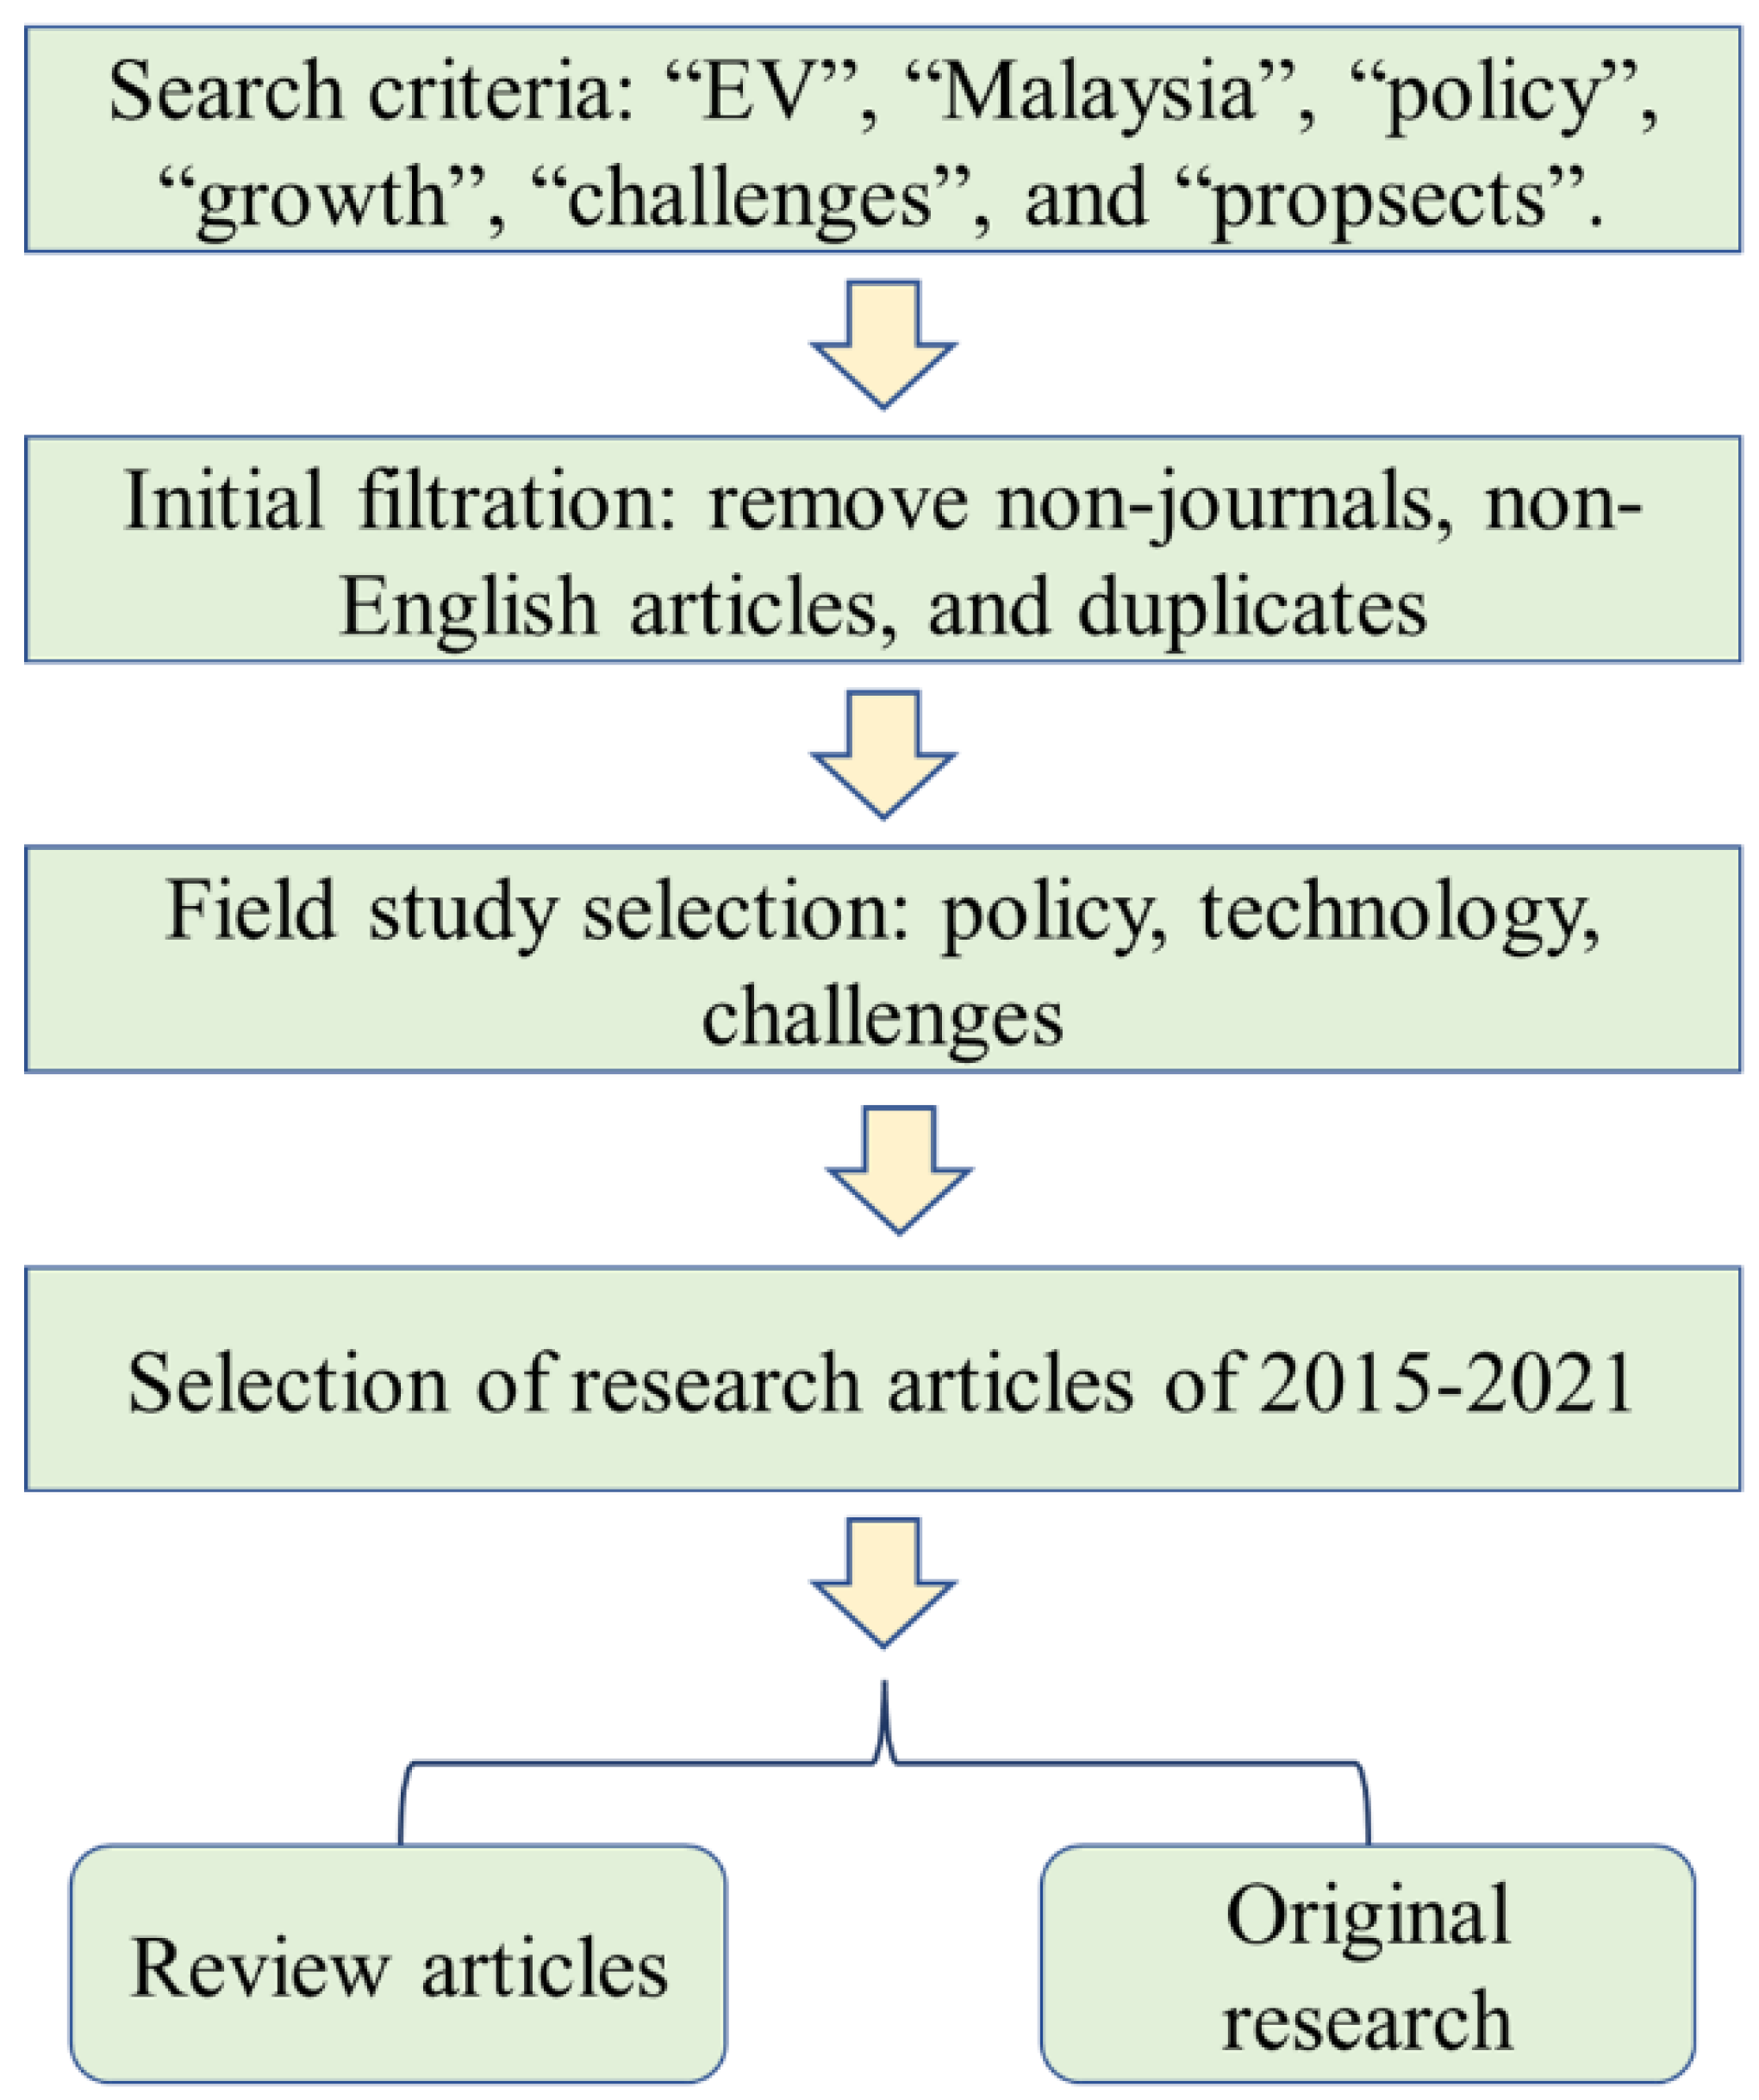
2.2. Literature Review Process
3. The Electrical Vehicle and Its Prospects
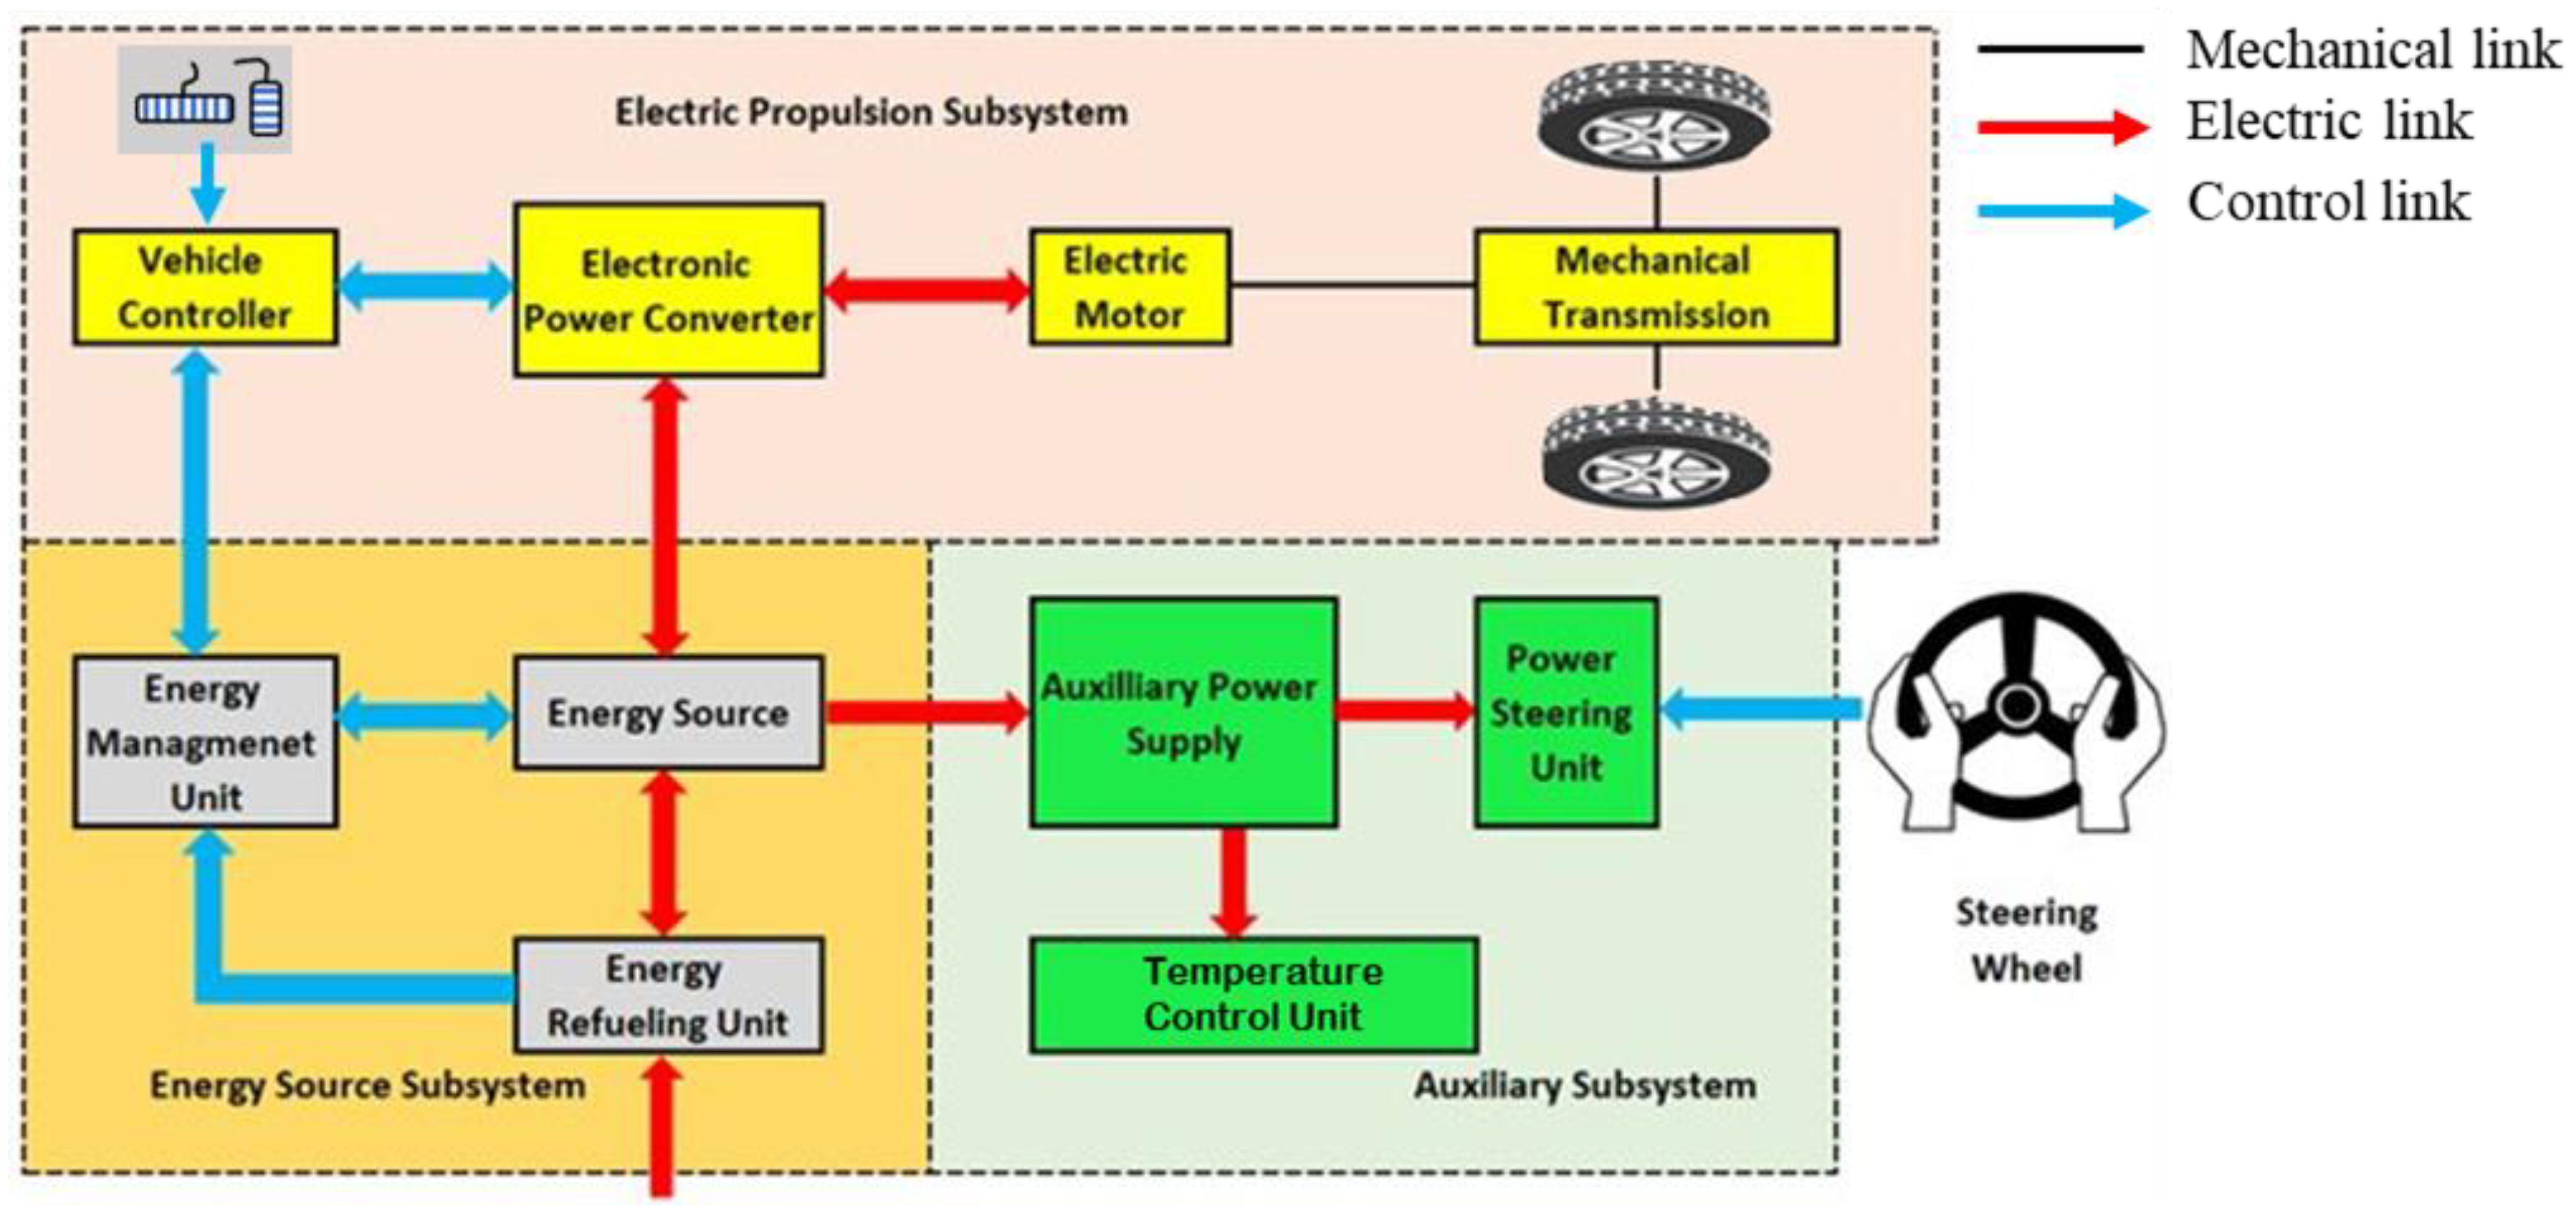
3.1. Electric Vehicle
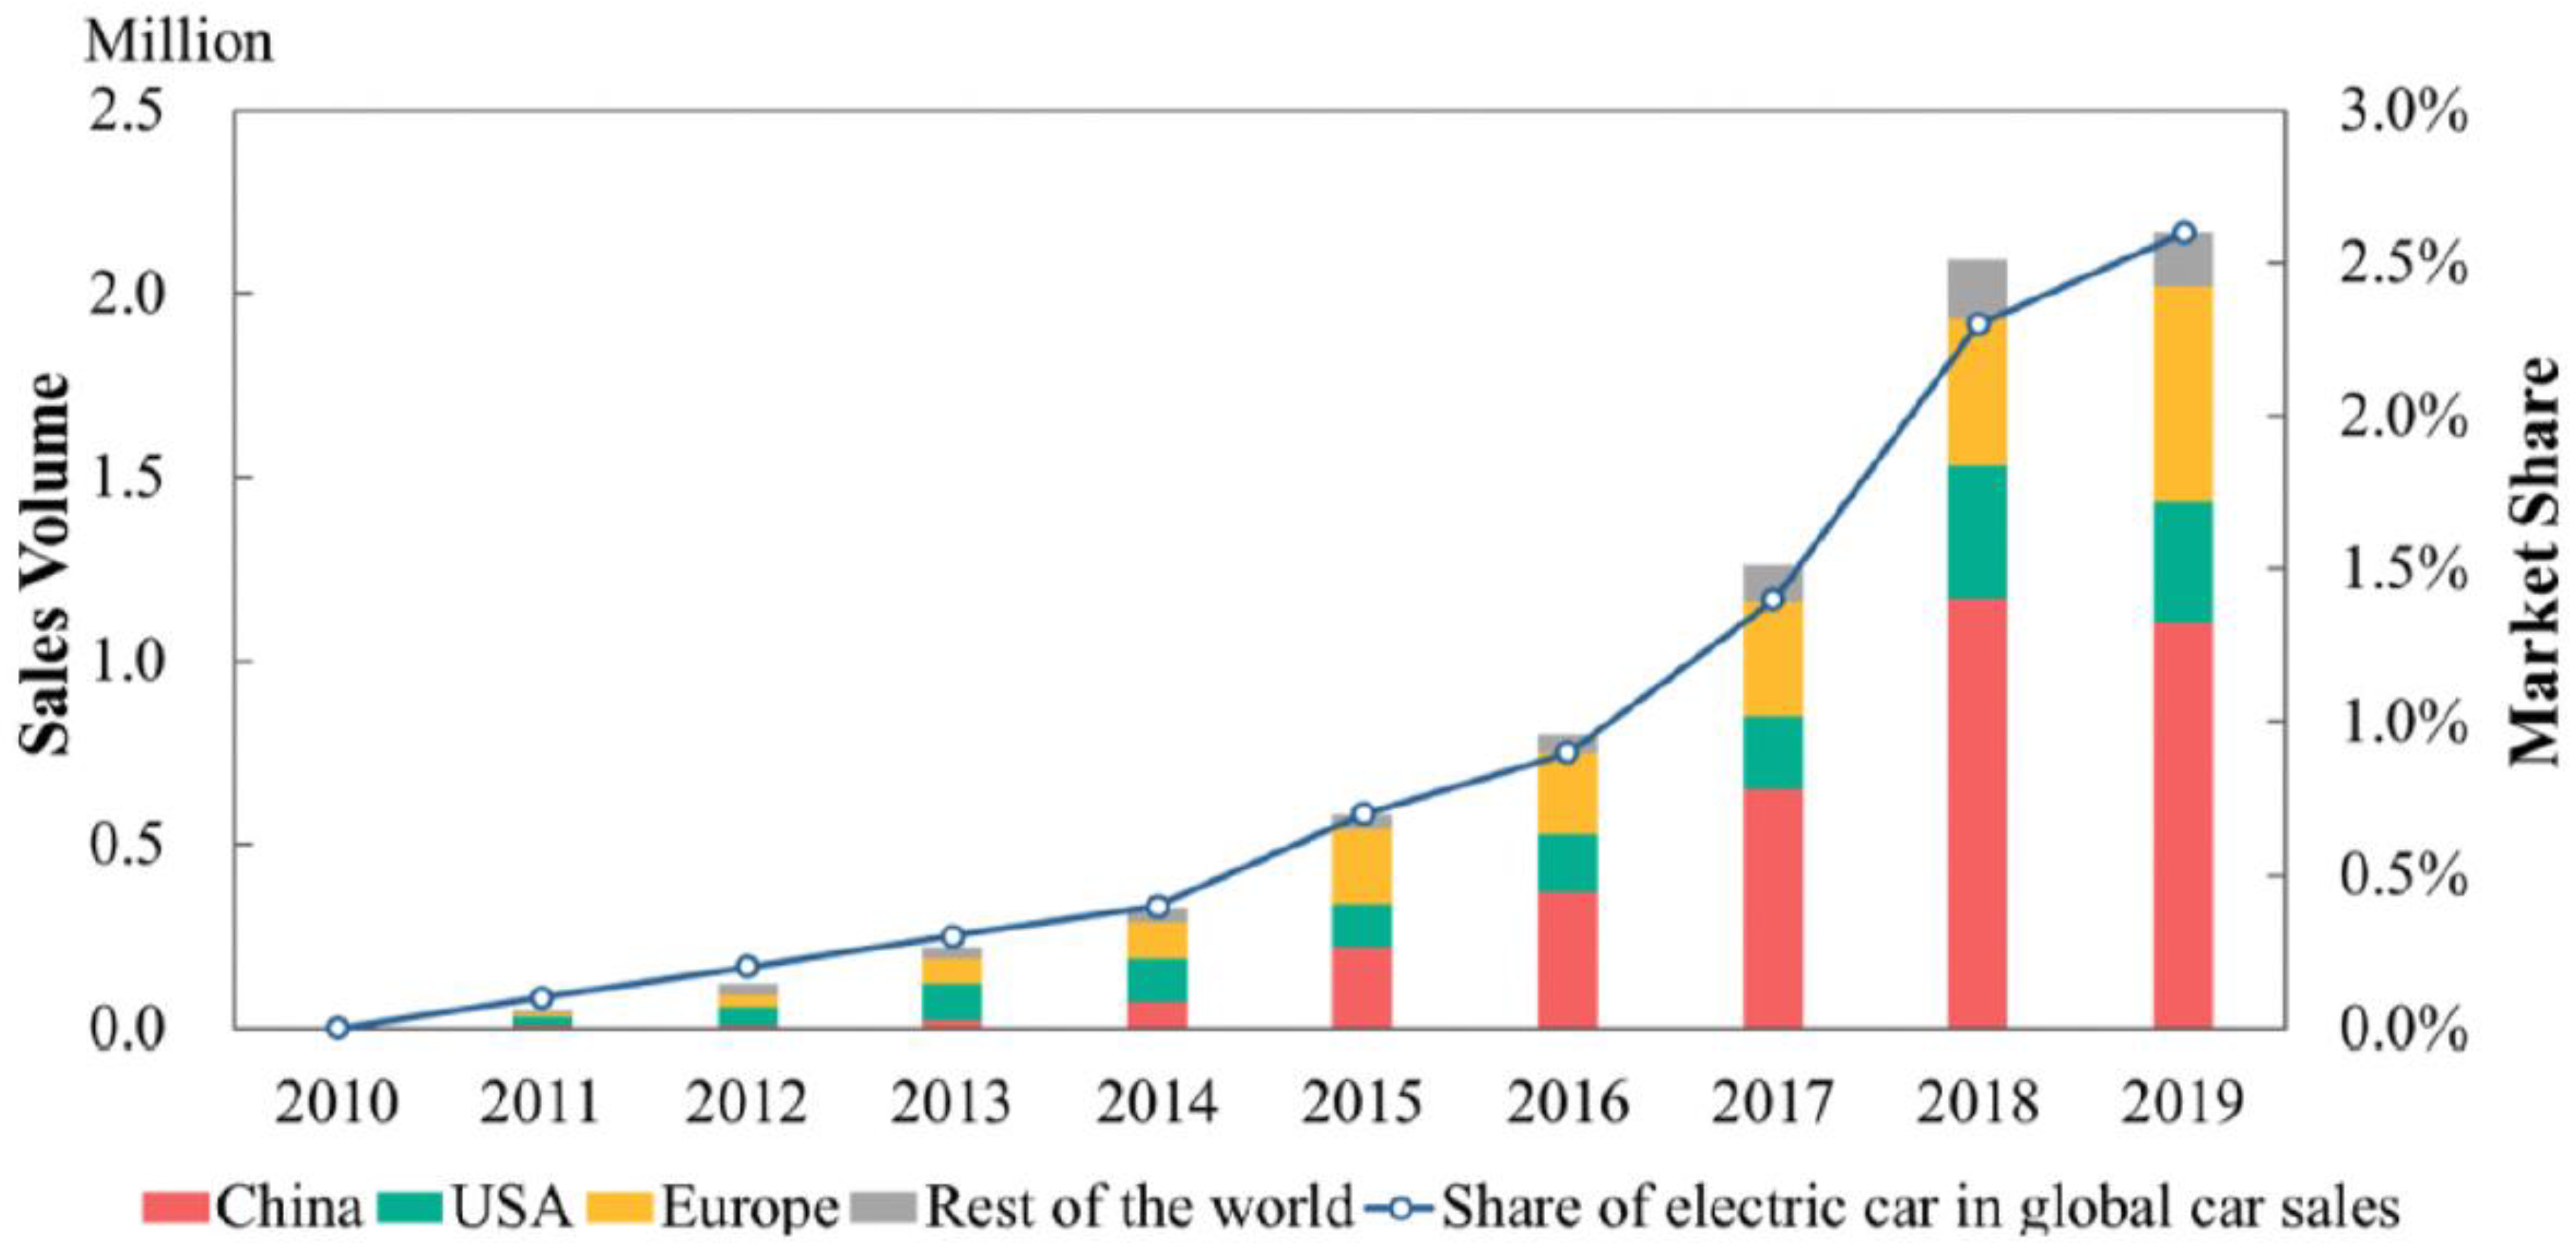
3.2. Prospect of Electric Vehicle
4. Challenges of EV
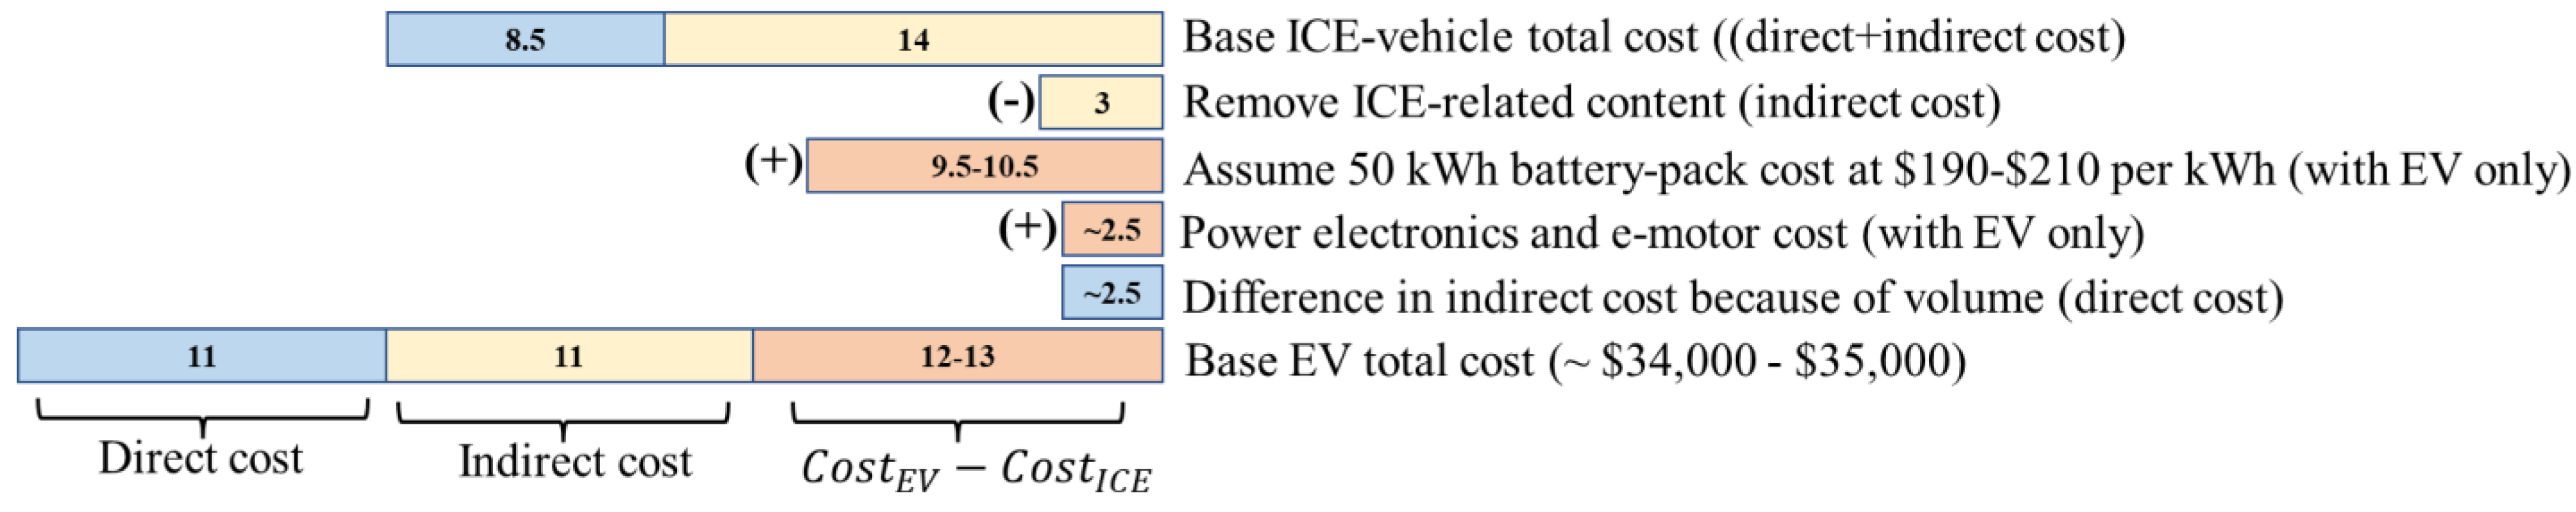
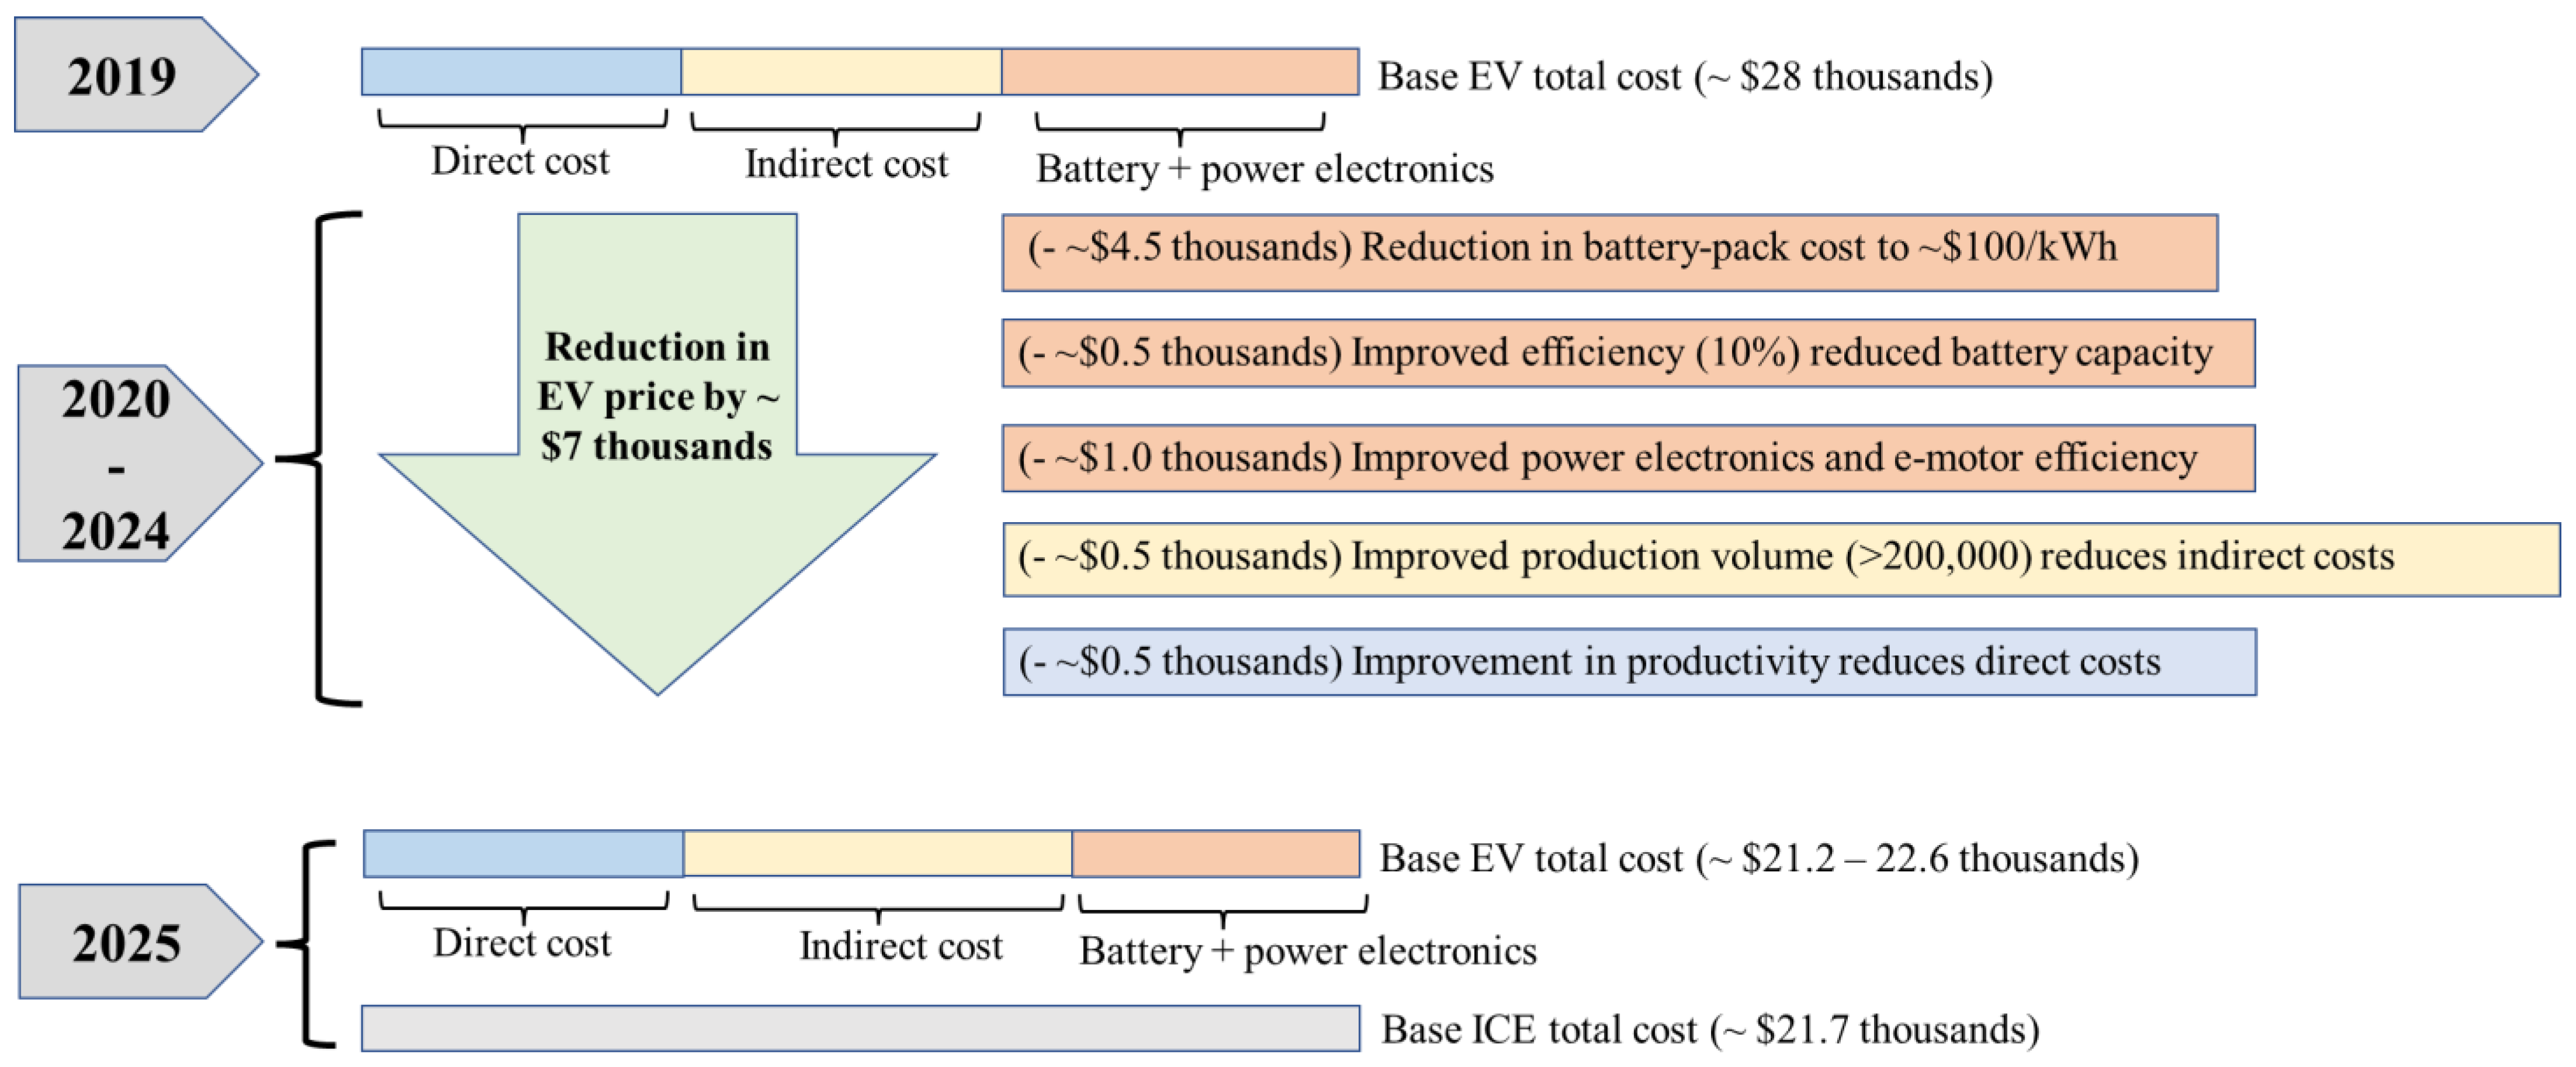
4.1. Current Market Price
4.1.1. High Market Price
4.1.2. Battery Price and Raw Materials
4.1.3. No Mass Production
4.1.4. COVID-19
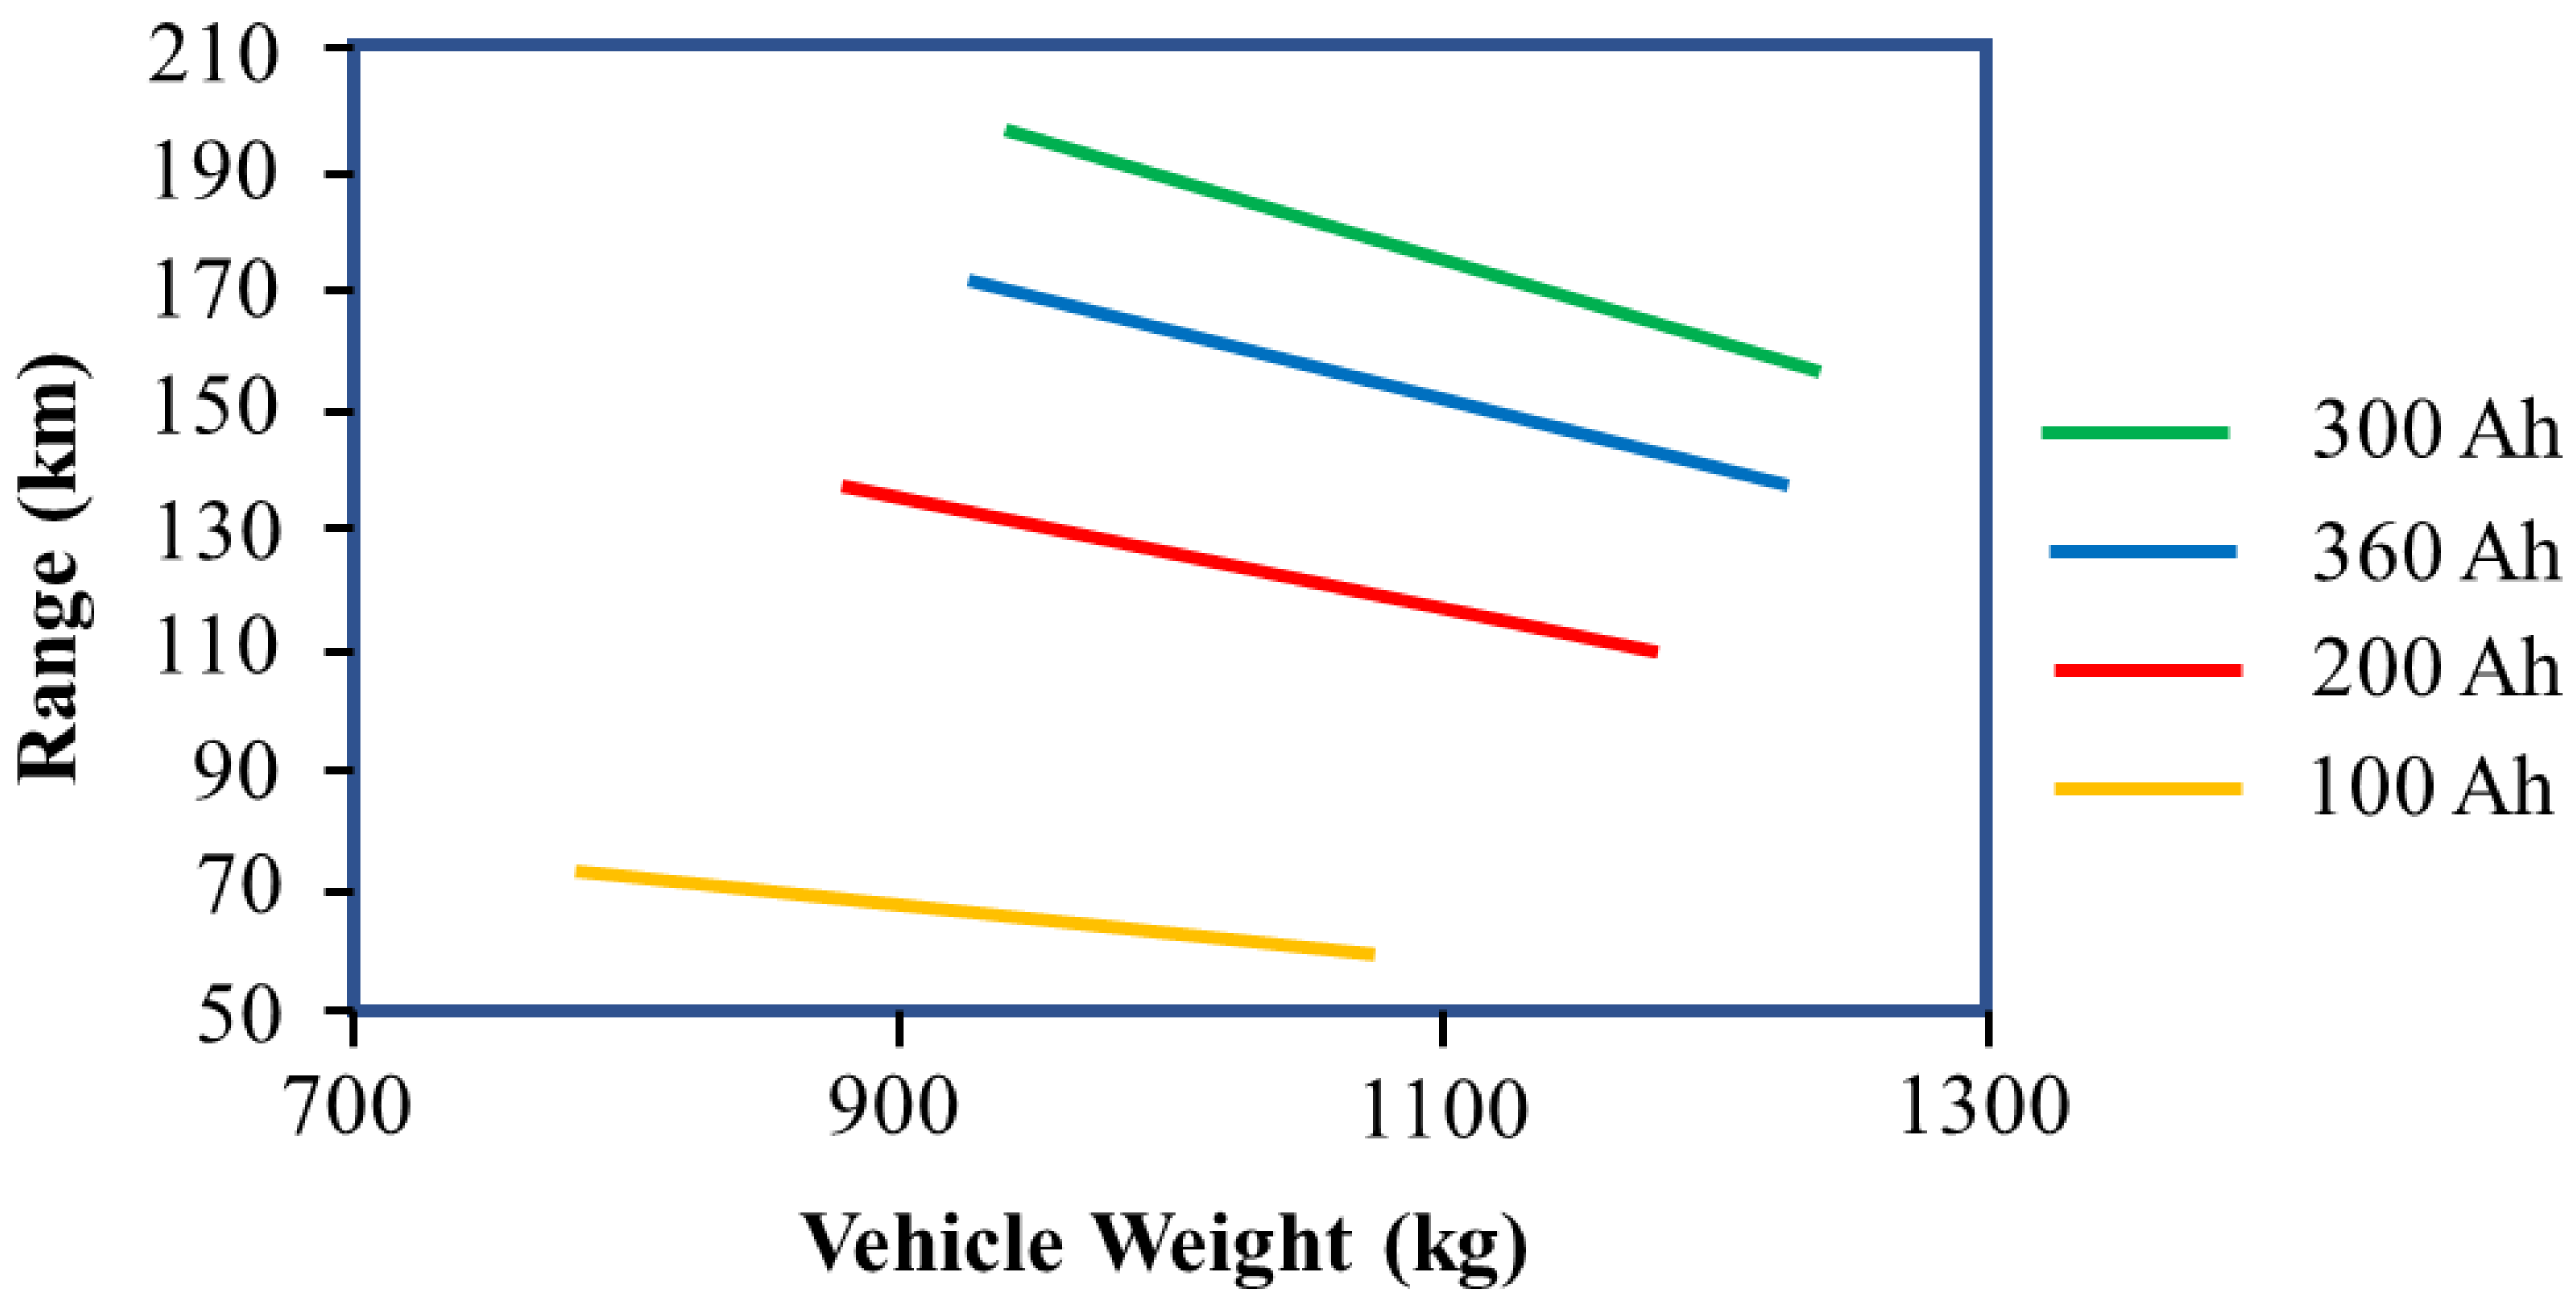
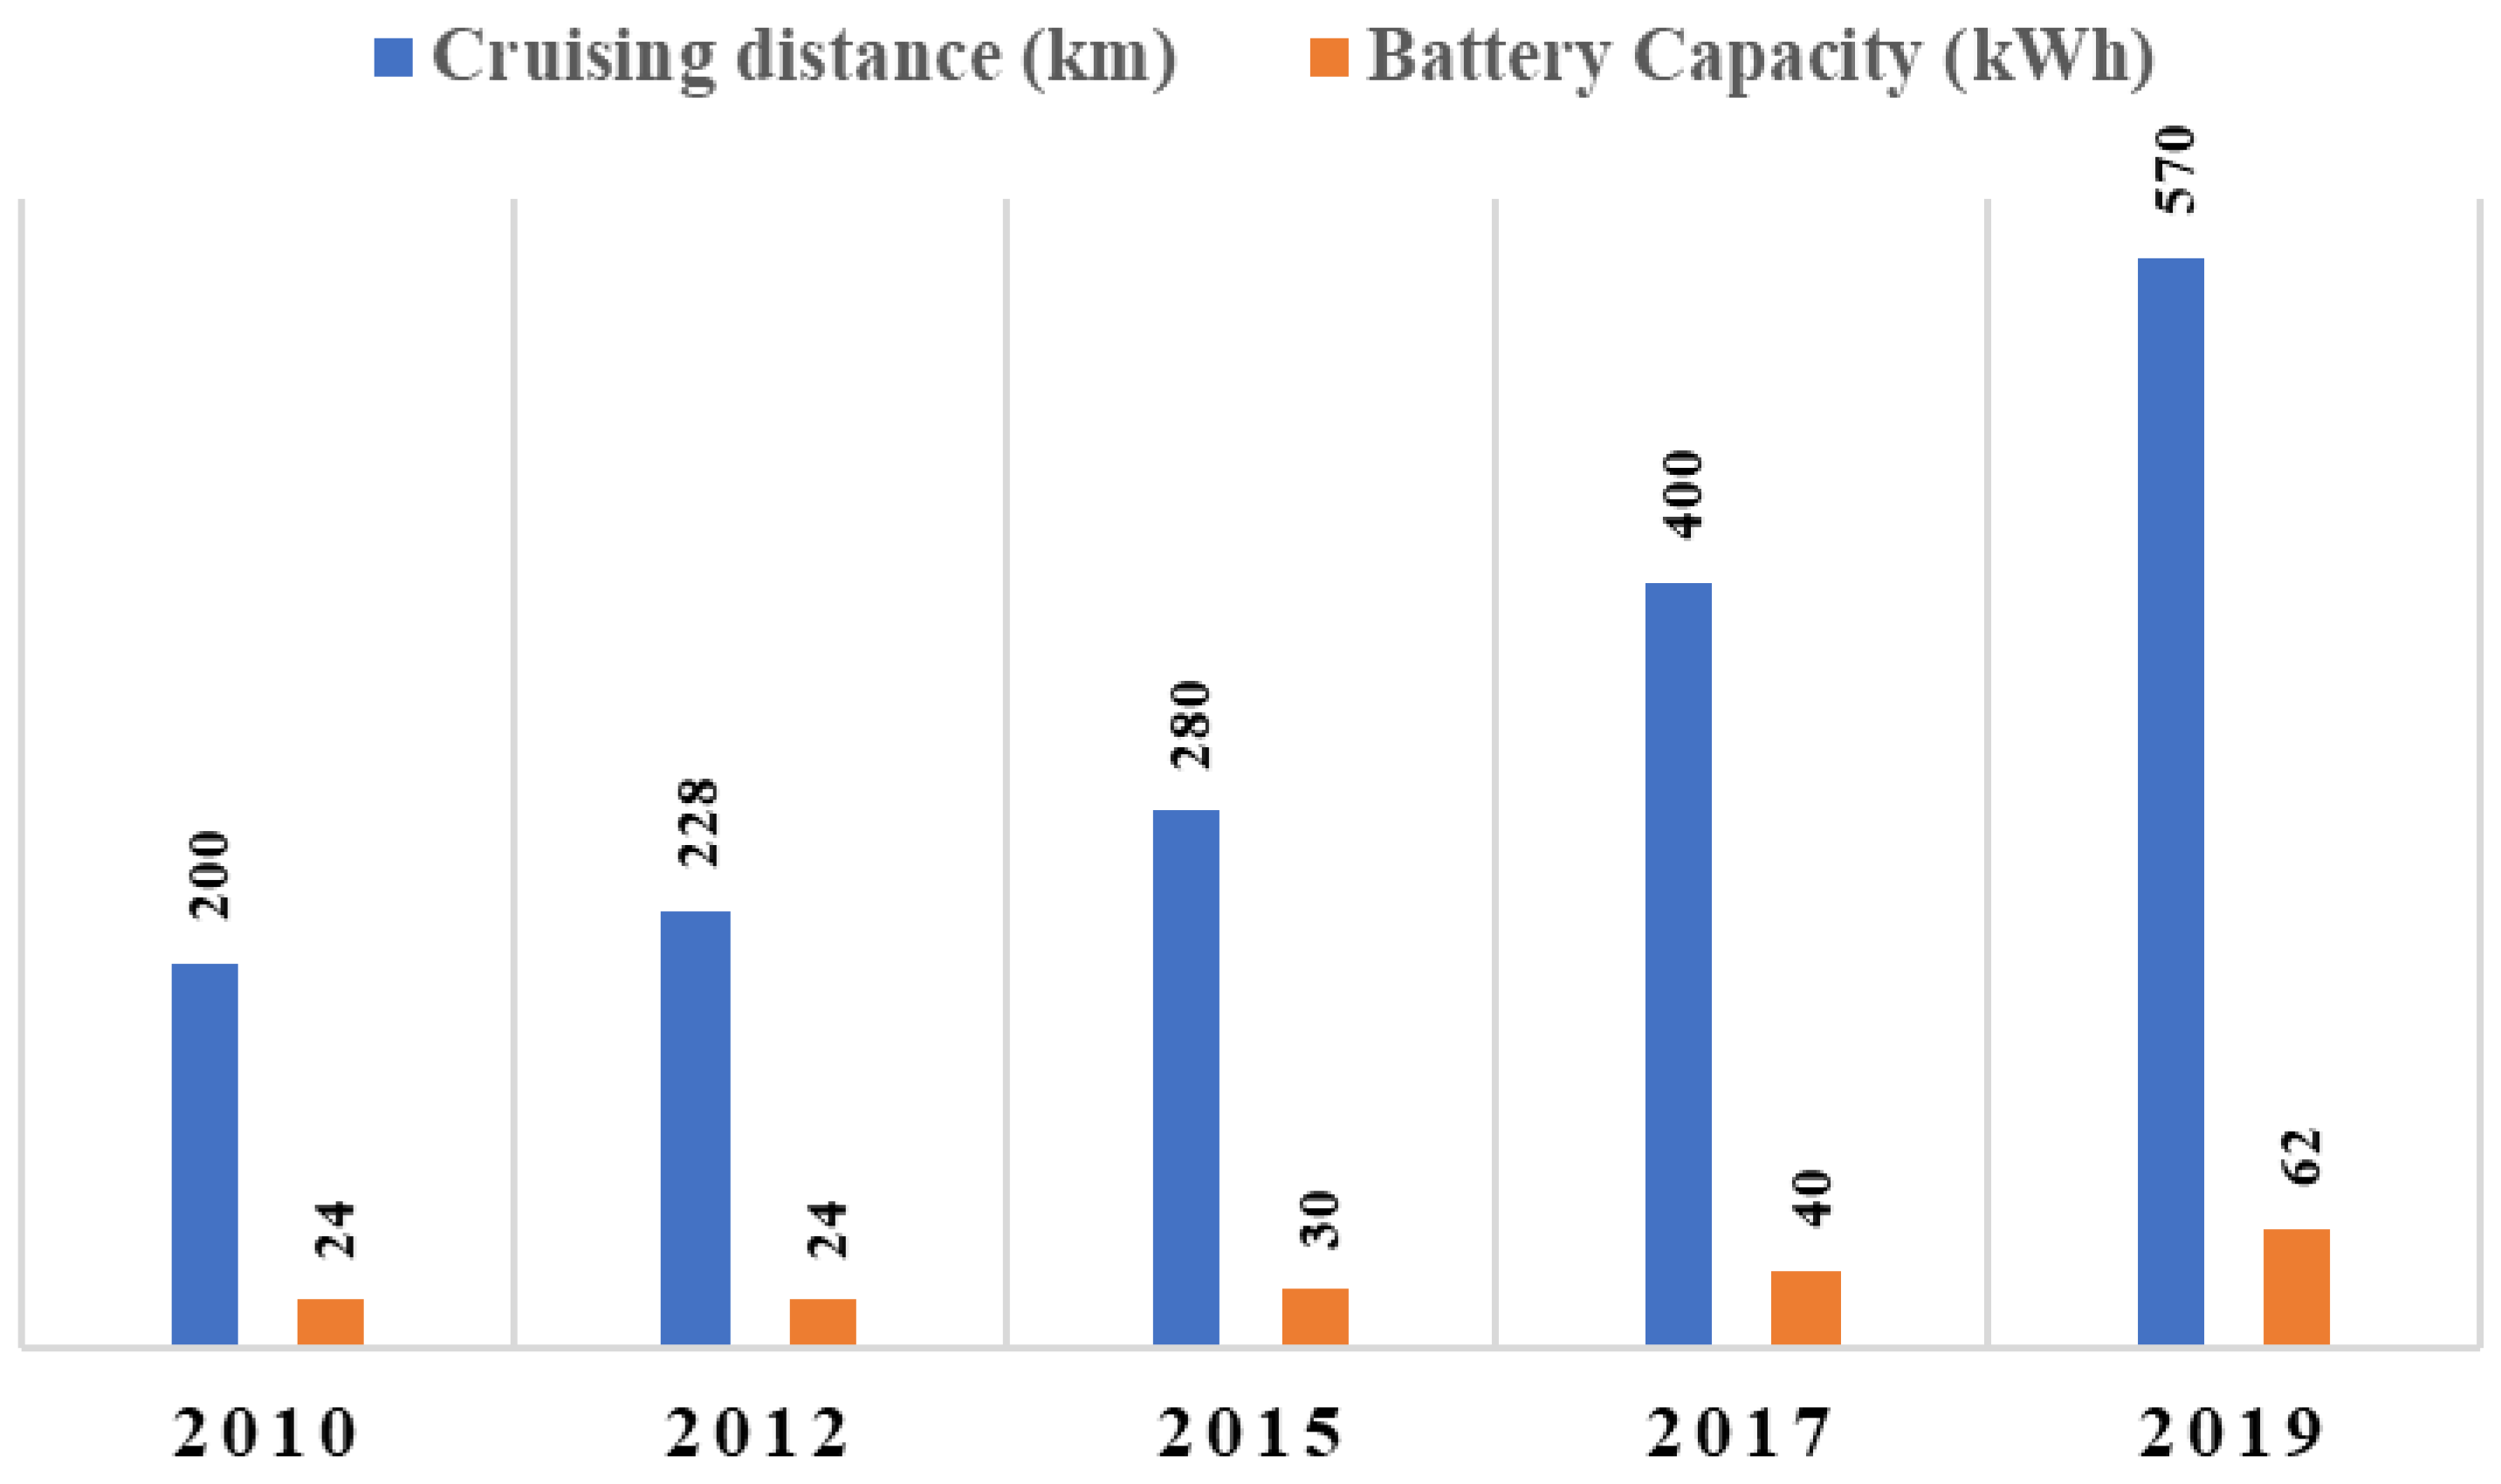
4.2. Travel Demand (Battery Capacity)
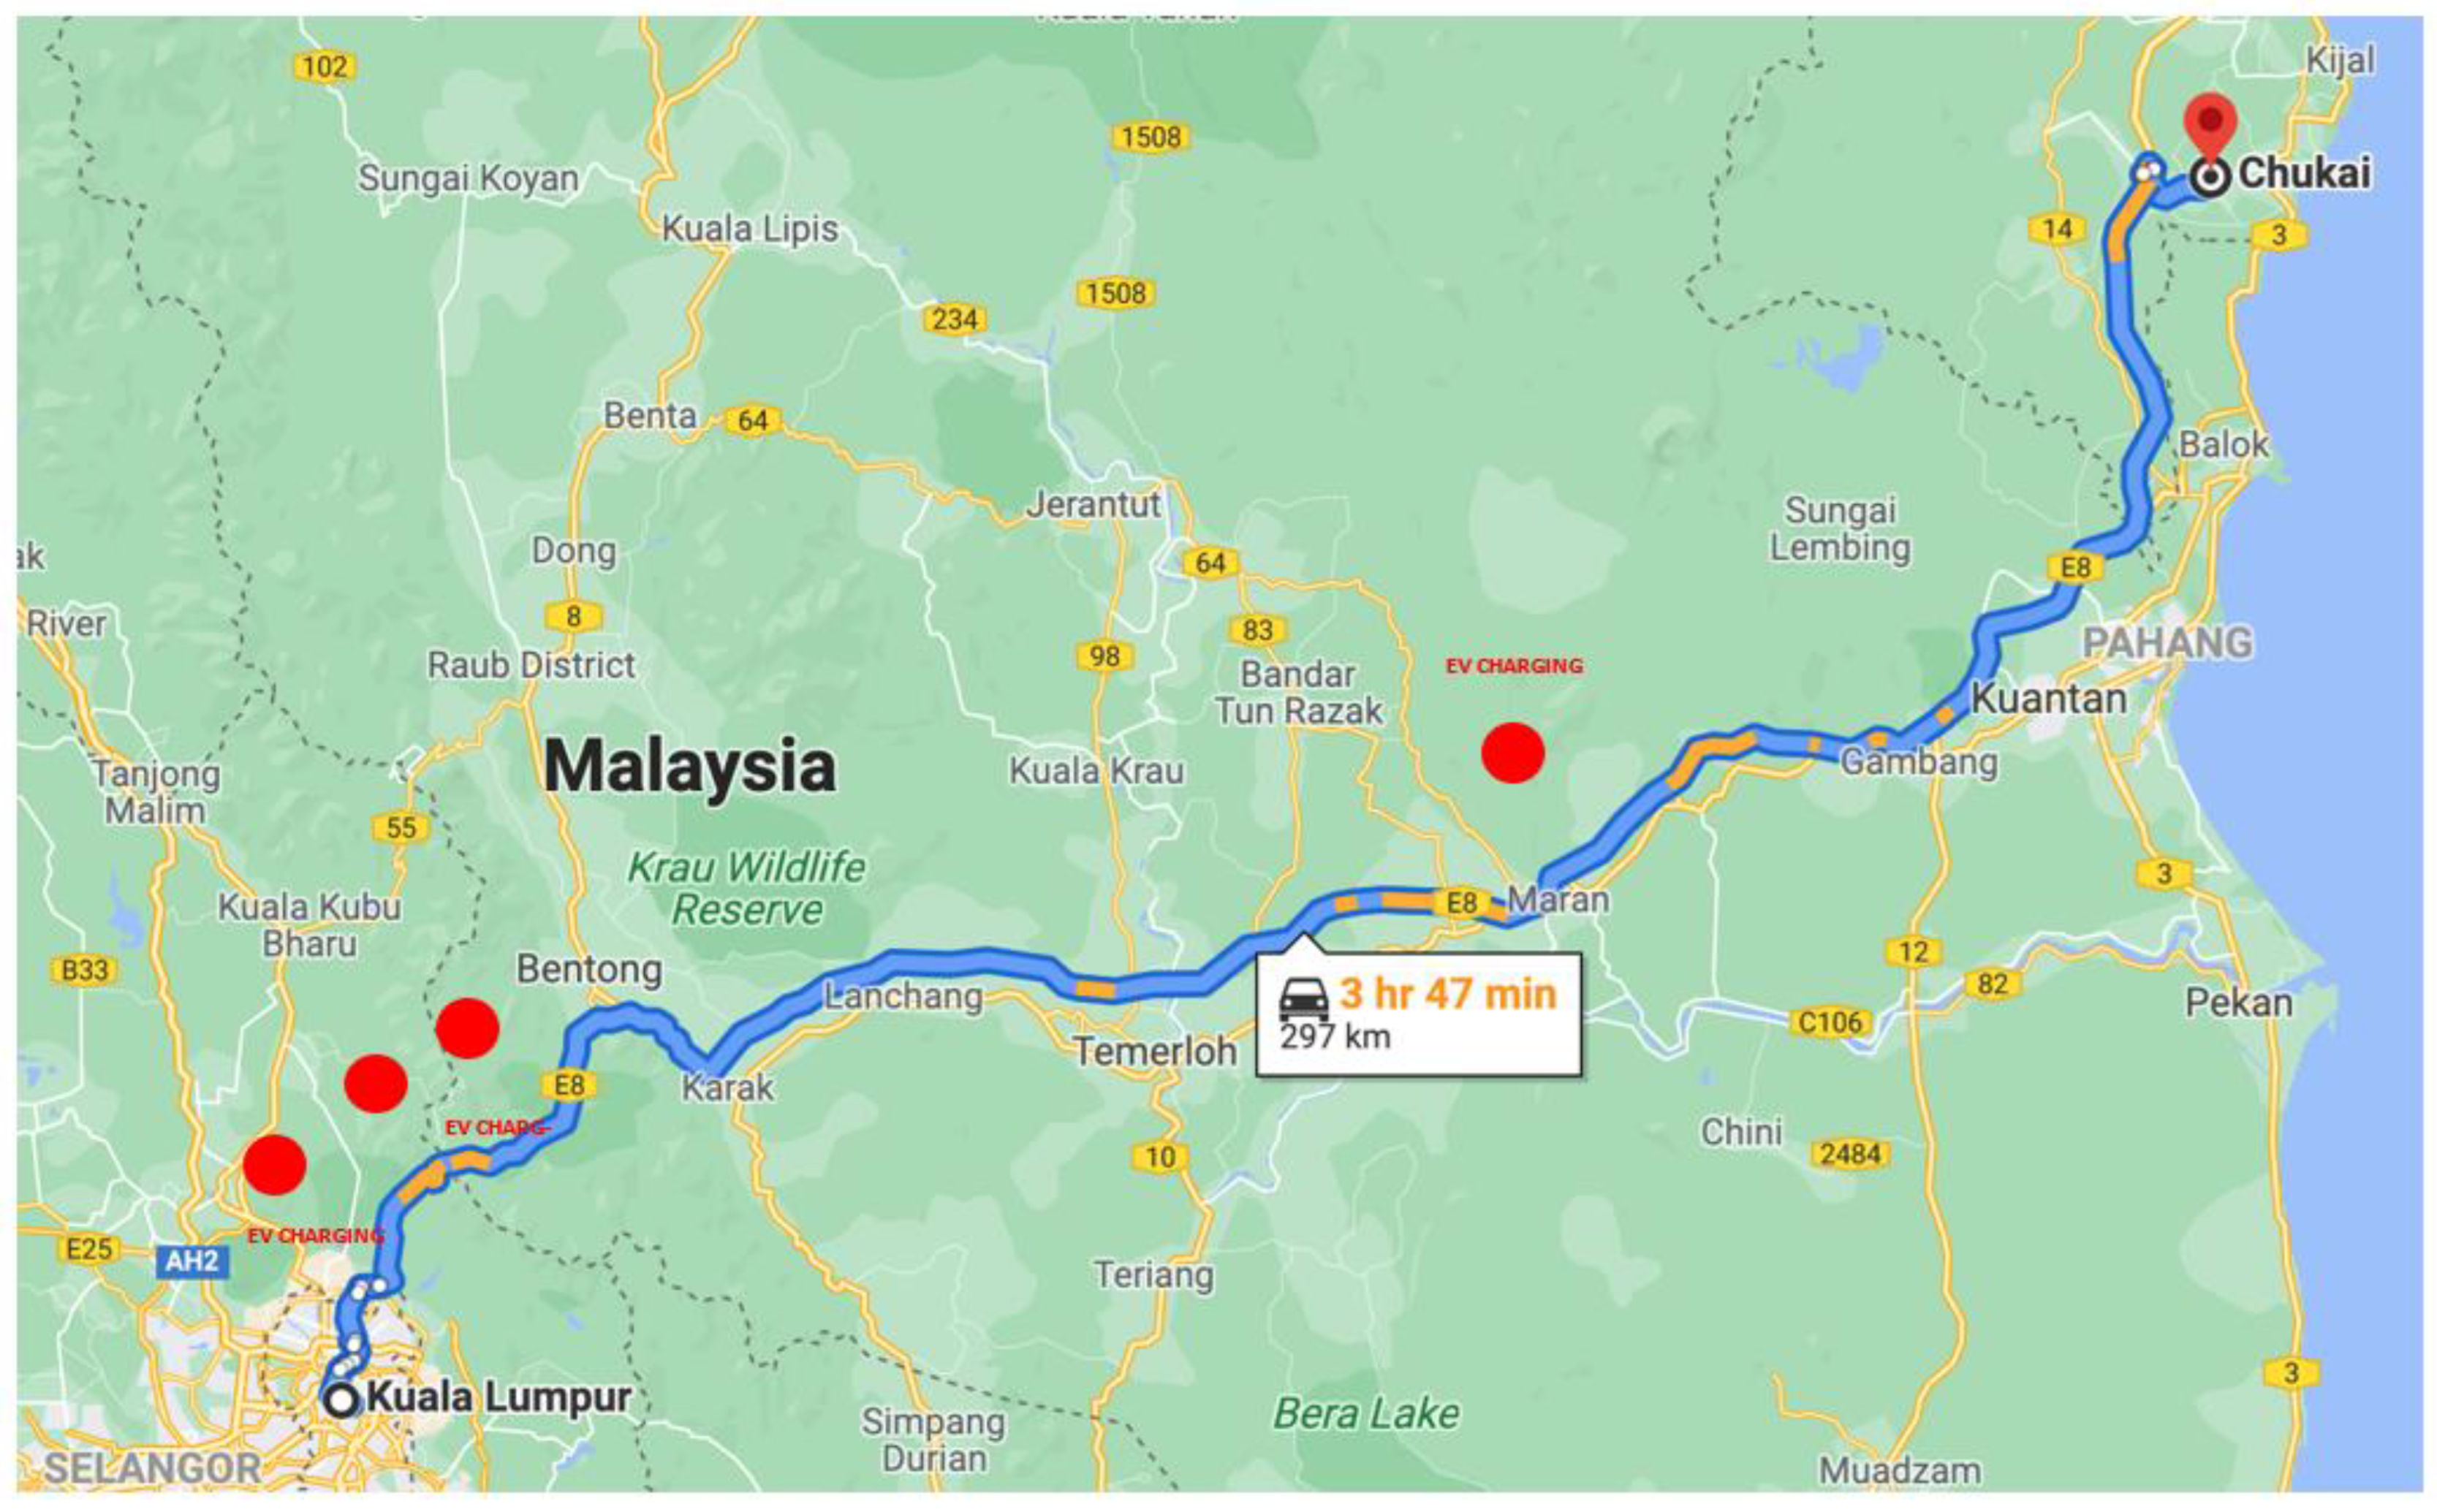
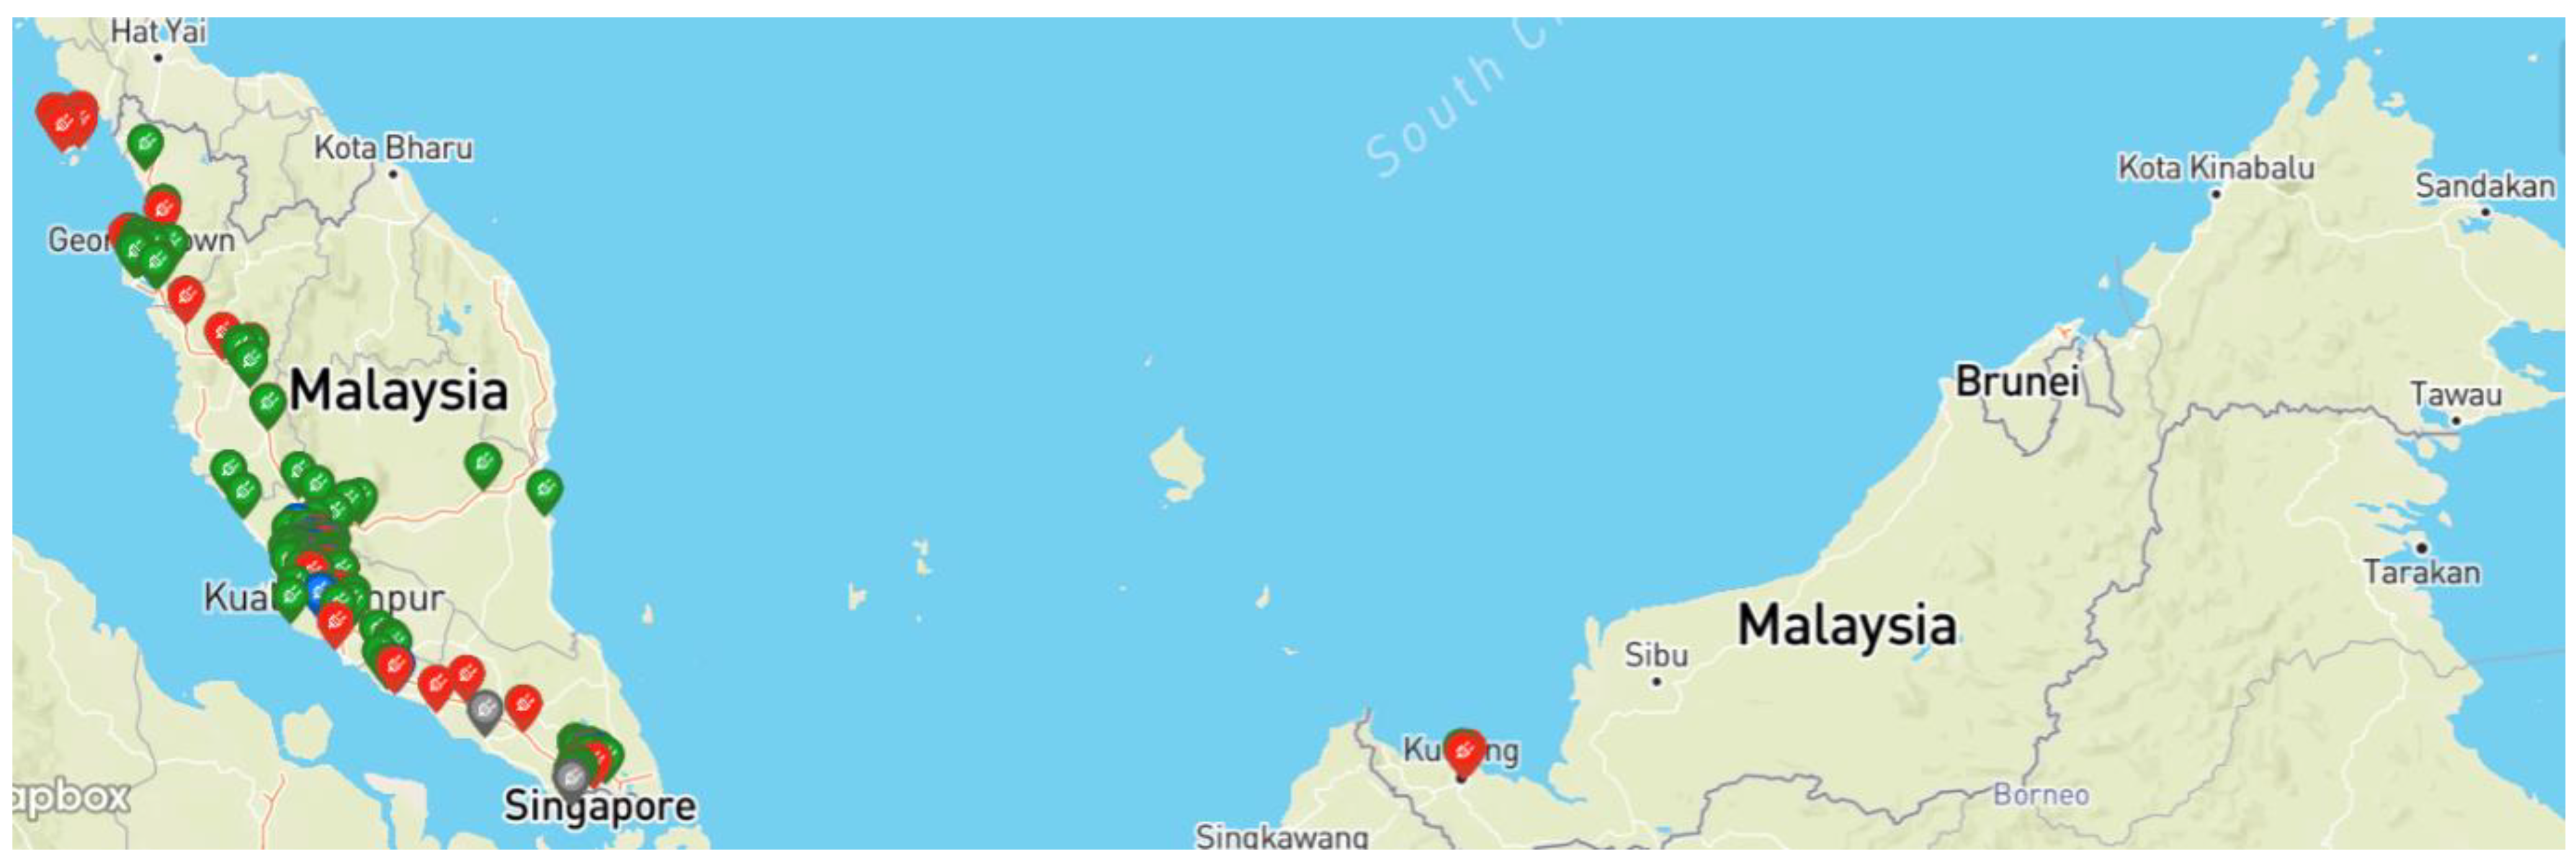
4.3. Charging Infrastructure
4.4. Charging Time
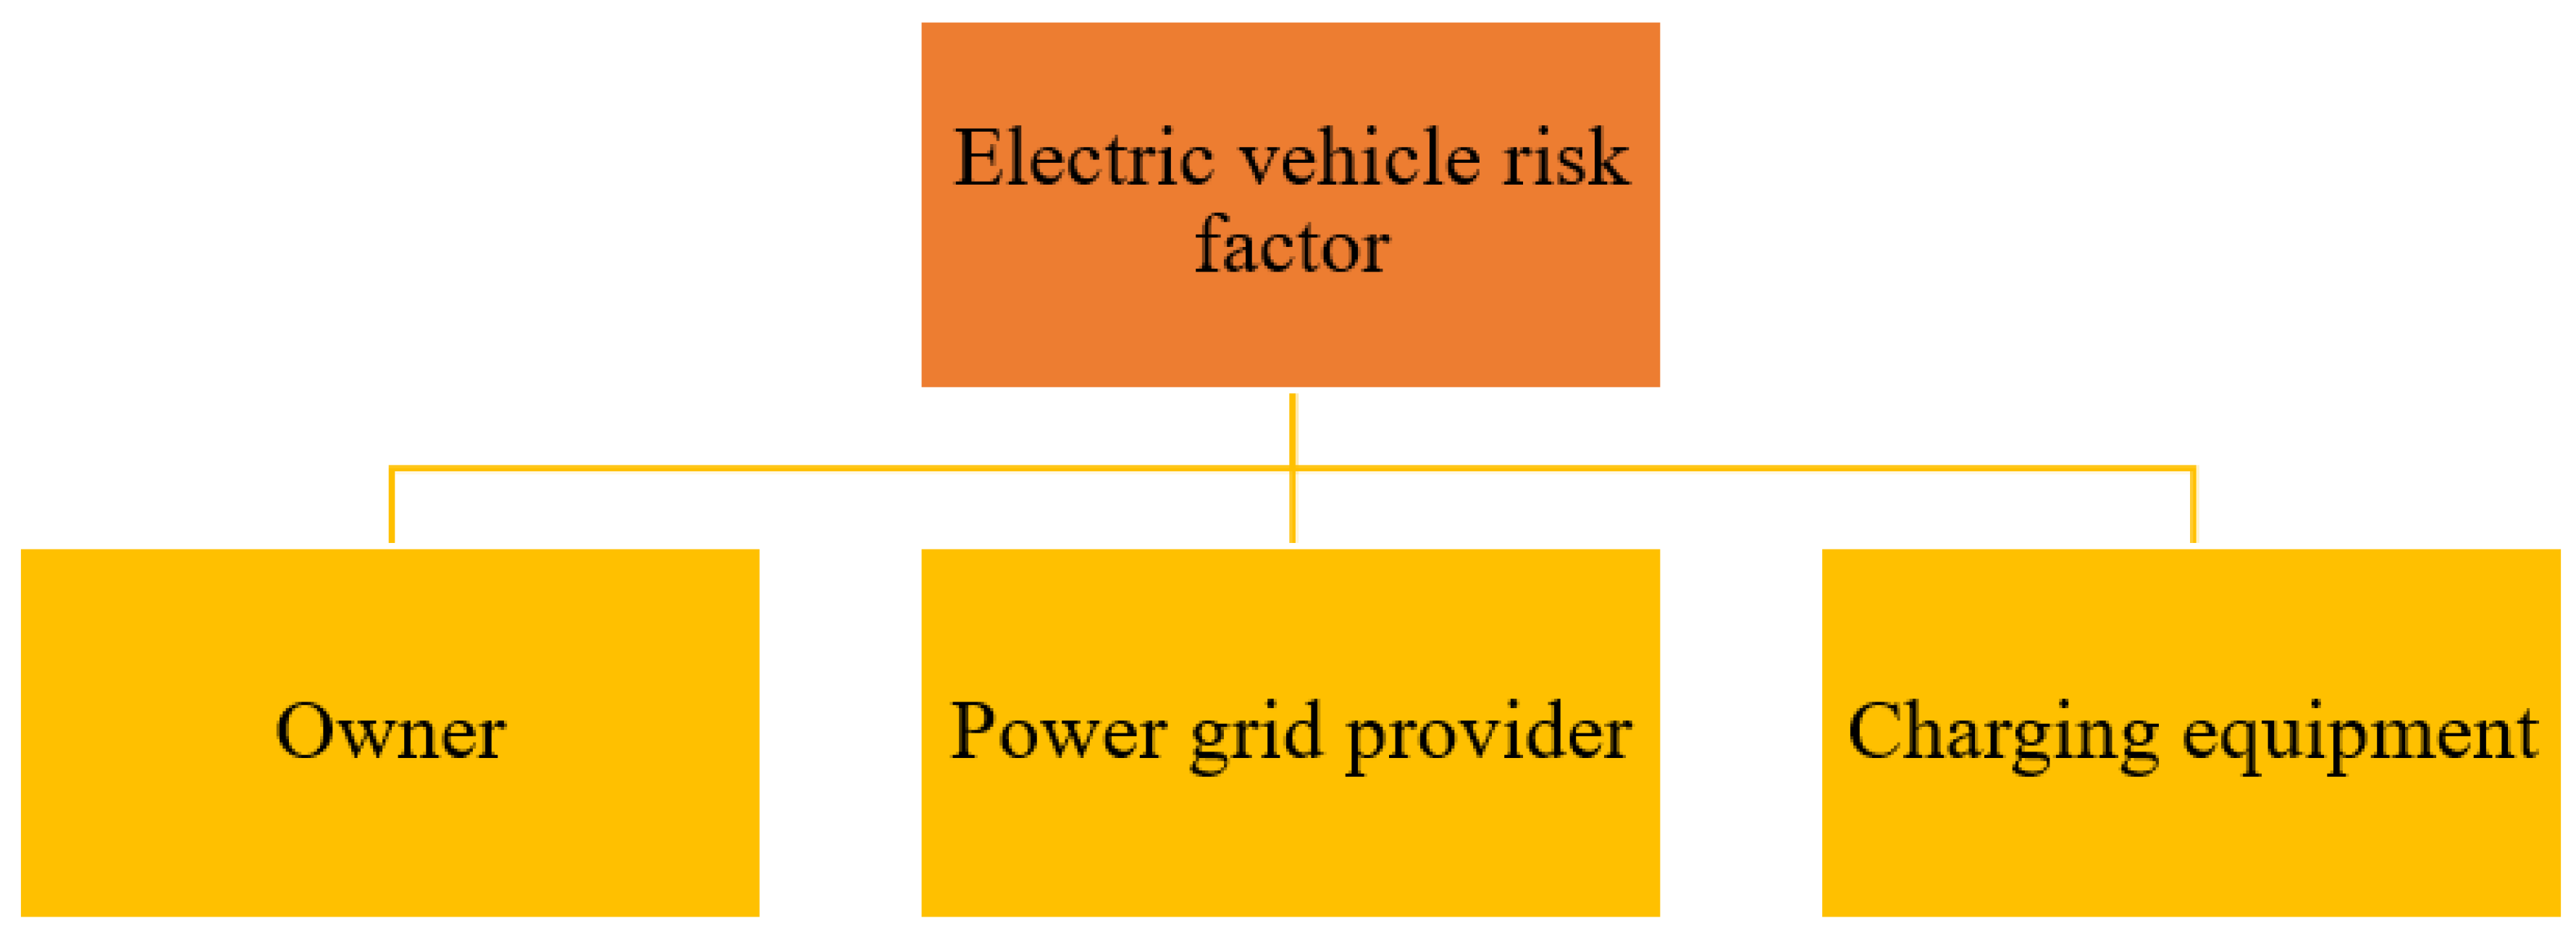
4.5. Safety and Risk
5. Potential Solutions and Future Research
5.1. Current Market Price
5.2. Travel Demand (Battery Capacity)
5.3. Charging Infrastructure
5.4. Charging Time
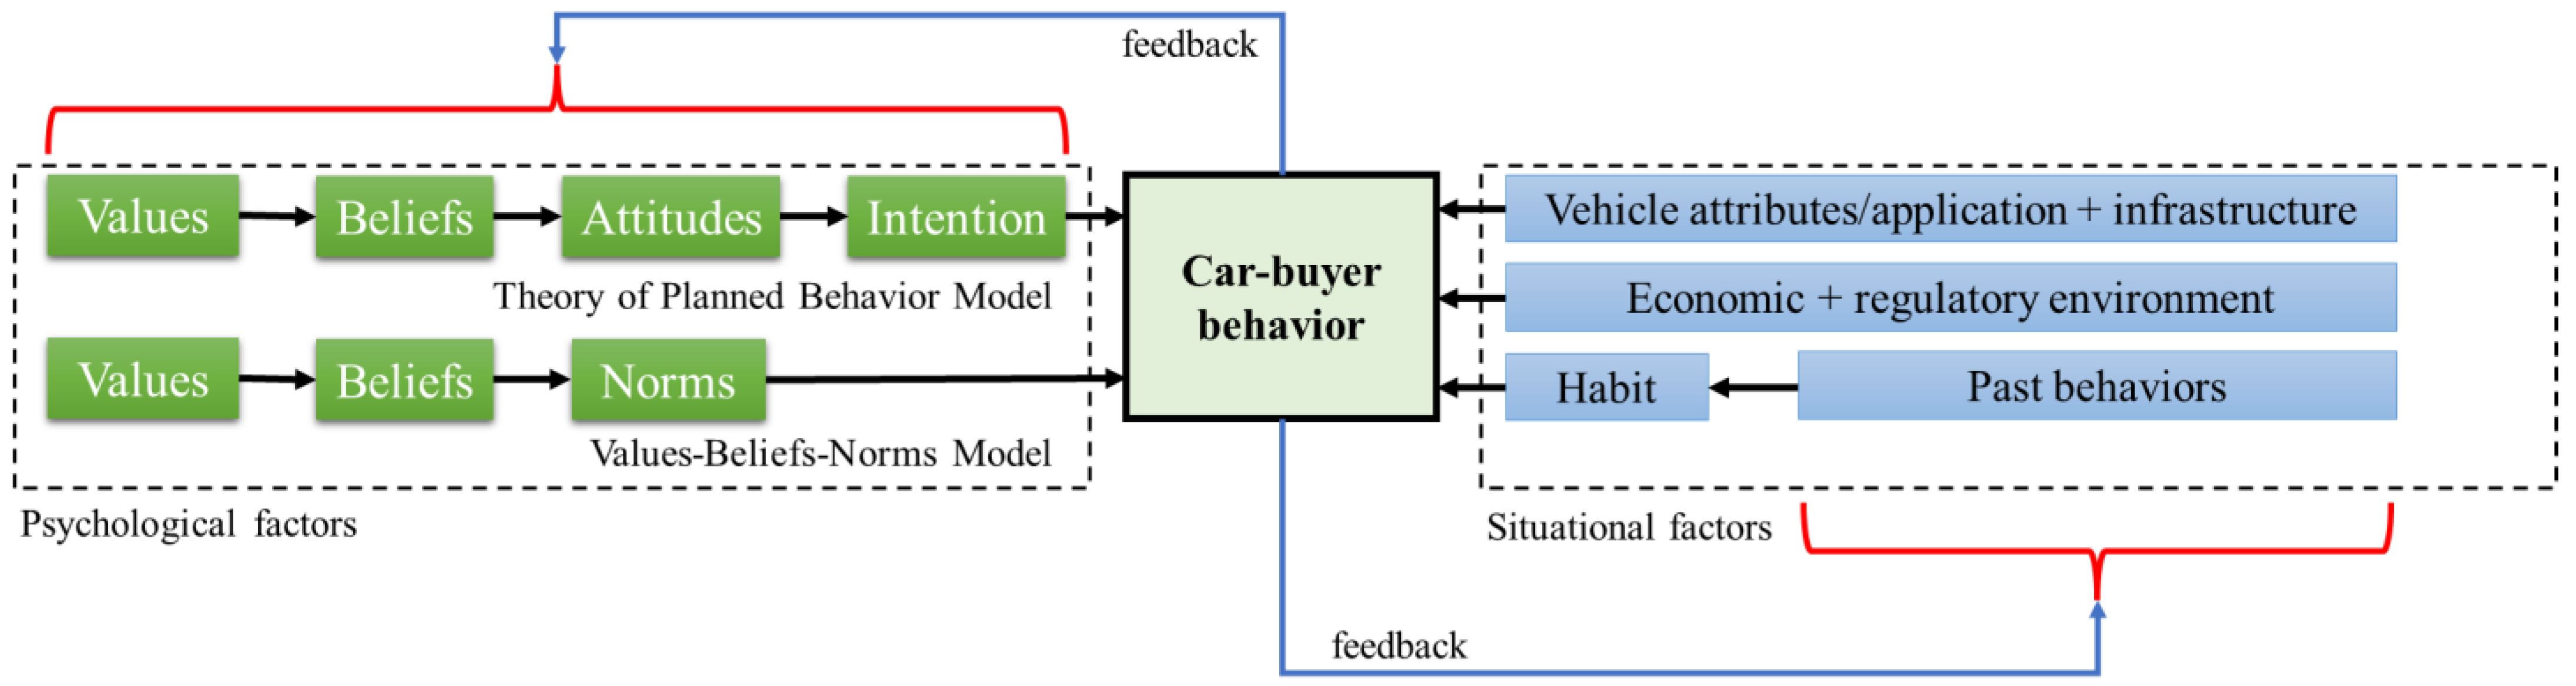
5.5. User Behaviour
6. Current EV Target and Policy Required
7. Conclusions
Author Contributions
Funding
Data Availability Statement
Conflicts of Interest
References
- Ashfaq, M.; Butt, O.; Selvaraj, J.; Rahim, N. Assessment of electric vehicle charging infrastructure and its impact on the electric grid: A review. Int. J. Green Energy 2021, 18, 657–686. [Google Scholar] [CrossRef]
- Hasanuzzaman, M.; Zubir, U.S.; Ilham, N.I.; Che, H.S. Global Electricity Demand, Generation, Grid System, and Renewable Energy Polices: A Review. Wiley Interdiscip. Rev. Energy Environ. 2017, 6, e222. [Google Scholar]
- Jackson, R.B.; Friedlingstein, P.; Andrew, R.M.; Canadell, J.G.; Le Quéré, C.; Peters, G.P. Persistent fossil fuel growth threatens the Paris Agreement and planetary health. Environ. Res. Lett. 2019, 14, 121001. [Google Scholar] [CrossRef] [Green Version]
- IEA. Tracking Transport 2020; IEA: Paris, France, 2020; Available online: https://www.iea.org/reports/tracking-transport-2020 (accessed on 14 June 2022).
- Li, Z.; Khajepour, A.; Song, J. A comprehensive review of the key technologies for pure electric vehicles. Energy 2019, 182, 824–839. [Google Scholar] [CrossRef]
- Piggot, G.; Verkuijl, C.; Van Asselt, H.; Lazarus, M. Curbing fossil fuel supply to achieve climate goals. Clim. Policy 2020, 20, 881–887. [Google Scholar] [CrossRef]
- Ghazouani, A.; Ben Jebli, M.; Shahzad, U. Impacts of environmental taxes and technologies on greenhouse gas emissions: Contextual evidence from leading emitter European countries. Environ. Sci. Pollut. Res. 2021, 28, 22758–22767. [Google Scholar] [CrossRef]
- Maennel, A.; Kim, H.-G. Comparison of Greenhouse Gas Reduction Potential through Renewable Energy Transition in South Korea and Germany. Energies 2018, 11, 206. [Google Scholar] [CrossRef] [Green Version]
- Kuramochi, T.; Roelfsema, M.; Hsu, A.; Lui, S.; Weinfurter, A.; Chan, S.; Hale, T.; Clapper, A.; Chang, A.; Höhne, N. Beyond national climate action: The impact of region, city, and business commitments on global greenhouse gas emissions. Clim. Policy 2020, 20, 275–291. [Google Scholar] [CrossRef] [Green Version]
- Flores, R.J.; Shaffer, B.P.; Brouwer, J. Electricity costs for an electric vehicle fueling station with Level 3 charging. Appl. Energy 2016, 169, 813–830. [Google Scholar] [CrossRef] [Green Version]
- Huber, J.; Dann, D.; Weinhardt, C. Probabilistic forecasts of time and energy flexibility in battery electric vehicle charging. Appl. Energy 2020, 262, 114525. [Google Scholar] [CrossRef]
- Zhang, X.; Bai, X.; Shang, J. Is subsidized electric vehicles adoption sustainable: Consumers’ perceptions and motivation toward incentive policies, environmental benefits, and risks. J. Clean. Prod. 2018, 192, 71–79. [Google Scholar] [CrossRef]
- Ulrich, L. GM bets big on batteries: A new $2.3 billion plant cranks out Ultium cells to power a future line of electric vehicles. IEEE Spectr. 2020, 57, 26–31. [Google Scholar] [CrossRef]
- Yiding, L.; Wenwei, W.; Cheng, L.; Xiaoguang, Y.; Fenghao, Z. A safety performance estimation model of lithium-ion batteries for electric vehicles under dynamic compression. Energy 2020, 215, 119050. [Google Scholar] [CrossRef]
- Gailani, A.; Mokidm, R.; El-Dalahmeh, M.; El-Dalahmeh, M.; Al-Greer, M. Analysis of Lithium-ion Battery Cells Degradation Based on Different Manufacturers. In Proceedings of the 2020 55th International Universities Power Engineering Conference (UPEC), Turin, Italy, 1–4 September 2020; pp. 1–6. [Google Scholar] [CrossRef]
- Ucer, E.; Koyuncu, I.; Kisacikoglu, M.C.; Yavuz, M.; Meintz, A.; Rames, C. Modeling and Analysis of a Fast Charging Station and Evaluation of Service Quality for Electric Vehicles. IEEE Trans. Transp. Electrif. 2019, 5, 215–225. [Google Scholar] [CrossRef]
- Energy-Commission. National Energy Balance 2014; Suruhanjaya Tenaga (Energy Commission): Putrajaya, Malaysia, 2014.
- Saidur, R.; Sattar, M.; Masjuki, H.; Ahmed, S.; Hashim, U. An estimation of the energy and exergy efficiencies for the energy resources consumption in the transportation sector in Malaysia. Energy Policy 2007, 35, 4018–4026. [Google Scholar] [CrossRef]
- Kosai, S.; Zakaria, S.; Che, H.S.; Hasanuzzaman; Rahim, N.A.; Tan, C.; Ahmad, R.D.R.; Abbas, A.R.; Nakano, K.; Yamasue, E.; et al. Estimation of Greenhouse Gas Emissions of Petrol, Biodiesel and Battery Electric Vehicles in Malaysia Based on Life Cycle Approach. Sustainability 2022, 14, 5783. [Google Scholar] [CrossRef]
- Ong, H.C.; Mahlia, T.M.I.; Masjuki, H. A review on energy pattern and policy for transportation sector in Malaysia. Renew. Sustain. Energy Rev. 2012, 16, 532–542. [Google Scholar] [CrossRef]
- Sang, Y.-N.; Bekhet, H.A. Modelling electric vehicle usage intentions: An empirical study in Malaysia. J. Clean. Prod. 2015, 92, 75–83. [Google Scholar] [CrossRef]
- Maghfiroh, M.F.N.; Pandyaswargo, A.H.; Onoda, H. Current Readiness Status of Electric Vehicles in Indonesia: Multistakeholder Perceptions. Sustainability 2021, 13, 13177. [Google Scholar] [CrossRef]
- Asadi, S.; Nilashi, M.; Samad, S.; Abdullah, R.; Mahmoud, M.; Alkinani, M.H.; Yadegaridehkordi, E. Factors impacting consumers’ intention toward adoption of electric vehicles in Malaysia. J. Clean. Prod. 2021, 282, 124474. [Google Scholar] [CrossRef]
- Tanwir, N.S.; Hamzah, M.I. Predicting Purchase Intention of Hybrid Electric Vehicles: Evidence from an Emerging Economy. World Electr. Veh. J. 2020, 11, 35. [Google Scholar] [CrossRef] [Green Version]
- Mustapa, S.; Ayodele, B.; Ishak, W.M.; Ayodele, F. Evaluation of Cost Competitiveness of Electric Vehicles in Malaysia Using Life Cycle Cost Analysis Approach. Sustainability 2020, 12, 5303. [Google Scholar] [CrossRef]
- Al-Ogaili, A.S.; Ramasamy, A.; Hashim, T.J.T.; Al-Masri, A.N.; Hoon, Y.; Jebur, M.N.; Verayiah, R.; Marsadek, M. Estimation of the energy consumption of battery driven electric buses by integrating digital elevation and longitudinal dynamic models: Malaysia as a case study. Appl. Energy 2020, 280, 115873. [Google Scholar] [CrossRef]
- Idris, A.M.; Ramli, A.F.; Burok, N.A.; Nabil, N.H.M.; Ab Muis, Z.; Shin, H.W. The Integration of Electric Vehicle with Power Generation Sector: A Scenario Analysis Based on Supply and Demand in Malaysia. Mater. Today Proc. 2019, 19, 1687–1692. [Google Scholar] [CrossRef]
- Adnan, N.; Nordin, S.M.; Rahman, I. Adoption of PHEV/EV in Malaysia: A critical review on predicting consumer behaviour. Renew. Sustain. Energy Rev. 2017, 72, 849–862. [Google Scholar] [CrossRef]
- Azmi, M.; Tokai, A. Electric vehicle and end-of-life vehicle estimation in Malaysia 2040. Environ. Syst. Decis. 2017, 37, 451–464. [Google Scholar] [CrossRef]
- Onn, C.C.; Mohd, N.S.; Yuen, C.W.; Loo, S.C.; Koting, S.; Rashid, A.F.A.; Karim, M.R.; Yusoff, S. Greenhouse gas emissions associated with electric vehicle charging: The impact of electricity generation mix in a developing country. Transp. Res. Part D Transp. Environ. 2018, 64, 15–22. [Google Scholar] [CrossRef]
- Azwan, M.; Norasikin, A.; Sopian, K.; Rahim, S.A.; Norman, K.; Ramdhan, K.; Solah, D. Assessment of electric vehicle and photovoltaic integration for oil palm mechanisation practise. J. Clean. Prod. 2017, 140, 1365–1375. [Google Scholar] [CrossRef]
- Sehil, K.; Alamri, B.; Alqarni, M.; Sallama, A.; Darwish, M. Empirical Analysis of High Voltage Battery Pack Cells for Electric Racing Vehicles. Energies 2021, 14, 1556. [Google Scholar] [CrossRef]
- Kumar, M.S.; Revankar, S. Development scheme and key technology of an electric vehicle: An overview. Renew. Sustain. Energy Rev. 2017, 70, 1266–1285. [Google Scholar] [CrossRef]
- Liu, H.; Ma, J.; Tong, L.; Ma, G.; Zheng, Z.; Yao, M. Investigation on the Potential of High Efficiency for Internal Combustion Engines. Energies 2018, 11, 513. [Google Scholar] [CrossRef] [Green Version]
- Xiong, H.; Liu, H.; Zhang, R.; Yu, L.; Zong, Z.; Zhang, M.; Li, Z. An energy matching method for battery electric vehicle and hydrogen fuel cell vehicle based on source energy consumption rate. Int. J. Hydrogen Energy 2019, 44, 29733–29742. [Google Scholar] [CrossRef]
- Yusuf, J.; Hasan, A.S.M.J.; Ula, S. Impacts of Plug-in Electric Vehicles on a Distribution Level Microgrid. In Proceedings of the 2019 North American Power Symposium (NAPS), Wichita, KS, USA, 13–15 October 2019; pp. 1–6. [Google Scholar] [CrossRef] [Green Version]
- Average Range vs Efficiency of US Electric Vehicles. Available online: https://afdc.energy.gov/data/10963 (accessed on 14 June 2022).
- Xing, Y.; Jenn, A.T.; Wang, Y.; Li, C.; Sun, S.; Ding, X.; Deng, S. Optimal range of plug-in electric vehicles in Beijing and Shanghai. Mitig. Adapt. Strat. Glob. Chang. 2020, 25, 441–458. [Google Scholar] [CrossRef]
- Liu, F.; Zhao, F.; Liu, Z.; Hao, H. China’s Electric Vehicle Deployment: Energy and Greenhouse Gas Emission Impacts. Energies 2018, 11, 3353. [Google Scholar] [CrossRef] [Green Version]
- IEA. Global EV Outlook 2020; IEA: Paris, France, 2020. [Google Scholar]
- Kumar, R.; Lamba, K.; Raman, A. Role of zero emission vehicles in sustainable transformation of the Indian automobile industry. Res. Transp. Econ. 2021, 90, 101064. [Google Scholar] [CrossRef]
- Rietmann, N.; Hügler, B.; Lieven, T. Forecasting the trajectory of electric vehicle sales and the consequences for worldwide CO2 emissions. J. Clean. Prod. 2020, 261, 121038. [Google Scholar] [CrossRef]
- IEA. Global EV Outlook 2018; IEA: Paris, France, 2018; Available online: https://www.iea.org/reports/global-ev-outlook-2018 (accessed on 14 June 2022).
- Green, R.; Wang, L.; Alam, M. The impact of plug-in hybrid electric vehicles on distribution networks: A review and outlook. Renew. Sustain. Energy Rev. 2011, 15, 544–553. [Google Scholar] [CrossRef]
- Bickert, S.; Kampker, A.; Greger, D. Developments of CO2-emissions and costs for small electric and combustion engine vehicles in Germany. Transp. Res. Part D Transp. Environ. 2015, 36, 138–151. [Google Scholar] [CrossRef]
- Maroufmashat, A.; Fowler, M. Policy Considerations for Zero-Emission Vehicle Infrastructure Incentives: Case Study in Canada. World Electr. Veh. J. 2018, 9, 38. [Google Scholar] [CrossRef] [Green Version]
- Haddadian, G.; Khodayar, M.; Shahidehpour, M. Accelerating the Global Adoption of Electric Vehicles: Barriers and Drivers. Electr. J. 2015, 28, 53–68. [Google Scholar] [CrossRef]
- Wang, M.Q. GREET 1.5—Transportation Fuel-Cycle Model. In Volume 1: Methodology, Development, Use, and Results; Argonne National Laboratory: Lemont, IL, USA, 1999. [Google Scholar]
- Knowles, M.; Scott, H.; Baglee, D. The effect of driving style on electric vehicle performance, economy and perception. Int. J. Electr. Hybrid Veh. 2012, 4, 228. [Google Scholar] [CrossRef]
- Goetzel, N.; Hasanuzzaman, M. An empirical analysis of electric vehicle cost trends: A case study in Germany. Res. Transp. Bus. Manag. 2022, 43. [Google Scholar] [CrossRef]
- IEA. World Energy Outlook 2017; IEA: Paris, France, 2017. [Google Scholar]
- Ayodele, B.V.; Mustapa, S.I. Life Cycle Cost Assessment of Electric Vehicles: A Review and Bibliometric Analysis. Sustainability 2020, 12, 2387. [Google Scholar] [CrossRef] [Green Version]
- Lau, K.; Muhamad, N.A.; Arief, Y.Z.; Tan, C.; Yatim, A. Grid-connected photovoltaic systems for Malaysian residential sector: Effects of component costs, feed-in tariffs, and carbon taxes. Energy 2016, 102, 65–82. [Google Scholar] [CrossRef]
- Azni, M.; Khalid, R.M. Hydrogen Fuel Cell Legal Framework in the United States, Germany, and South Korea—A Model for a Regulation in Malaysia. Sustainability 2021, 13, 2214. [Google Scholar] [CrossRef]
- Onn, C.C.; Chai, C.; Rashid, A.F.A.; Karim, M.R.; Yusoff, S. Vehicle electrification in a developing country: Status and issue, from a well-to-wheel perspective. Transp. Res. Part D Transp. Environ. 2017, 50, 192–201. [Google Scholar] [CrossRef]
- Leurent, F.; Windisch, E. Benefits and costs of electric vehicles for the public finances: An integrated valuation model based on input–output analysis, with application to France. Res. Transp. Econ. 2015, 50, 51–62. [Google Scholar] [CrossRef]
- Yeon Baik, R.H.; Hertzke, P.; Knupfer, S. Making Electric Vehicles Profitable. Available online: https://www.mckinsey.com/industries/automotive-and-assembly/our-insights/making-electric-vehicles-profitable. (accessed on 11 November 2021).
- Dharfizi, A.D.H.; Ghani, A.B.A.; Islam, R. Evaluating Malaysia’s fuel diversification strategies 1981–2016. Energy Policy 2020, 137, 111083. [Google Scholar] [CrossRef]
- Chau, K.; Wong, Y.; Chan, C. An overview of energy sources for electric vehicles. Energy Convers. Manag. 1999, 40, 1021–1039. [Google Scholar] [CrossRef]
- Chan, C.C. The State of the Art of Electric, Hybrid, and Fuel Cell Vehicles. Proc. IEEE 2007, 95, 704–718. [Google Scholar] [CrossRef]
- Zheng, X.; Lin, H.; Liu, Z.; Li, D.; Llopis-Albert, C.; Zeng, S. Manufacturing Decisions and Government Subsidies for Electric Vehicles in China: A Maximal Social Welfare Perspective. Sustainability 2018, 10, 672. [Google Scholar] [CrossRef] [Green Version]
- Enyedi, S. Electric cars—Challenges and trends. In Proceedings of the 2018 IEEE International Conference on Automation, Quality and Testing, Robotics (AQTR), Cluj-Napoca, Romania, 24–26 May 2018. [Google Scholar]
- Wen, W.; Yang, S.; Zhou, P.; Gao, S. Impacts of COVID-19 on the electric vehicle industry: Evidence from China. Renew. Sustain. Energy Rev. 2021, 144, 111024. [Google Scholar] [CrossRef]
- Kuzemko, C.; Bradshaw, M.; Bridge, G.; Goldthau, A.; Jewell, J.; Overland, I.; Scholten, D.; Van de Graaf, T.; Westphal, K. Covid-19 and the politics of sustainable energy transitions. Energy Res. Soc. Sci. 2020, 68, 101685. [Google Scholar] [CrossRef] [PubMed]
- Hu, X.; Wang, C.; Zhu, X.; Yao, C.; Ghadimi, P. Trade structure and risk transmission in the international automotive Li-ion batteries trade. Resour. Conserv. Recycl. 2021, 170, 105591. [Google Scholar] [CrossRef]
- Rezvani, Z.; Jansson, J.; Bodin, J. Advances in consumer electric vehicle adoption research: A review and research agenda. Transp. Res. Part D Transp. Environ. 2015, 34, 122–136. [Google Scholar] [CrossRef] [Green Version]
- Carley, S.; Krause, R.M.; Lane, B.W.; Graham, J.D. Intent to purchase a plug-in electric vehicle: A survey of early impressions in large US cites. Transp. Res. Part D Transp. Environ. 2013, 18, 39–45. [Google Scholar] [CrossRef]
- Lokesh, B.; Tay, J. A Framework for Electric Vehicle (EV) Charging in Singapore. Energy Procedia 2017, 143, 15–20. [Google Scholar] [CrossRef]
- Qiang, J.; Yang, L.; Ao, G.; Zhong, H. Battery Management System for Electric Vehicle Application. In Proceedings of the 2006 IEEE International Conference on Vehicular Electronics and Safety, Shanghai, China, 13–15 December 2006; pp. 134–138. [Google Scholar] [CrossRef]
- Han, X.; Lu, L.; Zheng, Y.; Feng, X.; Li, Z.; Li, J.; Ouyang, M. A review on the key issues of the lithium ion battery degradation among the whole life cycle. eTransportation 2019, 1, 100005. [Google Scholar] [CrossRef]
- Dong, X.; Chen, L.; Su, X.; Wang, Y.; Xia, Y. Flexible Aqueous Lithium-Ion Battery with High Safety and Large Volumetric Energy Density. Angew. Chem. Int. Ed. 2016, 55, 7474–7477. [Google Scholar] [CrossRef]
- Saw, L.H.; Ye, Y.; Tay, A.A. Integration issues of lithium-ion battery into electric vehicles battery pack. J. Clean. Prod. 2016, 113, 1032–1045. [Google Scholar] [CrossRef]
- Mruzek, M.; Gajdáč, I.; Kučera, L.; Barta, D. Analysis of Parameters Influencing Electric Vehicle Range. Procedia Eng. 2016, 134, 165–174. [Google Scholar] [CrossRef] [Green Version]
- Yusof, A. Timely Jolt Needed for EV Industry. 2022. Available online: https://www.nst.com.my/business/2022/01/763161/timely-jolt-needed-ev-industry (accessed on 14 June 2022).
- Electromaps. Charging Station on Malaysia. 2021. Available online: https://www.electromaps.com/en/charging-stations/malaysia (accessed on 14 June 2022).
- EV Charger. 2022. Available online: https://app.chargev.my/map (accessed on 14 June 2022).
- Gomez, J.; Morcos, M. Impact of EV battery chargers on the power quality of distribution systems. IEEE Trans. Power Deliv. 2003, 18, 975–981. [Google Scholar] [CrossRef]
- Alghoul, M.; Hammadi, F.; Amin, N.; Asim, N. The role of existing infrastructure of fuel stations in deploying solar charging systems, electric vehicles and solar energy: A preliminary analysis. Technol. Forecast. Soc. Chang. 2018, 137, 317–326. [Google Scholar] [CrossRef]
- Cross, J.D.; Hartshorn, R. My Electric Avenue: Integrating Electric Vehicles into the Electrical Networks. In Proceedings of the 6th Hybrid and Electric Vehicles Conference (HEVC 2016), London, UK, 2–3 November 2016. [Google Scholar]
- SAE International. Vehicle Architecture for Data Communications Standards—Class B Data Communications Network Interface; SAE International: Warrendale, PA, USA, 2009. [Google Scholar]
- GB/T. Connection Set for Conductive Charging of Electric Vehicles—Part 1: General Requirements; GBT: Beijing, China, 2015. [Google Scholar]
- International Electrotechnical Commission. Plugs, Socket-Outlets, Vehicle Couplers and Vehicle Inlets—Conductive Charging of Electric Vehicles—Part 1: General Requirements; IEC: Geneva, Switzerland, 2014. [Google Scholar]
- IEC. Plugs, Socket-Outlets, Vehicle Connectors and Vehicle Inlets—Conductive Charging of Electric Vehicles—Part 2: Dimensional Compatibility and Interchangeability Requirements for a.c. pin and Contact-Tube Accessories. 2016. Available online: https://www.sis.se/en/produkter/electrical-engineering/electrical-accessories/plugs-socketoutlets-couplers/ss-en-62196-2/ (accessed on 14 June 2022).
- IEC. Electric Vehicle Conductive Charging System—Part 1: General Requirements; IEC: London, UK, 2017. [Google Scholar]
- Sanguesa, J.; Torres-Sanz, V.; Garrido, P.; Martinez, F.; Marquez-Barja, J. A Review on Electric Vehicles: Technologies and Challenges. Smart Cities 2021, 4, 372–404. [Google Scholar] [CrossRef]
- Shi, C.; Tang, Y.; Khaligh, A. A Single-Phase Integrated Onboard Battery Charger Using Propulsion System for Plug-in Electric Vehicles. IEEE Trans. Veh. Technol. 2017, 66, 10899–10910. [Google Scholar] [CrossRef]
- Boglou, V.; Karavas, C.-S.; Arvanitis, K.; Karlis, A. A Fuzzy Energy Management Strategy for the Coordination of Electric Vehicle Charging in Low Voltage Distribution Grids. Energies 2020, 13, 3709. [Google Scholar] [CrossRef]
- Lee, H.; Clark, A. Charging the Future: Challenges and Opportunities for Electric Vehicle Adoption. Altern. Transp. Fuels eJournal 2018. [Google Scholar] [CrossRef] [Green Version]
- Zainal, N.A.; Zakaria, M.A.; Baarath, K.; Majeed, A.P.P.A. The normal vehicle forces effects of a two in-wheel electric vehicle towards the human brain on different road profile maneuver. SN Appl. Sci. 2020, 2, 1–8. [Google Scholar] [CrossRef] [Green Version]
- Kunjunni, B.; bin Zakaria, M.A.; Majeed, A.P.; Nasir, A.F.A.; Bin Peeie, M.H.; Hamid, U.Z.A. Effect of load distribution on longitudinal and lateral forces acting on each wheel of a compact electric vehicle. SN Appl. Sci. 2020, 2, 1–8. [Google Scholar] [CrossRef] [Green Version]
- Peeie, M.H.; Ogino, H.; Oshinoya, Y. Skid control of a small electric vehicle with two in-wheel motors: Simulation model of ABS and regenerative brake control. Int. J. Crashworthiness 2016, 21, 396–406. [Google Scholar] [CrossRef] [Green Version]
- Yang, X.; Yan, Z.; Huang, Y. Quantitative assessment of electric safety protection for electric vehicle charging equipment. In Proceedings of the 2017 International Conference on Circuits, Devices and Systems (ICCDS), Chengdu, China, 5–8 September 2017; pp. 89–94. [Google Scholar] [CrossRef]
- Bashash, S.; Moura, S.J.; Forman, J.C.; Fathy, H.K. Plug-in hybrid electric vehicle charge pattern optimization for energy cost and battery longevity. J. Power Sources 2011, 196, 541–549. [Google Scholar] [CrossRef]
- Hancock, E. Battery Pack Prices Reported below US $100/kWh for First Time. 2020. Available online: https://www.energy-storage.news/battery-pack-prices-reported-below-us100-kwh-for-first-time/ (accessed on 14 June 2022).
- Mo, J.Y.; Jeon, W. The Impact of Electric Vehicle Demand and Battery Recycling on Price Dynamics of Lithium-Ion Battery Cathode Materials: A Vector Error Correction Model (VECM) Analysis. Sustainability 2018, 10, 2870. [Google Scholar] [CrossRef] [Green Version]
- Nic Lutsey, M.N. Update on Electric Vehicle Costs in the United States through 2030; International Council on Clean Transportation: Washington, DC, USA, 2019. [Google Scholar]
- Berckmans, G.; Messagie, M.; Smekens, J.; Omar, N.; Vanhaverbeke, L.; Van Mierlo, J. Cost Projection of State of the Art Lithium-Ion Batteries for Electric Vehicles Up to 2030. Energies 2017, 10, 1314. [Google Scholar] [CrossRef] [Green Version]
- Hao, H.; Cheng, X.; Liu, Z.; Zhao, F. China’s traction battery technology roadmap: Targets, impacts and concerns. Energy Policy 2017, 108, 355–358. [Google Scholar] [CrossRef]
- Sarlioglu, B.; Morris, C.T.; Han, D.; Li, S. Benchmarking of electric and hybrid vehicle electric machines, power electronics, and batteries. In Proceedings of the 2015 Intl Aegean Conference on Electrical Machines & Power Electronics (ACEMP), 2015 Intl Conference on Optimization of Electrical & Electronic Equipment (OPTIM) & 2015 Intl Symposium on Advanced Electromechanical Motion Systems (ELECTROMOTION), Detroit, MI, USA, 16–19 June 2013. [Google Scholar]
- Du, J.; Ouyang, M.; Chen, J. Prospects for Chinese electric vehicle technologies in 2016–2020: Ambition and rationality. Energy 2017, 120, 584–596. [Google Scholar] [CrossRef]
- Li, M.; Lu, J.; Chen, Z.; Amine, K. 30 Years of Lithium-Ion Batteries. Adv. Mater. 2018, 30, 1800561. [Google Scholar] [CrossRef] [PubMed] [Green Version]
- Divakaran, A.M.; Minakshi, M.; Bahri, P.A.; Paul, S.; Kumari, P.; Manjunatha, K.N. Rational design on materials for developing next generation lithium-ion secondary battery. Prog. Solid State Chem. 2020, 62, 100298. [Google Scholar] [CrossRef]
- D’Souza, R.; Patsavellas, J.; Salonitis, K. Automated assembly of Li-ion vehicle batteries: A feasibility study. Procedia CIRP 2020, 93, 131–136. [Google Scholar] [CrossRef]
- Pyo, J.; Park, H.-W.; Jang, M.-S.; Choi, J.-S.; Kumar, S.K.S.; Kim, C.-G. Tubular laminated composite structural battery. Compos. Sci. Technol. 2021, 208, 108646. [Google Scholar] [CrossRef]
- Zhao, Y.; Zhao, D.; Zhang, T.; Li, H.; Zhang, B.; Zhenchong, Z. Preparation and multifunctional performance of carbon fiber-reinforced plastic composites for laminated structural batteries. Polym. Compos. 2020, 41, 3023–3033. [Google Scholar] [CrossRef]
- Hauser, A.; Kuhn, R. High-voltage battery management systems (BMS) for electric vehicles. In Advances in Battery Technologies for Electric Vehicles; Woodhead Publishing Series in Energy: Cambridge, UK, 2015; pp. 265–282. [Google Scholar] [CrossRef]
- Van Vliet, O.; Brouwer, A.S.; Kuramochi, T.; van den Broek, M.; Faaij, A. Energy use, cost and CO2 emissions of electric cars. J. Power Sources 2011, 196, 2298–2310. [Google Scholar] [CrossRef] [Green Version]
- Asna, M.; Shareef, H.; Achikkulath, P.; Mokhlis, H.; Errouissi, R.; Wahyudie, A. Analysis of an Optimal Planning Model for Electric Vehicle Fast-Charging Stations in Al Ain City, United Arab Emirates. IEEE Access 2021, 9, 73678–73694. [Google Scholar] [CrossRef]
- Islam, M.; Shareef, H.; Mohamed, A. Improved approach for electric vehicle rapid charging station placement and sizing using Google maps and binary lightning search algorithm. PLoS ONE 2017, 12, e0189170. [Google Scholar] [CrossRef] [Green Version]
- Amin, A.; Tareen, W.; Usman, M.; Ali, H.; Bari, I.; Horan, B.; Mekhilef, S.; Asif, M.; Ahmed, S.; Mahmood, A. A Review of Optimal Charging Strategy for Electric Vehicles under Dynamic Pricing Schemes in the Distribution Charging Network. Sustainability 2020, 12, 10160. [Google Scholar] [CrossRef]
- Yu, J.; Yang, P.; Zhang, K.; Wang, F.; Miao, L. Evaluating the Effect of Policies and the Development of Charging Infrastructure on Electric Vehicle Diffusion in China. Sustainability 2018, 10, 3394. [Google Scholar] [CrossRef] [Green Version]
- Suyono, H.; Rahman, M.T.; Mokhlis, H.; Othman, M.; Illias, H.A.; Mohamad, H. Optimal Scheduling of Plug-in Electric Vehicle Charging Including Time-of-Use Tariff to Minimize Cost and System Stress. Energies 2019, 12, 1500. [Google Scholar] [CrossRef] [Green Version]
- Yong, J.Y.; Ramachandaramurthy, V.K.; Tan, K.M.; Selvaraj, J. Experimental Validation of a Three-Phase Off-Board Electric Vehicle Charger With New Power Grid Voltage Control. IEEE Trans. Smart Grid 2016, 9, 2703–2713. [Google Scholar] [CrossRef]
- Lukic, S.; Pantic, Z. Cutting the Cord: Static and Dynamic Inductive Wireless Charging of Electric Vehicles. IEEE Electrif. Mag. 2013, 1, 57–64. [Google Scholar] [CrossRef]
- Yong, J.Y.; Ramachandaramurthy, V.K.; Tan, K.M.; Mithulananthan, N. A review on the state-of-the-art technologies of electric vehicle, its impacts and prospects. Renew. Sustain. Energy Rev. 2015, 49, 365–385. [Google Scholar] [CrossRef]
- Srdic, S.; Lukic, S. Toward Extreme Fast Charging: Challenges and Opportunities in Directly Connecting to Medium-Voltage Line. IEEE Electrif. Mag. 2019, 7, 22–31. [Google Scholar] [CrossRef]
- Bhatti, A.R.; Salam, Z.; Aziz, M.J.A.; Yee, K.P. A critical review of electric vehicle charging using solar photovoltaic. Int. J. Energy Res. 2015, 40, 439–461. [Google Scholar] [CrossRef]
- Yilmaz, M.; Krein, P.T. Review of Battery Charger Topologies, Charging Power Levels, and Infrastructure for Plug-In Electric and Hybrid Vehicles. IEEE Trans. Power Electron. 2012, 28, 2151–2169. [Google Scholar] [CrossRef]
- Al-Ogaili, A.S.; Hashim, T.J.T.; Rahmat, N.A.; Ramasamy, A.K.; Marsadek, M.B.; Faisal, M.; Hannan, M.A. Review on Scheduling, Clustering, and Forecasting Strategies for Controlling Electric Vehicle Charging: Challenges and Recommendations. IEEE Access 2019, 7, 128353–128371. [Google Scholar] [CrossRef]
- Cui, X.; Panda, B.; Chin, C.M.M.; Sakundarini, N.N.; Wang, C.-T.; Pareek, K. An application of evolutionary computation algorithm in multidisciplinary design optimization of battery packs for electric vehicle. Energy Storage 2020, 2, e158. [Google Scholar] [CrossRef]
- A Hannan, M.; Hoque, M.; Peng, S.E.; Uddin, M.N. Lithium-Ion Battery Charge Equalization Algorithm for Electric Vehicle Applications. IEEE Trans. Ind. Appl. 2017, 53, 2541–2549. [Google Scholar] [CrossRef]
- Hannan, M.A.; Hoque, M.D.M.; Hussain, A.; Yusof, Y.; Ker, A.P.J. State-of-the-Art and Energy Management System of Lithium-Ion Batteries in Electric Vehicle Applications: Issues and Recommendations. IEEE Access Spec. Sect. Adv. Energy Storage Technol. Appl. 2018, 6, 19362–19378. [Google Scholar] [CrossRef]
- Sadeq, T.; Wai, C.K.; Morris, E.; Tarbosh, Q.A.; Aydoğdu, Ö. Optimal Control Strategy to Maximize the Performance of Hybrid Energy Storage System for Electric Vehicle Considering Topography Information. IEEE Access 2020, 8, 216994–217007. [Google Scholar] [CrossRef]
- Veerendra, A.S.; Mohamed, M.R.; Leung, P.K.; Shah, A.A. Hybrid power management for fuel cell/supercapacitor series hybrid electric vehicle. Int. J. Green Energy 2020, 18, 128–143. [Google Scholar] [CrossRef]
- Bhatti, A.R.; Salam, Z.; Sultana, B.; Rasheed, N.; Awan, A.B.; Sultana, U.; Younas, M. Optimized sizing of photovoltaic grid-connected electric vehicle charging system using particle swarm optimization. Int. J. Energy Res. 2018, 43, 500–522. [Google Scholar] [CrossRef]
- Hwang, H.; Lee, Y.; Seo, I.; Chung, Y. Successful pathway for locally driven fuel cell electric vehicle adoption: Early evidence from South Korea. Int. J. Hydrogen Energy 2021, 46, 21764–21776. [Google Scholar] [CrossRef]
- Vasant, P.; Marmolejo, J.A.; Litvinchev, I.; Aguilar, R.R. Nature-inspired meta-heuristics approaches for charging plug-in hybrid electric vehicle. Wirel. Netw. 2019, 26, 4753–4766. [Google Scholar] [CrossRef]
- Shrivastava, P.; Soon, T.K.; Bin Idris, M.Y.I.; Mekhilef, S.; Adnan, S.B.R.S. Combined State of Charge and State of Energy Estimation of Lithium-Ion Battery Using Dual Forgetting Factor-Based Adaptive Extended Kalman Filter for Electric Vehicle Applications. IEEE Trans. Veh. Technol. 2021, 70, 1200–1215. [Google Scholar] [CrossRef]
- Tan, A.S.T.; Ishak, D.; Mohd-Mokhtar, R.; Lee, S.S.; Idris, N.R.N. Predictive control of plug-in electric vehicle chargers with photovoltaic integration. J. Mod. Power Syst. Clean Energy 2018, 6, 1264–1276. [Google Scholar] [CrossRef] [Green Version]
- Minami, S. Toward a Successful EV and HEV Market in ASEAN: Lessons from the Past. J. Asian Electr. Veh. 2017, 15, 1775–1780. [Google Scholar] [CrossRef] [Green Version]
- Larson, P.D.; Viáfara, J.; Parsons, R.V.; Elias, A. Consumer attitudes about electric cars: Pricing analysis and policy implications. Transp. Res. Part A Policy Pract. 2014, 69, 299–314. [Google Scholar] [CrossRef]
- Huang, X.; Ge, J. Electric vehicle development in Beijing: An analysis of consumer purchase intention. J. Clean. Prod. 2019, 216, 361–372. [Google Scholar] [CrossRef]
- Adnan, N.; Nordin, S.; Rahman, I.; Vasant, P.M.; Noor, A. A comprehensive review on theoretical framework-based electric vehicle consumer adoption research. Int. J. Energy Res. 2016, 41, 317–335. [Google Scholar] [CrossRef]
- Rogers, E.M. Diffusion of Innovations: Modifications of a Model for Telecommunications. In Die Diffusion von Innovationen in der Telekommunikation; Stoetzer, M.-W., Mahler, A., Eds.; Springer: Berlin/Heidelberg, Germany, 1995; pp. 25–38. [Google Scholar]
- Stacks, D.W.; Salwen, M.B. (Eds.) An Integrated Approach to Communication Theory and Research, 2nd ed.; Routledge: London, UK, 2008. [Google Scholar]
- Stafford, E.R. Bridging the Chasm: An Early Adopter’s Perspectives on How Electric Vehicles Can Go Mainstream. Sustainability 2017, 10, 164–176. [Google Scholar] [CrossRef]
- Massiani, J.; Gohs, A. The choice of Bass model coefficients to forecast diffusion for innovative products: An empirical investigation for new automotive technologies. Res. Transp. Econ. 2015, 50, 17–28. [Google Scholar] [CrossRef] [Green Version]
- Schmidt, D.M.; Braun, F.; Schenkl, S.A.; Mörtl, M. Interview study: How can Product-Service Systems increase customer acceptance of innovations? CIRP J. Manuf. Sci. Technol. 2016, 15, 82–93. [Google Scholar] [CrossRef]
- Lane, B.; Potter, S. The adoption of cleaner vehicles in the UK: Exploring the consumer attitude–action gap. J. Clean. Prod. 2007, 15, 1085–1092. [Google Scholar] [CrossRef]
- Kara, S.; Li, W.; Sadjiva, N. Life Cycle Cost Analysis of Electrical Vehicles in Australia. Procedia CIRP 2017, 61, 767–772. [Google Scholar] [CrossRef]
- Krishnan, V.V.; Koshy, B.I. Evaluating the factors influencing purchase intention of electric vehicles in households owning conventional vehicles. Case Stud. Transp. Policy 2021, 9, 1122–1129. [Google Scholar] [CrossRef]
- Malmgren, I. Quantifying the Societal Benefits of Electric Vehicles. World Electr. Veh. J. 2016, 8, 996–1007. [Google Scholar] [CrossRef] [Green Version]
- Lebeau, K.; Lebeau, P.; Macharis, C.; Van Mierlo, J. How expensive are electric vehicles? A total cost of ownership analysis. World Electr. Veh. J. 2013, 6, 996–1007. [Google Scholar] [CrossRef] [Green Version]
- Mahmoudi, C.; Flah, A.; Lita, L. An overview of electric Vehicle concept and power management strategies. In Proceedings of the 2014 International Conference on Electrical Sciences and Technologies in Maghreb (CISTEM), Tunis, Tunisia, 3–6 November 2014. [Google Scholar]
- Jenn, A.; Springel, K.; Gopal, A.R. Effectiveness of electric vehicle incentives in the United States. Energy Policy 2018, 119, 349–356. [Google Scholar] [CrossRef]
- Debnath, R.; Bardhan, R.; Reiner, D.M.; Miller, J.R. Political, economic, social, technological, legal and environmental dimensions of electric vehicle adoption in the United States: A social-media interaction analysis. Renew. Sustain. Energy Rev. 2021, 152, 111707. [Google Scholar] [CrossRef]
- Xue, C.; Zhou, H.; Wu, Q.; Wu, X.; Xu, X. Impact of Incentive Policies and Other Socio-Economic Factors on Electric Vehicle Market Share: A Panel Data Analysis from the 20 Countries. Sustainability 2021, 13, 2928. [Google Scholar] [CrossRef]
- Li, W.; Long, R.; Chen, H.; Dou, B.; Chen, F.; Zheng, X.; He, Z. Public Preference for Electric Vehicle Incentive Policies in China: A Conjoint Analysis. Int. J. Environ. Res. Public Health 2020, 17, 318. [Google Scholar] [CrossRef] [Green Version]
- Skjølsvold, T.M.; Ryghaug, M. Temporal echoes and cross-geography policy effects: Multiple levels of transition governance and the electric vehicle breakthrough. Environ. Innov. Soc. Transit. 2019, 35, 232–240. [Google Scholar] [CrossRef]
- Nanaki, E.A.; Kiartzis, S.; Xydis, G.A. Are only demand-based policy incentives enough to deploy electromobility? Policy Stud. 2020, 43, 370–386. [Google Scholar] [CrossRef]
- Hong, J.; Koo, Y.; Jeong, G.; Lee, J. Ex-ante evaluation of profitability and government’s subsidy policy on vehicle-to-grid system. Energy Policy 2012, 42, 95–104. [Google Scholar] [CrossRef]
- Sun, H.; Wan, Y.; Lv, H. System Dynamics Model for the Evolutionary Behaviour of Government Enterprises and Consumers in China’s New Energy Vehicle Market. Sustainability 2020, 12, 1578. [Google Scholar] [CrossRef] [Green Version]
- Kim, E.; Heo, E. Key Drivers behind the Adoption of Electric Vehicle in Korea: An Analysis of the Revealed Preferences. Sustainability 2019, 11, 6854. [Google Scholar] [CrossRef] [Green Version]
- Kwon, Y.; Son, S.; Jang, K. Evaluation of incentive policies for electric vehicles: An experimental study on Jeju Island. Transp. Res. Part A Policy Pract. 2018, 116, 404–412. [Google Scholar] [CrossRef]
- Lee, H.; Kim, J.; Seo, S.; Sim, M.; Kim, J. Exploring behaviors and satisfaction of micro-electric vehicle sharing service users: Evidence from a demonstration project in Jeju Island, South Korea. Sustain. Cities Soc. 2022, 79, 103673. [Google Scholar] [CrossRef]
- White Paper, When Might Lower-Income Drivers Benefit from Electric Vehicles? Quantifying the Economic Equity Implications of Electric Vehicle Adoption, When Might Lower-Income Drivers Benefit from Electric Vehicles? Quantifying the Economic Equity Implications of Electric Vehicle Adoption. Available online: theicct.org (accessed on 14 June 2022).
- Bjerkan, K.Y.; Nørbech, T.E.; Nordtømme, M.E. Incentives for promoting Battery Electric Vehicle (BEV) adoption in Norway. Transp. Res. Part D Transp. Environ. 2016, 43, 169–180. [Google Scholar] [CrossRef] [Green Version]
- Son, S.; Lee, S. Analyzing Satisfaction of Battery Electric Vehicle Users and Factors Associating with the Satisfaction: A Case Study of Jeju. J. Korean Soc. Transp. 2019, 37, 168–177. [Google Scholar] [CrossRef]
- Randall, C. South Korea Announces New EV Subsidies for 2020. 2019. Available online: https://www.electrive.com/2019/09/02/south-korea-announces-ev-subsidies/ (accessed on 14 June 2022).
- Adnan, N.; Nordin, S.M.; Rahman, I.; Amini, M.H. A market modeling review study on predicting Malaysian consumer behavior towards widespread adoption of PHEV/EV. Environ. Sci. Pollut. Res. 2017, 24, 17955–17975. [Google Scholar] [CrossRef]
- Vafaei-Zadeh, A.; Wong, T.-K.; Hanifah, H.; Teoh, A.P.; Nawaser, K. Modelling electric vehicle purchase intention among generation Y consumers in Malaysia. Res. Transp. Bus. Manag. 2022, 43, 100784. [Google Scholar] [CrossRef]


| Ref. | Year | Issue Considered | Methodology | Key Outcomes |
|---|---|---|---|---|
| [23] | 2020 | analysis of consumer EV purchase intention | theory of planned behavior (TPB), Norm Activation Model (NAM) structural equation model (SEM) for empirical analysis of the factors influencing | 72.89%-interest in EV—UG students 50%-interest in EV—Age 35–45 60%/40%-interest in EV—Male/Female |
| [24] | 2020 | analysis of consumer EV purchase intention | development of a research model based on the Theory of Planned Behavior, integrated with environmental knowledge as an additional variable | outcomes imply the need for governments and practitioners to execute appropriate approaches in nurturing the public’s motivation |
| [25] | 2020 | well-to-wheel life cycle assessment of GHGs for ICEV, HEV, EVs | Using the existing data in Malaysia, life cost analysis (LCC) of two EVs was computed and compared with HEVs and ICVs | Nissan Leaf and BMW i3s EVs with LCC of 1.75 USD and 2.5 USD per km are not cost-competitive changes in the components of the operating costs significantly influence the accumulated cost of ownership of the EVs |
| [26] | 2020 | EV and battery electric buses (BEBs) | The core of this work builds on a novel framework to determine the energy demand of BEBs and their potential as a replacement for diesel-powered buses in transportation networks. | a penetration impact of the BEB charging demand during daytime and nighttime in an urban area in Kuala Lumpur |
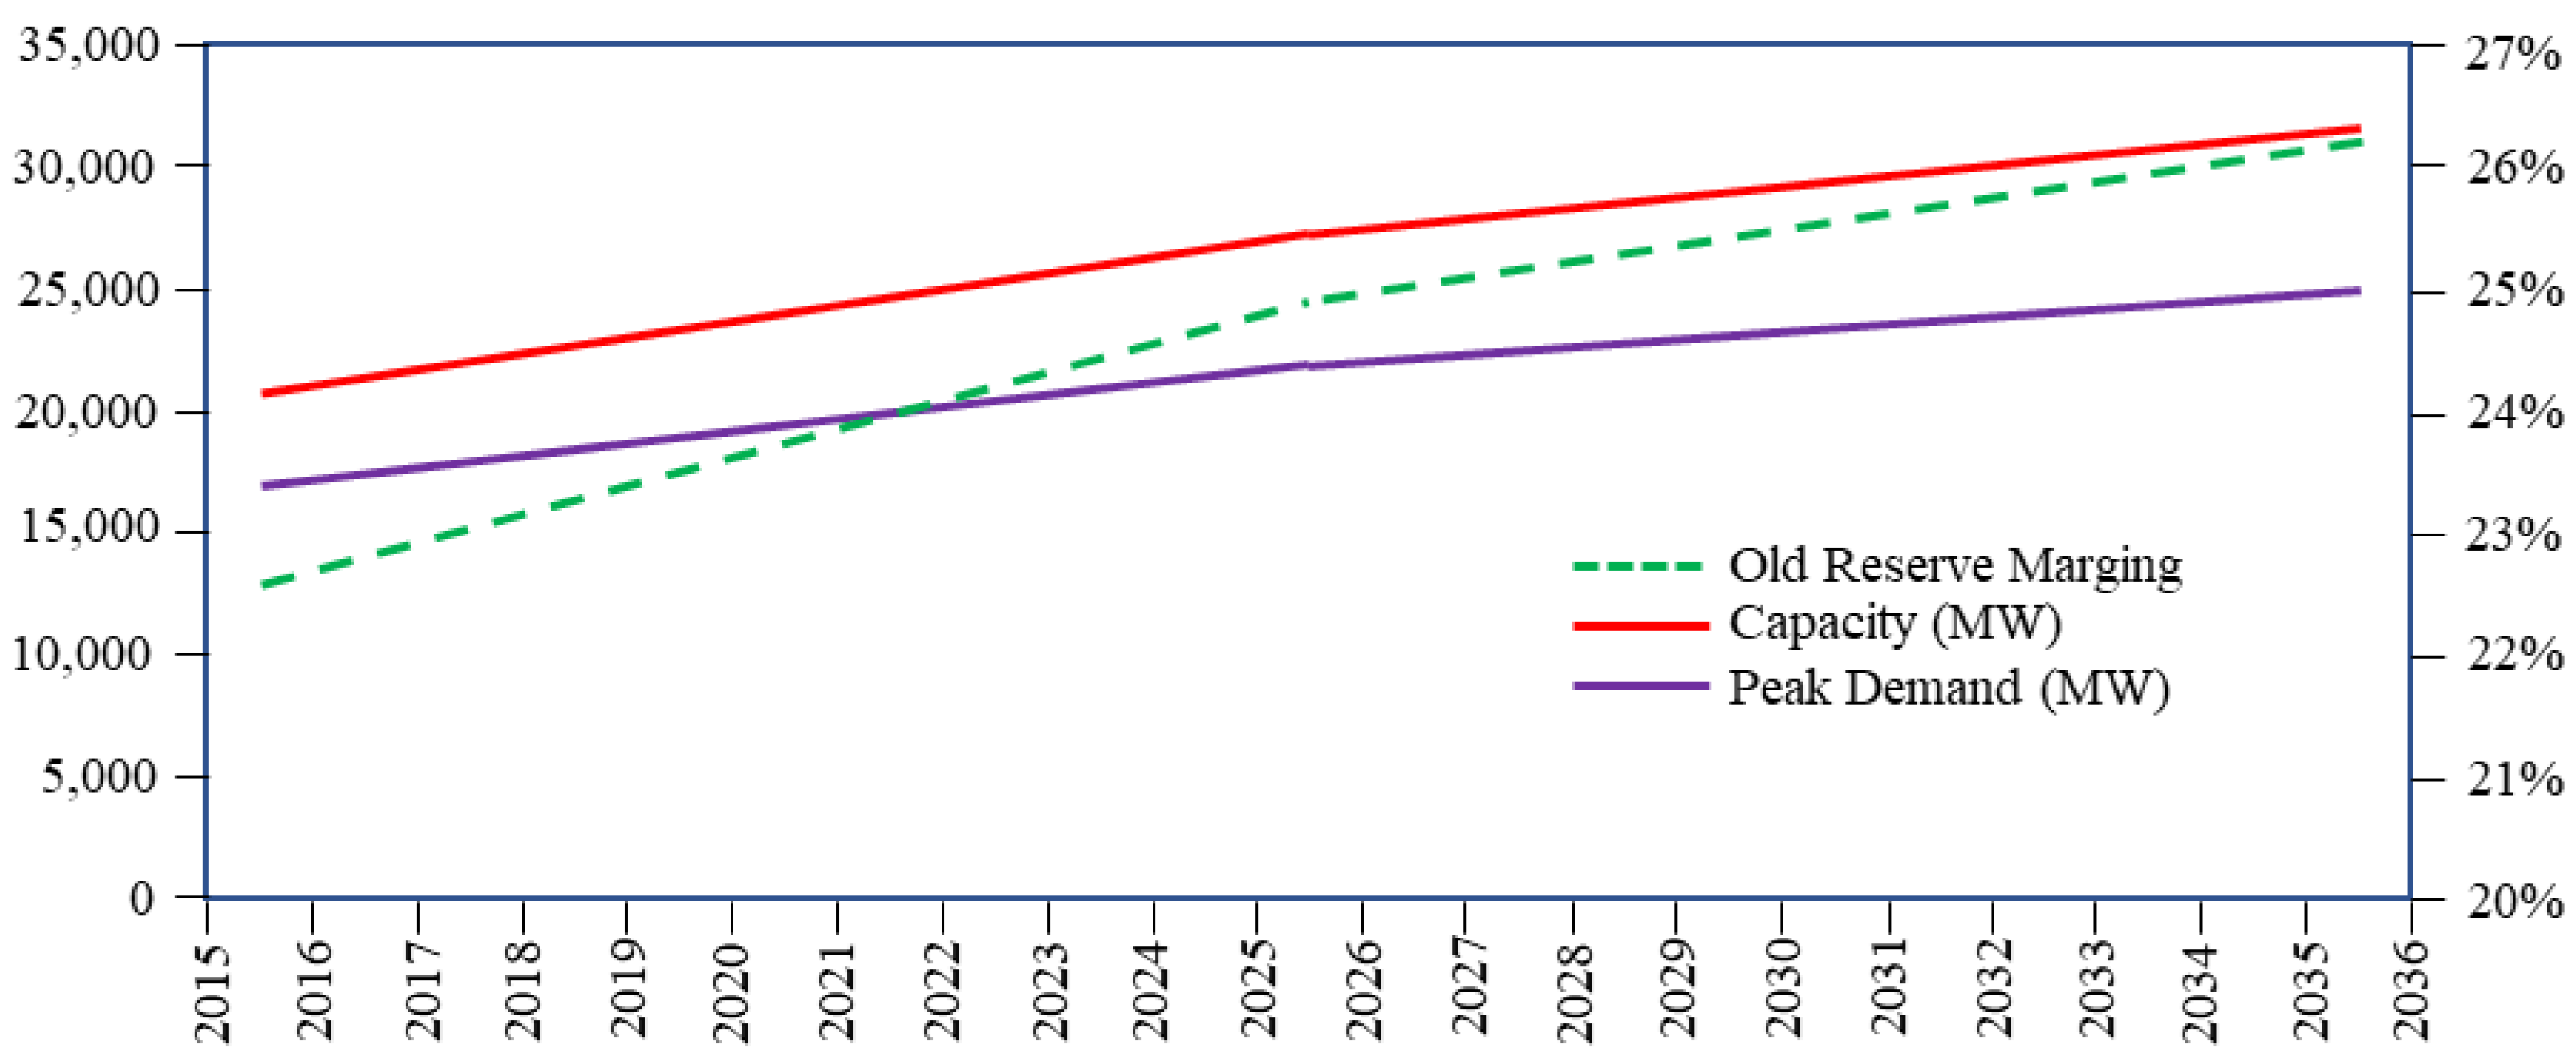
| [27] | 2019 | Impact of EVs on the current power sector | The first step is searching for relevant data, the second is data screening, and the third is data selection. The data was mainly collected from National Electric Mobility Blueprint Report | The electricity reserve margin without electric vehicle demand is between 22.54% to 26.18% estimate cost will be 111,319,000 RM per year for 10,000 units EV connected to the grid; electricity cost and infrastructure cost With present gird, the implementation of 100,000 units of EV on the road is possible |
| [28] | 2017 | analysis of consumer EV purchase intention | To date, public attitudes towards PHEV/EVs have been considered under very diverse conceptual frameworks. Take the three main features of the Theory of Planned Behavior (TPB) model, attitude PHEV/EVs’ adoption, Subjective Norm (SN), and Perceived Behavioral Control (PBC) into account. | the collective outcome of ‘hyperbolic discounting’ has a direct effect between the consumers’ environmental concern-based intention and the actual adoption of PHEVs/EVs |
| [29] | 2017 | estimate the number of electric vehicles (EVs), hybrid electric vehicles (HEVs) as well as end-of-life vehicles (ELVs) generated until 2040 | dynamics modeling method was used | passenger vehicle market will hit saturation point in 2030 at 12 million active vehicles In 2040, HEV is estimated to be 1.43 million units, while EV is estimated to be 43,000. By reducing vehicle ownership tax, adapting mandatory inspection, and improving emission regulation, HEV and EV can be increased by an additional 70%. |
| [30] | 2017 | well-to-wheel life cycle assessment of GHGs for ICEV, HEV, EVs | Greenhouse gas emissions associated with electric vehicle charging: The impact of the electricity generation mix in a Malaysia | running EVs with the national grid will produce an average of 7% more GHG emissions than HEVs at the same distance. However, they will produce an average of 19% less GHG emissions than the ICEVs |
| [31] | 2016 | an on-board solar photovoltaic system for EV | analyze the integration of solar photovoltaic and electric vehicles in farm mechanization HOMER software, field test validation, MPOB Keratong research station | the onboard solar photovoltaic system is the best-suited method 10 watts of additional power was required for the electric vehicle to move at constant velocity with the addition of 43 kg of solar panels and its frame |
| [21] | 2014 | analysis of consumer EV purchase intention | This research determines the key predictors influencing electric vehicles usage intention | observed seven key predictors be statistically significant towards electric vehicles usage intention |
| Car Model | Retail Price (RM) |
|---|---|
| Electric Car | |
| MINI Electric Cooper SE | 221,878.00 |
| Nissan Leaf | 188,888.00 |
| BMW i3s | 278,800.00 |
| Porsche Taycan | 584,561.00 |
| Conventional Car | |
| Myvi 1.5 L AV | 52,697.00 |
| Myvi 1.3 L G | 43,029.00 |
| Nissan Almera 1.0 L Turbo VL | 79,906.00 |
| Proton X50 Standard | 79,200.00 |
| Proton Persona | 42,600.00 |
| Electric Vehicle (EV) Types | System Voltage (V) | Battery (kWh) | Ultra Capacitor (UC) Energy (Wh) | Fuel Cell (FC) Energy (kWh) | Electric Motor (EM) (kW) |
|---|---|---|---|---|---|
| Conventional ICE | 12 | - | - | - | - |
| Micro-Hybrid EV | 12–42 | 0.02–0.05 | 30 | - | 3–5 |
| Mild-Hybrid EV | 150–200 | 0.125–1.2 | 100–150 | - | 7–12 |
| Full-Hybrid EV [59] | 200–250 | 1.4–4 | 100–200 | - | 40 |
| Plug in Hybrid EV [60] | 300–500 | 6–20 | 100–200 | - | 30–70 |
| All EV [60] | 300–500 | 20–40 | 300 | 150–200 | 50–100 |
| Type of Battery | Nominal Voltage (V) | Energy Density (Wh/kg) | Specific Power (W/kg) | Life Cycle | Self-Discharge (% per Month) | Operating Temperature (°C) | Production Cost ($/kWh) |
|---|---|---|---|---|---|---|---|
| Lead-acid (Pb-acid) | 2.0 | 35 | 180 | 1000 | <5 | −15 to +50 | 60 |
| Nickel-cadmium (Ni-Cd) | 1.2 | 50–80 | 200 | 2000 | 10 | −20 to +50 | 250–300 |
| Nickel-metal hydride (Ni-MH) | 1.2 | 70–95 | 200–300 | <3000 | 20 | −20 to +60 | 200–250 |
| Nickel-iron (Ni-Fe) | 1.2 | 60 | 100–150 | 2000 | 20 | −10 to +50 | 150–200 |
| ZEBRA | 2.6 | 90–120 | 155 | >1200 | <5 | −245 to +350 | 230–345 |
| Lithium-ion (Li-ion) | 3.6 | 118–250 | 200–430 | 2000 | −20 to 60 | 150 | |
| Lithium-ion polymer (LiPo) | 3.7 | 130–225 | 260–450 | >1200 | <5 | −20 to 60 | 150 |
| Lithium-iron phosphate(LiFePO4) | 3.2 | 120 | 2000–4500 | >1200 | <5 | −45 to 70 | 350 |
| Zinc-air (Zn-air) | 1.6 | 460 | 80–140 | 200 | <5 | −10 to 55 | 90–120 |
| Lithium-sulfur (Li-S) | 2.5 | 350–650 | - | 300 | 8–15 | −60 to 60 | 100–150 |
| Lithium-air (Li-air) | 2.9 | 1300–2000 | - | 100 | <5 | −10 to 70 | - |
| Ultra capacitor-Double layer capacitor | - | 5–7 | 1–2 M | 40 years | - | - | - |
| Lead-acid (Pb-acid) | 2.0 | 35 | 180 | 1000 | <5 | −15 to +50 | 60 |
| Nickel-cadmium (Ni-Cd) | 1.2 | 50–80 | 200 | 2000 | 10 | −20 to +50 | 250–300 |
| Nickel-metal hydride (Ni-MH) | 1.2 | 70–95 | 200–300 | <3000 | 20 | −20 to +60 | 200–250 |
| Nickel-iron (Ni-Fe) | 1.2 | 60 | 100–150 | 2000 | 20 | −10 to +50 | 150–200 |
| ZEBRA | 2.6 | 90–120 | 155 | >1200 | <5 | −245 to +350 | 230–345 |
| Lithium-ion (Li-ion) | 3.6 | 118–250 | 200–430 | 2000 | <5 | −20 to 60 | 150 |
| Lithium-ion polymer (LiPo) | 3.7 | 130–225 | 260–450 | >1200 | <5 | −20 to 60 | 150 |
| Lithium-iron phosphate (LiFePO4) | 3.2 | 120 | 2000–4500 | >1200 | <5 | −45 to 70 | 350 |
| Zinc-air (Zn-air) | 1.6 | 460 | 80–140 | 200 | <5 | −10 to 55 | 90–120 |
| Lithium-sulfur (Li-S) | 2.5 | 350–650 | - | 300 | 8–15 | −60 to 60 | 100–150 |
| Lithium-air (Li-air) | 2.9 | 1300–2000 | - | 100 | <5 | −10 to 70 | - |
| Ultra capacitor-Double layer capacitor | - | 5–7 | 1–2 M | 40 years | - | - | - |
| Car Model | Battery Capacity (kWh) | Range (km) |
|---|---|---|
| EV available in Malaysia | ||
| Mitsubishi Imiev | 16.0 | 150 |
| MINI Electric Cooper SE | 32.6 | 234 |
| Nissan Leaf | 40.0 | 270 |
| BMW i3s | 42.2 | 260 |
| Porsche Taycan | 79.2 | 354–431 |
| EV available outside Malaysia | ||
| Smart EQ forfour | 16.7 | 95 |
| Renault Twingo Electric | 21.3 | 130 |
| Honda e Advance | 28.5 | 170 |
| Mazda MX-30 | 30.0 | 170 |
| BMW i3 | 37.9 | 235 |
| Hyundai IONIQ Electric | 38.3 | 250 |
| Renault Zoe ZE40 | 41.0 | 255 |
| Volkswagen ID.4 Pure | 52.0 | 285 |
| Audi e-tron 50 quattro | 64.7 | 280 |
| Audi Q4 e-tron | 76.6 | 385 |
| Mercedes EQC 400 | 80.0 | 370 |
| Ford Mustang Mach-E ER AWD | 88.0 | 420 |
| Model | Battery (kWh) | Charger Rating (kW) | Charging Time |
|---|---|---|---|
| Nissan Leaf | 40 | 6.6 | 7 h |
| 50.0 | 1 h | ||
| MINI Electric Cooper SE | 32.6 | 11.0 | 2.5 h |
| 50.0 | 35 min | ||
| BMW i3s | 42.2 | 11.0 | 3.1 h |
| 50.0 | 45 min | ||
| Porsche Taycan | 79.2 | 11.0 | 8 h |
| 50.0 | 2 h |
| Testing Items | Reference Standard |
|---|---|
| USER | |
| Impulse current | GB/T 18487.1-2015 9.7 |
| Overcurrent protection | GB/T 18487.3-2001 10.3 |
| Overvoltage protection | GB/T 18487.3-2001 10.3 |
| Temperature requirement | GB/T 18487.1-2015 13 |
| Charing cable overload protection | GB/T 18487.1-2015 11.6 |
| Charing cable short circuit protection | GB/T 18487.1-2015 12.2 |
| Noncontact electric shock protection | GB/T 18487.1-2015 12.3 |
| Electrical interlocking inspection of protective conductors for electric vehicles | GB/T 18487.3-2001 9.1 |
| POWER GRID PROVIDER | |
| Voltage deviation | GB/T 18487.1-2015 10.5 |
| Unbalanced three-phase voltage | GB/T 12325.1-2008 |
| Total harmonic distortion | GB/T 15543-2008 |
| Voltage flicker | GB/T 14549-93 |
| Voltage sag and short supply interruption | GB/T 30137-2013 |
| CHARGING EQUIPMENT | |
| Contact protection | GB/T 18487.1-2015 7.2 |
| Capacitor discharge | GB/T 18487.1-2015 7.3 |
| Protective earthing conductor | GB/T 18487.1-2015 7.4 |
| Contact current | GB/T 18487.1-2015 11.2 |
| Insulation resistance | GB/T 18487.1-2015 11.3 |
| Dielectric strength | GB/T 18487.1-2015 11.4 |
| Impulse withstand voltage | GB/T 18487.1-2015 11.5 |
| Lightning protection | GB/T 18487.1-2015 11.7 |
| Electrical clearance and creepage distance | GB/T 18487.1-2015 10.4 |
| IP protection level | GB/T 18487.1-2015 10.5 |
| Vehicle Model | Battery Capacity (kWh) | Maximum Driving Range (km) | Approximate Charging Time for Full Charge (h) | ||
|---|---|---|---|---|---|
| Level 1 (120 Vac) | Level 2 (240 Vac) | Level 3 (dc), at 80% (State-of-Charge) | |||
| Chevrolet Volt PHEV | 16.0 | 610 | 10–16 | 4–5 | N/A |
| Ford Focus EV | 23.0 | 122 | <20 | 4–5 | N/A |
| Tesla Model S EV | 85.0 | 426 | >24 | 9–15 | 0.5 |
| Nissan Leaf EV | 24.0 | 117 | 12–16 | 6–8 | 0.5 |
| Mitsubishi i-MiEV | 16.0 | 100 | 22 | 7–8 | 0.5 |
| Fisker Karma PHEV | 20.1 | 370 | <15 | 4–5 | N/A |
| BMW i3 | 22.0 | 160 | 7–10 | 3–5 | 0.5 |
| Toyota Prius PHEV | 4.40 | 870 | 3 | 1.5 | N/A |
| Honda Fit EV | 20.0 | 132 | <15 | 4–5 | N/A |
Publisher’s Note: MDPI stays neutral with regard to jurisdictional claims in published maps and institutional affiliations. |
© 2022 by the authors. Licensee MDPI, Basel, Switzerland. This article is an open access article distributed under the terms and conditions of the Creative Commons Attribution (CC BY) license (https://creativecommons.org/licenses/by/4.0/).
Share and Cite
Muzir, N.A.Q.; Mojumder, M.R.H.; Hasanuzzaman, M.; Selvaraj, J. Challenges of Electric Vehicles and Their Prospects in Malaysia: A Comprehensive Review. Sustainability 2022, 14, 8320. https://doi.org/10.3390/su14148320
Muzir NAQ, Mojumder MRH, Hasanuzzaman M, Selvaraj J. Challenges of Electric Vehicles and Their Prospects in Malaysia: A Comprehensive Review. Sustainability. 2022; 14(14):8320. https://doi.org/10.3390/su14148320
Chicago/Turabian StyleMuzir, Nur Ayeesha Qisteena, Md. Rayid Hasan Mojumder, Md. Hasanuzzaman, and Jeyraj Selvaraj. 2022. "Challenges of Electric Vehicles and Their Prospects in Malaysia: A Comprehensive Review" Sustainability 14, no. 14: 8320. https://doi.org/10.3390/su14148320