Article

Rebound Effect of China’s Electric Power Demand in the Context of Technological Innovation

1
School of Economics and Management, Harbin Engineering University, Harbin 150001, China
2
CCCC Fourth Highway Engineering Co., Ltd., Beijing 100022, China
3
School of Economics and Management, Beijing University of Chemical Technology, Beijing 100029, China
4
WQ-UCAS Graduate School of Business, Binzhou Institute of Technology, Binzhou 256600, China
5
WQ-UCAS Joint Lab, University of Chinese Academy of Sciences, Beijing 100190, China
*
Authors to whom correspondence should be addressed.
Sustainability 2022, 14(14), 8263; https://doi.org/10.3390/su14148263
Submission received: 24 May 2022 / Revised: 29 June 2022 / Accepted: 1 July 2022 / Published: 6 July 2022
(This article belongs to the Collection Sustainable Electric Power Systems Research)

Abstract

:
Technological innovations in the power industry can help reduce electricity consumption but may also have a negative result due to rebound effects. Estimation and refinement of electricity demand rebound effects are important for assessing the impact of technological innovations. For this purpose, this paper first constructs a Log Mean Divisia Index (LMDI) to measure the structural and technical effects. Secondly, a Data Envelopment Analysis (DEA)–Malmquist Productivity Index is used to calculate the change in the generalized rate of technological progress, narrow rate of technological progress, and technical use efficiency. Thirdly, the electric power demand rebound effect during the New Normal period is calculated to compare with the rebound effect of the overall energy. Finally, a vector auto-regressive (VAR) model and an impulse response function (IRF) are used to investigate the impact degree of electric power demand changes on other energy demand under the “electrical energy substitution” strategy. The empirical results indicate that the general technological progress rate of China’s electric power industry is increasing gradually in the New Normal period, and the variations in electric demand exhibit the characteristics of the backfire effect and partial rebound effect, respectively, in the context of generalized technological innovation and narrow technological innovation. Meanwhile, contrary to the changing trend of the overall energy demand intensity, electric power demand intensity increased continuously with the advancement of the “electrical energy substitution” strategy, which led to a continuous decline in other energy demands.

1. Introduction

As indispensable secondary energy in today’s society, electricity plays an important role in economic growth and daily life, and its demand has increased gradually with the growth of the economy. At the same time, with China’s economy entering a New Normal period, the economic structure is constantly adjusting. Specifically, the New Normal period refers to the period of economic development that began in 2012. In this period, along with the optimization and upgrading of the economic structure, Chinese economic development has shifted from high-speed growth to medium-high-speed growth, from factor-driven growth and investment-driven growth to innovation-driven growth. On the one hand, the secondary industry represented by high-end manufacturing, the tertiary industry represented by the modern service industry [1], and the residential electricity consumption driven by new urbanization [2,3] have gradually become a new economic growth point to stimulate China’s electric power demand. It is expected that the demand for social electricity consumption will continue to increase [4], which leads to great challenges for the stability of existing electric power supply systems. On the other hand, the research and development (R&D) technology promoted by the new economic normal reform, including electric transmission loss reduction technology via high-voltage (HV) and ultra-high-voltage (UHV) methods, energy-saving technology, new energy technology, energy storage technology [5], has become more mature. These technologies not only lead to an increase in electric power supply, but also reduce the intensity of energy consumption, and affect the environmental efficiency of the electric power industry [6].
However, whether the efficiency improvement brought by technological innovation in the New Normal period will result in the reduction in final electric power demand or further stimulate the growth of electric power demand due to the rebound effect is a valuable issue. As a special phenomenon in energy management, the rebound effect means that technological innovation does not reduce energy demand, but instead leads to more energy demand because of the accompanying economic growth [7]. In terms of the work of [8], the definitions of the specific rebound effect are defined below, as shown in Table 1. Therefore, further deep research is needed to provide policy implications for the development of the electric power industry reasonably.
As an important phenomenon that cannot be ignored when the government formulates energy policies [9,10], the rebound effect is often analyzed from different angles. In the existing literature, many researchers applied different methods to measure the technological innovation and the intensity of energy demand and analyze the relationship between the two to describe the energy rebound effect from the perspective of overall energy [11,12]. For technological innovation, most scholars used the Solow residual method to measure the degree of innovation [13,14,15]. They often constructed production functions to measure the total factor productivity (TFP), which is used to estimate the technological progress rate. For example, considering the spatial spillover effect in neighboring areas, Feng et al. [16] used the Solow residual method to estimate the contribution rate of pure technological progress and spatial spillover effect to economic growth. For the intensity of energy demand, most of the existing studies first applied the Laspeyres index [17] or the Log Mean Divisia Index (LMDI) methods [18,19] to decompose the energy intensity variation factors, and then combined the technological progress indicators to analyze the energy rebound effect. For example, both Lin et al. [20] and Dong et al. [21] pointed out that all the rebound effect values of China’s macro energy are greater than zero, with the mean values of 1981–2009 and 1996–2012 being 0.532 and 0.79, respectively, which exhibited partial rebound effect. That is, the improvement in energy efficiency, caused by the advancement of energy technology, instead increased the overall energy demand. This will reduce the positive output of industrial energy efficiency projects [22].
In the calculation of the rebound effect, some scholars used the state-space model with time-varying parameters [23] or the dynamic panel model [24] to investigate the long-term and short-term energy rebound effects at China’s macroeconomic level. Their studies found that short-term technological innovation will lead to an increase in energy demand, but the energy-saving effect of overall energy efficiency improvement will gradually emerge in the long run, which will affect the profits of manufacturers in energy-intensive supply chains [9,25]. Besides the macroeconomic level, some scholars analyzed the energy rebound effects from the perspective of specific industries. Their analysis found that all the rebound effect values of China’s construction industry [26,27], steel industry [28], light industry [29], manufacturing industry [30], and six energy-intensive industries [18] are greater than 0, showing different degrees of partial rebound effect or backfire effect. Lin et al. [31] used the LMDI method and the TFP model to measure the rebound effect of the Chinese nonferrous metals industry and pointed out that the average rebound effect value from 1985 to 2014 was about 0.8302 and showed a downward trend, indicating that improving the energy utilization level will become an important way to save energy and reduce emissions. Similarly, Bataille et al. [32] found that there is a backfire effect in energy demand, such as asphalt upgrading and shale gas mining, in Canada.
Focusing on the rebound effect of electric power energy demand, Deng et al. [33] pointed out that the average rebound effect value of electric power in China from 1998 to 2013 was 0.7697, exhibiting a partial rebound effect. Lu et al. [8] found that the long-term rebound effect of urban residents’ electricity was greater than zero by constructing co-integration equations, panel error correction models, and input–output models. Likewise, some scholars have refined the demand for residential electricity [9] and found that the overall electric power rebound effect for the residential market was greater than zero, and the electric power demand of partial electrical appliances had a backfire effect [34,35,36]. For the rebound effect of electric power in various industries, Amjadi et al. [37] found that the electric power demand of Swedish heavy industry was characterized by a partial rebound effect. Finally, Table 2 lists the related literature as follows.
In the existing rebound effect analysis of electric power demand, only narrow technological progress is considered, which refers to the innovation of specific technologies, such as UHV, energy-saving technology, etc. That is, the impact of generalized technological progress, including narrow technological progress and technical use efficiency, is not taken into account. In general, both the improvement of a specific technology (i.e., narrow technological progress) and the technical use efficiency can improve production efficiency. Therefore, the improvement of the narrow technological progress rate and the technical use efficiency are collectively referred to as the generalized technological progress rate. Furthermore, previous studies have not analyzed the changes in the rebound effect of China’s electric power during China’s New Normal period. For this purpose, this paper will extend the work of Lin et al. [20] and Dong et al. [21] to propose a new analytical framework to analyze China’s macro-energy rebound effect. In the proposed analytical framework, the technological progress rate is selected as the proxy variable of technological innovation, and the changes in electric power rebound effect caused by technological innovation since China entered the New Normal period are deeply analyzed.
According to the proposed analytical framework, the paper first selects the Data Envelopment Analysis (DEA)–Malmquist Productivity Index and Log Mean Divisia Index (LMDI) methods to determine the technological progress rate and electric power demand intensity of the electric power industry. Then, the analysis framework of the rebound effect was used to measure the rebound effect of China’s electric power demand under the period of the New Normal, which is compared with the rebound effect of overall energy, calculated by Dong et al. [21]. Finally, in order to further analyze the substitution effect of electric power demand, a vector autoregressive (VAR) model and impulse response function (IRF) are constructed to determine the impact of electric power demand changes on other energy demands. According to the conclusions, some policy implications are proposed to guide the orderly development of the electric power industry in China. Clearly, the following contributions describe the novelty of the presented study in detail.
(1)
The presentation of a research framework for the electricity power demand rebound effect in three dimensions including generalized technological progress, narrow technological progress, and technical use efficiency.
(2)
The comparison of rebound effects between overall energy demand and electricity demand during the New Normal period.
(3)
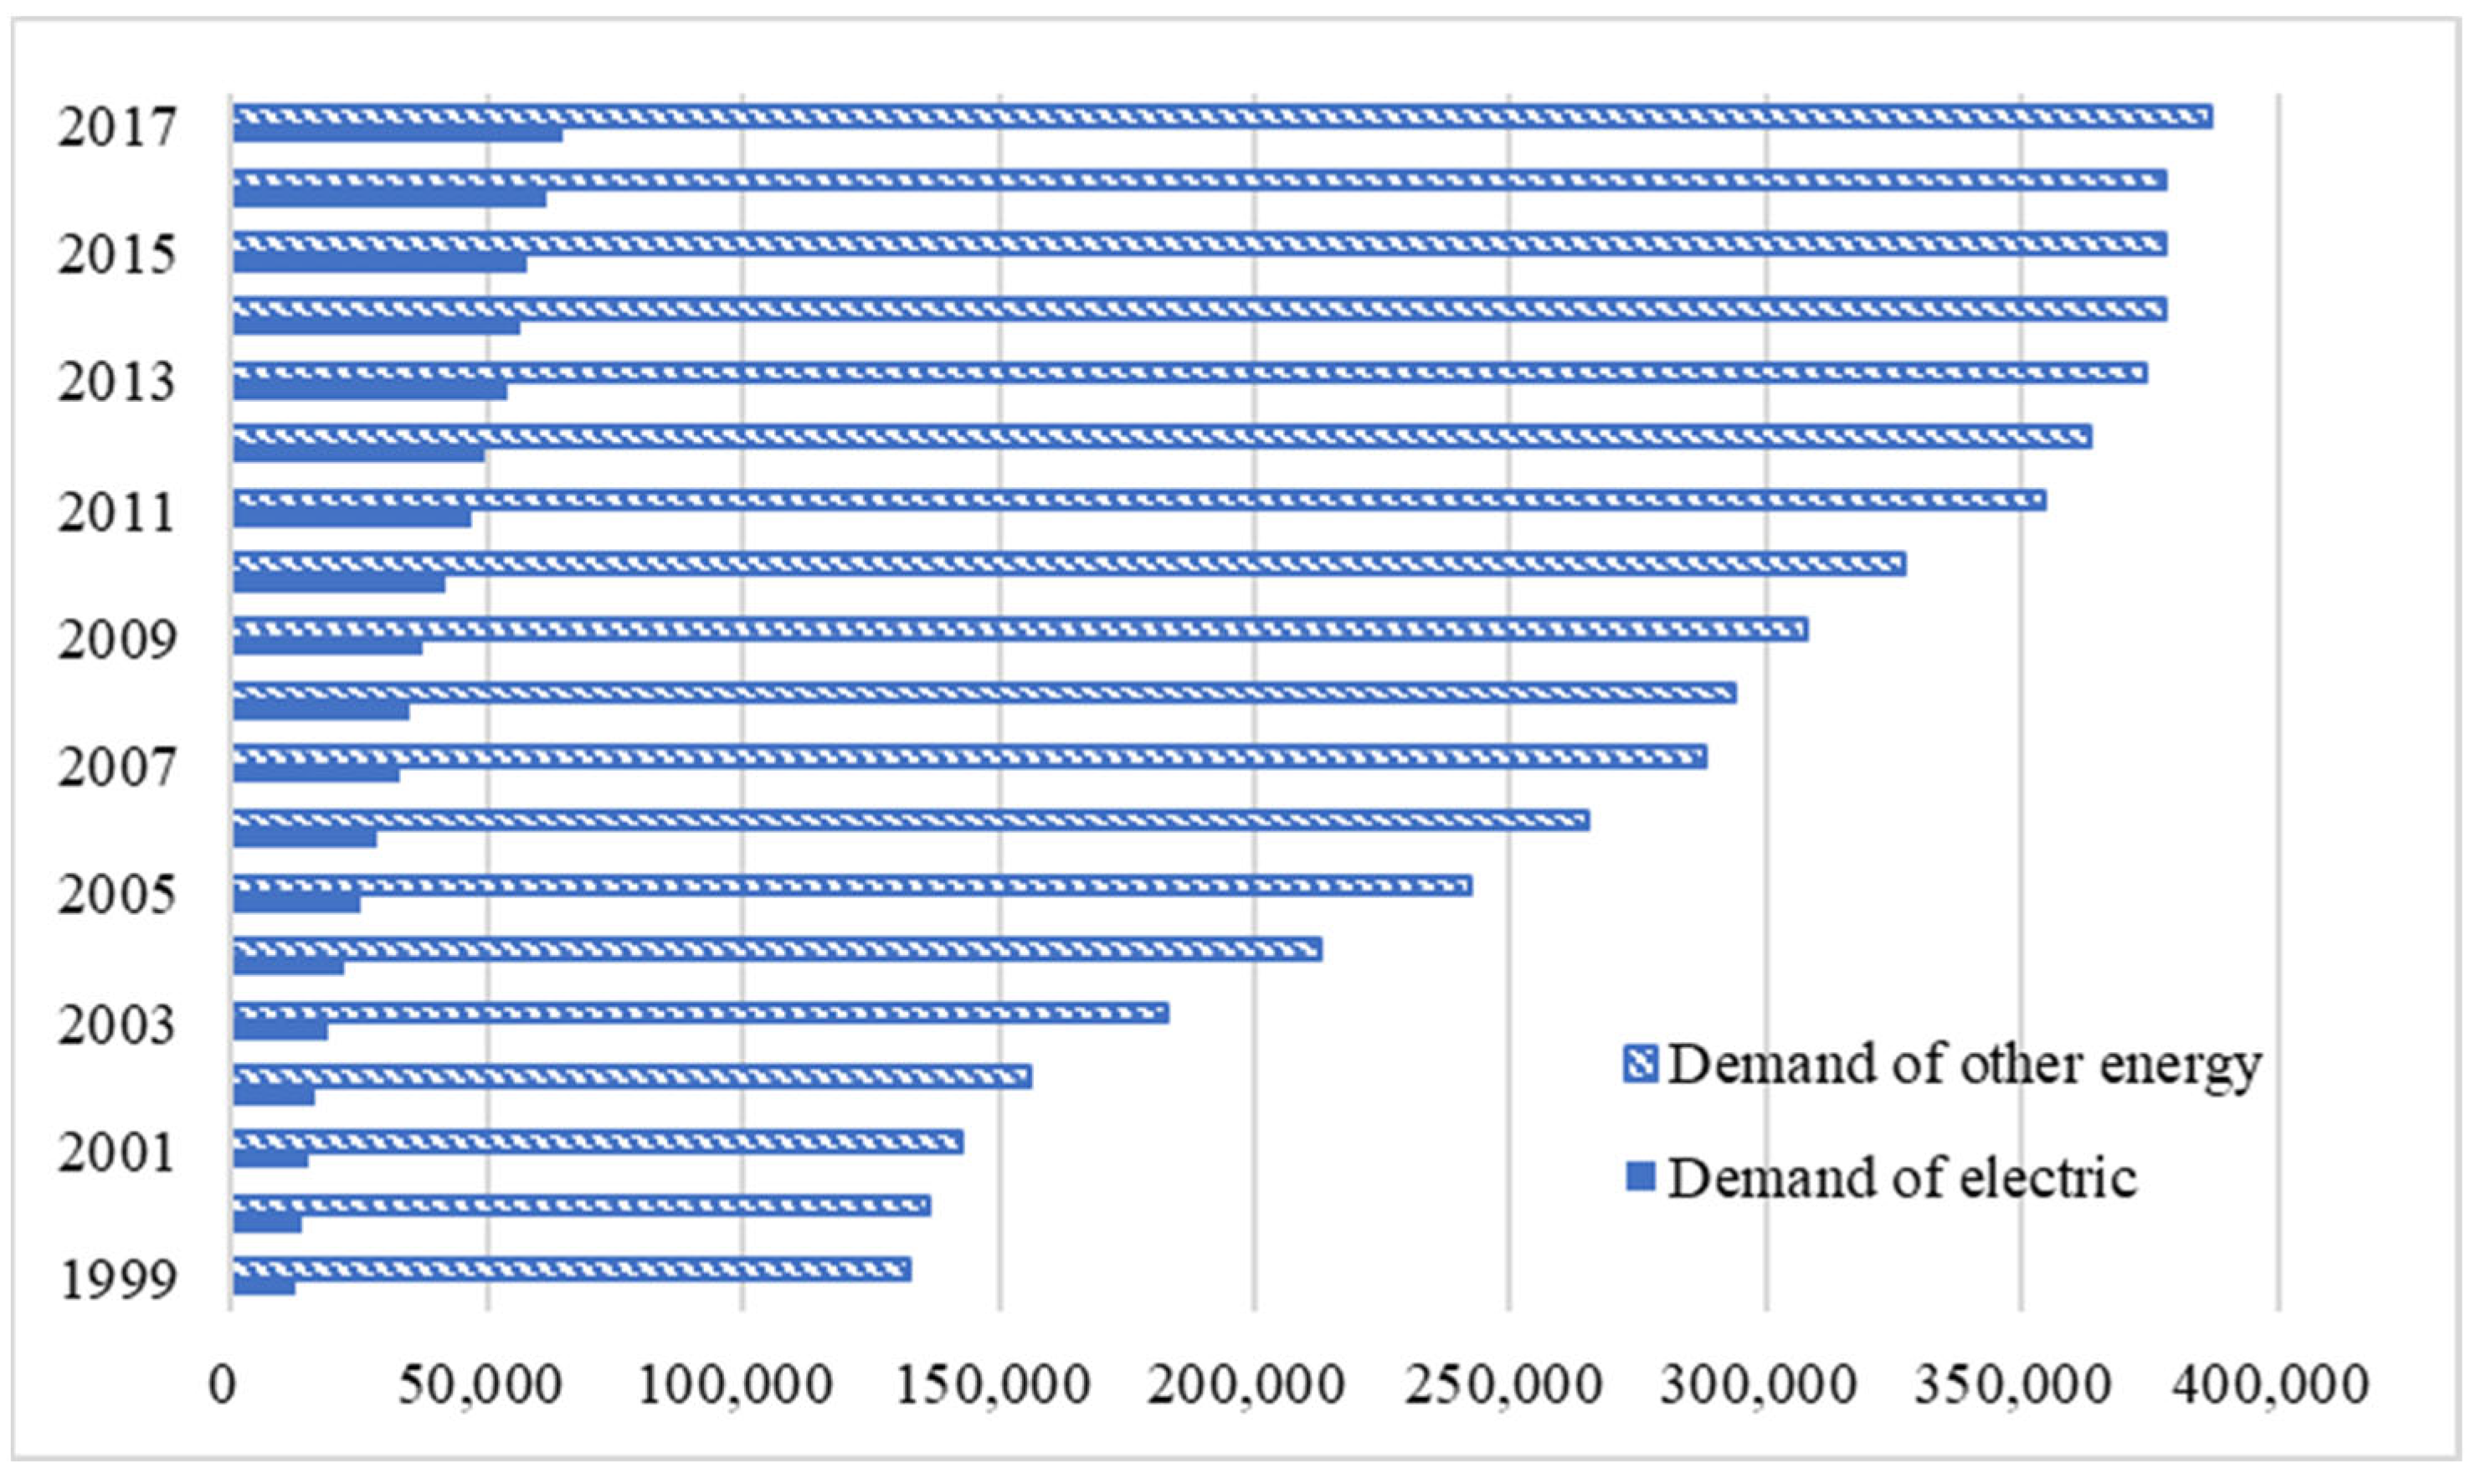
The evaluation of the impact of electricity demand growth on other energy demand under the “electrical energy substitution” strategy.
The rest of the paper is organized as follows. Section 2 presents the analytical framework of the rebound effect of electric power demand. Section 3 reports the empirical results and some discussions. Finally, the conclusions and policy implications will be given in Section 4.

2. Analytical Framework

In this paper, the rebound effect of electric power demand from the perspective of generalized technological progress will be analyzed deeply. Therefore, not only the narrow technological progress, but also the structural adjustment of the three industries and the change in electric power demand intensity caused by the improvement of electrical energy efficiency are taken into account. For this purpose, this paper first constructs the Log Mean Divisia Index (LMDI) to measure the structural and technical effects that trigger changes in electric power demand intensity. Secondly, the Data Envelopment Analysis (DEA)–Malmquist Productivity Index is used to calculate the change in the generalized rate of technological progress, narrow rate of technological progress, and technical use efficiency. Thirdly, combined with the analytical framework of the rebound effect, analysis of the electric power demand rebound effect caused by the generalized technological progress and the narrow technological progress during the New Normal period is carried out to compare with the rebound effect of the overall energy. Finally, a vector auto-regressive (VAR) model and the impulse response function (IRF) are used to investigate the impact degree of electric power demand changes on other energy demand under the “electrical energy substitution” strategy. In detail, the general analytical framework of the electric power demand rebound effect is illustrated in Figure 1.

2.1. Contribution Rate Measurement of Structural Effect and Technical Effect

As a popular decomposition method in the field of energy consumption, the Log Mean Divisia Index (LMDI) can effectively avoid the residual term generated in the decomposition process, and thus it has a stronger explanatory power of the model than the Laplace index [39,40]. Combined with the research framework, this paper assumes that the change in power demand intensity is caused by the change in demand intensity within the industry and the adjustment of industrial structure. Therefore, this paper chooses the LMDI method to measure the structural effect and technical effect factors that trigger the electric power demand intensity. The detailed calculation process is shown below.
(1)
Define the ratio of electric power demand intensity and the output value of the three industries using Equation (1).
I t = E t Y t = i E i , t Y i , t Y i , t Y t = i I i , t S i , t
where I t , E t ,   Y t represent the power demand intensity, electric power demand, and actual total output in period t, respectively, E i , t , Y i , t , I i , t , and S i , t represent the electric power demand, output level, electric power demand intensity, and output weight of the i-th industries in period t, respectively.
(2)
Calculate the technical and structural effects of electric power demand using Equations (2)–(4).
I t o t = I t e c + I s t r = i L w i , t 1 , w i , t ln I i , t I i , t 1 + i L w i , t 1 , w i , t ln S i , t S i , t 1
w i , t = I i , t S i , t
L w i , t i , w i , t = w i , t w i , t 1 / ln   ( w i , t w i , t 1 )  
where I t o t represents the whole change in electric power demand intensity; I t e c represents the technical effect, which is used to measure the impact of the change in internal electric power demand intensity on the total electric power demand intensity; and I s t r represents the structural effect, which is used to measure the industrial restructuring to the total electric power demand intensity. The effect of L ( w i , t , w i , t 1 ) is called the logarithmic mean weight.
(3)
Calculate the contribution rates of the technical effect and the structural effect using Equations (5) and (6).
δ = I t e c / I t o t
1 δ = I i n r / I t o t
where δ and 1 δ represent the contribution rates of the technical effect and the structural effect, respectively.

2.2. Contribution Rate Measurement of Technological Progress

For the contribution rate of technological progress, the DEA–Malmquist method integrating DEA with the Malmquist productivity method by Färe et al. [41] is adopted as a measurement tool. In the method, the Malmquist productivity index proposed by Caves et al. [42] is first used to measure the generalized technological progress rate by comparing the performance of two-stage reference technology and calculating the change in total factor productivity (TFP). Then, the generalized rate of technological progress is decomposed into the narrow rate of technological progress and technical use efficiency to provide more comprehensive information [43] based on the Malmquist productivity index. Specifically, considering the composition of the production function, this paper assumes that the factors of production are capital stocks, labor, and electric power demand, which are selected as the input variables, with the choice of GDP to represent the output variable. Finally, the ratio between the technological progress rate and the real GDP growth rate is calculated to obtain the contribution rate of technological progress. Generally, the calculation process of the contribution rate of technological progress is shown below.
(1)
Calculate the Malmquist Productivity Index using Equation (7).
M t + 1 y t + 1 , x t + 1 , y t , x t = D t + 1 y t + 1 , x t + 1 D t + 1 y t , x t D t y t + 1 , x t + 1 D t y t , x t
where x t + 1 and x t represent the element input vector in period t + 1 and period t, which includes capital stocks, labor, and electric power demand; y t + 1 , y t represent the element output vector in period t + 1 and period t, which is measured by GDP ;   D t + 1 y t + 1 , x t + 1 and D t + 1 y t , x t represent the distance function of the input and output vectors in period t + 1 and period t with the technology in period t + 1 as reference; and D t y t + 1 , x t + 1 and D t y t , x t represent the distance function of the input and output vectors in period t + 1 and period t with the technology in period t as reference. When M > 1, it means that the productivity increases; when M = 1, it means that the productivity does not change; and M < 1 means that the productivity decreases.
(2)
Decompose the productivity index using Equations (8)–(10).
M t + 1 y t + 1 , x t + 1 , y t , x t = M T E C t + 1 M T C t + 1
M T E C t + 1 = D t + 1 y t + 1 , x t + 1 D t y t , x t
M T C t + 1 = ( D t y t , x t D t + 1 y t , x t ) ( D t y t + 1 , x t + 1 D t + 1 y t + 1 , x t + 1 )
where M t + 1 , M T E C t + 1 , and M T C t + 1 respectively represent the generalized rate of technological progress, the narrow technological progress rate, and the technical use efficiency in the t + 1 period.
(3)
Calculate the contribution rate of technological progress using Equations (11)–(13).
ρ = M 1 / G D P
ρ 1 = M T E C 1 / G D P
ρ 2 = M T C 1 / G D P
where G D P represents the real GDP growth rate and ρ , ρ 1 , and   ρ 2 represent the contribution degrees of the generalized rate of technological progress, narrow rate of technological progress, and technical use efficiency to economic growth.

2.3. Rebound Effect Analysis

According to the definition of the rebound effect, it is measured by energy demand intensity and energy efficiency, but there are many factors that affect energy efficiency, such as specific technological progress or the improvement of technology use efficiency, so it is necessary to refine the rebound effect caused by technological progress. Therefore, we assume that technological progress includes generalized technological progress, specific technological progress, and the improvement of technology use efficiency, which are measured by the broad technological progress rate, narrow technological progress rate and technical use efficiency, respectively. For the rebound effect of electric power demand caused by the change in the generalized rate of technological progress, the narrow rate of technological progress, and the change in technical use efficiency, the specific calculation formulae are represented by Equations (14)–(16).
R E 1 t + 1 = E 1 E 2 = I t + 1 Y t + 1 Y t p Y t + 1 I t I t + 1
R E 2 t + 1 = E 3 E 4 = I t + 1 Y t + 1 Y t p 1 Y t + 1 I t I t + 1 δ
R E 3 t + 1 = E 5 E 6 = I t + 1 Y t + 1 Y t p 2 Y t + 1 I t I t + 1 1 δ
where R E 1 t + 1 , R E 2 t + 1 , and R E 3 t + 1 represent the rebound effect of electric power demand caused by generalized technological progress, narrow technological progress, and technical use efficiency.

2.4. Impact Analysis of Electric Power Demand Changes on Other Energy Demand Based on VAR and IRF

In this section, a vector autoregressive (VAR) model and impulse response function (IRF) are used to investigate the impact of electric power demand changes on other energy demands in terms of the work of [44]. The VAR model has been widely used in many fields, with strong system analysis advantages since its inception [45]. By adopting the form of multiple equations, the VAR model regresses the hysteresis values of all endogenous variables of the model in each equation to estimate the dynamic relationship between the variables, which can be used to measure the potential substitution effect. This article assumes that the increase in electricity demand will have an impact on other energy demands; its general form can be expressed by Equation (17).
E i , t = A 1 E i , t 1 + A 2 E i , t 2 + + A p E i , t p + ε t
where EDi,t represents the k-dimensional endogenous variable in the t period, which combines the electric power demand and other energy demand; Al represents the corresponding coefficient matrix in lag period l; and l represents the lag order of the endogenous variable.
Since the coefficients of the VAR model only reflect the local characteristics, it is difficult to capture the comprehensive and complex dynamic relationship, so it is necessary to combine an IRF for further analysis. By applying a standard deviation impact on the random error term, the dynamic effects on endogenous variables are analyzed. In addition, the unit root test [46], cointegration test [47], and Granger causality test [48] are used to determine whether the corresponding time series variables can be analyzed using VAR and IRF.

3. Empirical Analysis

In this section, we present the main characteristics of China’s electric power demand changes during the New Normal period. Afterward, the impact of the increase in electricity demand is analyzed based on the assumption of the substitution effect.

3.1. Data Sources and Pre-Processing

For variable selection, based on the analytical framework and the availability of data, the capital stock, labor, and electric power demand are selected as input variables and the gross domestic product (GDP) is used as the output variable when calculating the contribution rate of technological progress. The definition of capital stock selects the perpetual inventory method for calculation with a depreciation rate of 10% in terms of the overall energy rebound effect of Dong et al. [21]. In addition, the electric power demand in three industries in different years was selected to measure the contribution rate of technological progress. Considering that the energy consumption data by industry in the 2018 Statistical Yearbook is only updated to 2016, the data period selected in this paper is from 1999 to 2016, when the rebound effect analysis is carried out. To build the VAR model and the IRF for further analysis, the proportion of coal, oil, and natural gas in the total energy consumption in the statistical yearbook is selected as the approximate measurement of other energy demands, and the total electricity consumption is taken as the measurement of electric power demand at the same time. Considering that the data on total electric power demand in the statistical yearbook is updated to 2017, the selected data samples are from 1999 to 2017. These data are collected and compiled in China’s 1999–2018 Statistical Yearbook and 1999–2017 Energy Statistics Yearbook. Based on the 1998 constant price, the annual national income and fixed asset stock data are adjusted, and a small amount of missing data is interpolated and imputed.

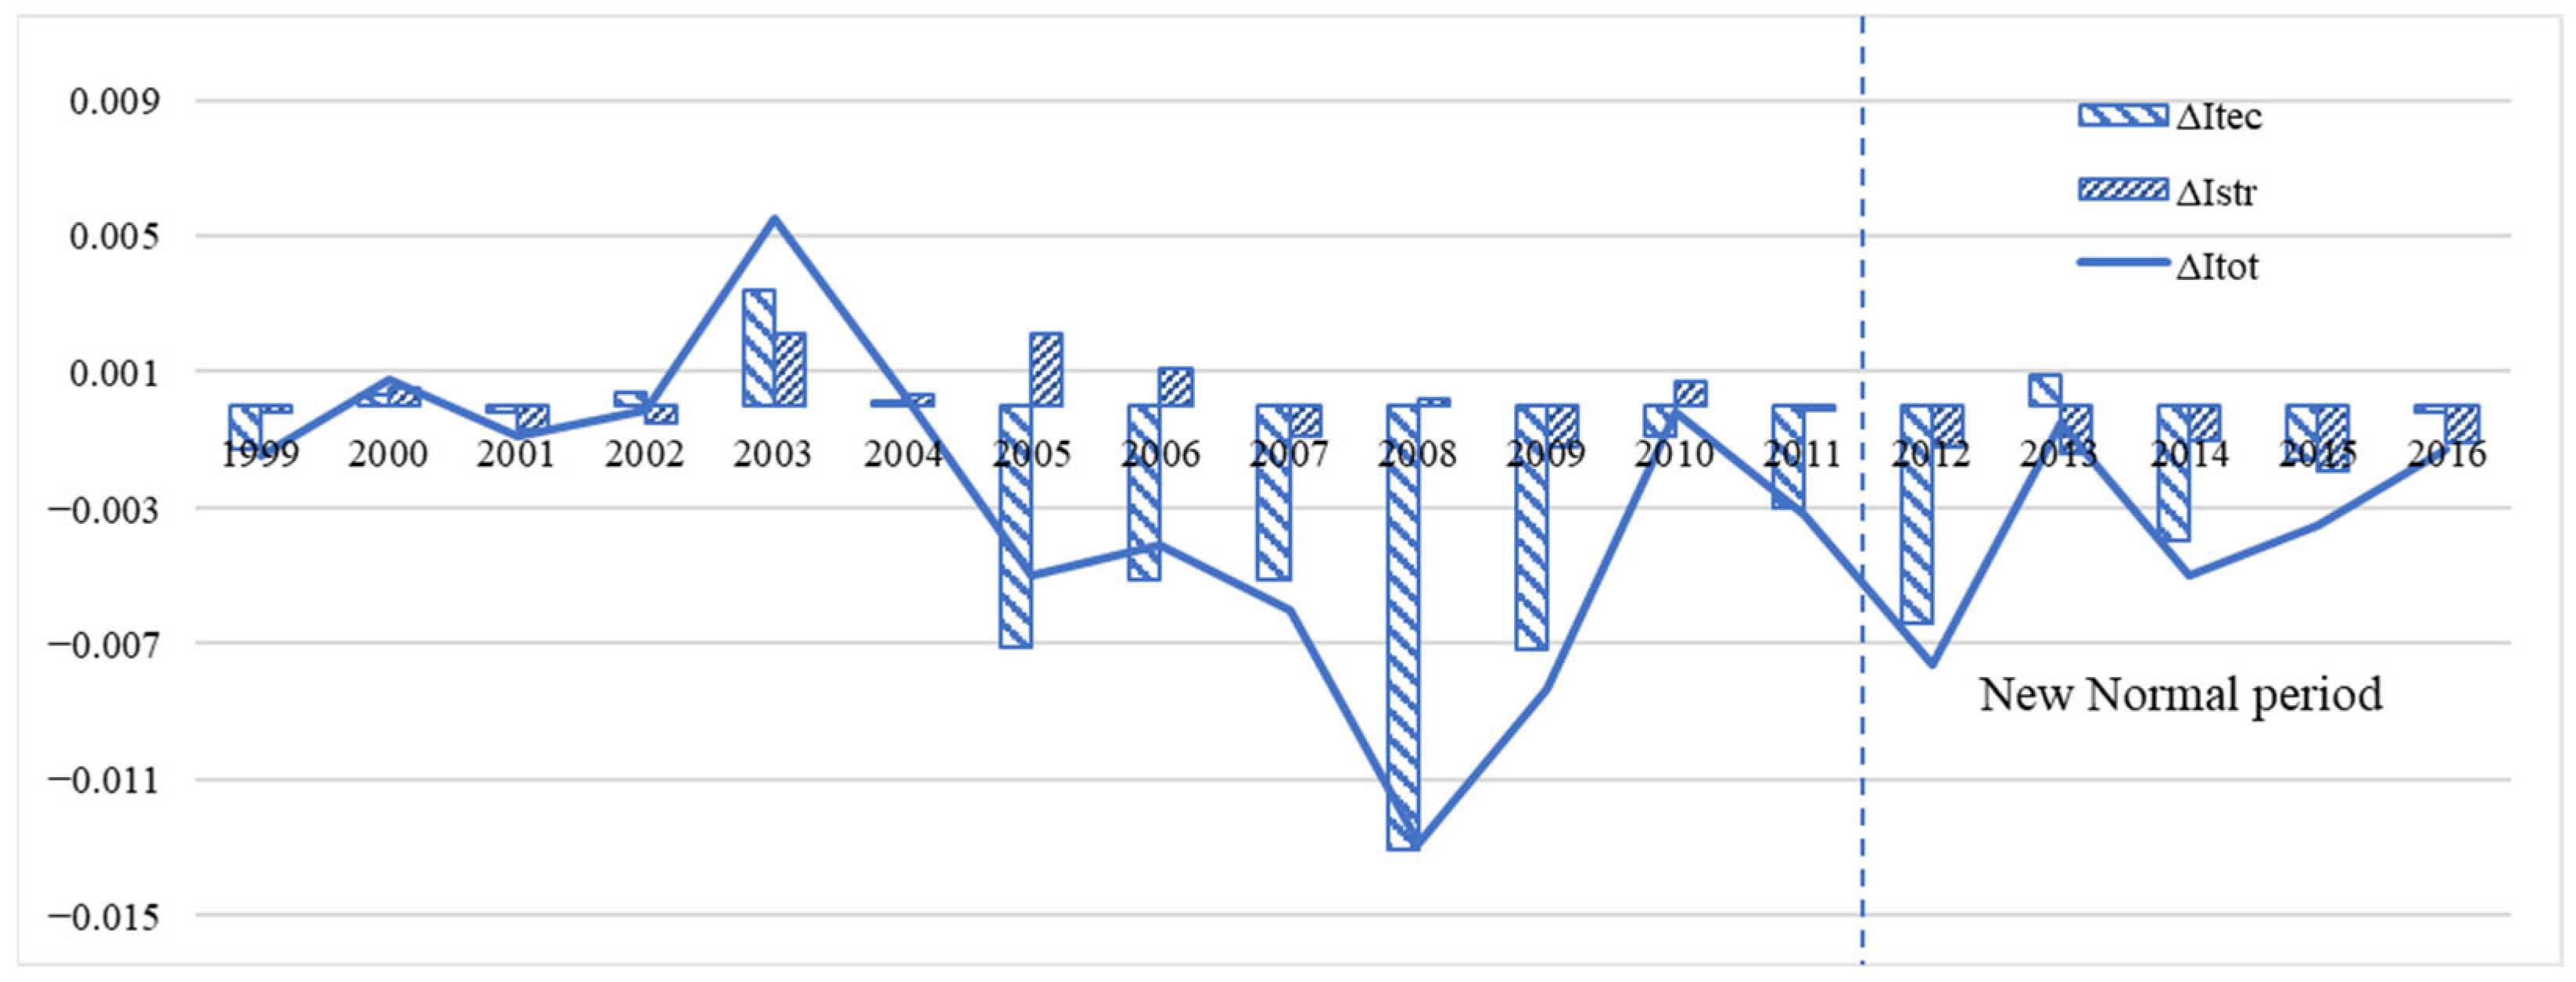
3.2. Decomposition Results of Technological Progress and Electric Power Demand Intensity

According to the previous models, the above data can be used to calculate the technical and structural effects of the electric power demand intensity, as well as the generalized rate of technological progress, the narrow technological progress rate, and the technical use efficiency. The corresponding results are shown in Table 3.
According to Figure 2 and Table 3, although the overall average value of electric power demand intensity is negative, the declining trend is not obvious, and the electric power demand intensity increased during 1999–2016, which implies that the decline in electric power demand is due to technological progress and technical use efficiency improvement may be offset by the rebound effect. Since the Chinese economy entered the New Normal period, the average demand intensity for electricity has dropped by an annual average of 0.0023 (100 million kWh/100 million yuan), which is higher than the average value of previous years. This indicates that the rate of decline in electric power demand intensity has slowed down in recent years, and the demand for electricity has gradually increased. Especially in 2013, after the State Grid Corporation proposed the “electrical energy substitution” strategy, the proportion of electric power consumption in user terminals has been increasing [49], and the variation of electric power demand intensity increased from −0.0050 (100 million KWH/100 million yuan) in 2014 to −0.0013 (100 million KWH/100 million yuan) in 2016, further indicating that there may be a backfire effect in electric power demand. In addition, from the results of the decomposition of electric power demand intensity, it can be seen that an obvious upward trend appears, although the technical effect value still remained negative after 2014. This indicates that the demand for electricity in each industry increases continually, and, at the same time, it counteracts the impact of the structural effects caused by the adjustment of the industrial structure, gradually resulting in a slowdown in the overall demand intensity for electricity.
As shown in Figure 3a and Table 3, the TFP growth rate of China’s electric power industry has presented an overall upward trend since 1999, except before and after the 2008 financial crisis. In addition to the significant decline, the generalized technological progress in the other years is greater than 1. Since 2012, the generalized rate of technological progress is characterized by continuous increase. The overall average value of the New Normal period is 1.6171, which is 0.32 percentage points higher than the previous years’ average. This is closely related to the policy support of the national basic industries under the New Normal period, especially the support for the development of extra-high voltage (UHV) and the strengthening of distribution network construction in recent years [50]. These support policies continuously improve the efficiency of power transmission and utilization, thus leading to an increase in the generalized technological progress rate.
Based on Figure 3b and Table 3, the technical use efficiency of China’s electric power industry continuously improved during the New Normal period, and the overall average value for 2012–2016 is 1.5953, which is an increase of 36.92% over the previous year. Additionally, although the narrow technological progress rate maintained a steady increase, and the overall average value in the New Normal period was 1.0142, it decreased compared with the previous years. This shows that, in the New Normal period, the generalized rate of technological progress mainly relied on technical use efficiency improvement to achieve growth, power technology innovation was fully promoted, and the level of power resource production and utilization continuously improved. These results are consistent with the fact that the problem of light and wind abandonment in the development of new energy significantly improved and the technical use efficiency of the electric power industry continued to increase, as pointed out in the annual development report of “China’s electric power industry 2018”.

3.3. Analysis of the Rebound Effect of Electric Power Demand

In terms of the technological progress and the decomposition of energy intensity, the contribution rate of technological progress, the contribution rate of technical use efficiency, and the rebound effect of electric power demand can be calculated, as shown in Table 4.
Figure 4 shows that both generalized technological progress and narrow technological progress have positively promoted economic growth. The average contribution of generalized technological progress increased from 1.6991 in the previous period to 6.2826 in the New Normal period. This indicates that China’s investment in technology is increasing year by year, thus promoting the continued growth of the economy [51].
As can be seen from Figure 5a, from the perspective of generalized technological progress, the rebound effect of China’s electric power demand from 1999 to 2016 showed a backfire effect as a whole, except for the super-saving effect and partial rebound effect in a few years. This shows that electricity savings due to generalized technological progress are not sufficient to offset the electric power demand generated by economic growth [33]. For the rebound effect of China’s electric power demand in the New Normal period, it can be seen that the rebound effect of electric power demand under the condition of generalized technological progress had a backfire effect, and the electric power demand increased gradually. The average value of the rebound effect in the New Normal period was 27.3617, which represents an increase of 44.72 percent over the previous overall mean of 18.9071 in the previous period. In addition, the rebound effect brought about by the generalized technological progress after 2014 increased continuously, which shows that the “electrical energy substitution” strategy was effectively implemented.
Figure 5b exhibits the rebound effect of electric power demand caused by narrow technological progress, which fluctuated around zero after 2005. However, in the New Normal period, it mainly showed the characteristics of the partial rebound effect, indicating that, in recent years, although the innovation of technologies including HVH/UHV transmission impairment technology, new electrical appliances technology, energy storage technology, and energy conservation technology, were able to reduce power consumption and increase technical use efficiency, the overall trend of electric power demand still rose due to the rebound effect.
Figure 5c shows that the rebound effect of electric power demand due to technical use efficiency growth in the New Normal period has a backfire effect, indicating that the full promotion of electric technology innovation further stimulates the increase in electric power demand.
Furthermore, it can be seen that, under the condition of narrow technological progress, China’s overall energy and electric energy showed a partial rebound effect, indicating that narrow technological progress increased the demand for both overall energy and electrical energy from Table 5. Moreover, the average increase in energy intensity and electric power demand brought by each unit of narrow technological progress was 0.35 tons of standard coal per 10,000 yuan and 20.84 million kWh per 100 million yuan, respectively. For the generalized technological progress, it can be seen that the rebound effect of overall energy had a super-saving effect, but the rebound effect of electric power demand in the corresponding year had a backfire effect, indicating that China’s overall energy demand is declining, but the electric power demand is increasing gradually, which is consistent with the trend of increasing the proportion of electrical energy in the terminal consumption analyzed above.
Similarly, Figure 6 shows the change in electric power demand and other energy demands. Along with the pressure of energy conservation and emission reduction during the “13th Five-Year Plan” period in China, the continuous optimization of energy structure also reduced the energy consumption intensity, while the proportion of power consumption increased continuously [52]. However, under the “electrical energy substitution” strategy (i.e., replacing the use of oil and natural gas with electricity in final energy consumption), the impact of the increase in electric power demand on other energy demands needs further analysis by using VAR and IRF.

3.4. Analysis of the Impact of Changes in Electric Power Demand

Before constructing the VAR model and the impulse response function, it is necessary to perform a unit root test, Engle–Granger (EG) cointegration test, and Granger causal test to determine the level of stability of the variable itself and its combination, and then determine whether there is a statistical causal relationship between the variables.

3.4.1. Unit Root Test and Cointegration Test

To determine the level of stationarity of each time series and whether there is a cointegration relationship between the variables, the ADF test and EG cointegration test are performed on electric power demand data and other energy demand data.
In Table 6, we can see that E 1 , t   and   E 2 , t can not pass the 10% significance level, and the original hypothesis cannot be rejected. That is, the unit root exists in each time series and it is a non-stationary time series. After the first-order differential processing of the variables, the unit root test is performed, and all variables pass the 10% significance level, indicating that D E 1 , t and D E 2 , t are stationary time series. Therefore, the original time series is a first-order single integer, and the cointegration test can be performed. The EG test shows that there exists a cointegration relationship between the variables, which can also be verified by the graph of AR root in Figure 7.

3.4.2. Granger Causality Test

After using the AIC criteria to determine the lagging order of 4, the VAR model is constructed as shown in Equations (18) and (19), and a Granger causality test is performed. Table 7 shows that both the electric power demand and other energy demand pass the Granger causality test at a significance level of 1%, which is statistically causal. At the same time, it can be seen from Equations (18) and (19) that the electric power demand and other energy demand are substitutes for each other. The increase in demand for other energy sources will reduce the demand for electricity in the long run, while the increase in electricity demand will significantly reduce the demand for other energy sources in the medium- and long-term.
E 1 , t = 2807.51 + 0.69 E 1 , t 1 1.12 E 1 , t 2 + 1.90 E 1 , t 3 0.83 E 1 , t 4 + 0.07 E 2 , t 1 + 0.10 E 2 , t 2 0.26 E 2 , t 3 + 0.16 E 2 , t 4
E 2 , t = 21023.27 + 0.49 E 1 , t 1 8.55 E 1 , t 2 + 8.84 E 1 , t 3 2.48 E 1 , t 4 + 1.05 E 2 , t 1 + 0.90 E 2 , t 2 1.66 E 2 , t 3 + 0.94 E 2 , t 4  

3.4.3. Analysis of Impulse Response

From the Granger causality analysis, it is easy to find that electric power demand and other energy demand are substitutes for each other. Subsequently, it is necessary to understand the impact degree of power demand increase on other energy demand. Using the impulse response function, the impulse curve of the effect of power energy demand on other energy demand can be plotted in Figure 8.
In Figure 8, after a positive impact on electric power demand, the demand for other energy sources will be significantly reduced in the short term, and it will be reduced to the lowest value in the third period. Although it has rebounded, the overall demand is still in a downward trend. This is further evidence that, in the New Normal period, with the development of the “electrical energy substitution” strategy, the increase in electric power demand will continue to reduce the demand for other energy sources.

4. Discussions and Policy Implications

In this section, we present the most important findings of this study, considering the previous analysis. Simultaneously, some policy implications are proposed, based on the empirical results. Therefore, considering the obtained results, the change in electric power demand during the New Normal period showed the following four characteristics.
(1)
The generalized rate of technological progress in the electric power industry is increasing gradually. The overall average value for 2012–2016 is 1.6171, which is 0.32 percentage points higher than the average of the previous period. Based on Table 3, the improvement of technical use efficiency as the main factor promoted the increase in the generalized rate of technological progress in the electric power industry.
(2)
It can be seen that the rate of decline in electric power demand intensity during the New Normal period slowed down, and with the gradual promotion of the “electrical energy substitution” strategy, the electric power demand shows an upward trend.
(3)
Under the condition of generalized technological progress, the improvement of technical use efficiency of electric power instead increases the demand for electric power, resulting in a backfire effect. However, the rebound effect of power energy caused by narrow technological progress mainly presents the characteristics of the partial rebound effect. In addition, compared with the super-saving effect of the overall energy demand, the change in electricity demand shows an opposite trend, and the proportion of electric energy consumption in the terminal energy consumption continues to increase.
(4)
The increase in electric power demand will reduce the demand for other energy sources in the medium- and long-term. Furthermore, with the development of the “electrical energy substitution” strategy, the increase in electric power demand will reduce the demand for other energy sources continually.
According to the above findings, several policy implications can be summarized as follows: (1) Based on the fact that the current generalized technological progress mainly depends on the improvement of technical use efficiency, the power industry should increase the R&D investment in key technologies, such as renewable energy grid connection, active distribution network technology, etc., as mentioned in the action plan for energy technology revolution innovation (2016–2030), thus increasing the rate of narrow technological progress. (2) Facing increasing electric power demand, the power industry should optimize power plant layout and improve power grid architecture to meet China’s electric power demand and reduce the average outage time of users, so as to further improve power transmission and technical use efficiency. (3) Facing declining demand and pressure from environmental protection regulations, other energy industries, such as the petroleum and coal industries, should accelerate the transition to green, environment-friendly enterprises and find new demand growth points (e.g., high-end chemical materials, new energy), so as to ensure the sustainable development of enterprises.

5. Conclusions

In terms of the analytical framework of the overall energy demand, this paper investigates the rebound effect of China’s electric power demand during the New Normal period and compares it with the rebound effect of the overall energy. The empirical results indicate that the general technological progress rate of China’s electric power industry is increasing gradually in the New Normal period, and the variations in electric demand exhibit the characteristics of the backfire effect and partial rebound effect, respectively, in the context of generalized technological innovation and narrow technological innovation. Meanwhile, contrary to the changing trend of the overall energy demand intensity, electric power demand intensity increased continuously with the advancement of the “electrical energy substitution” strategy, which led to the continuous decline in other energy demands.
This paper analyzes the impact of technology innovation on China’s electric power demand, but what the subsequent effects of changes in power demand are and how to determine a vertical influence mechanism on power upstream and downstream industries can be proposed for future research.

Author Contributions

Conceptualization, X.Y. and L.Y.; methodology, Y.L.; X.Y. and L.Y.; software, Y.L.; validation, Y.L.; formal analysis, Y.L. and X.Y.; investigation, Y.L.; resources, L.Y.; data curation, Y.M.; writing—original draft preparation, Y.L.; writing—review and editing, X.Y.; visualization, Y.L.; supervision, X.Y. All authors have read and agreed to the published version of the manuscript.

Funding

This work is supported by grants from the Key Program of National Natural Science Foundation of China (project number: 72034003).

Institutional Review Board Statement

Not applicable.

Informed Consent Statement

Not applicable.

Data Availability Statement

The data is originated from the National Bureau of Statistics of China.

Conflicts of Interest

The authors declare no conflict of interest. The funders had no role in the design of the study; in the collection, analyses, or interpretation of data; in the writing of the manuscript, or in the decision to publish the results.

Nomenclature

TFPTotal Factor Productivity
RERebound Effect
LMDILog Mean Divisia Index
DEAData Envelopment Analysis
VARVector Auto-Regressive
IRFImpulse Response Function
GDPGross Domestic Product
GDP The real GDP growth rate
I t The electric power demand intensity in period t
E t The electric power demand in period t
Y t The total output in period t, which is measured by GDP
I i , t The electric power demand intensity of the i-th industries in period t
E i , t The electric power demand of the i-th industries in period t
S i , t The output weight of the i-th industries in period t
Y i , t The output level of the i-th industries in period t
R E 1 t The rebound effect of electric power demand caused by generalized technological progress in period t
D t y t , x t The distance function in period t with the technology in period t
HVHigh-voltage
I t o t The whole change in electric power demand intensity
I t e c The change in technical effect
I s t r The change in structural effect
δ The contribution rates of the technical effect
x t The element input vector in period t
lThe lag order of the endogenous variable
K t Capital stock in period t
L t Number of laborers in period t
M T C t The technical use efficiency in t period
M t The generalized rate of technological progress in t period
M T E C t The narrow rate of technological progress in t period
ρ The contribution degrees of generalized rate of technological progress to economic growth
ρ 1 The contribution degrees of narrow rate of technological progress to economic growth
ρ 2 The contribution degrees of technical use efficiency to economic growth
EDi,tThe k-dimensional endogenous variable in t period
AlThe corresponding coefficient matrix in lag period l
R E 2 t The rebound effect of electric power demand caused by narrow technological progress in period t
R E 3 t The rebound effect of electric power demand caused by technical use efficiency in period t
UHVThe ultra-high voltage

References

  1. Wang, Q.; Gao, Z.; Tang, H.; Yuan, X.; Zuo, J. Exploring the Direct Rebound Effect of Energy Consumption: A Case Study. Sustainability 2018, 10, 259. [Google Scholar] [CrossRef] [Green Version]
  2. Sun, L.; Zhou, K.L.; Yang, S.L. Regional difference of household electricity consumption: An empirical study of Jiangsu, China. J. Clean. Prod. 2018, 171, 1415–1428. [Google Scholar] [CrossRef]
  3. Zhou, K.; Yang, S.; Shen, C.; Ding, S.; Sun, C. Energy conservation and emission reduction of China’s electric power industry. Renew. Sustain. Energy Rev. 2015, 45, 10–19. [Google Scholar] [CrossRef]
  4. Delmastro, C.; Lavagno, E.; Mutani, G. Chinese residential energy demand: Scenarios to 2030 and policies implication. Energy Build. 2015, 89, 49–60. [Google Scholar] [CrossRef]
  5. Li, X.F.; Cui, G.L. Special report on the achievements realized by researchers of Chinese Academy of Sciences in the field of energy storage technologies. J. Energy Storage 2018, 18, 285–294. [Google Scholar] [CrossRef]
  6. Sun, X.; Zhou, X.; Chen, Z.; Yang, Y. Environmental efficiency of electric power industry, market segmentation and technological innovation: Empirical evidence from China. Sci. Total Environ. 2020, 706, 135749. [Google Scholar] [CrossRef] [PubMed]
  7. Li, K.; Zhang, N.; Liu, Y. The energy rebound effects across China’s industrial sectors: An output distance function approach. Appl. Energy 2016, 184, 1165–1175. [Google Scholar] [CrossRef]
  8. Lu, M.L.; Wang, Z.H. Rebound effects for residential electricity use in urban China: An aggregation analysis based E-I-O and scenario simulation. Ann. Oper. Res. 2017, 255, 525–546. [Google Scholar] [CrossRef]
  9. Safarzadeh, S.; Rasti-Barzoki, M.; Hejazi, S.R. A review of optimal energy policy instruments on industrial energy efficiency programs, rebound effects, and government policies. Energy Policy 2020, 139, 111342. [Google Scholar] [CrossRef]
  10. Zhang, J.S.; Lawell, C.Y.C.L. The macroeconomic rebound effect in China. Energy Econ. 2017, 67, 202–212. [Google Scholar] [CrossRef]
  11. Ouyang, X.L.; Gao, B.Y.; Du, K.R.; Du, G. Industrial sectors' energy rebound effect: An empirical study of Yangtze River Delta urban agglomeration. Energy 2018, 145, 408–416. [Google Scholar] [CrossRef]
  12. Yang, L.; Li, Z. Technology advance and the carbon dioxide emission in China–Empirical research based on the rebound effect. Energy Policy 2017, 101, 150–161. [Google Scholar] [CrossRef]
  13. He, S.L.; Wang, J.; Zhang, L. Study on the Characteristics of Information Service Industry in Yangtze River Delta. In Proceedings of the International Conference on Advanced Control, Automation and Artificial Intelligence (ACAAI 2018), Shenzhen, China, 21–22 January 2018; Volume 155, pp. 226–230. [Google Scholar]
  14. Liu, W.S.; Liu, Y.; Lin, B.Q. Empirical analysis on energy rebound effect from the perspective of technological progress-a case study of China's transport sector. J. Clean. Prod. 2018, 205, 1082–1093. [Google Scholar] [CrossRef]
  15. Ren, W.; Wang, Q.; Ji, J. Research on China's marine economic growth pattern: An empirical analysis of China's eleven coastal regions. Mar. Policy 2018, 87, 158–166. [Google Scholar] [CrossRef]
  16. Feng, F.; Ye, A.Z. Does the rebound effect increase the total energy consumption in China? J. Quant. Tech. Econ. 2015, 32, 104–119. [Google Scholar]
  17. Cheng, S.L.; Wu, Y.Y.; Chen, H.; Chen, J.D.; Song, M.L.; Hou, W.X. Determinants of changes in electricity generation intensity among different power sectors. Energy Policy 2019, 130, 389–408. [Google Scholar] [CrossRef]
  18. Lin, B.Q.; Tan, R.P. Estimating energy conservation potential in China's energy intensive industries with rebound effect. J. Clean. Prod. 2017, 156, 899–910. [Google Scholar] [CrossRef]
  19. Wang, M.; Feng, C. Technological gap, scale economy, and China's industrial energy demand. J. Clean. Prod. 2019, 236, 117618. [Google Scholar] [CrossRef]
  20. Lin, B.Q.; Liu, X. Dilemma between economic development and energy conservation: Energy rebound effect in China. Energy 2012, 45, 867–873. [Google Scholar] [CrossRef]
  21. Dong, M.; Xu, Y.Y. Research on the Measurement and Agglomeration of Energy Rebound Effect in China—Based on the Perspective of Technological Progress Decomposition. J. Guizhou Univ. (Soc. Sci.) 2015, 33, 89–95. [Google Scholar]
  22. Safarzadeh, S.; Rasti-Barzoki, M.; Hejazi, S.R.; Piran, M.J. A game theoretic approach for the duopoly pricing of energy-efficient appliances regarding innovation protection and social welfare. Energy 2020, 200, 117517. [Google Scholar] [CrossRef]
  23. Shao, S.; Yang, L.L.; Huang, T. Theoretical Model of Energy Rebound Effect and China Experience. Econ. Res. 2013, 48, 96–109. [Google Scholar]
  24. Jin, L.; Duan, K.; Tang, X. What Is the Relationship between Technological Innovation and Energy Consumption? Empirical Analysis Based on Provincial Panel Data from China. Sustainability 2018, 10, 145. [Google Scholar] [CrossRef] [Green Version]
  25. Safarzadeh, S.; Rasti-Barzoki, M. A game theoretic approach for assessing residential energy-efficiency program considering rebound, consumer behavior, and government policies. Appl. Energy 2019, 233, 44–61. [Google Scholar] [CrossRef]
  26. Du, Q.; Li, Y.; Bai, L.B. The Energy Rebound Effect for the Construction Industry: Empirical Evidence from China. Sustainability 2017, 9, 803. [Google Scholar] [CrossRef] [Green Version]
  27. Zhou, M.F.; Liu, Y.; Feng, S.H.; Liu, Y.; Lu, Y.Y. Decomposition of rebound effect: An energy-specific, general equilibrium analysis in the context of China. Appl. Energy 2018, 221, 280–298. [Google Scholar] [CrossRef]
  28. Wang, X.L.; Wen, X.H.; Xie, C.P. An evaluation of technical progress and energy rebound effects in China's iron & steel industry. Energy Policy 2018, 123, 259–265. [Google Scholar] [CrossRef]
  29. Li, J.L.; Lin, B.Q. Rebound effect by incorporating endogenous energy efficiency: A comparison between heavy industry and light industry. Appl. Energy 2017, 200, 347–357. [Google Scholar] [CrossRef]
  30. Chen, G.Y.; Lin, B.Q.; Ye, B. Is China's Manufacturing Industry Efficient? Evidence from an Energy-Rebound Effect Perspective. Emerg. Mark. Financ. Trade 2018, 54, 2245–2257. [Google Scholar] [CrossRef]
  31. Lin, B.Q.; Chen, Y.F.; Zhang, G.L. Technological progress and rebound effect in China's nonferrous metals industry: An empirical study. Energy Policy 2017, 109, 520–529. [Google Scholar] [CrossRef]
  32. Bataille, C.; Melton, N. Energy efficiency and economic growth: A retrospective CGE analysis for Canada from 2002 to 2012. Energy Econ. 2017, 64, 118–130. [Google Scholar] [CrossRef]
  33. Deng, C.X.; Li, K.; Peng, C.; Han, F. Analysis of technological progress and input prices on electricity consumption: Evidence from China. J. Clean. Prod. 2018, 196, 1390–1406. [Google Scholar] [CrossRef]
  34. Alvi, S.; Mahmood, Z.; Nawaz, S.M.N. Dilemma of direct rebound effect and climate change on residential electricity consumption in Pakistan. Energy Rep. 2018, 4, 323–327. [Google Scholar] [CrossRef]
  35. Su, Y.W. Residential electricity demand in Taiwan: Consumption behavior and rebound effect. Energy Policy 2019, 124, 36–45. [Google Scholar] [CrossRef]
  36. Yu, B.Y.; Zhang, J.Y.; Fujiwara, A. Evaluating the direct and indirect rebound effects in household energy consumption behavior: A case study of Beijing. Energy Policy 2013, 57, 441–453. [Google Scholar] [CrossRef]
  37. Amjadi, G.; Lundgren, T.; Persson, L. The Rebound Effect in Swedish Heavy Industry. Energy Econ. 2018, 71, 140–148. [Google Scholar] [CrossRef] [Green Version]
  38. Safarzadeh, S.; Rasti-Barzoki, M. A duopolistic game for designing a comprehensive energy-efficiency scheme regarding consumer features: Which energy policy is the best? J. Clean. Prod. 2020, 255, 120195. [Google Scholar] [CrossRef]
  39. Ang, B.W.; Liu, F.L.; Chew, E.P. Perfect decomposition techniques in energy and environmental analysis. Energy Policy 2003, 31, 1561–1566. [Google Scholar] [CrossRef]
  40. Wang, Z.; Ru, X.J. Research on Influencing Factors of Household Energy Carbon Emission Based on Exponential Decomposition. Eco. Econ. 2015, 31, 51–55. [Google Scholar]
  41. Färe, R.; Shawna, G.; Mary, N.; Zhang, Z. Productivity Growth, Technical Progress, and Efficiency Change in Industrialized Countries. Am. Econ. Rev. 1994, 84, 66–83. [Google Scholar]
  42. Caves, D.W.; Christensen, L.R.; Diewert, W.E. The Economic Theory of Index Numbers and the Measurement of Input, Output, and Productivity. Econometrica 1982, 50, 1393–1414. [Google Scholar] [CrossRef]
  43. Li, Y.; Sun, L.Y.; Feng, T.W.; Zhu, C.Y. How to reduce energy intensity in China: A regional comparison perspective. Energy Policy 2013, 61, 513–522. [Google Scholar] [CrossRef]
  44. Green, R.; Larsson, K.; Lunina, V.; Nilsson, B. Cross-commodity news transmission and volatility spillovers in the German energy markets. J. Bank Financ. 2018, 95, 231–243. [Google Scholar] [CrossRef] [Green Version]
  45. Mou, D.G.; Lin, B.Q. Study on the Time-Variable Parameters of the Interaction between Chinese Economic Growth, Power Consumption and Coal Prices. Financ. Res. 2012, 6, 42–53. [Google Scholar]
  46. Dickey, D.A.; Fuller, W.A. Distribution of the Estimators for Autoregressive Time Series with a Unit Root. J. Am. Stat. Assoc. 1979, 74, 427–431. [Google Scholar] [CrossRef]
  47. Engle, R.F.; Granger, C.W.J. Co-Integration and error correction: Representation, estimation, and testing. Econometrica 1987, 55, 251–276. [Google Scholar] [CrossRef]
  48. Granger, C.W.J. Investigating causal relations by econometric models and cross-spectral methods. Econometrica 1969, 37, 424–438. [Google Scholar] [CrossRef]
  49. Sun, Y.; Zhou, S.; Shan, Y.G.; Jia, D.X.; Cao, Y. Analysis of Electric Energy Substitution Potential under Multiple Scenarios. Power Syst. Technol. 2017, 41, 118–123. [Google Scholar]
  50. Liu, P.K.; Tan, Z.F. How to develop distributed generation in China: In the context of the reformation of electric power system. Renew. Sustain. Energy Rev. 2016, 66, 10–26. [Google Scholar] [CrossRef]
  51. Yang, L.S.; Li, J.L. Rebound effect in China: Evidence from the power generation sector. Renew. Sustain. Energy Rev. 2017, 71, 53–62. [Google Scholar] [CrossRef]
  52. Fang, D.B.; Dong, W.; Yu, Q. Optimization of China's Energy Consumption Structure under Low Carbon Transformation Trend. Tech. Econ. 2016, 35, 71–79+128. [Google Scholar]
Figure 1. General analytical framework of the electric power demand rebound effect.
Sustainability 14 08263 g001
Figure 2. Decomposition results of electric power demand intensity.
Sustainability 14 08263 g002
Figure 3. Decomposition results of technological progress and electric power demand intensity: (a) China’s generalized technological progress rate (1999–2016); (b) China’s narrow rate of technological progress and technical use efficiency.
Sustainability 14 08263 g003
Figure 4. Contribution rate of China’s technological progress (1999–2016).
Sustainability 14 08263 g004
Figure 5. The rebound effect value of power: (a) under the generalized technological progress; (b) under the narrow technological progress; and (c) under the technical use efficiency.
Sustainability 14 08263 g005
Figure 6. Demand of different energies.
Sustainability 14 08263 g006
Figure 7. Distribution of unit roots.
Sustainability 14 08263 g007
Figure 8. Analysis of impulse response.
Sustainability 14 08263 g008
Table 1. Definition of electric power demand rebound effect.
DefinitionSituationImplication
Backfire effectRE > 1Electric power efficiency improvement increases electric power demand.
Full rebound effectRE = 1Power-saving improvement by electric power efficiency is offset by the rebound amount, and the electric power demand is unchanged.
Partial rebound effect0 < RE < 1Power-saving improvement by electric power efficiency is partially offset by electric power demand, and overall electric power demand is reduced.
Zero rebound effectRE = 0Improvement of electric power efficiency only leads to a reduction in electric power demand and does not cause a rebound effect.
Super saving effectRE < 0Not only does improvement of electric power efficiency reduce the electric power demand, but also the rebound effect is negative.
Table 2. The summary of the related literature.
Ref.AssumptionsApproachResults
RE 1PF 2SW 3SE 4EM 5DEAGT 6
Lin et al. [20] partial rebound effect
Shao et al. [23] energy-saving effect
Dong et al. [21] partial rebound effect
Bataille et al. [32] backfire effect
Jin et al. [24] energy-saving effect
Wang et al. [28] partial rebound effect
Chen et al. [30] partial rebound effect
Su [35] backfire effect
Safarzadeh et al. [38] partial rebound effect
Our work
Note: 1 Rebound effect 2 Production function 3 Social welfare 4 Substitution effect 5 Econometric model 6 Game theory.
Table 3. Decomposition results of China’s technological progress and electric power demand intensity (1999–2016).
YearMMTECMTC I t o t I t e c I s t r
19990.97001.15370.8407−0.0015−0.0013−0.0002
20001.00111.08020.92670.00080.00030.0005
20011.11571.10211.0124−0.0009−0.0002−0.0007
20021.24431.11071.1203−0.00010.0004−0.0005
20031.39611.10881.25920.00550.00340.0021
20041.51651.09081.39020.00040.00010.0003
20051.58071.02841.5370−0.0050−0.00710.0021
20061.69771.00001.6977−0.0041−0.00510.0011
20070.84111.00000.8411−0.0060−0.0051−0.0009
20080.96121.00000.9612−0.0129−0.01310.0002
20091.08171.00001.0817−0.0083−0.0072−0.0012
20101.18721.00331.1834−0.0002−0.00090.0007
20111.30431.00661.2958−0.0032−0.0030−0.0001
Mean value
(1999–2011)
1.22291.05271.1652−0.0027−0.00300.0003
20121.41611.00751.4056−0.0076−0.0064−0.0012
20131.54321.03341.4933−0.00050.0009−0.0014
20141.63421.02221.5987−0.0050−0.0040−0.0010
20151.70461.00771.6916−0.0035−0.0016−0.0019
20161.78731.00001.7873−0.0013−0.0002−0.0011
Mean value
(New Normal)
1.61711.01421.5953−0.0036−0.0023−0.0013
Table 4. Rebound effect computation of China’s electric power demand from 1999 to 2016.
Year ρ ρ 1   ρ 2   δ 1 δ R E 1 R E 2 R E 3
1999−0.30971.5866−1.64440.85030.1497−1.894711.4166−67.1924
20000.01511.1033−1.00840.35920.6408−0.2191−44.470422.7836
20011.30491.15150.13990.17470.825318.795894.96822.4407
20022.44851.10951.2057−3.78164.7816328.2446−39.332133.8039
20033.32290.91272.17450.61230.3877−8.6067−3.8608−14.5274
20044.64500.81663.50920.28490.7151−212.685−131.249−224.684
20053.84170.18793.55261.4314−0.431415.94020.5446−34.1661
20063.96260.00003.96261.2646−0.264620.02560.0000−75.6689
2007−0.87760.0000−0.87760.85050.1495−3.10330.0000−20.7600
2008−0.19630.0000−0.19631.0126−0.0126−0.25960.000020.5266
20090.46770.00000.46770.85900.14100.80640.00005.7206
20101.19980.02121.17554.4816−3.481678.83030.3101−22.1826
20112.26400.04912.20070.95560.04449.91810.2251217.165
Mean value
(1999–2011)
1.69910.53371.12780.71960.280418.9071−8.5729−12.0570
20122.68100.04832.61330.84560.15444.22790.090126.6843
20133.81200.23443.4618−1.67492.674960.8699−2.234620.6653
20146.66410.23336.29110.79360.206410.66560.470448.7891
20157.15270.07827.02070.45690.543111.63480.278321.0272
201611.10320.000011.10320.14390.856149.41050.000057.7127
Mean value
(New Normal)
6.28260.11886.09800.11300.887027.3617−0.279234.9757
Table 5. Comparison of rebound effect between overall energy and electricity energy.
Year R E 1 R E 2 R E 3
Overall energy [21]2010−0.39000.21003.2700
2011−0.16000.47002.3900
2012−0.14000.3700512.9800
Mean−0.23000.3500172.8800
Electricity energy201078.83030.3101−22.1826
20119.91810.2251217.1650
20124.22790.090126.6843
Mean30.99210.208473.8889
Table 6. Results of ADF test and EG cointegration test.
VariableADF TestEG Test
E 1 , t 1.0075
E 2 , t 0.1402
D E 1 , t 3.0114 * 2.6278 **
D E 2 , t 4.2075 **
Note: * indicates a significance level of 10%, ** indicates a significance level of 5%.
Table 7. Results of Granger causality test.
Null HypothesisChi-sqdfProb
E 1 , t is not the Granger reason for E 2 , t 19.343040.0007
E 2 , t is not the Granger reason for E 1 , t 16.281240.0027
Publisher’s Note: MDPI stays neutral with regard to jurisdictional claims in published maps and institutional affiliations.

