
Did China’s “National Sustainable Development Plan of Resource-Based Cities” Promote Economic Growth?

School of Business Administration, Faculty of Business Administration, Southwestern University of Finance and Economics, Chengdu 611130, China
Sustainability 2022, 14(13), 8222; https://doi.org/10.3390/su14138222
Submission received: 10 June 2022
/
Revised: 2 July 2022
/
Accepted: 4 July 2022
/
Published: 5 July 2022
(This article belongs to the Special Issue Economic Sustainability of the Economy)
Abstract
:This study utilizes a difference-in-difference (DID) regression model to evaluate the impact of China’s “National Sustainable Development Plan of Resource-Based Cities (2013–2020)” on economic growth in resource-based cities. The analysis is based on the data covering 329 Chinese cities during 2006–2019. Economic growth is measured by the annual growth rate of gross domestic product (GDP). It was found that the policy had a significantly negative impact on economic growth. Further analysis suggests that the policy depressed innovation in resource-based cities, and these cities did not expand their labor and capital inputs. These two phenomena can help explain why the policy’s effect on economic growth was negative, rather than positive. Moreover, our study reports that the effect of the policy was heterogeneous across different cities, depending on their development stages and spatial locations. Overall, our study detects an undesirable effect of the policy. The research findings call for more actions to promote macroeconomic growth during the process of economic transformation in China’s resource-based cities.
1. Introduction
1.1. Research Background
Like many other developing countries, China’s past economic development was greatly supported by the industries in resource-based cities. A resource-based city refers to a city that has formed or developed largely based on the exploitation and processing of locally abundant natural resources (e.g., forests, minerals, oil, natural gas), where resource-based industries play a pillar role in the local economy [1,2,3,4]. While resource-based cities have made historical contributions to the whole country, their own development models are not sustainable in the long run because their nonrenewable natural resources will be exhausted [5,6,7,8]. In the past decade, along with rising international political and economic uncertainty and instability, as well as the emergence of unbalanced and inharmonious domestic economic dynamics, the sustainable development of China’s resource-based cities has faced severe challenges. Numerous resource-based cities have suffered severe environmental pollution, resource depletion, economic recession, and brain drain. Therefore, they need to transform their development patterns and seek sustainable approaches [9,10,11,12].
In 2013, the State Council of China issued the “National Sustainable Development Plan of Resource-Based Cities (2013–2020)”. This plan, henceforth referred to as SDPRC policy for short, is essentially a governmental policy aiming to promote the economic and social transformation of China’s resource-based cities during 2013–2020 and improve their sustainable-development potential in the future. The SDPRC policy contains contents related to several different aspects. Roughly speaking, the policy primarily emphasizes four aspects. (1) The central government provides institutional, administrative, and monetary support (e.g., fiscal transfers) to local governments to help them implement local economic and social policies. (2) The central government imposes quantitative requirements on local governments regarding some development and transformation targets, for instance, regarding gross domestic product (GDP) growth, employment, energy-intensity decrease, and pollution reduction. These targets contain four dimensions: economic development, improvement in people’s livelihood, resource security, and protection of the ecological environment. (3) Considering the disparities in resource security and sustainable-development capabilities among different cities, the resource-based cities are classified into four types: growing, mature, declining, and regenerative cities. The policy defines the development direction and key duties of each category of cities. (4) The central government provides suggestions about development models and instruments suitable for the local regions, such as developing high-technology manufacturing industries, fostering tourism, and constructing infrastructure. In the policy, five key tasks are proposed, in particular, including orderly developing and comprehensively utilizing resources, constructing a diversified industrial system, ensuring and improving people’s livelihood, strengthening environmental governance and ecological protection, and enhancing support and guarantee capability. A set of specific measures corresponding to these five key tasks are put forward.
The research purpose of this study is to evaluate the effects of the SDPRC policy from the perspective of macroeconomic growth. As the major engine of the global economy, China’s economic growth attracts much attention from both policy makers and academic researchers. It is very important to understand the influencing factors of economic growth in Chinese regions. Theoretically, it is unclear whether the SDPRC policy would have a positive or negative effect on economic growth. On the one hand, as the SDPRC policy explicitly imposed some requirements for regional GDP growth and residents’ income increase in resource-based cities, local governments must make an effort (e.g., attract investment, encourage innovation, and reduce unemployment rates) to promote economic growth. On the other hand, given that local governments had to make tradeoffs between numerous different policy targets, such as economic expansion, urban renewal, and environmental protection, they might be unable to stimulate economic growth sufficiently. Even worse, they might struggle to achieve other important policy targets at the cost of macroeconomic growth. In order to understand the actual impact of the SDPRC policy on economic growth, we need to use rigorous empirical methods, as we will do in this study.
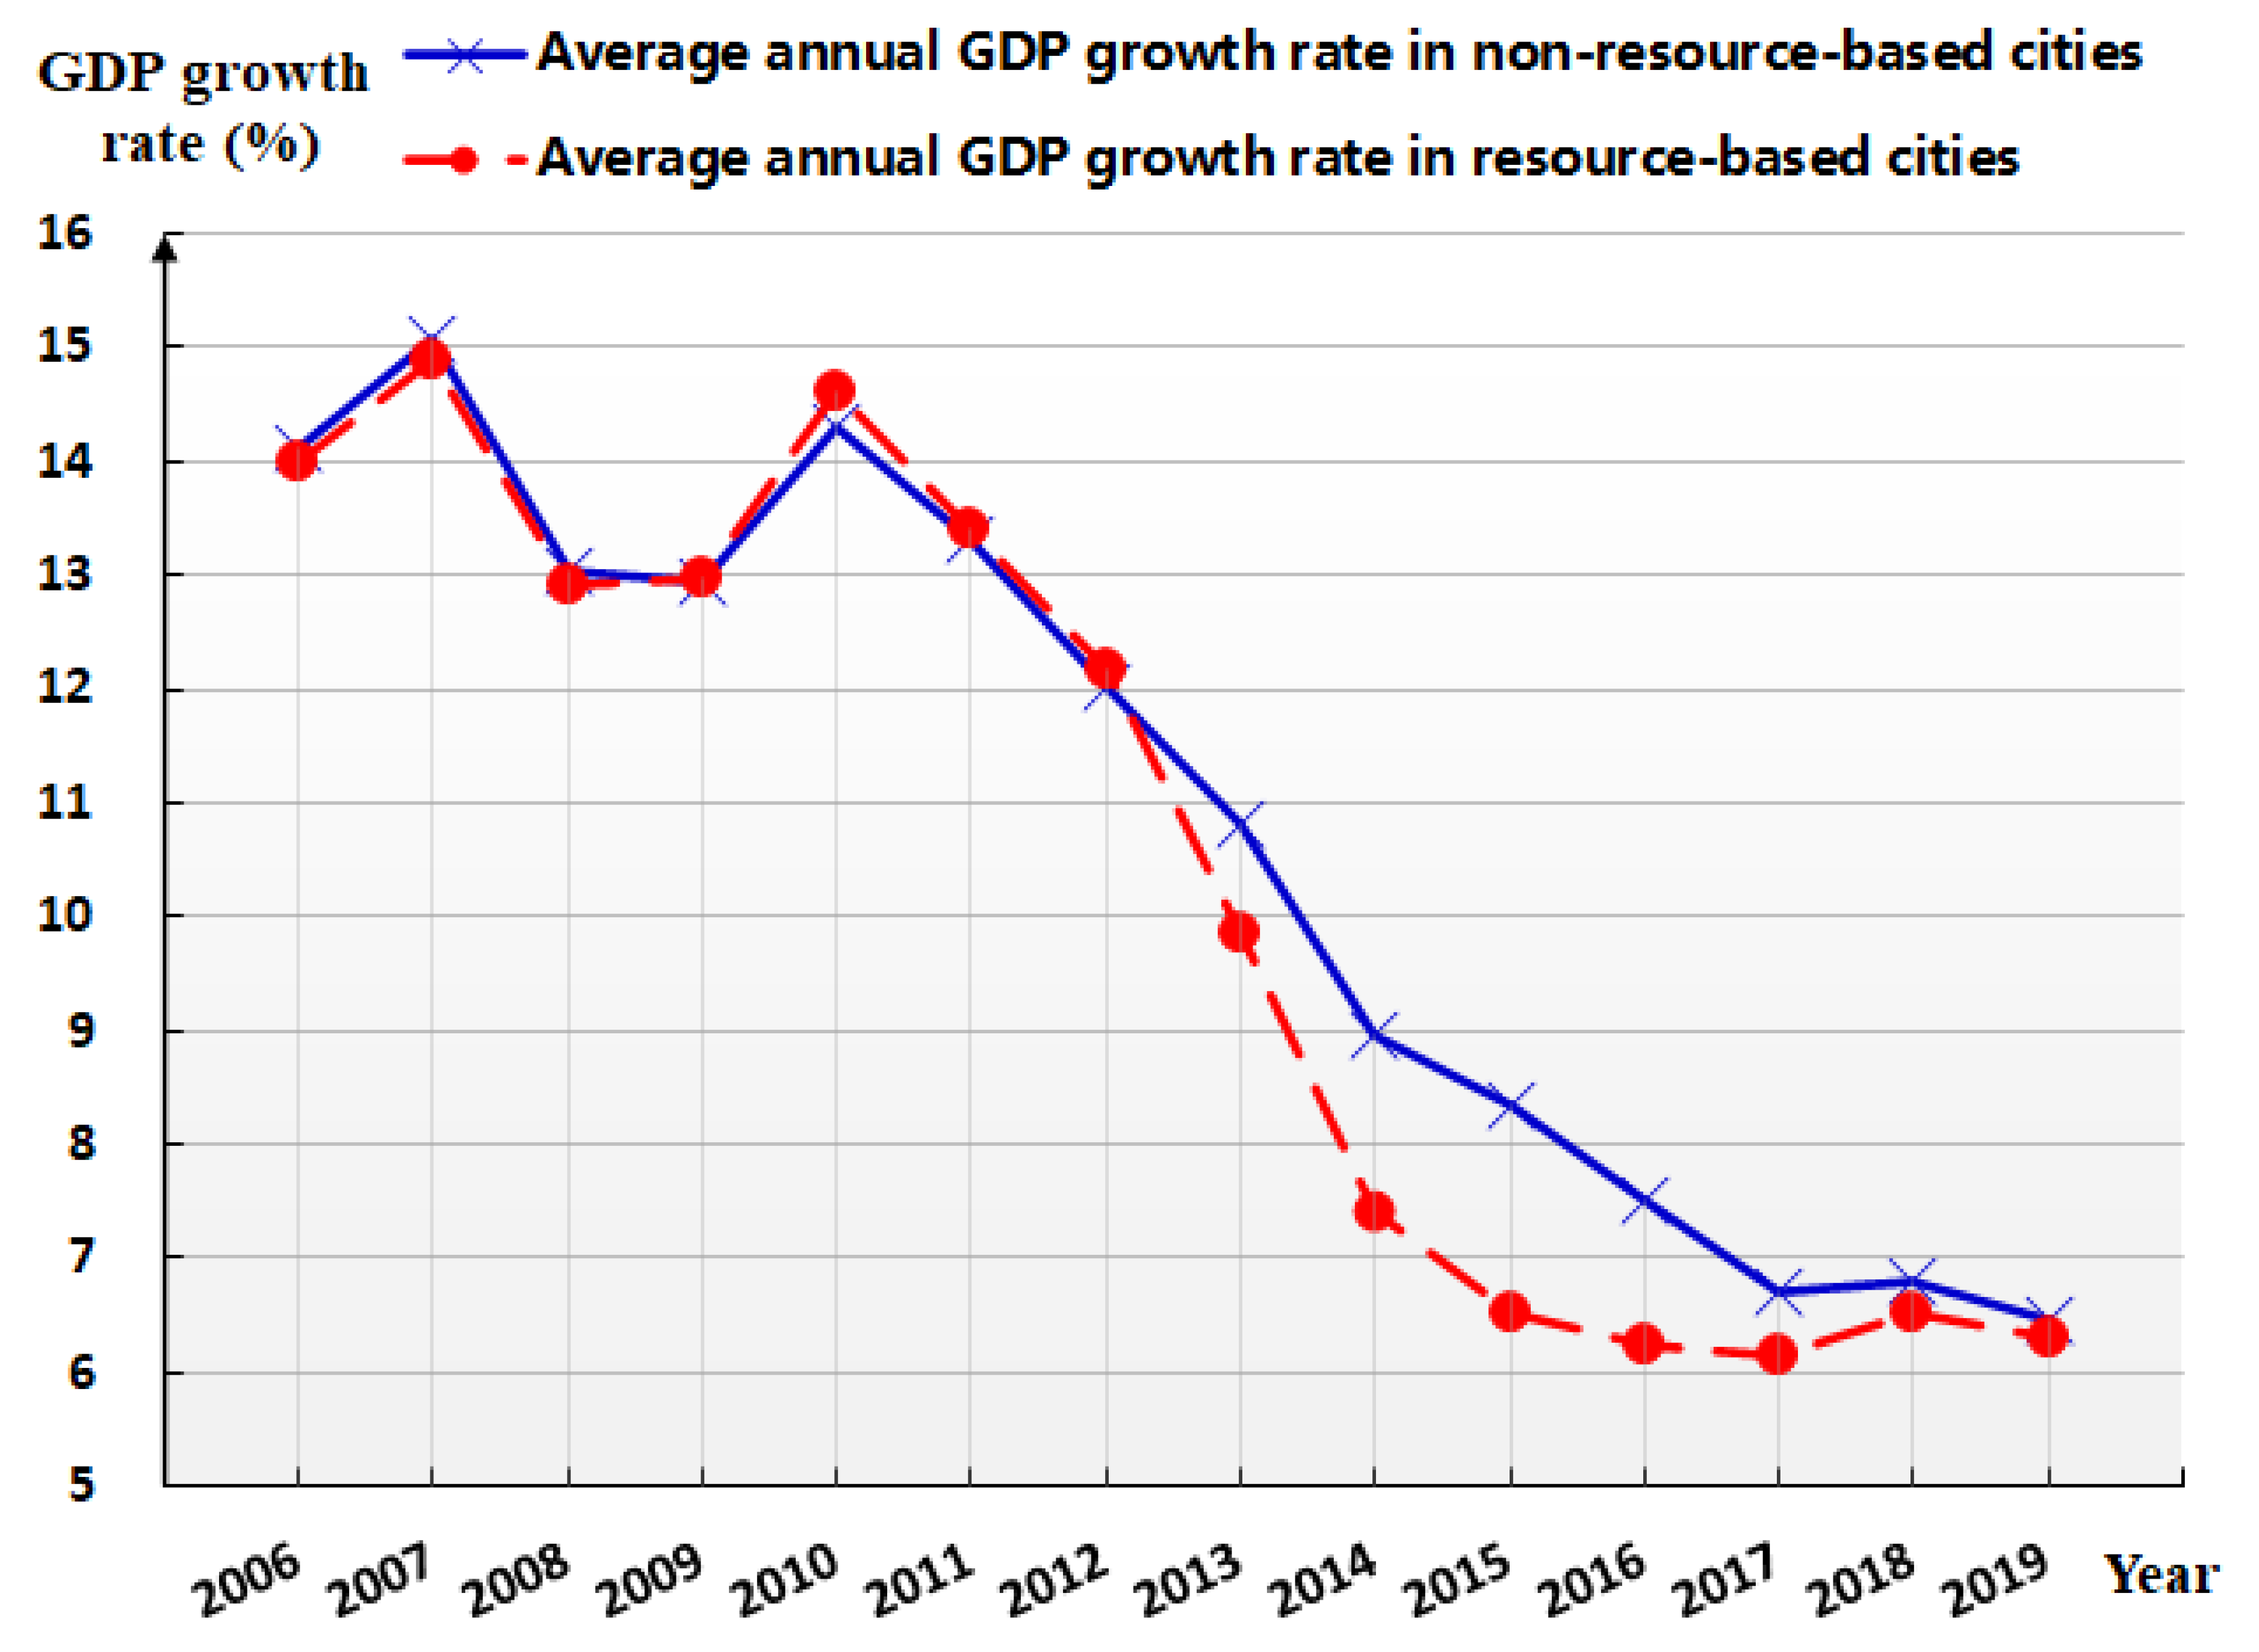
Before we formally assess the impact of the SDPRC policy, we use Figure 1, as below, to provide a visible preliminary overview about the circumstances of economic growth in China between 2006 and 2019. According to the name list provided by the official document of the SDPRC policy, we group Chinese cities into two categories: resource- and non-resource-based cities. We use the annual GDP growth rate as the indicator of economic growth. As shown in the figure, during 2006–2012, the average annual economic growth rate in resource-based cities was almost the same as that in non-resource-based cities. However, since 2013, the average annual economic growth rate in resource-based cities has become much smaller than that in non-resource-based cities. Therefore, we conjecture that the implementation of the SDPRC policy in 2013 might have a negative impact on economic growth in resource-based cities. To verify this conjecture, our study collected data and utilized econometric regression models to quantify the impact of the SDPRC policy.
1.2. Contributions to the Literature
This study contributes to the literature in two aspects. (1) This study helps us understand more about the influencing factors of the regional economic growth in China. The previous literature has analyzed numerous varied factors such as infrastructure construction, financial openness, international trade, environmental quality, industrial structure, political institution, fiscal and monetary policies, and so on. However, the previous literature did not sufficiently examine the effect of the government’s reform and development policies specifically related to resource-based cities. As resource-based cities have faced numerous economic, social, and ecological problems, it is questionable whether they can maintain sustainable growth in the future. In our study, we concentrate on the impact of the SDPRC policy on the economic growth in resource-based cities and report a statistically significant effect. (2) This study provides a new insight into the evaluation of the SDPRC policy. Previous policy-assessment studies mostly discussed the SDPRC policy’s beneficial impacts on industrial structure transformation and industrial pollution reduction. However, rare studies have examined its impact on aggregate macroeconomic performance. Our research reported that the policy actually had an adverse influence from the perspective of economic growth. Our finding calls for future actions to promote sustainable growth in China’s resource-based cities during their economic and social transitions.
The rest of this article is organized as follows. Section 2 provides a brief literature review. Section 3 describes the empirical methodology, variables, and data used in this study. The main regression results are reported in Section 4. Then, Section 5 provides further analysis regarding the underlying mechanism and heterogeneities among different cities. Finally, Section 6 concludes and discusses the policy implications.
2. Literature Review
This study is closely relevant to two streams of literature. The first is about the influencing factors of economic growth in China. The second is about the impacts of the SDPRC policy.
Regarding the influencing factors of China’s regional economic growth, the previous literature has analyzed many different aspects, such as the construction of infrastructure [13,14], domestic financial development [15,16], foreign direct investment [17,18], trade openness [19,20], political and administrative institution [21], and the government’s fiscal and monetary policies [22,23]. Among the different places in China, resource-based cities should be specially studied because their resource-dependent economic system is not sustainable in the long run, and many of them faced severe development problems as described by previous studies on the “Dutch disease” [5,6,7,11,12] and “resource curse” [9,24,25,26].
Among the various policies aimed to promote the sustainable development of resource-based cities, the SDPRC project was one of the most important policies conducted by China’s central government in the past decade. Therefore, it is necessary to appraise its policy effects thoroughly. Several previous studies have assessed the impacts of the SDPRC policy, primarily from the perspective of industrial structure transformation and industrial pollutant emission. Fan and Zhang [1] and Li et al. [2] reported that the policy significantly reduced the share of the secondary industry and raised the share of the tertiary industry in the economies of resource-based cities. Zhou and Gu [27] reported that the policy evidently reduced the scale of sulfur dioxide (SO2) emissions from industrial production. Meng et al. [28] confirmed this finding by examining a pollutant emission index that covers air pollution, water pollution, and solid-waste pollution in the secondary industry. Zhang et al. [29] and Zheng and Ge [30] reported that the SDPRC policy reduced the amount of total CO2 emitted in resource-based cities. These above-mentioned studies demonstrated the beneficial effects of the SDPRC policy in terms of industrial structure transformation and pollution reduction. However, these beneficial effects of the policy did not necessarily lead to stronger macroeconomic growth in resource-based cities. The existing literature has not provided explicit evidence about the net impact of the policy on regional economic growth.
In our study, we examine whether the SDPRC policy decreased or increased annual GDP growth rate in China’s resource-based cities. Our research intends to provide new knowledge about the determinants of China’s economic growth and the macroeconomic consequences of the SDPRC policy.
3. Empirical Methodology and Data
3.1. Regression Model
Our analysis is based on the panel data for China’s prefecture-level and province-level cities. These cities are classified into the treatment group and the control group. The treatment group includes 126 prefecture-level cities that have implemented the SDPRC policy since 2013. The control group includes other cities that did not implement the policy. We use a standard difference-in-difference (DID) approach to measure the treatment effect of the SDPRC policy. DID is a quasi-experimental design that is typically used to estimate the effect of a specific intervention, policy or treatment. This method utilizes panel data from treatment and control groups to construct an appropriate counterfactual to identify a causal effect. DID compares the changes in outcomes over time between the treatment group and the control group. The DID approach requires several important assumptions about some features of the treatment and the outcome variables. Otherwise, this method should not be used. The so-called “parallel-trends assumption” is the most critical assumption to ensure internal validity of a DID model. We will test this assumption later. A standard DID model has the form of a traditional panel data econometric regression equation, and thus can be estimated conveniently.
The DID model used in this study is expressed by the following two-way fixed-effects regression equation:
where the dependent variable represents the economic growth in city i during year t, which is measured by the annual GDP growth rate. The core explanatory variable of interest, , is an indicator of the SDPRC policy. = 1 for treated cities if 2013, and = 0 otherwise. is a vector of control variables. is the city-fixed effect, and is the year-fixed effect. is the error term. , , and are parameters that were estimated. We particularly focus on the value of , which captures the average impact of the policy on economic growth in resource-based cities. The variables in Equation (1) are described in detail below.
3.2. Variables
3.2.1. Dependent Variable
In Equation (1), the dependent variable is , which is the annual GDP growth rate in city i in year t. To eliminate the influence of inflation, GDP is deflated based on a constant price level. Accordingly, the GDP used in our empirical analysis is the “real GDP”.
3.2.2. Core Explanatory Variable of Interest
The core explanatory variable of interest in our study is , which is a binary dummy variable denoting whether the SDPRC policy was implemented in city i in year t. = 1 if city i was included in the “National Sustainable Development Plan of Resource-Based Cities (2013–2020)” and 2013. Otherwise, = 0.
3.2.3. Control Variables
The control variable vector contains the following eight city-level variables that may affect economic growth: , , , , , , , and .
is the logarithmic value of the population, namely, the number of local residents (thousand persons). Although, keeping other factors unchanged, an increase in population would lead to an expansion in aggregate economic scale, the agglomeration of population might bring about some social and management problems (e.g., crime and pollution) that inhibit economic growth.
is an indicator of the abundance of medical infrastructure. It is proxied by the logarithmic value of the number of hospital beds per thousand residents. An improvement in medical infrastructure can promote the health and human capital of local residents, and, thus, facilitate economic growth.
is an indicator of the transport infrastructure, proxied by a binary dummy variable denoting whether the city was connected to the national high-speed railway network. = 1 if city i had at least one high-speed railway station in year t, and = 0 otherwise. On the one hand, the availability of transport infrastructure is a foundation for economic development. On the other hand, if transport infrasturcture is already sufficient, the overinvestment in infrastructure would be a waste of money and fail to boost economic growth.
is the government size, measured by the ratio of local government spending to GDP. This variable is used to capture the influence of the local government, as the government plays a crucial role in local economic development. Government size may be either positively or negatively correlated with the GDP growth rate, contingent on the specific behaviors of the public sector.
is the level of financial development, measured by the ratio of bank credits to GDP. is the degree of financial openness, proxied by the ratio of foreign direct investments to GDP. is the trade openness, measured by the ratio of international trade volume to GDP. refers to the industrial structure, indicated by the share of non-agricultural value added in GDP. These four variables describe the general structural characteristics of the local economy. Transitions in economic structure will cause changes in GDP growth.
3.3. Data
The variable is constructed according to the name list of resource-based cities, which was published on the website of China’s central government (http://www.gov.cn/zwgk/2013-12/03/content_2540070.htm, accessed on 1 March 2022). The data of other variables were obtained from the database of the EPS China Data (http://www.epschinadata.com, accessed on 1 March 2022).
Our available data ended in 2019. As the SDPRC policy was implemented in 2013, we have the data of 7 years, during 2013–2019, to analyze the after-policy circumstance. For symmetry, we collected the data of 7 years during 2006–2012 to analyze the before-policy situation. Thus, in the time dimension, our sample period covered 14 years, between 2006 and 2019. In the geographical dimension, we collected the data of 329 Chinese cities, including 325 prefecture-level and 4 province-level cities (i.e., Beijing, Tianjin, Shanghai, and Chongqing). In the sample, 126 prefecture-level cities have implemented the SDPRC policy since 2013; and 203 cities have never implemented the policy. The sample covers almost all regions in Mainland China. The data for several cities in some years were missing. Our final sample is a slightly unbalanced panel containing 4475 observations. In order to exclude the possible bias caused by outliers, we winsorized all continuous variables at their top and bottom 0.5% quantiles. The descriptive statistics of variables used in our study are reported in Table 1.
4. Regression Results
This section presents the core empirical results in this study. We report the detailed estimation results of Equation (1) and some robustness checks in Section 4.1 and Section 4.2, respectively. Then, in Section 4.3, we test the parallel-trend assumption, which is the prerequisite for using the difference-in-difference model.
4.1. Main Result
Table 2 reports the estimated impact of the SDPRC policy on economic growth rate. The estimation result of Equation (1) is demonstrated in column (i) of the table. The coefficient of is −0.615, which is statistically significant at the 5% level. The coefficient indicates that, on average, the SDPRC policy reduced the GDP growth rate in resource-based cities by 0.615 percentage points. This is an undesirable policy effect. If the 0.615-percentage-point decrease in GDP growth rate can be prevented, a substantial economic benefit would be obtained, given the large size of the Chinese economy. For instance, in 2019, the aggregate nominal GDP in all resource-based cities was CNY 43 trillion. A 0.615-percentage-point change in annual GDP growth rate would cause a change in the scale of annual GDP by CNY 0.264 (= 43 × 0.615%) trillion, which is approximately USD 39 billion. This size is even larger than the economic scale of many countries, such as Cambodia, Paraguay, and Uganda.
The control variables contained in Equation (1) also affected the economic growth rate. The expansion of population and improvement in medical infrastructure substantially increased the GDP growth rate. The expansion of bank credits demonstrated a significant negative effect. The degree of financial openness and the share of non-agricultural industry in the economy were positively related to economic growth. The operation of high-speed railway, government size, and trade openness did not show a significant effect.
4.2. Robustness Checks
In this subsection, we conduct four robustness checks to examine whether our result reported in column (i) of Table 2 is sensitive to the selection of the indicator for economic growth, the existence of possible outliers, and the selection of the estimation method.
First, we check whether our main result holds if we use alternative indicators of economic growth. Previously, we used the annual GDP growth rate to measure economic growth. Now, we take the annual growth rate of GDP per capita as the dependent variable in Equation (1) and re-estimate the regression coefficients. The estimation result is reported in column (ii) of Table 2. The coefficient of the SDPRC policy is −2.094, which is significant at the 1% level. Our main finding about the adverse effect of the policy still holds. In addition, we tried to use the annual growth rate of night lights to measure economic growth, with the remote-sensing-night-light data from the CNRDS database (https://www.cnrds.com, accessed on 1 March 2022). The estimated coefficient of the SDPRC policy is also significantly negative, although the corresponding regression result is not reported here to save space.
Second, it is notable that a few of the non-resource-based cities contain some resource-based counties. These resource-based counties were also covered by the SDPRC policy. In most cases, those resource-based counties only accounted for a small part of the non-resource-based cities to which they belong. That is why we did not consider them in the previous analysis. Now we examine whether our main research finding still holds if those non-resource-based cities containing resource-based counties are eliminated from our sample. The regression result is reported in column (iii) of Table 2, which gives a coefficient of −0.802 for . This coefficient is significant statistically.
Third, the resource- and non-resource-based cities might have substantial heterogeneities and these two types of cities might not be sufficiently comparable for conducting a standard DID analysis. To mitigate this concern, a widely used approach is to employ the PSM-DID (propensity score matching difference-in-difference) method. We use the PSM-DID to estimate the effect of the SDPRC policy. As reported in column (iv) of Table 2, the variable has a significantly negative coefficient of −0.713.
Fourth, considering that a region’s economic growth might be persistent, we expect the GDP growth rate in one year to be correlated with its value in the previous year. Hence, we construct a dynamic panel model as follows: , where the coefficient captures the influence of the economic growth in the last year. This dynamic panel model is estimated using the System-GMM (generalized method of moments). This time, as reported in column (v) of Table 2, the estimated coefficient of becomes −1.015, which is also significantly negative.
In addition, we also realize that some other city-specific policies might also affect the economic growth at the city level. Thus, we conducted extra robustness checks by adding the dummy variables for several other policies into Equation (1). The policies we took into account include the resource-exhausted city support policy in 2008, 2009 and 2012 [31], the low-carbon city pilot project in 2010, 2012 and 2017 [32,33], the smart-city pilot project in 2013 and 2015 [34], the clean-winter-heating plan in Northern China in 2017 [35], and the real-estate-purchase restriction policy in different years [36]. After adding the dummy variables of these policies separately or simultaneously into Equation (1), the estimated impact of the SDPRC policy is still significantly negative and very close to our baseline estimate. In order to save space, the detailed regression results are not reported here.
Overall, a series of robustness checks provide evident support to our main finding, that the SDPRC policy reduced the macroeconomic growth in resource-based cities.
4.3. Test for Parallel Trend
A core premise for using the different-in-difference model is the parallel-trend assumption. This assumption means that, in the absence of treatment, the average outcome variables in the treated and control groups would have followed parallel trends over time. If the parallel-trend assumption is violated, our previous regression analyses would be unreliable. In this subsection, we use a regression-based method to test the validity of the parallel-trend assumption. This method estimates the pre-treatment differences in trends between the treated and control groups. In our research, the test is based on the following regression equation:
where the indicator variable = 1 if the SDPRC policy was at its k-th year of implementation at the resource-based city i in year t, and = 0 otherwise. For example, = 1 for a resource-based city in the year 2012 (i.e., one year before the policy implementation); and = 0 for a non-resource-based city in the year 2015 (i.e., two years after the policy implementation). Other variables in Equation (2) are the same as those in Equation (1). The coefficients (k = −7, −4,…, 6) measure the difference in economic growth rate between resource- and non-resource-based cities in various years, after we control other potential factors that influence the economic growth. If the parallel-trend assumption holds, the estimated values of for k < 0 should not be significantly different from 0.
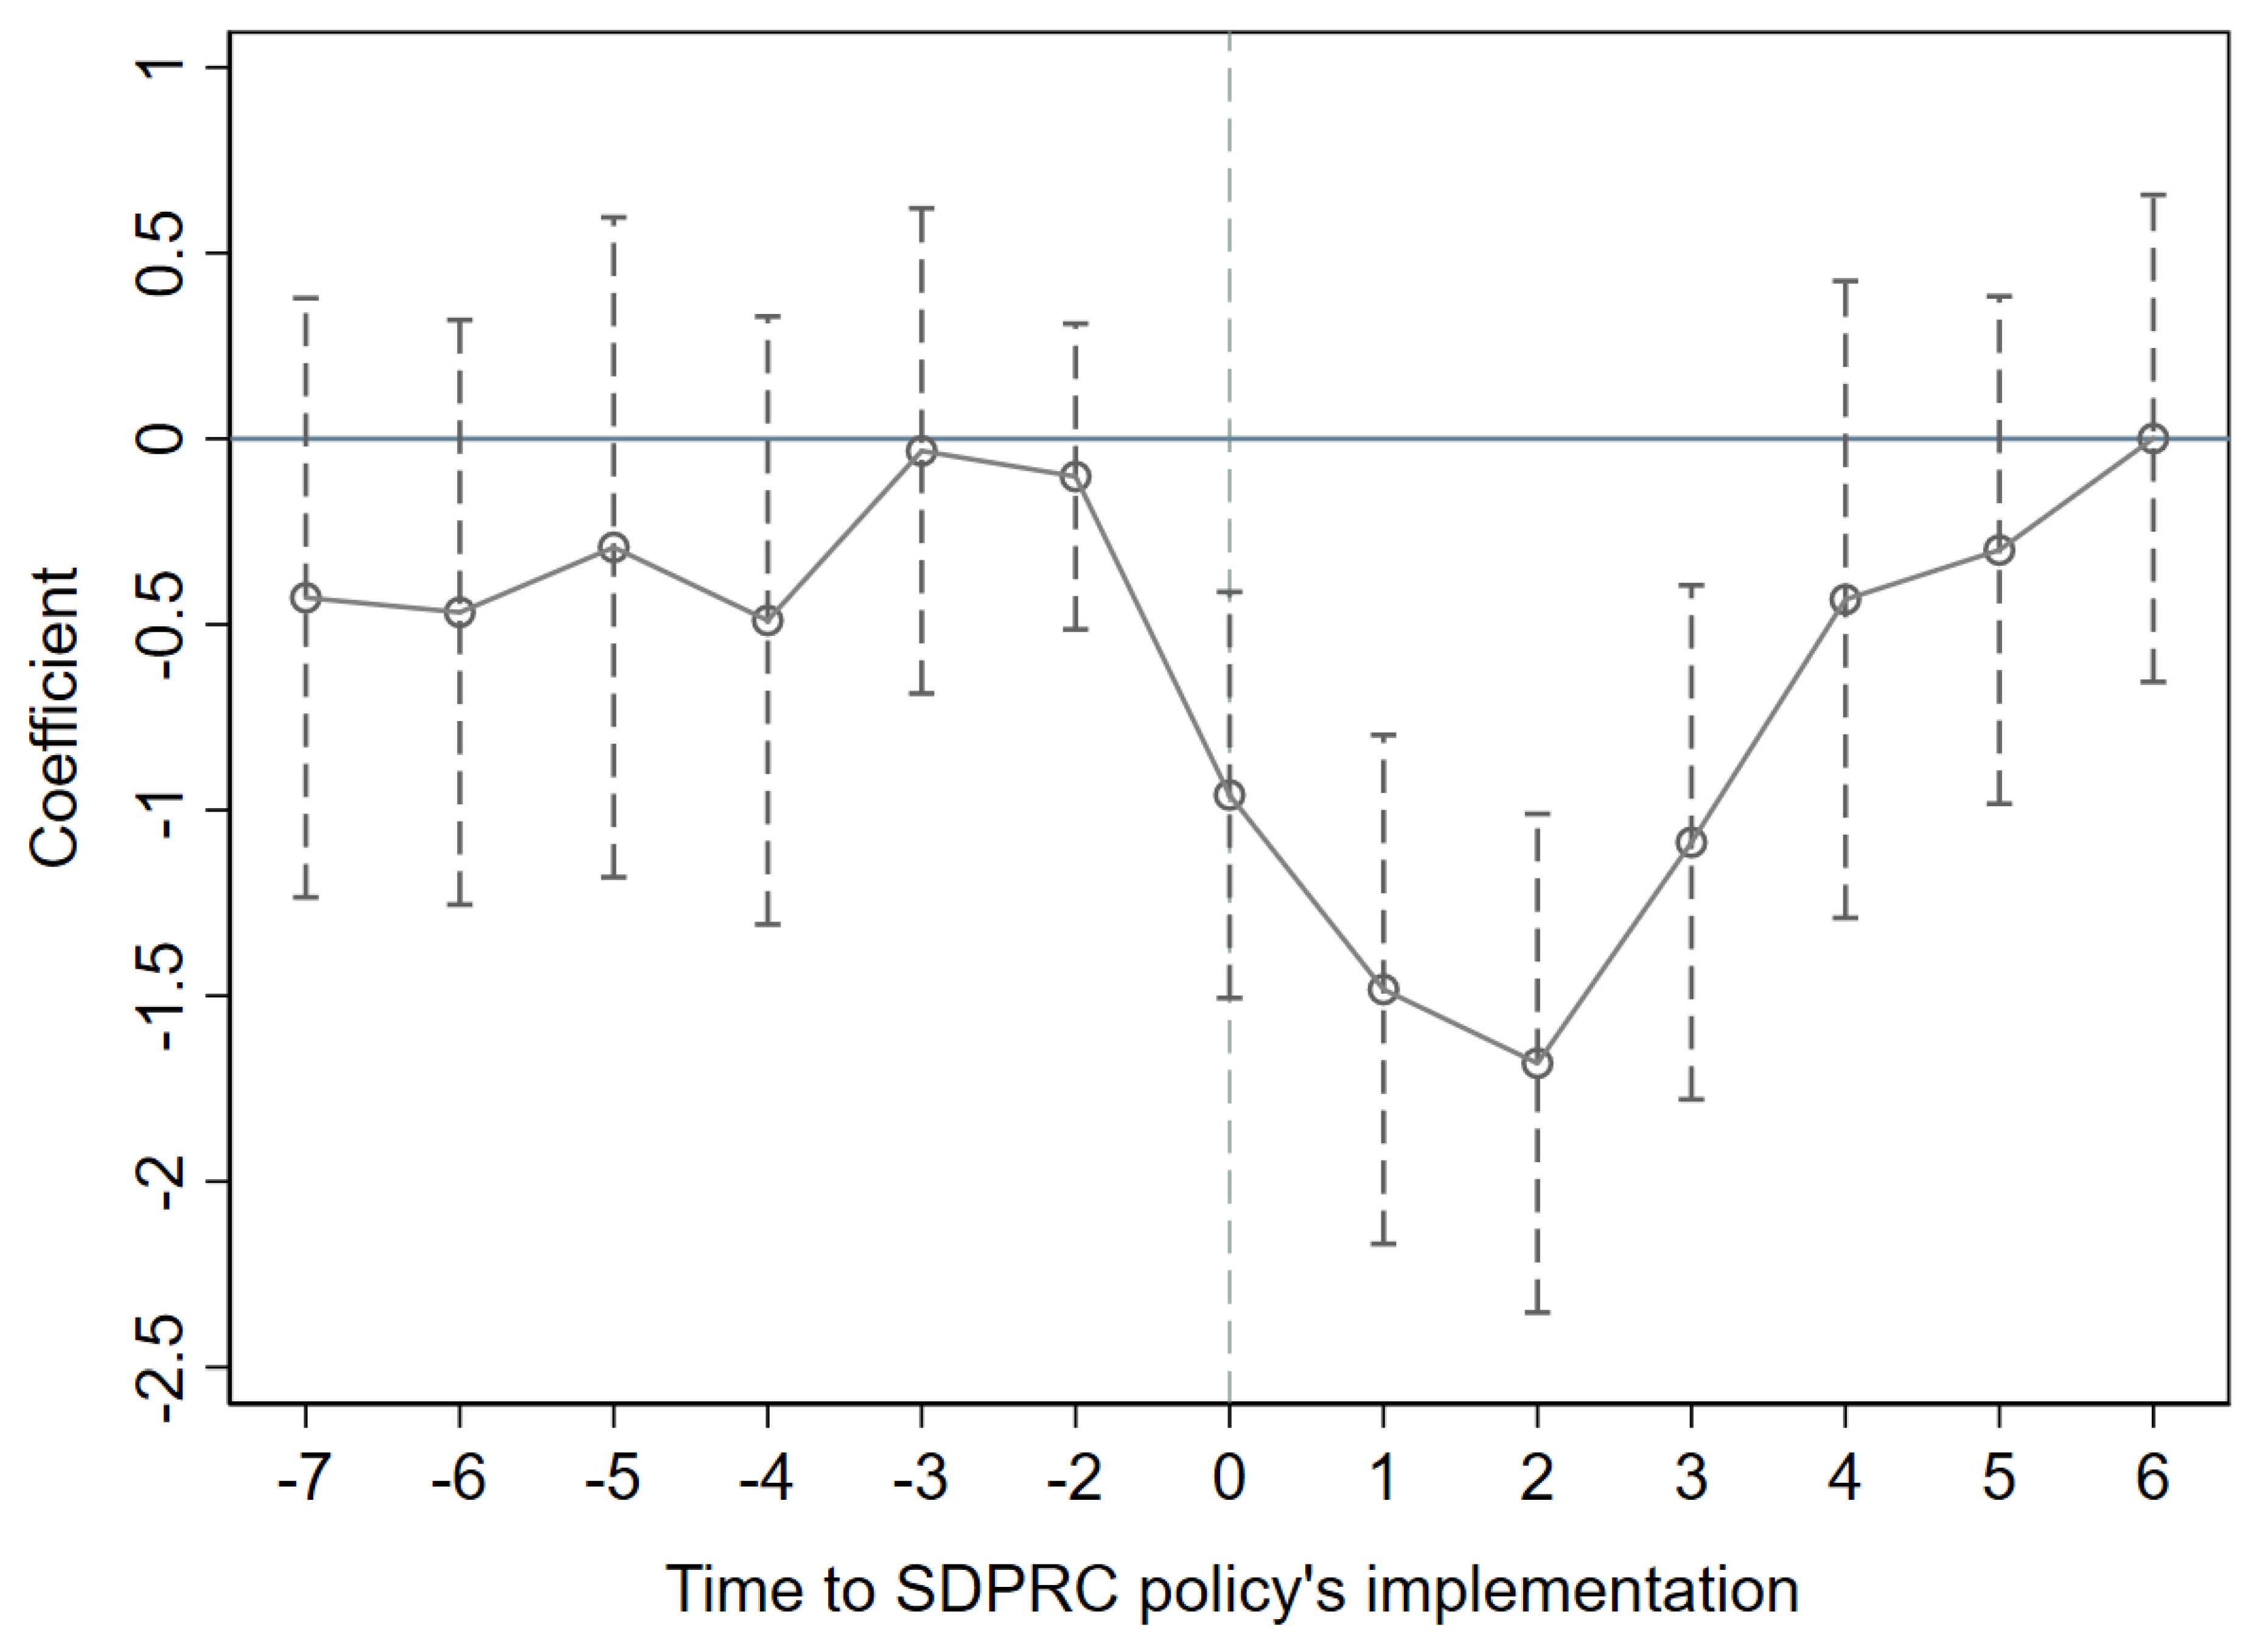
Figure 2 demonstrates the result of the parallel-trend test. The estimated values of with the corresponding 95% confidence interval are plotted in the graph. The coefficient is not displayed because the year 2012 is taken as the base period. As shown clearly in the figure, the coefficients , , , , , and are all not significantly different from 0. This indicates that, before the policy implementation in 2013, the GDP growth rates in resource- and non-resource-based cities had no significant difference, if other influencing factors of economic growth are controlled. In other words, the parallel-trend assumption is satisfied, and, hence, we can use the DID model to identify the causal effect of the policy on economic growth.
In addition, the figure shows that, after 2013, the relative economic growth rate in resource-based cities compared to that in non-resource-based cities became significantly lower. This implies that the SDPRC policy carried out in 2013 significantly depressed resource-based cities’ economic growth. This is consistent with our main finding reported in Table 2. From the figure, we can also observe the dynamic effects of the policy in different years. In 2013, the initial year of the policy, the impact was already significant statistically. Between 2013 and 2015, the policy effect became stronger with the passage of time. The policy’s effect in 2016 was weaker than that in 2015. After 2017, the policy effect was still negative, but not significant statistically.
5. Mechanism Analysis and Heterogeneities
In this section, we explore the mechanism through which the SDPRC policy reduced the economic growth in resource-based cities, and we analyze whether the impact of the SDPRC policy on economic growth had heterogeneities across different regions. We find that the SDPRC policy substantially dampened technological advancement, while it did not have an evident impact on the production inputs in resource-based cities. These two phenomena can, at least partially, explain why the policy actually lowered the economic growth rate.
5.1. Mechanism Analysis
The regression results reported in Section 4 demonstrated robust evidence that the SDPRC policy decreased the economic growth rate in resource-based cities. The policy might take effect through many various channels, as the policy was associated with numerous different governmental measures influencing economic, social, technical and ecological aspects. We conjecture that the degree of technological advancement and variation in production inputs were two important mediating factors between the SDPRC policy and economic growth.
5.1.1. Technological Advancement
Technological advancement plays an important role in affecting economic growth. An increase in regional innovation and technology level can stimulate economic growth, because innovation and technological advancement can improve productivity and create more efficient ways of production [37,38,39,40,41]. On the contrary, a decrease in innovation and technology level will cause the economic growth rate to decline. Theoretically, the impact of the SDPRC policy on technological advancement is ambiguous. On the one hand, the government might take actions to encourage local R&D, innovation, and technological advancement, in order to improve the productivity and efficiency of firms. On the other hand, as the government imposed additional requirements and regulations on firms in order to achieve multiple policy objectives, firms’ production costs probably increased and it became more difficult for them to invest in R&D activities and improve their technology levels.
To examine the impact of the SDPRC policy on technological advancement, we use the indicators of technological advancement to replace the dependent variable in Equation (1), and formulate the following regression equation:
where is an indicator of technological advancement in city i in year t, and other variables are the same as those in Equation (1).
We analyze four different variables associated with technological advancement and use each of them as the dependent variable in Equation (3) one by one. The effects of the SDPRC policy on these four dependent variables are estimated, respectively. Estimation results are reported in Table 3. (1) We take the number of annual new-patent applications per unit of GDP (billion CNY) to measure the innovation ability of each city, with the patent data from the CNRDS database. As reported in column (i) of Table 3, the estimated coefficient of is −6.973 and it is statistically significant, indicating that the SDPRC policy depressed the innovation ability of resource-based cities. (2) We use the number of employees in scientific research and technology services per million local residents to measure the proportion of R&D personnel in the population. As reported in column (ii) of Table 3, the estimated coefficient of is −0.0754. This implies that the proportion of R&D personnel decreased after the implementation of the policy. (3) We also examine whether the local government provided more fiscal support for local scientific and technological activities. We calculate the ratio of local governmental spending for scientific and technological affairs to GDP and use this ratio to measure the degree of governmental support. As shown in column (iii) of Table 3, has a significantly negative coefficient of −0.0371. Local governments’ fiscal support for science and technology declined after the implementation of the policy. (4) Informatization has played a crucial role in China’s technological advancement during the past two decades. We use the share of internet users in the population to proxy the informatization level. The estimated coefficient of is −0.0162, as reported in column (iv) of Table 3. The informatization level was reduced as a result of the policy.
In a nutshell, we inspect the impact of the SDPRC policy on the technological advancement in resource-based cities from various aspects. We derive the finding that local technological advancement was depressed by the policy.
5.1.2. Production Input
Given the existing technology level, growth in economies requires the expansion of production inputs. Labor and capital are two most important kinds of production inputs. If the SDPRC policy can increase labor input and capital investment, the GDP in resource-based cities would grow. However, it is theoretically unclear whether the policy enlarges production inputs or not. On the one hand, as the targets of the SDPRC policy covered some contents about GDP growth and income increase, local governments probably took effective actions to encourage the expansion of production inputs, in order to achieve the economic-growth-relevant policy targets. On the other hand, the production inputs might not be significantly expanded because the governments possibly prioritized some other important policy goals such as industrial structure transition and environmental quality improvement, rather than regional GDP growth.
To examine the effect of the SDPRC policy on production inputs, we use the indicators of production inputs to replace the dependent variable in Equation (1), and construct the following regression equation:
where is an indicator of labor or capital input in city i in year t, and other variables are the same as those in Equation (1).
We consider four different indicators of production inputs, including two variables about labor input and two variables about capital investment. (1) The first variable is the annual population growth rate. (2) The second variable is the unemployment rate. (3) The third variable is the annual investment growth rate, where the investment refers to the amount of fixed capital formation measured in a constant price level. (4) The fourth variable is the capital formation rate, which is the ratio of fixed capital formation to GDP.
We estimate the effects of the SDPRC policy on the four different indicators of production inputs, respectively. Estimation results are demonstrated in Table 4. As shown in columns (i)–(iv), the impacts of the SDPRC policy on the population growth rate, unemployment rate, investment growth rate, and capital formation rate, are all not significant statistically. On the whole, we do not detect any beneficial influence of the SDPRC policy on the expansion of production inputs.
5.2. Heterogeneity Analysis
Our previous analysis took all resource-based cities together and estimated the average treatment effect of the SDPRC policy on GDP growth rate. In this subsection, we analyze whether the impact of the SDPRC policy is homogeneous for all cities. We divide the sample cities into several groups based on some classification criteria. Then, we utilize Equation (5) to examine the possible heterogeneities across different kinds of cities:
where is a binary dummy variable that indicates the group into which city i is classified. The detailed definition of will be explained later. The effect of the policy in cities that belong to group k is measured by the coefficient . Other variables in Equation (5) are the same as those in Equation (1).
5.2.1. Development-Stage Heterogeneity
The official document of the SDPRC policy classified the resource-based cities into four types according to their development stages: growing, mature, declining, and regenerative resource-based cities. We set four dummy variables, , , , and , for these four types. For instance, = 1 if the city is a growing resource-based city, and = 0 otherwise. The dummy variables , , and are defined in similar ways.
The estimation result is reported in column (i) of Table 5. It is shown that the policy had significantly negative effects in declining and regenerative resource-based cities, while the effects in growing and mature cities were not significant. The policy had no significant impact in growing and mature cities probably because these two kinds of cities had relatively strong economic vitality and had sufficient innovation and capability to avoid a decline in economic growth rate.
5.2.2. Spatial Heterogeneity
Spatially, Mainland China can be classified into three large regions: the eastern, central, and western parts. Compared to the central and western districts, the eastern area has the highest economic development level, urbanization rate, and economic vitality. We set two dummy variables: and . = 1 and = 0 if the city is located in the eastern region. = 0 and = 1 if the city is located in the central or western region.
The estimation result is reported in column (ii) of Table 5, and shows that the policy had significantly negative effects in central and western resource-based cities, while the effect in eastern cities was insignificant. The policy did not significantly affect the economic growth in the eastern region, probably because the eastern region most actively adopted new technologies and improved its efficiencies, and, thus, could more easily avoid the decline in economic growth caused by the SDPRC policy.
The analysis of the circumstances across different kinds of cities shows that the impact of the SDPRC policy was heterogeneous, depending on a city’s specific development stage and spatial location. The policy’s impact on economic growth was statistically significant in some cities, but not significant in some other cities, though the estimated effect was always negative.
6. Conclusions, Discussion, and Limitations
6.1. Conclusions
In summary, this study empirically analyzes the impact of China’s “Sustainable Development Plan of Resource-Based Cities” on local economic growth, based on the data covering 329 cities during 2006–2019. A difference-in-difference regression model is used for quantitative evaluation. It is found that the policy actually decreased economic growth, which is measured by the annual real GDP growth rate. On average, the policy caused a 0.615-percentage-point reduction in the GDP growth rate in resource-based cities. Moreover, it is found that, after the policy was implemented, innovation and technological advancement in resource-based cities declined, and the production inputs did not expand. These findings help explain why the policy caused a reduction in economic growth rate. The heterogeneity analysis indicates that the impact of the policy differed among different cities. The policy’s adverse impact on economic growth was particularly strong in resource-based cities at the declining and regenerative development stages, and in cities located in the central and western regions. These cities should pay more attention to mitigating the economic growth problem during the process of economic transformation.
6.2. Discussion
The findings in this study have the following implications for the economic management practices. First, during the implementation of the sustainable-development policies for resource-based cities, the government should pay attention to the economic growth problem. Although resource-based cities might have transformed their industrial structures and reduced pollution by implementing the SDPRC policy, long-run sustainable development cannot be ensured if resouced-based cities fail to maintain the economic growth. The SDPRC policy has caused a substantial decline in economic growth rate, which implies the occurence of large implicit economic losses. The local governments in resource-based cities have to adjust some of their previous actions and the central government may need to offer new policies to facilitate economic growth in the targeted cities. On the basis of the existing industrial foundation of resource-based cities, the government should formulate long-term plans for industrial updates, make full use of comparative advantages, and enhance industrial competitiveness to construct a diversified economic system and optimize resource utilization. It should be particularly emphasized that investments in pillar industries need to follow the long-term orientation of the city, because governments’ short-term expectations may lead to a surplus of industrial capacity in resource-based cities [42].
Second, as reported by our study, the SDPRC policy significantly inhibited technological advancement in resource-based cities. Technological advancement is a key to promoting a sustainable economic-development pattern. For instance, as suggested by Guo et al. [43], the government can attempt to transform the economies of coal and oil resource-based cities through energy-technology innovation. The government has to find effective ways to encourage R&D and innovative activities in resource-based cities. Resource-based cities should implement innovation-driven development strategies, including accelerating technological inventions, transforming and upgrading traditional industries with high-tech and advanced applicable technologies, and encouraging scientific and technological activities in both the private and public sectors [42]. Some favorable financial and fiscal instruments could be employed to attract firms with high productivity and high efficiency. In addition, the government may need to identify whether some previous policies or institutions had adverse impacts on local innovation and the adoption of new technologies. For example, some literature suggested that policy uncertainty and administrative inefficiency of public sectors actually dampened private sectors’ intrinsic incentives for R&D [44,45]. Some reforms should be conducted to deal with these existing problems.
Third, our analysis points out that resource-based cities failed to expand more production inputs after 2013, relative to non-resource-based cities. The government should think about how to attract capital investments and high-quality labor and balance the relationship between energy consumption, economic growth and various investment to achieve high-quality economic development [46]. Along with the economic transformation of resource-based cities, the scale of industries (e.g., lumbering, metallurgy, mining, and petroleum extraction) that heavily rely on natural resources was largely reduced. Resource-based cities should cultivate replacement industries such as the service and high-technology manufacturing industries, in order to provide more space for the inflow of new labor and investments. Local economic, political, and social environments should be ameliorated to offer favorable business conditions for entrepreneurs and corporations.
Lastly, the SDPRC policy had heterogeneous effects in different cities. Policymakers should adjust measures to local conditions and adopt different strategies because the determinants that influence the development of each city are various [47]. Klopp and Petretta [48] and Moreno Pires et al. [49] suggested that, to establish quantitative indicator targets about specific tasks in each city, which can make the policy more implementable, goal achievement should be presented clearly, and a reference provided for appropriate decision making and policies. A more systematic and comprehensive perspective is helpful to better evaluate the development of resource-based cities and explore the characteristics of each city.
6.3. Limitations
This research has some limitations that can be addressed in future studies. First, because of the data availability issue, the sample period analyzed in this research ended in 2019. Thus, it is uncertain whether the economic growth problem identified in our study still existed after 2019. Future studies can collect the latest data and provide new information about resource-based cities in the current COVID-19-pandemic era. For instance, under the impact of the COVID-19 pandemic, the ideas of green, low-carbon, and sustainable development have become more popular globally. In this case, have the resource-based cities clearly transformed their economic structures in response to the pandemic? Have they adopted low-carbon and intelligent production modes more quickly? Have their economic activities become more efficient and more environmentally friendly? These are all interesting research questions. Second, our research considered each city as a whole economy and did not distinguish different industrial sectors. In the future, it is worth exploring whether the policy had different impacts on different categories of industries, in order to provide specific suggestions for the corresponding sectors. Third, although our research provided evidence that the SDRPC policy’s effect on the economic growth was negative, an important question that remained unanswered is why the policy reduced the macroeconomic growth in resource-based cities. Were there errors in the initial design of the policy, the process of program implementation, or others? Researchers need to consider and investigate this profoundly in the future.
Funding
This research received no external funding.
Institutional Review Board Statement
Not applicable.
Informed Consent Statement
Not applicable.
Data Availability Statement
The data used in the current study are available from the author on request.
Acknowledgments
The author is grateful to the editors and anonymous referees for their comments and suggestions.
Conflicts of Interest
The author declares no conflict of interest.
References
- Fan, F.; Zhang, X. Transformation effect of resource-based cities based on PSM-DID model: An empirical analysis from China. Environ. Impact Assess. Rev. 2021, 91, 106648. [Google Scholar] [CrossRef]
- Li, Q.; Zeng, F.; Liu, S.; Yang, M.; Xu, F. The effects of China’s sustainable development policy for resource-based cities on local industrial transformation. Resour. Policy 2021, 71, 101940. [Google Scholar] [CrossRef]
- Ruan, F.; Yan, L.; Wang, D. The complexity for the resource-based cities in China on creating sustainable development. Cities 2020, 97, 102571. [Google Scholar] [CrossRef]
- Martinez-Fernandez, C.; Wu, C.T.; Schatz, L.K.; Taira, N.; Vargas-Hernández, J.G. The Shrinking Mining City: Urban Dynamics and Contested Territory. Int. J. Urban Reg. Res. 2012, 36, 245–260. [Google Scholar] [CrossRef]
- Cherif, R. The Dutch disease and the technological gap. J. Dev. Econ. 2013, 101, 248–255. [Google Scholar] [CrossRef]
- Dülger, F.; Lopcu, K.; Burgaç, A.; Ballı, E. Is Russia suffering from Dutch Disease? Cointegration with structural break. Resour. Policy 2013, 38, 605–612. [Google Scholar] [CrossRef]
- Takatsuka, H.; Zeng, D.Z.; Zhao, L. Resource-based cities and the Dutch disease. Resour. Energy Econ. 2015, 40, 57–84. [Google Scholar] [CrossRef]
- Terreaux, J.P. The rise and fall of La Graufesenque: The fate of development based on a non-renewable resource. Ecol. Econ. 2022, 196, 107412. [Google Scholar] [CrossRef]
- Auty, R.M. Natural resources, capital accumulation and the resource curse. Ecol. Econ. 2007, 61, 627–634. [Google Scholar] [CrossRef]
- Endo, K.; Ikeda, S. How can developing countries achieve sustainable development: Implications from the inclusive wealth index of ASEAN countries. Int. J. Sustain. Dev. World Ecol. 2022, 29, 50–59. [Google Scholar] [CrossRef]
- Mien, E.; Goujon, M. 40 Years of Dutch Disease Literature: Lessons for Developing Countries. Comp. Econ. Stud. 2021. [Google Scholar] [CrossRef] [PubMed]
- Taguchi, H.; Khinsamone, S. Analysis of the ‘Dutch Disease’ Effect on the Selected Resource-Rich ASEAN Economies. Asia Pac. Policy Stud. 2018, 5, 249–263. [Google Scholar] [CrossRef]
- Banerjee, A.; Duflo, E.; Qian, N. On the road: Access to transportation infrastructure and economic growth in China. J. Dev. Econ. 2020, 145, 102442. [Google Scholar] [CrossRef] [Green Version]
- Wu, C.; Zhang, N.; Xu, L. Travelers on the Railway: An Economic Growth Model of the Effects of Railway Transportation Infrastructure on Consumption and Sustainable Economic Growth. Sustainability 2021, 13, 6863. [Google Scholar] [CrossRef]
- Hu, M.; Zhang, J.; Chao, C. Regional financial efficiency and its non-linear effects on economic growth in China. Int. Rev. Econ. Financ. 2019, 59, 193–206. [Google Scholar] [CrossRef]
- Nguyen, H.M.; Thai-Thuong Le, Q.; Ho, C.M.; Nguyen, T.C.; Vo, D.H. Does financial development matter for economic growth in the emerging markets? Borsa Istanb. Rev. 2021. [Google Scholar] [CrossRef]
- Huang, J.; Chen, X.; Huang, B.; Yang, X. Economic and environmental impacts of foreign direct investment in China: A spatial spillover analysis. China Econ. Rev. 2017, 45, 289–309. [Google Scholar] [CrossRef]
- Su, Y.; Liu, Z. The impact of foreign direct investment and human capital on economic growth: Evidence from Chinese cities. China Econ. Rev. 2016, 37, 97–109. [Google Scholar] [CrossRef]
- Chen, J.; Dong, B. A Nonparametric Estimation on the Effects of Import and Export Trade to Economic Growth in China. Procedia Eng. 2012, 29, 952–956. [Google Scholar] [CrossRef] [Green Version]
- Yu, Q. Capital investment, international trade and economic growth in China: Evidence in the 1980–1990s. China Econ. Rev. 1998, 9, 73–84. [Google Scholar] [CrossRef]
- Feng Lu, S.; Yao, Y. The Effectiveness of Law, Financial Development, and Economic Growth in an Economy of Financial Repression: Evidence from China. World Dev. 2009, 37, 763–777. [Google Scholar] [CrossRef]
- Ding, Y.; McQuoid, A.; Karayalcin, C. Fiscal decentralization, fiscal reform, and economic growth in china. China Econ. Rev. 2019, 53, 152–167. [Google Scholar] [CrossRef]
- Xue, W.; Yilmazkuday, H.; Taylor, J.E. The impact of China’s fiscal and monetary policy responses to the great recession: An analysis of firm-level Chinese data. J. Int. Money Financ. 2020, 101, 102113. [Google Scholar] [CrossRef] [Green Version]
- Lu, C.; Wang, D.; Meng, P.; Yang, J.; Pang, M.; Wang, L. Research on Resource Curse Effect of Resource-Dependent Cities: Case Study of Qingyang, Jinchang and Baiyin in China. Sustainability 2019, 11, 91. [Google Scholar] [CrossRef] [Green Version]
- Owen, J.R.; Kemp, D.; Marais, L. The cost of mining benefits: Localising the resource curse hypothesis. Resour. Policy 2021, 74, 102289. [Google Scholar] [CrossRef]
- Rahim, S.; Murshed, M.; Umarbeyli, S.; Kirikkaleli, D.; Ahmad, M.; Tufail, M.; Wahab, S. Do natural resources abundance and human capital development promote economic growth? A study on the resource curse hypothesis in Next Eleven countries. Resour. Environ. Sustain. 2021, 4, 100018. [Google Scholar] [CrossRef]
- Zhou, H.; Gu, G. Assessment on pollution reduction effects of sustainable development policy in Chinese resource-based cities. J. Arid. Land Resour. Environ. 2020, 34, 50–57. [Google Scholar] [CrossRef]
- Meng, Y.; Liu, L.; Wang, J.; Ran, Q.; Yang, X.; Shen, J. Assessing the Impact of the National Sustainable Development Planning of Resource-Based Cities Policy on Pollution Emission Intensity: Evidence from 270 Prefecture-Level Cities in China. Sustainability 2021, 13, 7293. [Google Scholar] [CrossRef]
- Zhang, Y.; Zheng, H.; Ge, L. The Impact of Sustainable Development Policy of Resource-based Cities on Carbon Emissions. J. Financ. Econ. 2022, 48, 49–63. [Google Scholar] [CrossRef]
- Zheng, H.; Ge, L. The impact of sustainable development in resource-based cities on carbon emissions: From the perspective of resource dependence. China Environ. Sci. 2022. [Google Scholar] [CrossRef]
- Lu, H.; Liu, M.; Song, W. Place-based policies, government intervention, and regional innovation: Evidence from China’s Resource-Exhausted City program. Resour. Policy 2022, 75, 102438. [Google Scholar] [CrossRef]
- Huo, W.; Qi, J.; Yang, T.; Liu, J.; Liu, M.; Zhou, Z. Effects of China’s pilot low-carbon city policy on carbon emission reduction: A quasi-natural experiment based on satellite data. Technol. Forecast. Soc. Chang. 2022, 175, 121422. [Google Scholar] [CrossRef]
- Wen, S.; Jia, Z.; Chen, X. Can low-carbon city pilot policies significantly improve carbon emission efficiency? Empirical evidence from China. J. Clean. Prod. 2022, 346, 131131. [Google Scholar] [CrossRef]
- Guo, Q.; Wang, Y.; Dong, X. Effects of smart city construction on energy saving and CO2 emission reduction: Evidence from China. Appl. Energy 2022, 313, 118879. [Google Scholar] [CrossRef]
- Zhang, Z.; Zhou, Y.; Zhao, N.; Li, H.; Tohniyaz, B.; Mperejekumana, P.; Hong, Q.; Wu, R.; Li, G.; Sultan, M.; et al. Clean heating during winter season in Northern China: A review. Renew. Sustain. Energy Rev. 2021, 149, 111339. [Google Scholar] [CrossRef]
- Somerville, T.; Wang, L.; Yang, Y. Using purchase restrictions to cool housing markets: A within-market analysis. J. Urban Econ. 2020, 115, 103189. [Google Scholar] [CrossRef]
- Belloumi, M.; Touati, K. Do FDI Inflows and ICT Affect Economic Growth? An Evidence from Arab Countries. Sustainability 2022, 14, 6293. [Google Scholar] [CrossRef]
- Gyedu, S.; Heng, T.; Ntarmah, A.H.; He, Y.; Frimppong, E. The impact of innovation on economic growth among G7 and BRICS countries: A GMM style panel vector autoregressive approach. Technol. Forecast. Soc. Chang. 2021, 173, 121169. [Google Scholar] [CrossRef]
- Nguyen, C.P.; Doytch, N. The impact of ICT patents on economic growth: An international evidence. Telecommun. Policy 2022, 46, 102291. [Google Scholar] [CrossRef]
- Park, C.Y.; Shin, K.; Kikkawa, A. Demographic change, technological advance, and growth: A cross-country analysis. Econ. Model. 2022, 108, 105742. [Google Scholar] [CrossRef]
- Solomon, E.M.; van Klyton, A. The impact of digital technology usage on economic growth in Africa. Util. Policy 2020, 67, 101104. [Google Scholar] [CrossRef] [PubMed]
- He, S.Y.; Lee, J.; Zhou, T.; Wu, D. Shrinking cities and resource-based economy: The economic restructuring in China’s mining cities. Cities 2017, 60, 75–83. [Google Scholar] [CrossRef]
- Guo, P.; Wang, T.; Li, D.; Zhou, X. How energy technology innovation affects transition of coal resource-based economy in China. Energy Policy 2016, 92, 1–6. [Google Scholar] [CrossRef]
- Amore, M.D.; Minichilli, A. Local Political Uncertainty, Family Control, and Investment Behavior. J. Financ. Quant. Anal. 2018, 53, 1781–1804. [Google Scholar] [CrossRef]
- Dibiasi, A.; Abberger, K.; Siegenthaler, M.; Sturm, J.E. The effects of policy uncertainty on investment: Evidence from the unexpected acceptance of a far-reaching referendum in Switzerland. Eur. Econ. Rev. 2018, 104, 38–67. [Google Scholar] [CrossRef]
- Zeng, S.; Liu, Y.; Ding, J.; Xu, D. An Empirical Analysis of Energy Consumption, FDI and High Quality Development Based on Time Series Data of Zhejiang Province. Int. J. Environ. Res. Public Health 2020, 17, 3321. [Google Scholar] [CrossRef]
- Ruan, F.; Yan, L.; Wang, D. Policy effects on the sustainable development of resource-based cities in China: A case study of Yichun City. Resour. Policy 2021, 72, 102145. [Google Scholar] [CrossRef]
- Klopp, J.M.; Petretta, D.L. The urban sustainable development goal: Indicators, complexity and the politics of measuring cities. Cities 2017, 63, 92–97. [Google Scholar] [CrossRef]
- Moreno Pires, S.; Fidélis, T.; Ramos, T.B. Measuring and comparing local sustainable development through common indicators: Constraints and achievements in practice. Cities 2014, 39, 1–9. [Google Scholar] [CrossRef]
Figure 1.
Average annual growth rate of real gross domestic product (GDP) in resource- and non-resource-based cities in China during 2006–2019. Data source: author’s own calculation and the EPS China Data.
Figure 1.
Average annual growth rate of real gross domestic product (GDP) in resource- and non-resource-based cities in China during 2006–2019. Data source: author’s own calculation and the EPS China Data.

Figure 2.
Test for parallel trend. Note: The dashed lines in the graph show the 95% confidence interval of the estimated coefficients (k = −7, −6,…, 6) in Equation (2).
Figure 2.
Test for parallel trend. Note: The dashed lines in the graph show the 95% confidence interval of the estimated coefficients (k = −7, −6,…, 6) in Equation (2).


Table 1.
Descriptive statistics of variables.
| Variable | Definition | Obs | Mean | SD | Min | Max |
|---|---|---|---|---|---|---|
| Economic growth rate, measured by the annual growth rate (%) of real GDP (i.e., GDP calculated based on a constant price level). | 4475 | 10.714 | 4.143 | −4.600 | 22.600 | |
| Dummy variable for the policy of “National Sustainable Development Plan of Resource-Based Cities (2013–2020)”, which equals 1 for resource-based cities after 2013, and 0 otherwise. | 4475 | 0.188 | 0.391 | 0.000 | 1.000 | |
| Logarithmic value of population (thousand persons). | 4475 | 8.049 | 0.807 | 5.182 | 10.045 | |
| Medical infrastructure, proxied by the logarithmic value of the number of hospital beds per thousand residents. | 4475 | 1.391 | 0.427 | 0.205 | 2.364 | |
| Transport infrastructure, proxied by a dummy variable for high-speed rail, which equals 1 if the city has at least one high-speed railway station, and 0 otherwise. | 4475 | 0.338 | 0.473 | 0.000 | 1.000 | |
| Government size, measured by the ratio of government spending to GDP. | 4475 | 0.213 | 0.163 | 0.059 | 1.535 | |
| Financial development, measured by the ratio of bank credits to GDP. | 4475 | 0.847 | 0.496 | 0.156 | 3.200 | |
| Financial openness, measured by the ratio of foreign direct investments to GDP. | 4475 | 0.025 | 0.088 | 0.000 | 1.031 | |
| Trade openness, measured by the ratio of international trade volume to GDP. | 4475 | 0.197 | 0.349 | 0.000 | 2.374 | |
| Industrial structure, measured by the share of non-agricultural value added in GDP. | 4475 | 0.859 | 0.089 | 0.530 | 0.997 |
Abbreviations: GDP (gross domestic product), Max (maximum), Min (minimum), Obs (observations), SD (standard deviation).
Table 2.
Estimated impact of the SDPRC policy on economic growth rate.
| Variable | Robustness Checks | ||||
|---|---|---|---|---|---|
| Main Estimation Result | Use Growth Rate of GDP per Capita as Dependent Variable | Eliminate Sample Cities Containing Resource-Based Counties | Use PSM-DID Estimation | Use Dynamic Panel Model | |
| (i) | (ii) | (iii) | (iv) | (v) | |
| −0.615 ** | −2.094 *** | −0.802 *** | −0.713 ** | −1.015 *** | |
| [0.277] | [0.607] | [0.282] | [0.283] | [0.269] | |
| 4.103 *** | 10.56 *** | 3.360 *** | 4.059 *** | 0.814 * | |
| [1.176] | [2.946] | [1.187] | [1.233] | [0.421] | |
| 1.413 ** | −0.299 | 1.251 * | 1.449 ** | 0.914 | |
| [0.595] | [1.451] | [0.671] | [0.608] | [0.937] | |
| −0.117 | 0.274 | −0.134 | −0.106 | −0.345 | |
| [0.209] | [0.464] | [0.224] | [0.211] | [0.210] | |
| 0.619 | −5.834 ** | 0.538 | 0.342 | 3.187 ** | |
| [1.215] | [2.261] | [1.326] | [1.202] | [1.280] | |
| −1.095 *** | −3.271 *** | −1.352 *** | −0.954 ** | −1.186 ** | |
| [0.397] | [1.000] | [0.462] | [0.379] | [0.525] | |
| 8.954 ** | 13.51 *** | 7.589 ** | 23.52 *** | 0.738 | |
| [3.817] | [5.171] | [3.620] | [6.331] | [3.439] | |
| −0.457 | −4.515 *** | −0.447 | −0.274 | −1.297 | |
| [0.387] | [1.021] | [0.424] | [0.397] | [0.874] | |
| 20.52 *** | 48.67 *** | 18.92 *** | 20.27 *** | 9.182 * | |
| [3.202] | [6.946] | [3.236] | [3.197] | [4.737] | |
| - | - | - | - | 0.187 *** | |
| - | - | - | - | [0.049] | |
| City-fixed effect | Yes | Yes | Yes | Yes | Yes |
| Year-fixed effect | Yes | Yes | Yes | Yes | Yes |
| Number of cities | 329 | 329 | 257 | 327 | 329 |
| Number of observations | 4475 | 4475 | 3505 | 4412 | 4419 |
| R2 | 0.665 | 0.295 | 0.671 | 0.666 | - |
Note: *, ** and *** represent the statistical significance levels of 10%, 5% and 1%, respectively. The values in brackets are heteroscedasticity-robust standard errors.
Table 3.
Mechanism analysis: impact of the SDPRC policy on technological advancement.
| Variable | Patent | R&D Personnel | Government Support for Science and Technology | Informatization |
|---|---|---|---|---|
| (i) | (ii) | (iii) | (iv) | |
| −6.973 *** | −0.0754 *** | −0.0371 * | −0.0162 * | |
| [1.935] | [0.012] | [0.019] | [0.010] | |
| Control variables | Yes | Yes | Yes | Yes |
| City-fixed effect | Yes | Yes | Yes | Yes |
| Year-fixed effect | Yes | Yes | Yes | Yes |
| Number of cities | 329 | 293 | 292 | 293 |
| Number of observations | 4475 | 3976 | 3977 | 3946 |
| R2 | 0.553 | 0.262 | 0.23 | 0.521 |
Note: * and *** represent the statistical significance levels of 10% and 1%, respectively. The values in brackets are heteroscedasticity-robust standard errors. To save space, the estimated coefficients of control variables are not reported in the table.
Table 4.
Mechanism analysis: impact of the SDPRC policy on labor input and capital investment.
| Variable | Population Growth Rate | Unemployment Rate | Investment Growth Rate | Capital Formation Rate |
|---|---|---|---|---|
| (i) | (ii) | (iii) | (iv) | |
| 0.0193 | 0.0647 | −0.026 | 0.0606 | |
| [0.015] | [0.056] | [0.024] | [0.041] | |
| Control variables | Yes | Yes | Yes | Yes |
| City-fixed effect | Yes | Yes | Yes | Yes |
| Year-fixed effect | Yes | Yes | Yes | Yes |
| Number of cities | 329 | 322 | 329 | 329 |
| Number of observations | 4475 | 2224 | 2582 | 2589 |
| R2 | 0.297 | 0.219 | 0.279 | 0.492 |
Note: The values in brackets are heteroscedasticity-robust standard errors. To save space, the estimated coefficients of control variables are not reported in the table.
Table 5.
Heterogeneities across different kinds of cities.
| Variable | Development-Stage Heterogeneity | Spatial Heterogeneity |
|---|---|---|
| (i) | (ii) | |
| −0.904 | - | |
| [0.705] | - | |
| −0.0347 | - | |
| [0.299] | - | |
| −1.843 *** | - | |
| [0.602] | - | |
| −1.052 * | - | |
| [0.563] | - | |
| - | −0.548 | |
| - | [0.425] | |
| - | −0.632 ** | |
| - | [0.308] | |
| Control variables | Yes | Yes |
| City-fixed effect | Yes | Yes |
| Year-fixed effect | Yes | Yes |
| Number of cities | 329 | 329 |
| Number of observations | 4475 | 4475 |
| R2 | 0.668 | 0.665 |
Note: *, ** and *** represent the statistical significance levels of 10%, 5% and 1%, respectively. The values in brackets are heteroscedasticity-robust standard errors. To save space, the estimated coefficients of control variables are not reported in the table.
Publisher’s Note: MDPI stays neutral with regard to jurisdictional claims in published maps and institutional affiliations. |
© 2022 by the author. Licensee MDPI, Basel, Switzerland. This article is an open access article distributed under the terms and conditions of the Creative Commons Attribution (CC BY) license (https://creativecommons.org/licenses/by/4.0/).
Share and Cite
MDPI and ACS Style
Wang, J. Did China’s “National Sustainable Development Plan of Resource-Based Cities” Promote Economic Growth? Sustainability 2022, 14, 8222. https://doi.org/10.3390/su14138222
AMA Style
Wang J. Did China’s “National Sustainable Development Plan of Resource-Based Cities” Promote Economic Growth? Sustainability. 2022; 14(13):8222. https://doi.org/10.3390/su14138222
Chicago/Turabian StyleWang, Jiaxin. 2022. "Did China’s “National Sustainable Development Plan of Resource-Based Cities” Promote Economic Growth?" Sustainability 14, no. 13: 8222. https://doi.org/10.3390/su14138222
Note that from the first issue of 2016, this journal uses article numbers instead of page numbers. See further details here.