
Urban Air Quality Monitoring in Decarbonization Context; Case Study—Traditional Coal Mining Area, Petroșani, Romania

 and
and
Abstract
:1. Introduction
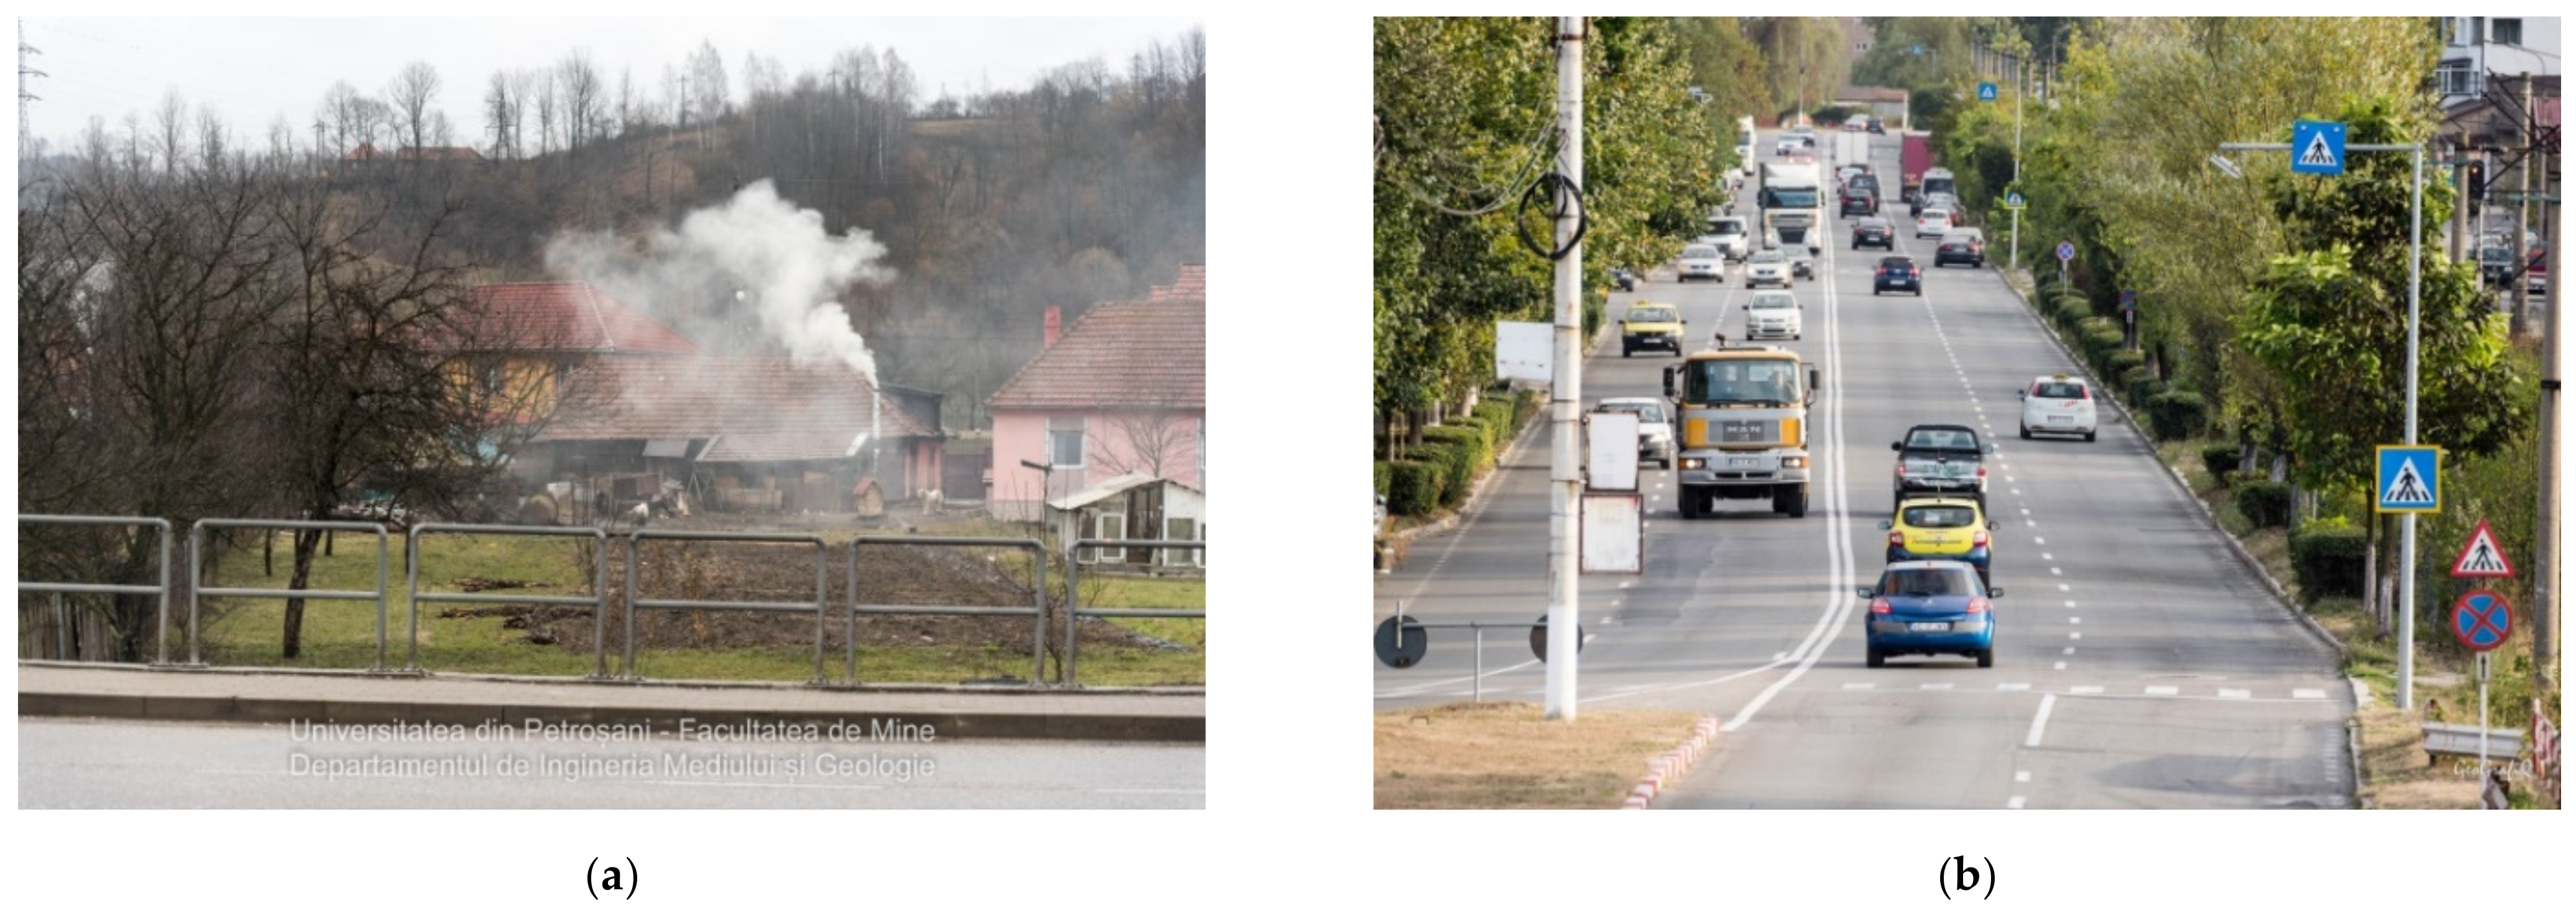
2. General and Local Context
3. Materials and Methods
3.1. Working Methodology
- –
- MP1 at the intersection of E79 with the entrance to the city of Petrila, at the roundabout from Dărănești;
- –
- MP2 at the intersection of E79 with the road to the Parâng Mountain Resort, at the roundabout from Victoriei Square;
- –
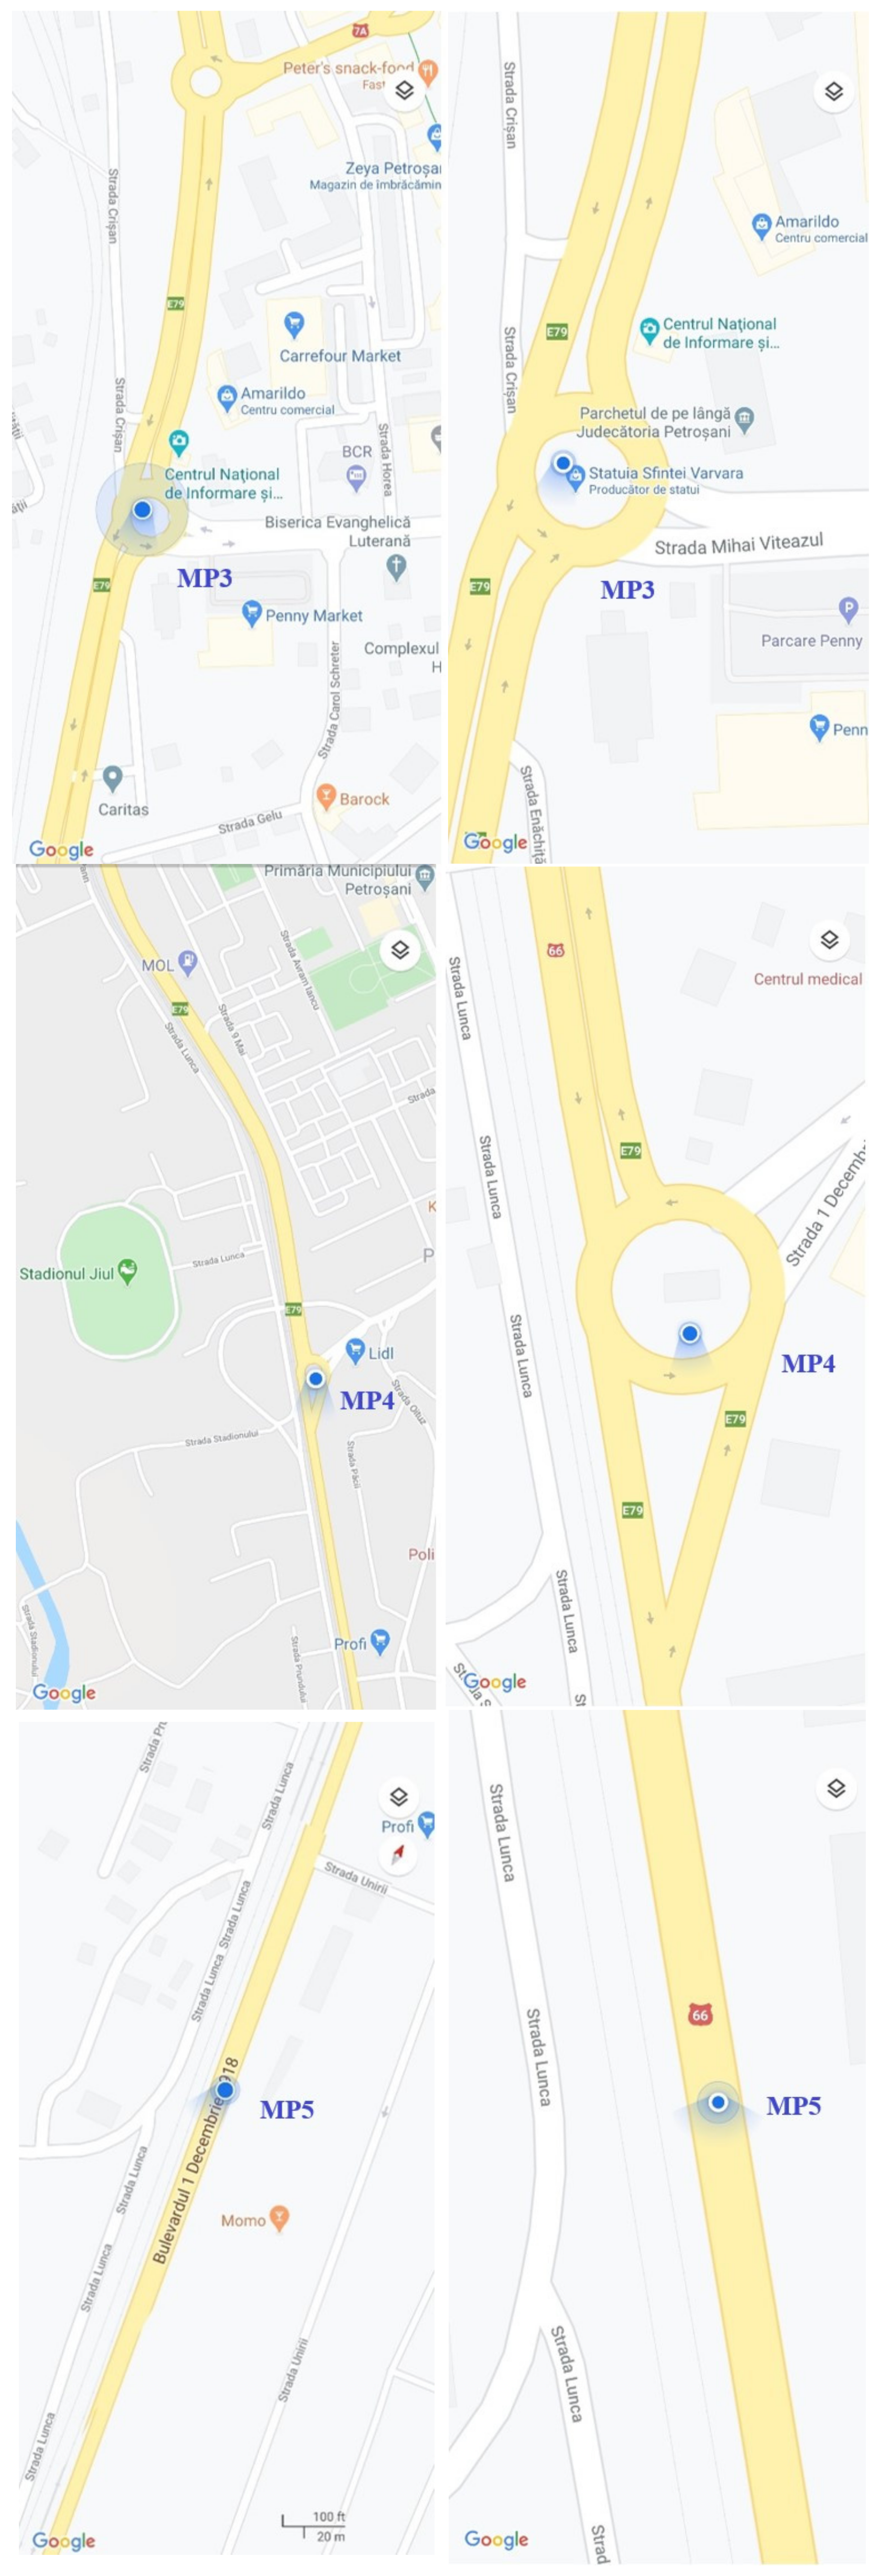
- MP3 at the intersection of E79 with Mihai Viteazul Street, at the roundabout next to the prosecutor’s office attached to Petroșani Court;
- –
- MP4 at the intersection of E79 with December 1, 1918 Street, at the roundabout known as At the plane (La Avion);
- –
- MP5 on the E79 road, near the Livezeni Mining Exploitation;
- –
- MP6 at the intersection of E79 with the entrance to the Kaufland Supermarket, at the roundabout.
3.2. Monitoring Equipment
- –
- Manometer—used for pressure and airflow measurement;
- –
- Thermo-hygrometer—used for testing dew point, wet temperature, enthalpy and absolute temperature;
- –
- Air quality probe—used for measuring the level of CO in a space;
- –
- Current/voltage module;
- –
- Thermometer—thermocouple and thermocouple temperature probes.
4. Results
5. Discussion
6. Conclusions
Author Contributions
Funding
Institutional Review Board Statement
Informed Consent Statement
Data Availability Statement
Conflicts of Interest
References
- Lorinț, R.C.; Buia, G. Romanian mining industry, assumptions of last decade and future insights. Qual.—Access Success 2017, 18 (Suppl. 1), 362–365. [Google Scholar]
- Guo, L.; Zhai, M.; Wang, Z.; Zhang, Y.; Dong, P. Comparison of bituminous coal and lignite during combustion: Combustion performance, coking and slagging characteristics. J. Energy Inst. 2019, 92, 802–812. [Google Scholar] [CrossRef]
- Cambridge Dictionary. Available online: https://dictionary.cambridge.org/ (accessed on 24 March 2022).
- The World Counts Gives an Overview of Critical Global Challenges. Available online: https://www.theworldcounts.com/challenges/planet-earth (accessed on 16 May 2022).
- World Health Organization. WHO Global Air Quality Guidelines: Particulate Matter (PM2.5 and PM10), Ozone, Nitrogen Dioxide, Sulfur Dioxide and Carbon Monoxide; World Health Organization: Geneva, Switzerland, 2021. [Google Scholar]
- Chukwu, T.M.; Morse, S.; Murphy, R.J. Spatial Analysis of Air Quality Assessment in Two Cities in Nigeria: A Comparison of Perceptions with Instrument-Based Methods. Sustainability 2022, 14, 5403. [Google Scholar] [CrossRef]
- Smil, V. Energy Transitions. History, Requirements, Prospects; Praeger ABC-CLIO: Santa Barbara, CA, USA, 2010. [Google Scholar]
- Smil, V. Energy Transitions: Global and National Perspectives (Second Expanded and Updated Edition); Praeger ABC-CLIO: Westport, CT, USA, 2016. [Google Scholar]
- Smil, V. How the World Really Works; Viking: London, UK, 2022. [Google Scholar]
- Reichl, C.; Schatz, M. World Mining Data, Volume 37, Minerals Production, Federal Ministry of Agriculture, Regions and Tourism, Vienna, 2022. Available online: https://www.world-mining-data.info/ (accessed on 16 May 2022).
- Eurostat—The Statistical Office of the European Union. Available online: https://ec.europa.eu/eurostat/web/products-eurostat-news/-/ddn-20220216-1 (accessed on 16 May 2022).
- Buia, G.; Lorinţ, C. Hard Coal Deposits in Romania/Depozite de huilă din România. Rev. Min. Min. Rev. 2010, 16, 9–14. [Google Scholar]
- Buia, G.; Lorinţ, C.; Rădulescu, M. Considerations About Economic Outlook of Jiu Valley Hard Coal Deposit. Rom. J. Miner. Depos. 2014, 87, 41–46. [Google Scholar]
- Buia, G.; Lorinţ, C.; Nimară, C.; Lupuleac, R. Role of Jiu Valley Hard Coal Deposits Between Eastern and Western European Energetic Constraints. Ann. Univ. Petroșani Min. Eng. 2014, 15, 21–28. [Google Scholar]
- Wang, L.; Chen, X.; Xia, Y.; Jiang, L.; Ye, J.; Hou, T.; Wang, L.; Zhang, Y.; Li, M.; Li, Z.; et al. Operational Data-Driven Intelligent Modelling and Visualization System for Real-World, On-Road Vehicle Emissions—A Case Study in Hangzhou City, China. Sustainability 2022, 14, 5434. [Google Scholar] [CrossRef]
- Liang, X.; Zhang, S.; Wu, Y.; Xing, J.; He, X.; Zhang, K.M.; Wang, S.; Hao, J. Air quality and health benefits from fleet electrification in China. Nat. Sustain. 2019, 2, 962–971. [Google Scholar] [CrossRef]
- Wang, L.; Chen, X.; Zhang, Y.; Li, M.; Li, P.; Jiang, L.; Xia, Y.; Li, Z.; Li, J.; Wang, L.; et al. Switching to electric vehicles can lead to significant reductions of PM2.5 and NO2 across China. One Earth 2021, 4, 1037–1048. [Google Scholar] [CrossRef]
- Zhang, Q.; Zheng, Y.; Tong, D.; Shao, M.; Wang, S.; Zhang, Y.; Xu, X.; Wang, J.; He, H.; Liu, W.; et al. Drivers of Improved PM2.5 Air Quality in China from 2013 to 2017. Proc. Natl. Acad. Sci. USA 2019, 116, 24463–24469. [Google Scholar] [CrossRef] [PubMed] [Green Version]
- Xue, Y.; Cao, X.; Ai, Y.; Xu, K.; Zhang, Y. Primary Air Pollutants Emissions Variation Characteristics and Future Control Strategies for Transportation Sector in Beijing, China. Sustainability 2020, 12, 4111. [Google Scholar] [CrossRef]
- Nicola, A.H.; Radu, S.M. Analysis of Polluting Emissions of Vehicles/Analiza Emisiilor Poluante ale Autovehiculelor; Universitas: Petroșani, Romania, 2019. (In Romanian) [Google Scholar]
- Lorinţ, C. Protected Natural Areas and Biodiversity Conservation/Arii Naturale Protejate şi Conservarea Biodiversităţii; Universitas: Petroșani, Romania, 2012. (In Romanian) [Google Scholar]
- European Environmental Agency. Available online: https://www.eea.europa.eu/ (accessed on 24 March 2022).
- Environmental Systems Research Institute. ArcGIS Desktop, Release 10; ESRI: Redlands, CA, USA, 2011. [Google Scholar]
- Mihăiescu, R. Integrated Environmental Monitoring/Monitoringul Integrat al Mediului; Bioflux: Cluj-Napoca, Romania, 2014. (In Romanian) [Google Scholar]
- Călămar, A.N.; Găman, G.A.; Pupăzan, D.; Toth, L.; Kovacs, I. Analysis of environmental components by monitoring gas concentrations in the environment. Environ. Eng. Manag. J. 2017, 16, 1249–1256. [Google Scholar] [CrossRef]
- Law, No. 104/2011 on Ambient Air Quality. Available online: https://legislatie.just.ro/Public/DetaliiDocument/129642 (accessed on 24 March 2022). (In Romanian)
- STAS 12574-87; Air from Protected Areas. Quality Conditions/Aer din Zonele Protejate. Condiții de Calitate. Asociația de Standardizare din Romania: Bucharest, Romania, 1987. (In Romanian)
- GrayWolf Sensing Solutions. Available online: https://graywolfsensing.com/ (accessed on 24 March 2022).
- Kimo Instruments AMI 300 Multifunction Data Logger. Available online: https://www.inlec.com/kimo-ami-300-multifunction-data-logger (accessed on 24 March 2022).
- Călămar, A.N.; Simion, A.; Toth, L.; Simion, S.; Nicolescu, C. Improving the method of calculating the ecological footprint generated by road traffic—Case study. Environ. Eng. Manag. J. 2019, 18, 781–788. [Google Scholar] [CrossRef]
- National Air Quality Monitoring Network. Available online: https://www.calitateaer.ro/ (accessed on 10 April 2022).
- Society Energetic Complex Hunedoara S.A./Societatea Complexul Energetic Hunedoara S.A. Available online: www.cenhd.ro (accessed on 16 May 2022). (In Romanian).
- Florea, A.; Lorint, C.; Danciu, C. Particulate matters generated by Caprișoara tailing pond and their impact on air quality. Environ. Eng. Manag. J. 2019, 18, 803–810. [Google Scholar] [CrossRef]
- National Energetic System. Available online: https://www.transelectrica.ro/web/tel/sistemul-energetic-national (accessed on 1 May 2022).
- National Energy Regulatory Authority. Report on the Results of Monitoring the Electricity Market in December 2020/Raport Privind Rezultatele Monitorizării Pieţei de Energie Electrică în Luna Decembrie 2020. Available online: https://www.anre.ro/download.php?f=fqeCg6I%3D&t=vdeyut7dlcecrLbbvbY%3D (accessed on 18 May 2022). (In Romanian).


| Parameter | Date | 7 March 2020 | 13 March 2020 | 18 May 2020 | 24 May 2020 * (Night) | 2 July 2020 | M.A.C. | |
|---|---|---|---|---|---|---|---|---|
| Monitoring Point | ||||||||
| CO [mg/m3] | MP1 | 1.00 | 4.50 | 2.40 | - | 5.30 | 6.0 mg/m3 | |
| MP2 | 1.20 | 3.00 | 3.40 | - | 2.30 | |||
| MP3 | 1.40 | 1.20 | 2.30 | 0.40 | 2.00 | |||
| MP4 | 1.80 | 1.20 | 0.00 | 0.90 | 0.00 | |||
| MP5 | 1.30 | 0.50 | 4.10 | - | 3.80 | |||
| MP6 | 1.10 | 1.80 | 2.60 | - | 1.30 | |||
| CO2 [mg/m3] | MP1 | 565.00 | 1081.00 | 682.66 | - | 948.00 | ** | |
| MP2 | 505.00 | 824.00 | 748.55 | - | 1046.00 | |||
| MP3 | 458.00 | 828.00 | 774.17 | 549.06 | 1015.0 | |||
| MP4 | 492.00 | 1002.00 | 724.76 | 580.17 | 1061.0 | |||
| MP5 | 475.00 | 964.00 | 770.51 | - | 966.00 | |||
| MP6 | 1624.0 | 766.00 | 768.68 | - | 1025.0 | |||
| NO [mg/m3] | MP1 | 0.30 | 0.30 | 0.00 | - | 0.09 | ** | |
| MP2 | 0.30 | 0.30 | 0.00 | - | 0.08 | |||
| MP3 | 0.30 | 0.30 | 0.00 | 0.00 | 0.10 | |||
| MP4 | 0.31 | 0.30 | 0.00 | 0.00 | 0.02 | |||
| MP5 | 0.30 | 0.30 | 0.00 | - | 0.04 | |||
| MP6 | 0.30 | 0.30 | 0.00 | - | 0.04 | |||
| NO2 [mg/m3] | MP1 | 0.12 | 0.12 | 0.07 | - | 0.20 | 0.3 mg/m3 | |
| MP2 | 0.11 | 0.11 | 0.13 | - | 0.20 | |||
| MP3 | 0.10 | 0.11 | 0.11 | 0.12 | 6.00 | |||
| MP4 | 0.15 | 0.10 | 0.12 | 0.14 | 4.20 | |||
| MP5 | 0.11 | 0.10 | 0.17 | - | 11.40 | |||
| MP6 | 0.13 | 0.11 | 0.13 | - | 4.90 | |||
| SO2 [mg/m3] | MP1 | 0.12 | 0.11 | 0.18 | - | 0.02 | 0.75 mg/m3 | |
| MP2 | 0.08 | 0.00 | 0.53 | - | 0.00 | |||
| MP3 | 0.04 | 0.00 | 0.40 | 0.20 | 0.00 | |||
| MP4 | 0.06 | 0.00 | 0.30 | 0.06 | 0.00 | |||
| MP5 | 0.03 | 0.00 | 0.26 | - | 0.00 | |||
| MP6 | 0.04 | 0.00 | 0.23 | - | 0.00 | |||
| PM1 [mg/m3] | MP1 | 0.02 | 0.04 | 0.01 | - | 0.01 | ** | |
| MP2 | 0.06 | 0.01 | 0.01 | - | 0.01 | |||
| MP3 | 0.02 | 0.02 | 0.01 | 0.00 | 0.01 | |||
| MP4 | 0.01 | 0.01 | 0.03 | 0.01 | 0.01 | |||
| MP5 | 0.02 | 0.01 | 0.01 | - | 0.01 | |||
| MP6 | 0.02 | 0.02 | 0.00 | - | 0.01 | |||
| PM2.5 [mg/m3] | MP1 | 0.03 | 0.17 | 0.03 | - | 0.03 | ** | |
| MP2 | 0.06 | 0.10 | 0.03 | - | 0.10 | |||
| MP3 | 0.02 | 0.12 | 0.07 | 0.01 | 0.08 | |||
| MP4 | 0.03 | 0.06 | 0.03 | 0.01 | 0.03 | |||
| MP5 | 0.03 | 0.06 | 0.02 | - | 0.03 | |||
| MP6 | 0.04 | 0.10 | 0.02 | - | 0.04 | |||
| PM10 [mg/m3] | MP1 | 0.04 | 1.54 | 0.26 | - | 0.29 | ** | |
| MP2 | 0.06 | 1.11 | 0.19 | - | 0.54 | |||
| MP3 | 0.03 | 0.51 | 0.43 | 0.03 | 0.64 | |||
| MP4 | 0.20 | 0.26 | 0.17 | 0.02 | 0.09 | |||
| MP5 | 0.04 | 0.40 | 0.09 | - | 0.17 | |||
| MP6 | 0.08 | 0.83 | 0.10 | - | 0.09 | |||
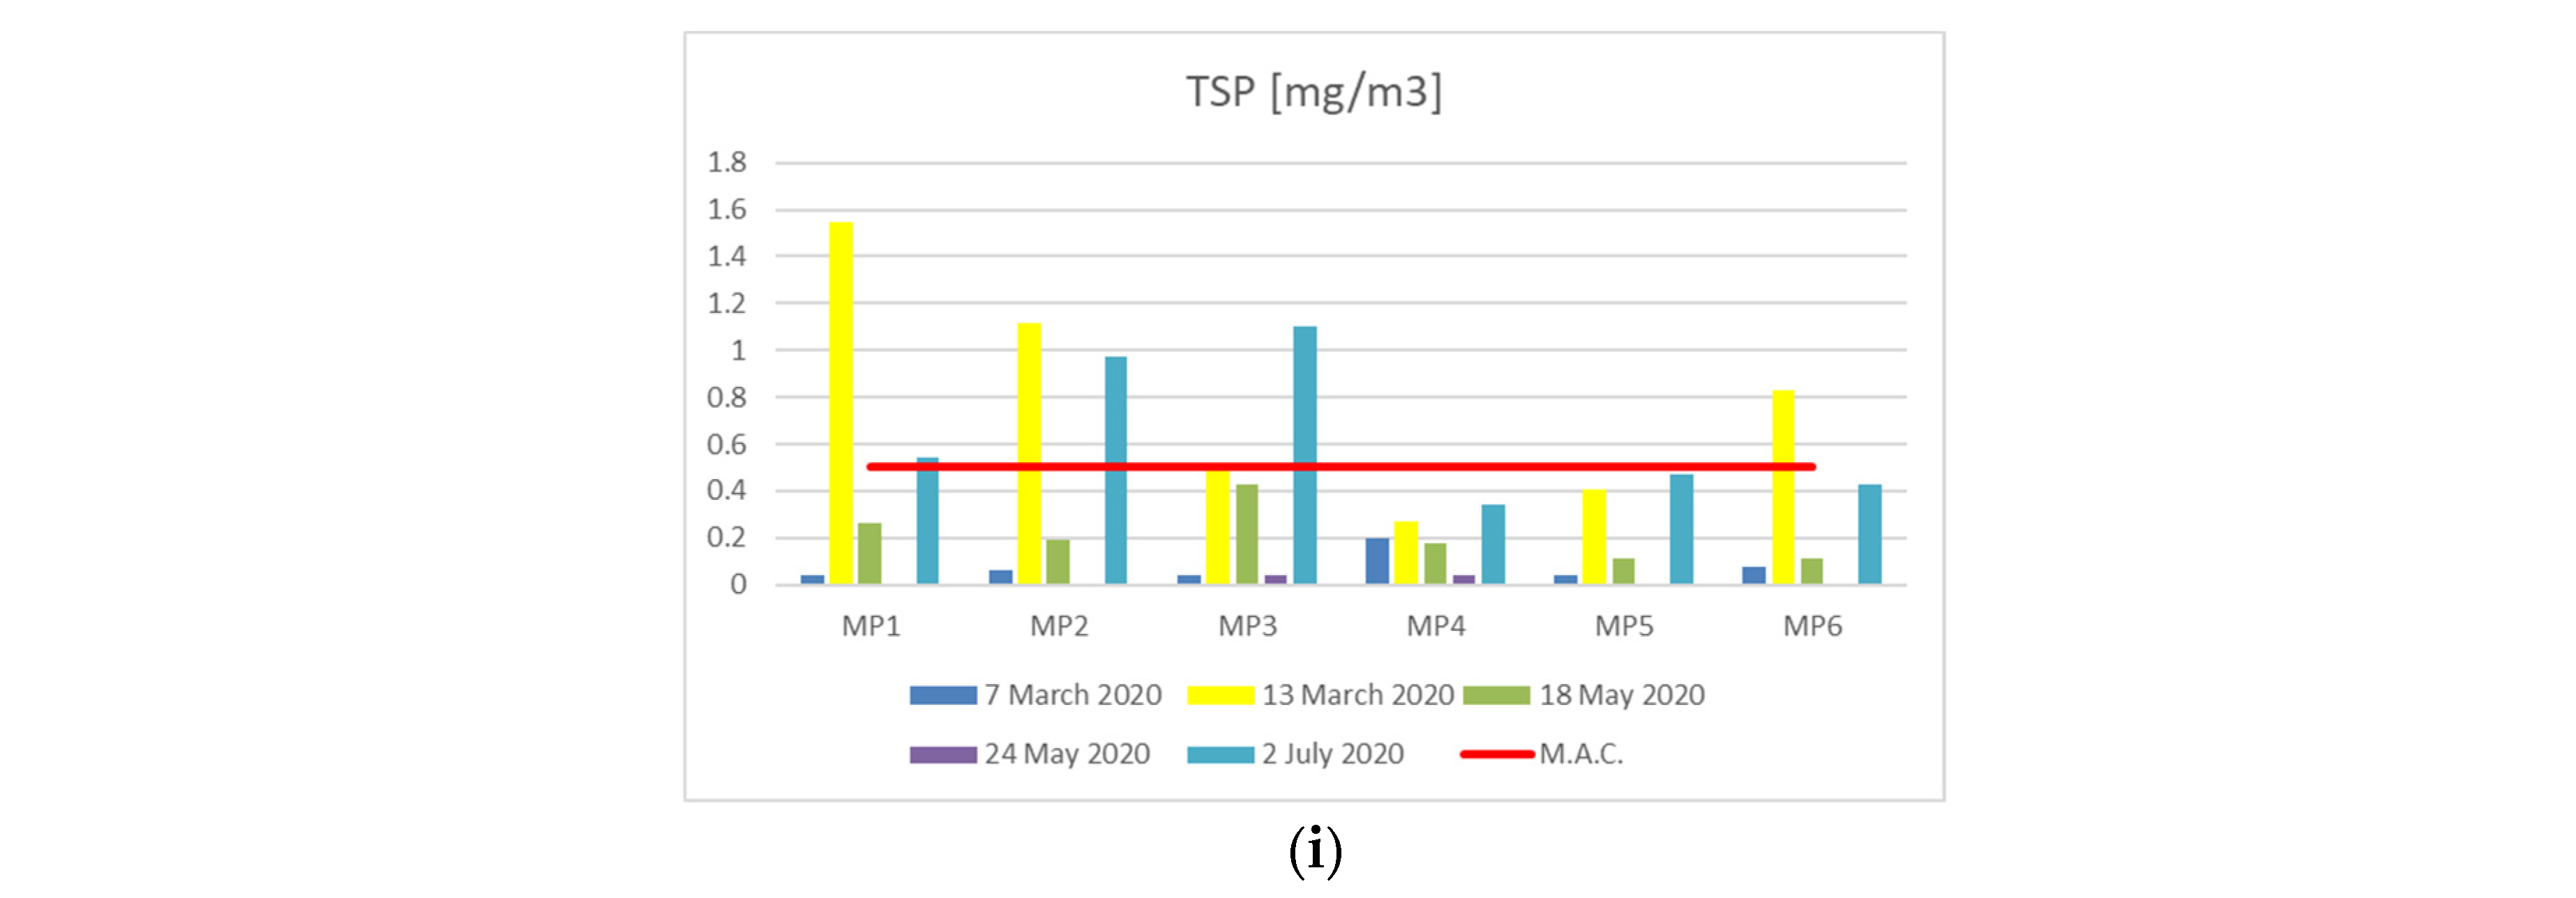
| TSP [mg/m3] | MP1 | 0.04 | 1.55 | 0.26 | - | 0.54 | 0.5 mg/m3 | |
| MP2 | 0.06 | 1.12 | 0.19 | - | 0.97 | |||
| MP3 | 0.04 | 0.52 | 0.43 | 0.04 | 1.10 | |||
| MP4 | 0.20 | 0.27 | 0.18 | 0.04 | 0.34 | |||
| MP5 | 0.04 | 0.41 | 0.11 | - | 0.47 | |||
| MP6 | 0.08 | 0.83 | 0.11 | - | 0.43 | |||
| Parameter | Date | 7 March 2020 | 13 March 2020 | 18 May 2020 | 24 May 2020 * (Night) | 2 July 2020 | |
|---|---|---|---|---|---|---|---|
| Monitoring Point | |||||||
| V [m/s] | MP1 | 0.311 | 0.363 | 0.576 | - | 1.012 | |
| MP2 | 0.161 | 0.398 | 0.728 | - | 1.455 | ||
| MP3 | 0.496 | 1.354 | 0.415 | 0.272 | 1.386 | ||
| MP4 | 0.331 | 1.508 | 0.840 | 0.237 | 0.828 | ||
| MP5 | 0.156 | 1.380 | 1.180 | - | 0.909 | ||
| MP6 | 0.194 | 0.408 | 0.455 | - | 2.962 | ||
| P [hPa] | MP1 | 936.9 | 937.9 | 944.4 | - | 940.3 | |
| MP2 | 936.8 | 937.2 | 944.6 | - | 941.2 | ||
| MP3 | 935.7 | 937.1 | 945.6 | 947.0 | 941.2 | ||
| MP4 | 937.2 | 939.0 | 949.0 | 950.0 | 943.4 | ||
| MP5 | 939.0 | 940.1 | 949.0 | - | 944.5 | ||
| MP6 | 940.4 | 941.2 | 952.1 | - | 945.6 | ||
| W [%RH] | MP1 | 59.95 | 38.53 | 43.14 | - | 42.89 | |
| MP2 | 68.28 | 40.02 | 31.13 | - | 41.99 | ||
| MP3 | 76.43 | 36.55 | 25.72 | 64.01 | 37.43 | ||
| MP4 | 82.19 | 34.00 | 31.36 | 70.69 | 42.57 | ||
| MP5 | 77.66 | 34.76 | 25.31 | - | 36.58 | ||
| MP6 | 75.63 | 38.45 | 27.42 | - | 38.40 | ||
| T [°C] | MP1 | 8.8 | 19.0 | 8.0 | - | 28.0 | |
| MP2 | 8.4 | 20.2 | 11.0 | - | 29.0 | ||
| MP3 | 9.3 | 22.1 | 12.0 | 11.0 | 29.6 | ||
| MP4 | 6.8 | 23.2 | 13.0 | 11.0 | 29.6 | ||
| MP5 | 9.0 | 22.6 | 14.0 | - | 30.3 | ||
| MP6 | 8.0 | 20.9 | 14.0 | - | 31.1 | ||
| Date | 7 March 2020 | 13 March 2020 * | 18 May 2020 | 24 May 2020 (Night) | 2 July 2020 * | M.A.C. | |
|---|---|---|---|---|---|---|---|
| Parameter | |||||||
| CO [mg/m3] | 0.82–1.07 | 0.94–1.25 | 1.47–1.59 | 1.43–1.47 | 0.15–0.44 | 6.0 mg/m3 | |
| CO2 [mg/m3] | - | - | - | - | - | ** | |
| NO [mg/m3] | 0.01–0.02 | 0.01–0.03 | 0.01–0.03 | 0.01–0.02 | 0.01–0.02 | ** | |
| NO2 [mg/m3] | 0.01–0.02 | 0.01–0.02 | 0.01–0.02 | 0.02 | 0.01–0.02 | 0.3 mg/m3 | |
| SO2 [mg/m3] | 0.01 | 0.01–0.04 | 0.01 | 0.01 | 0.00 | 0.75 mg/m3 | |
| PM1 [mg/m3] | - | - | - | - | - | ** | |
| PM2.5 [mg/m3] | - | - | - | - | - | ** | |
| PM10 [mg/m3] | 0.02 | 0.01–0.04 | 0.01–0.03 | 0–0.01 | 0.02 | ** | |
| TSP [mg/m3] | - | - | - | - | - | 0.5 mg/m3 | |
| Date | 7 March 2020 | 13 March 2020 | 18 May 2020 | 24 May 2020 (Night) | 2 July 2020 | |
|---|---|---|---|---|---|---|
| Parameter | ||||||
| V [m/s] | 0–3.8 | 0.2–5.7 | 0.4–3.6 | 0.1–3.1 | 0.3–3.0 | |
| P [hPa] | 933.4–935.1 | 936.1–941.1 | 948.6–949.6 | 944.2–946.3 | 939.9–941.7 | |
| W [%RH] | 62–99 | 52–99 | 79–99 | 93–99 | 58–99 | |
| T [°C] | 5.1–12.3 | 3.6–20.7 | 14.1–22.2 | 10.7–14.4 | 17.1–28.6 | |
Publisher’s Note: MDPI stays neutral with regard to jurisdictional claims in published maps and institutional affiliations. |
© 2022 by the authors. Licensee MDPI, Basel, Switzerland. This article is an open access article distributed under the terms and conditions of the Creative Commons Attribution (CC BY) license (https://creativecommons.org/licenses/by/4.0/).
Share and Cite
Rezmerița, E.; Radu, S.M.; Călămar, A.-N.; Lorinț, C.; Florea, A.; Nicola, A. Urban Air Quality Monitoring in Decarbonization Context; Case Study—Traditional Coal Mining Area, Petroșani, Romania. Sustainability 2022, 14, 8165. https://doi.org/10.3390/su14138165
Rezmerița E, Radu SM, Călămar A-N, Lorinț C, Florea A, Nicola A. Urban Air Quality Monitoring in Decarbonization Context; Case Study—Traditional Coal Mining Area, Petroșani, Romania. Sustainability. 2022; 14(13):8165. https://doi.org/10.3390/su14138165
Chicago/Turabian StyleRezmerița, Evelina, Sorin Mihai Radu, Angelica-Nicoleta Călămar, Csaba Lorinț, Adrian Florea, and Aurelian Nicola. 2022. "Urban Air Quality Monitoring in Decarbonization Context; Case Study—Traditional Coal Mining Area, Petroșani, Romania" Sustainability 14, no. 13: 8165. https://doi.org/10.3390/su14138165