
Environmental Concerns for Sustainable Mariculture in Coastal Waters of South-Central Vietnam


 ,
,
Abstract
:1. Introduction
2. Materials and Methods
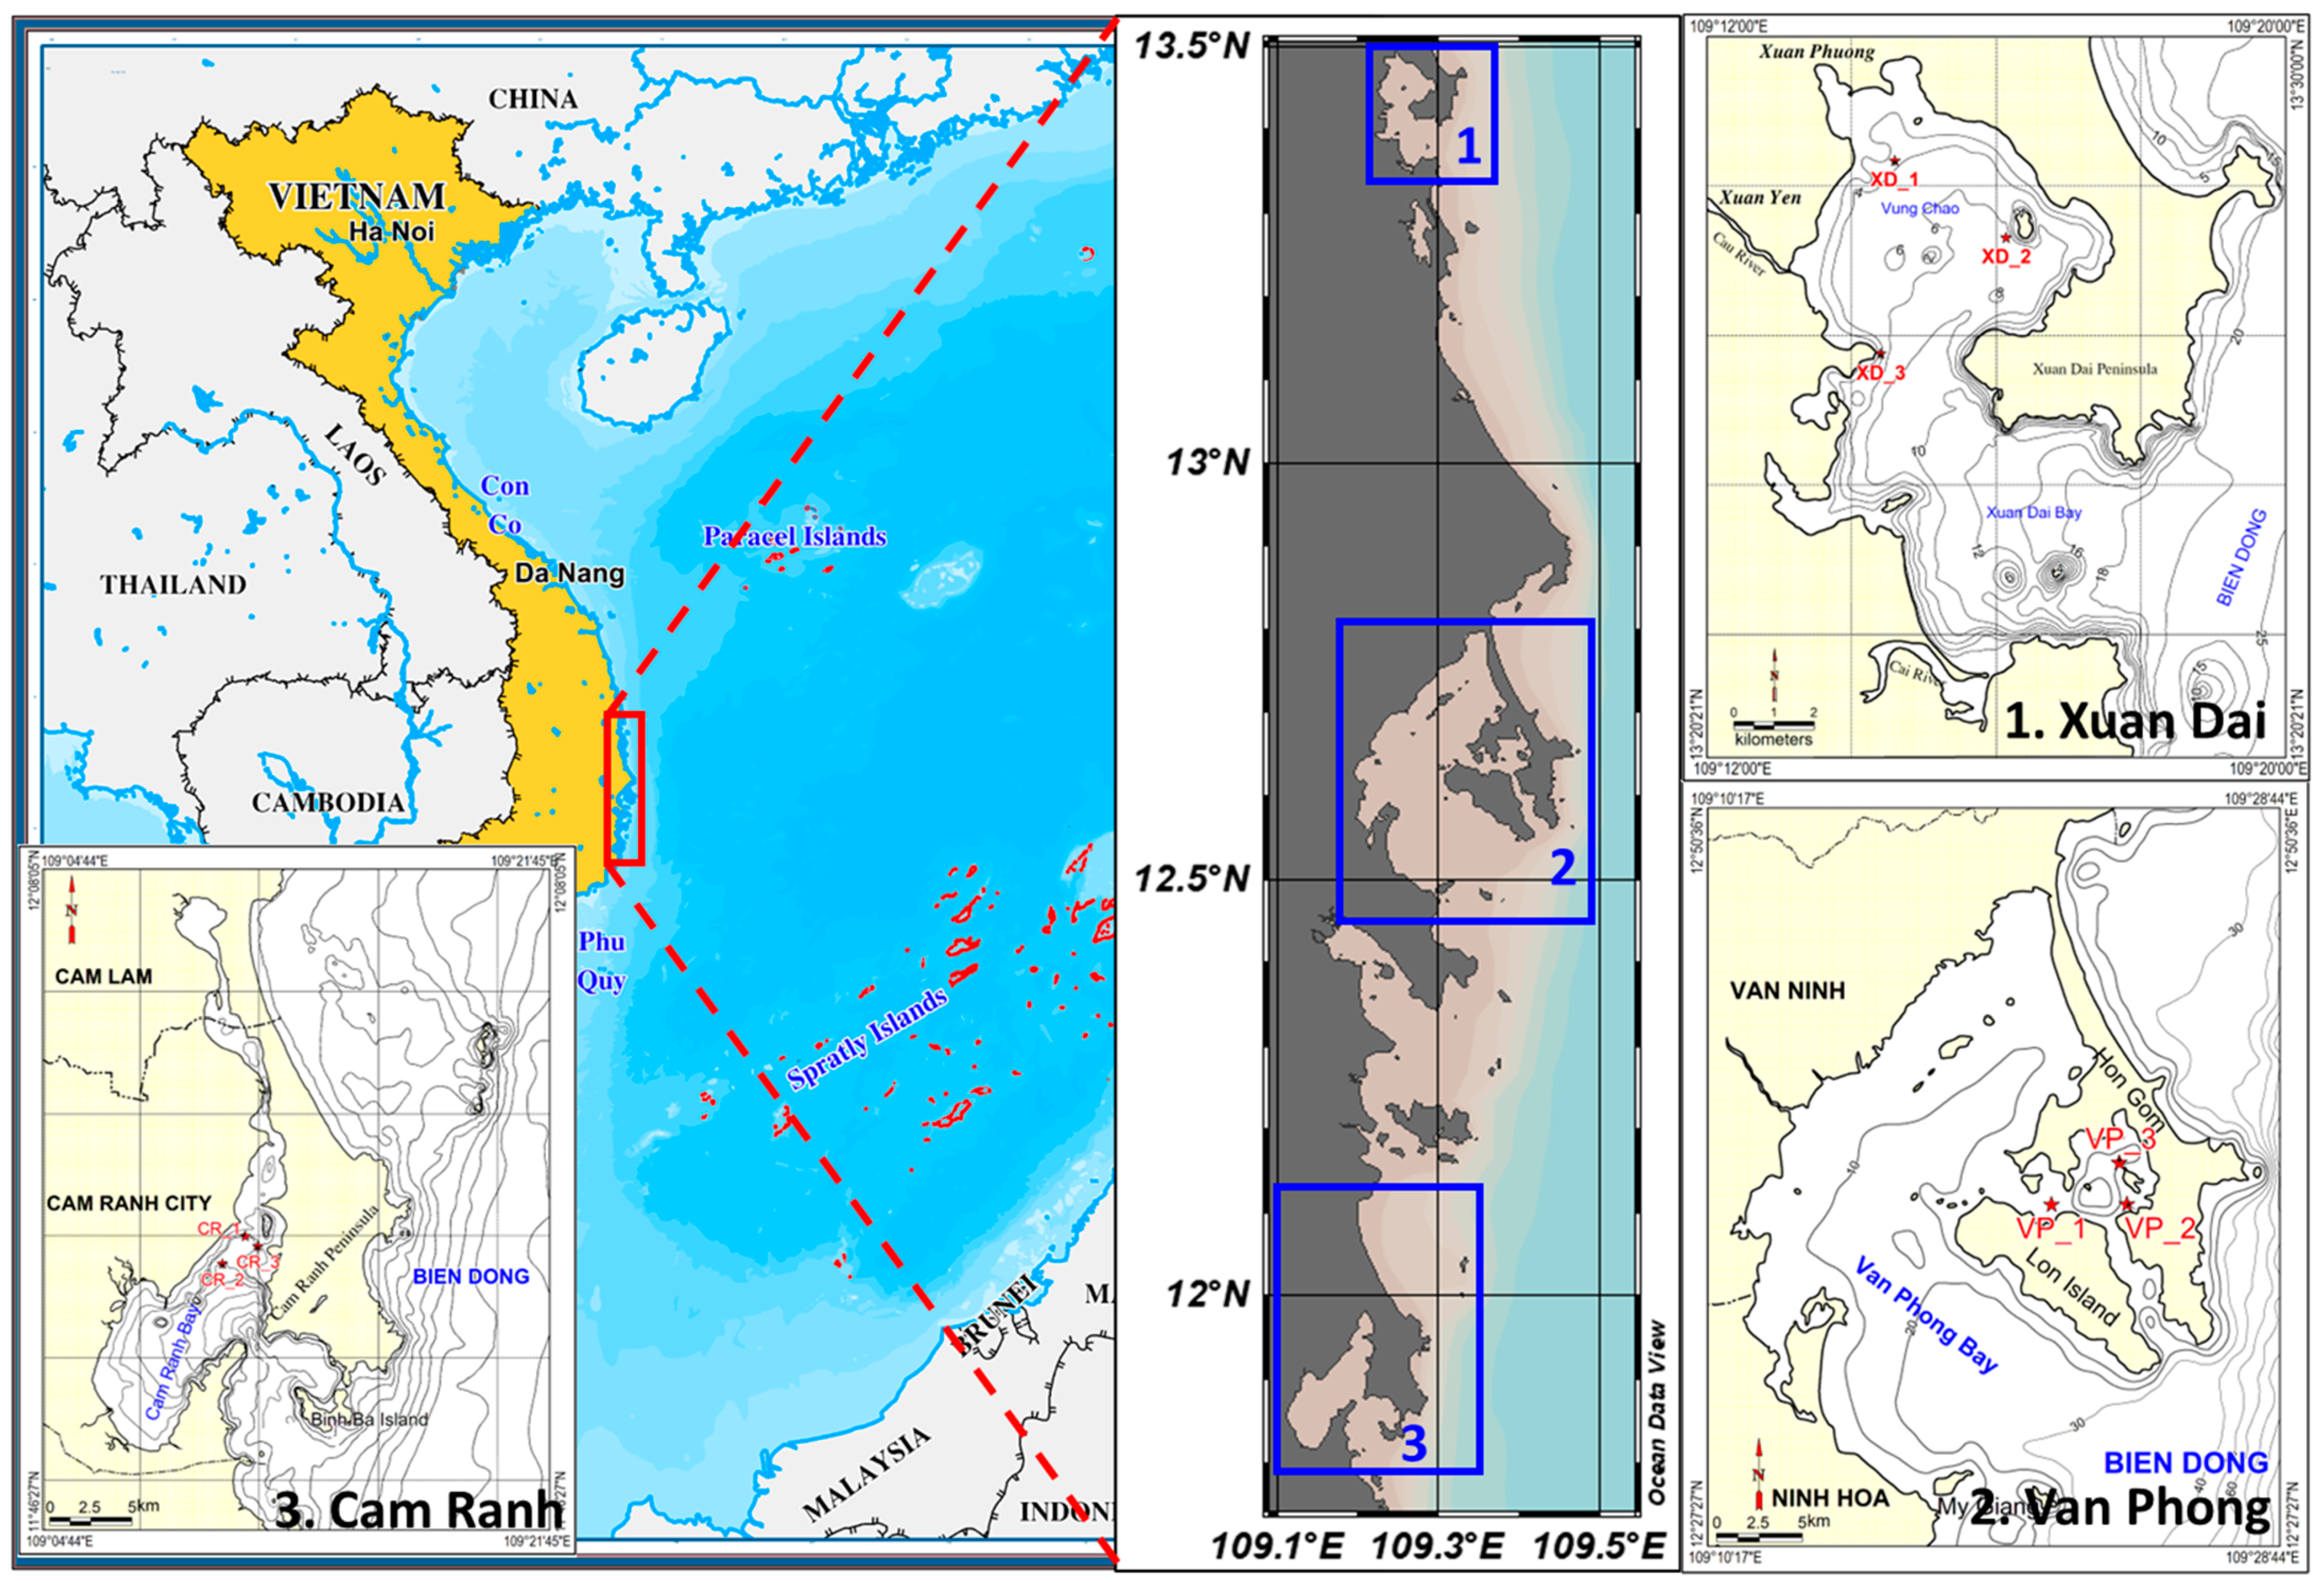
2.1. Study Areas
2.2. Sampling Collection
2.3. Sample Analyses
2.4. Data Analyses
3. Results
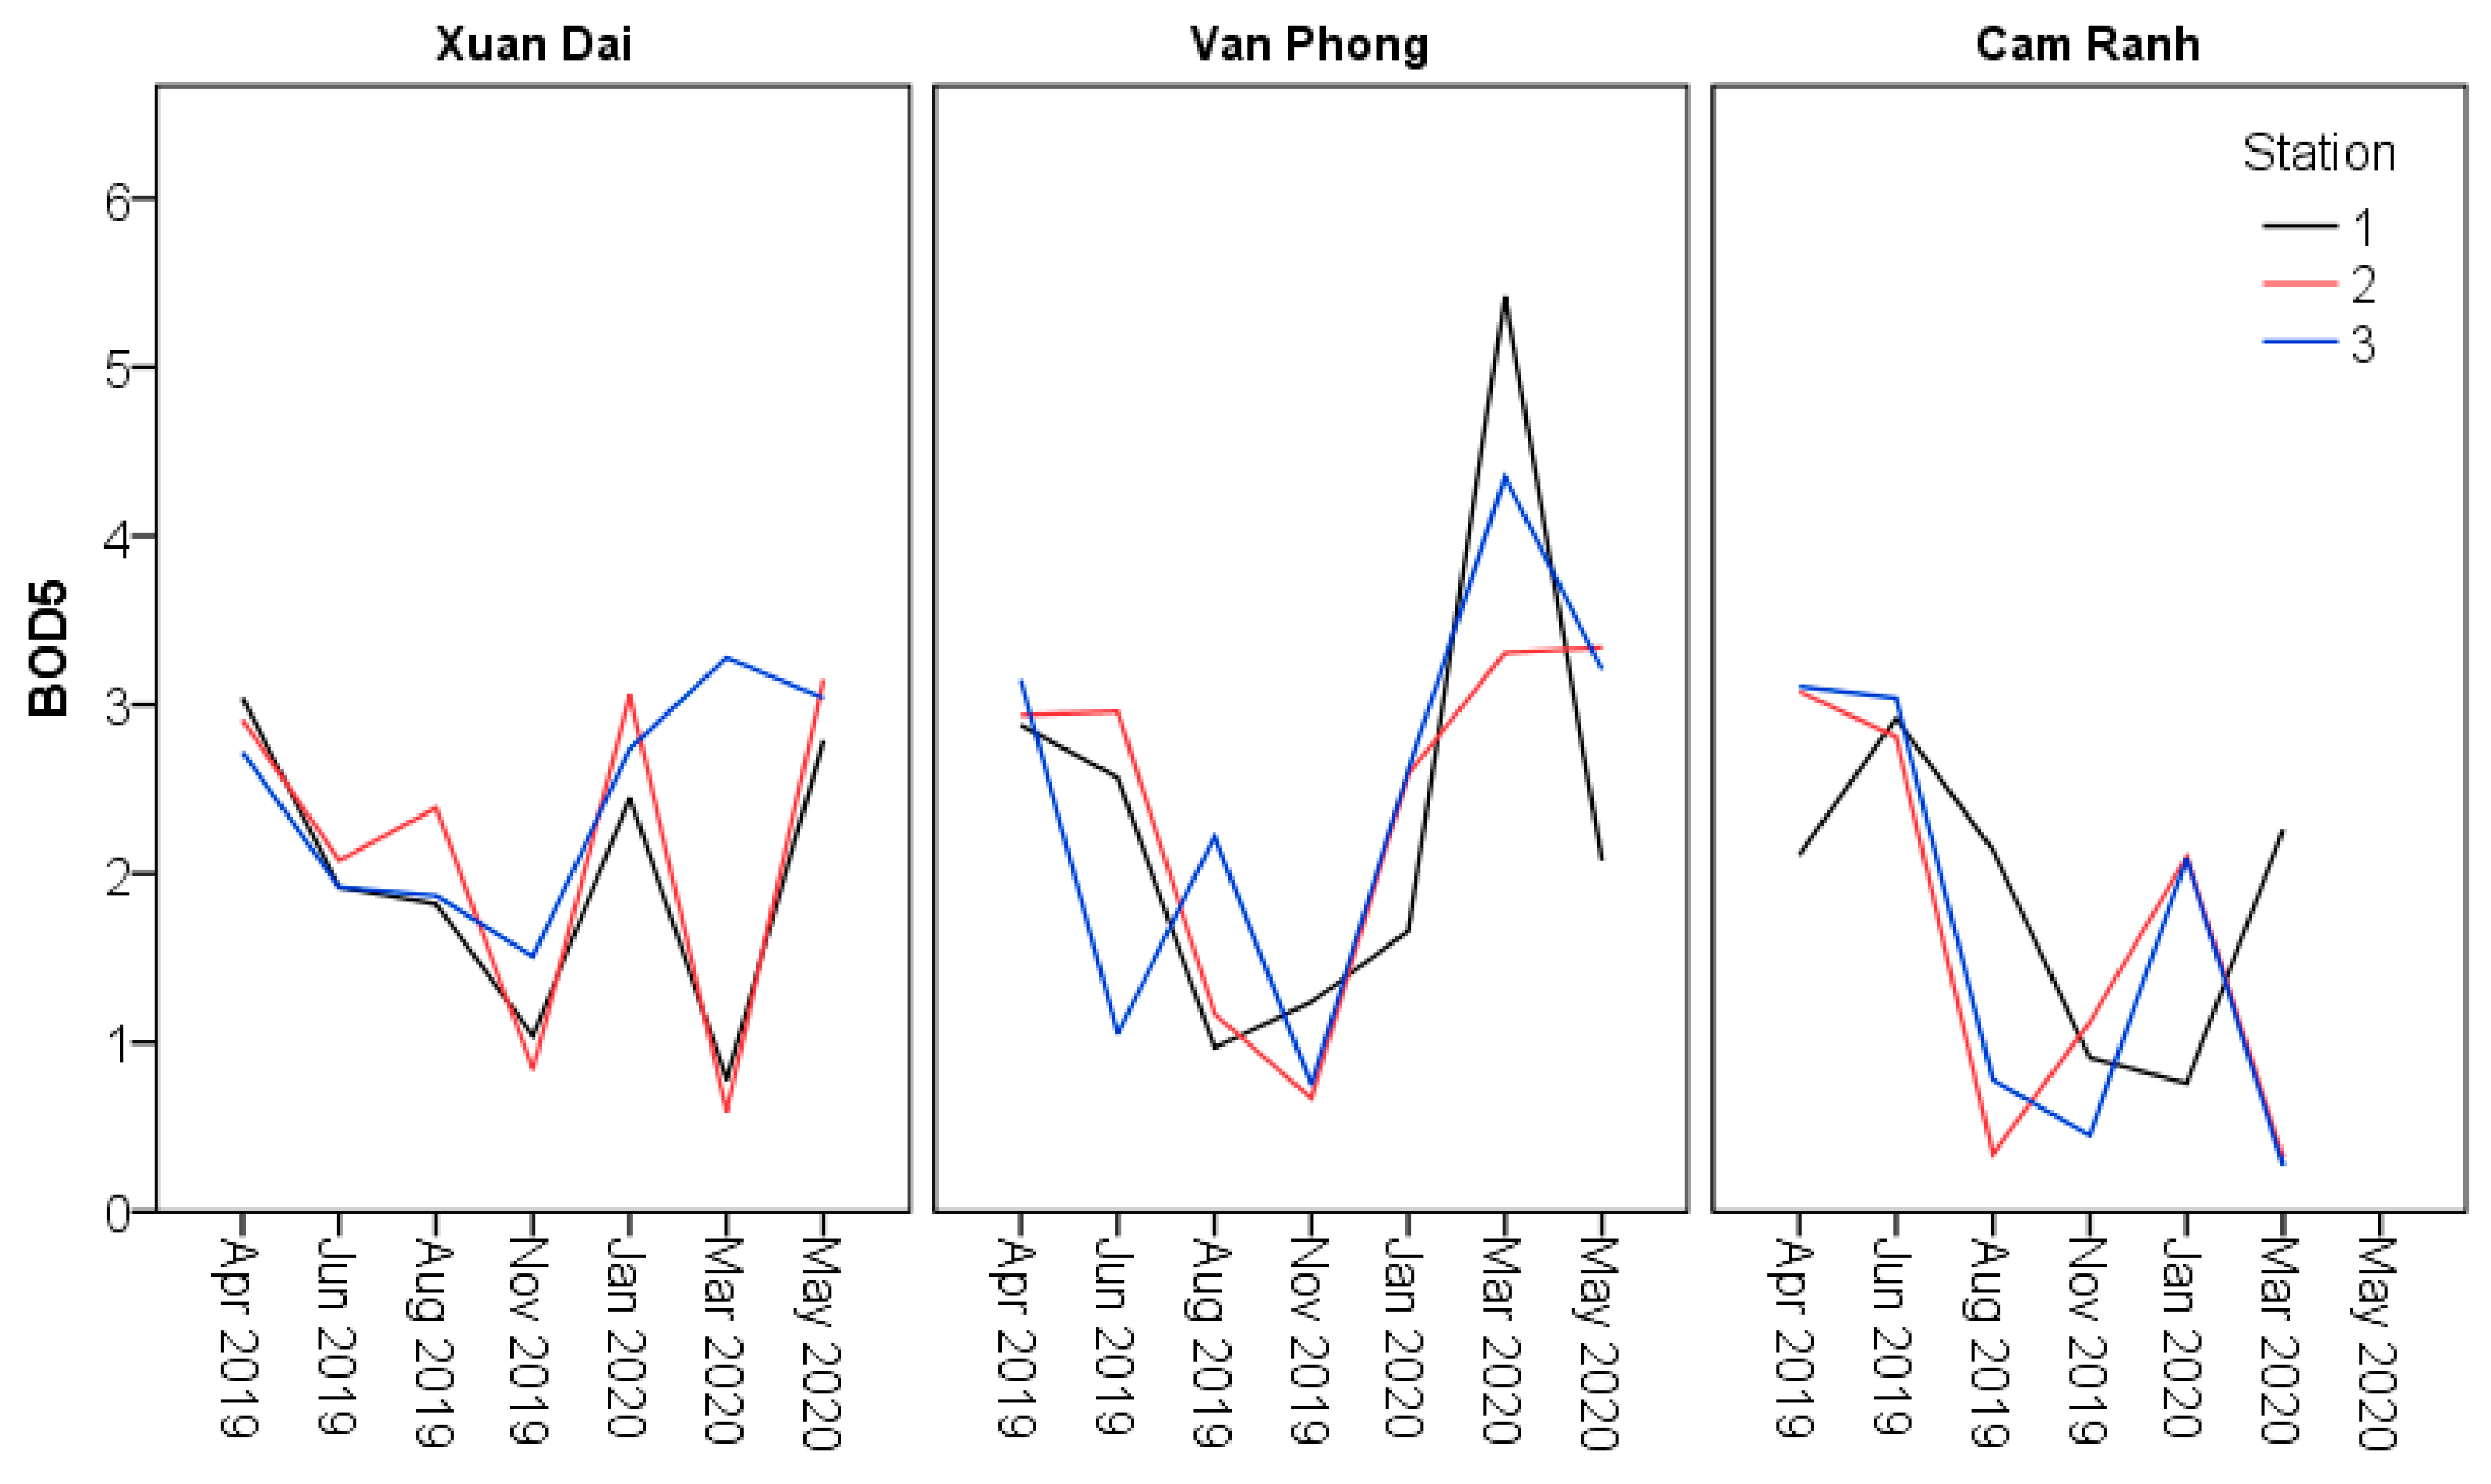
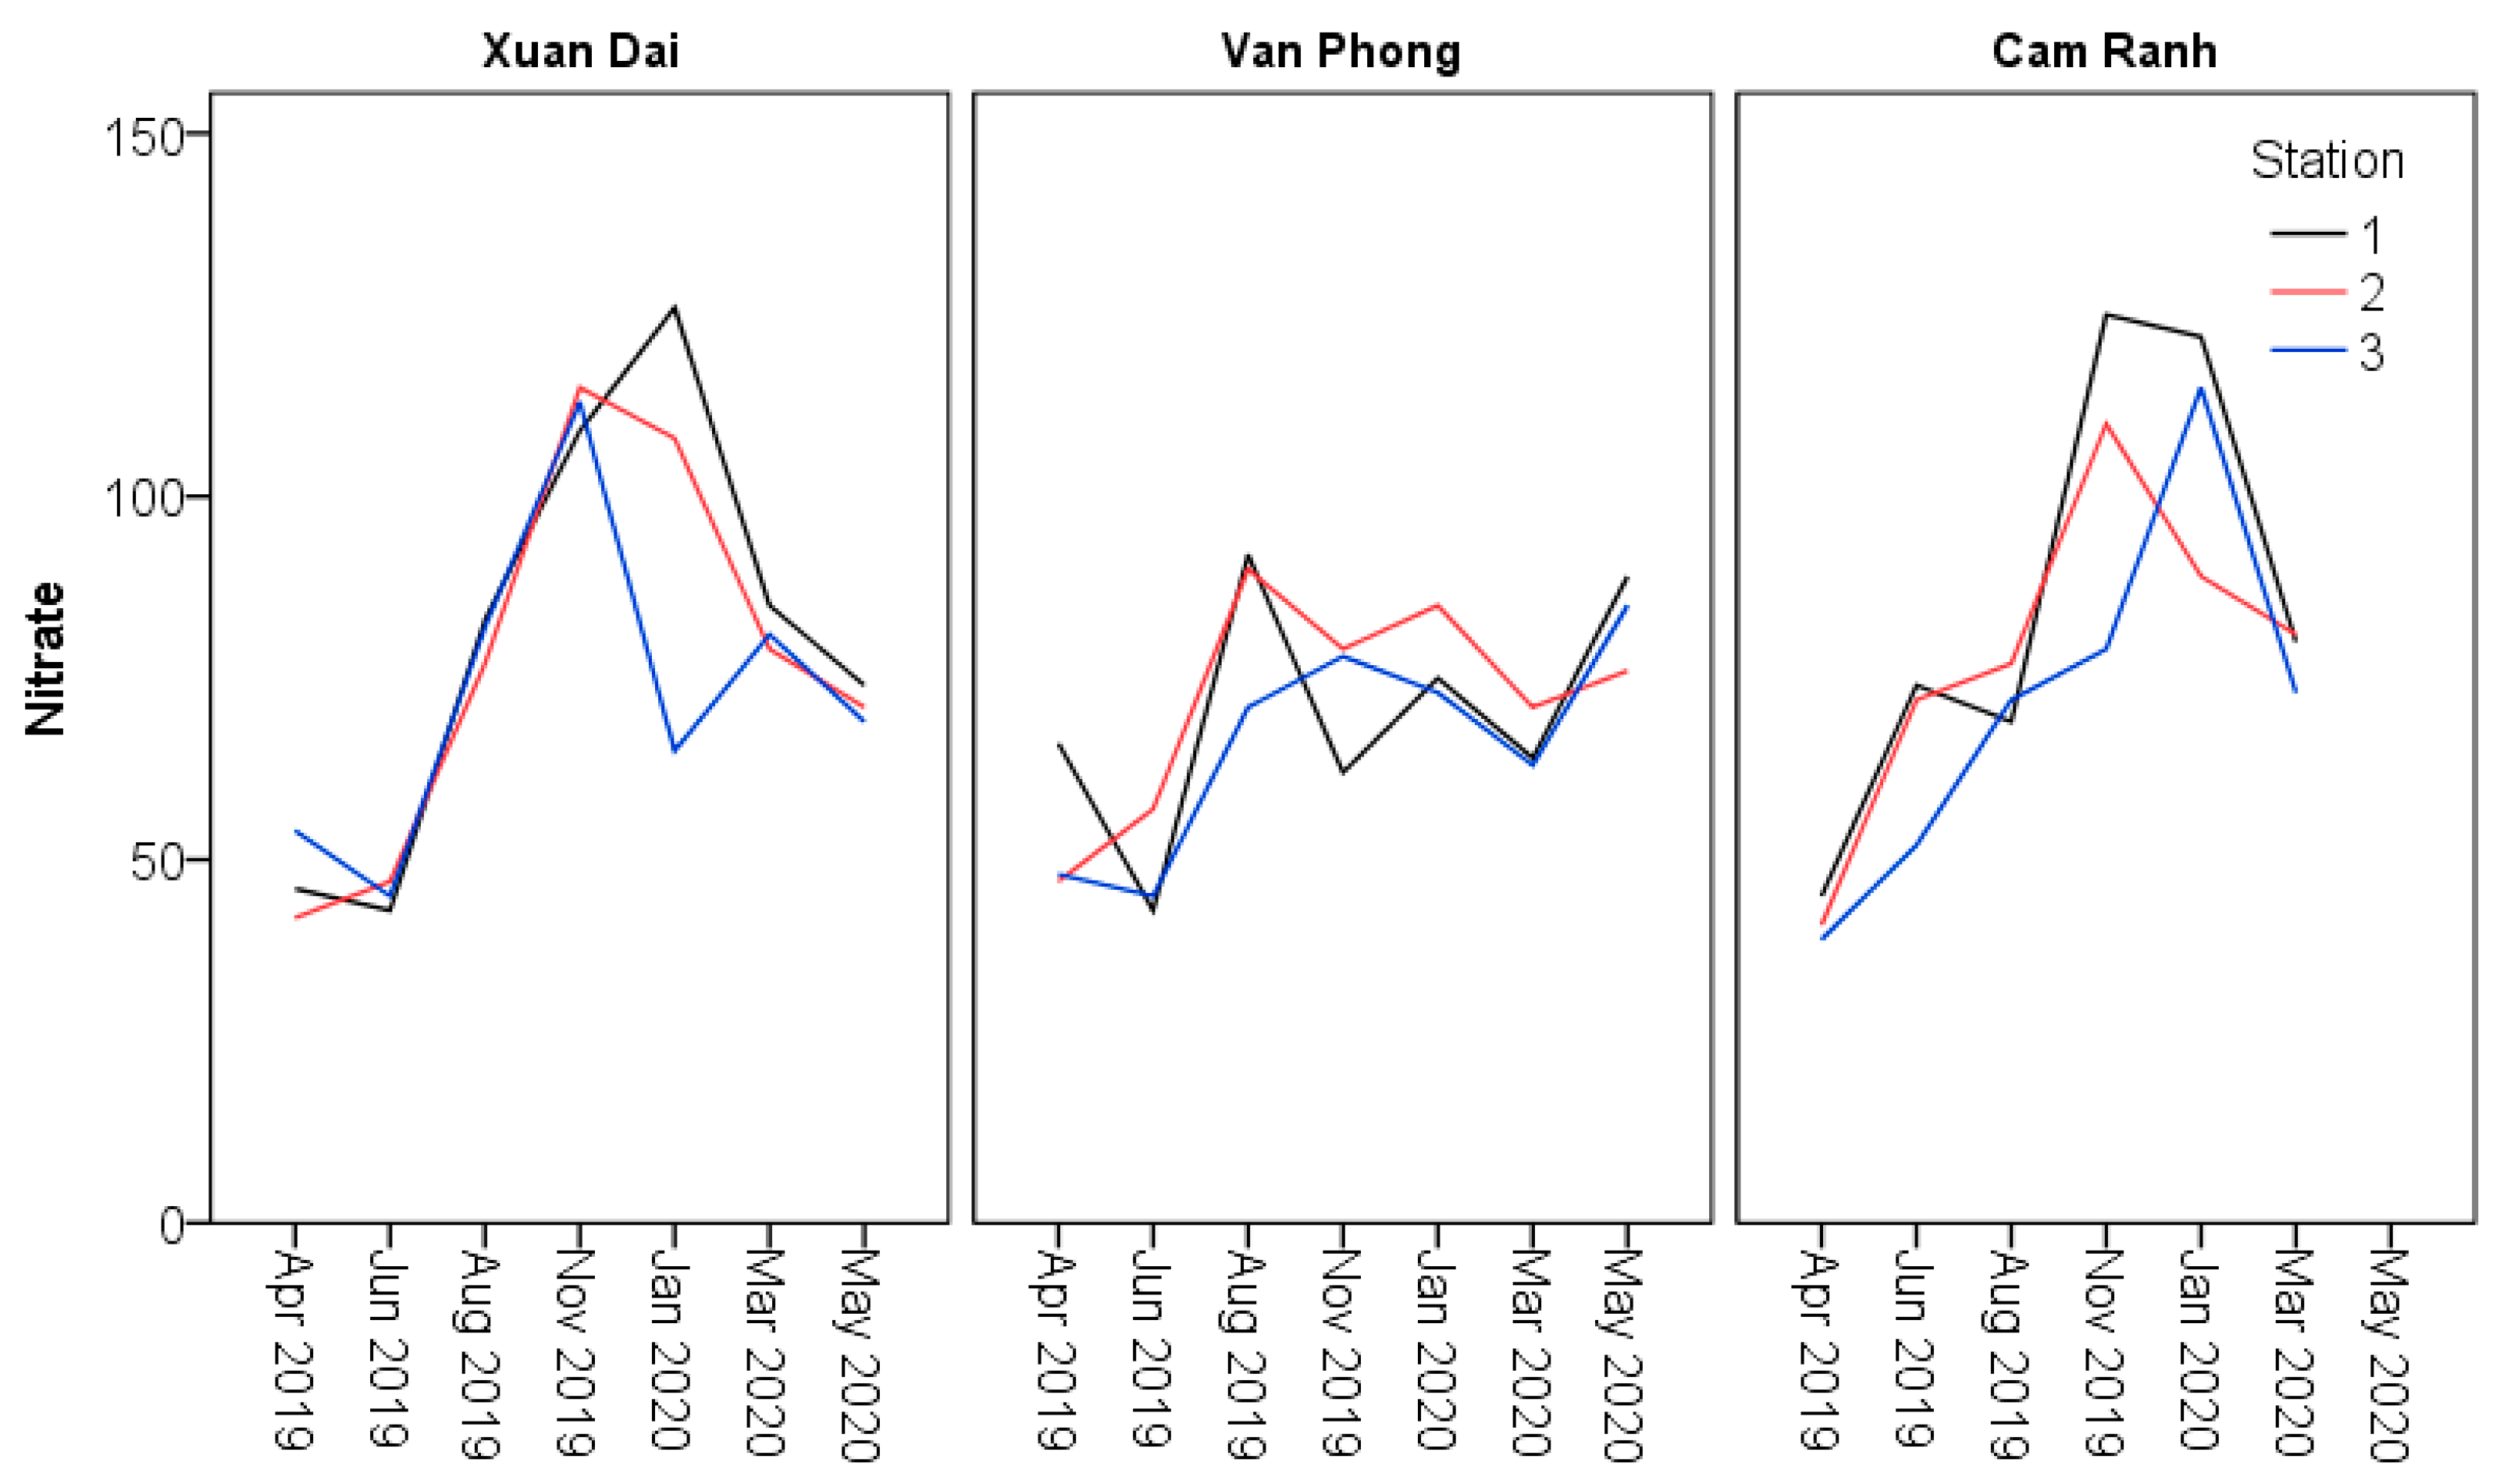
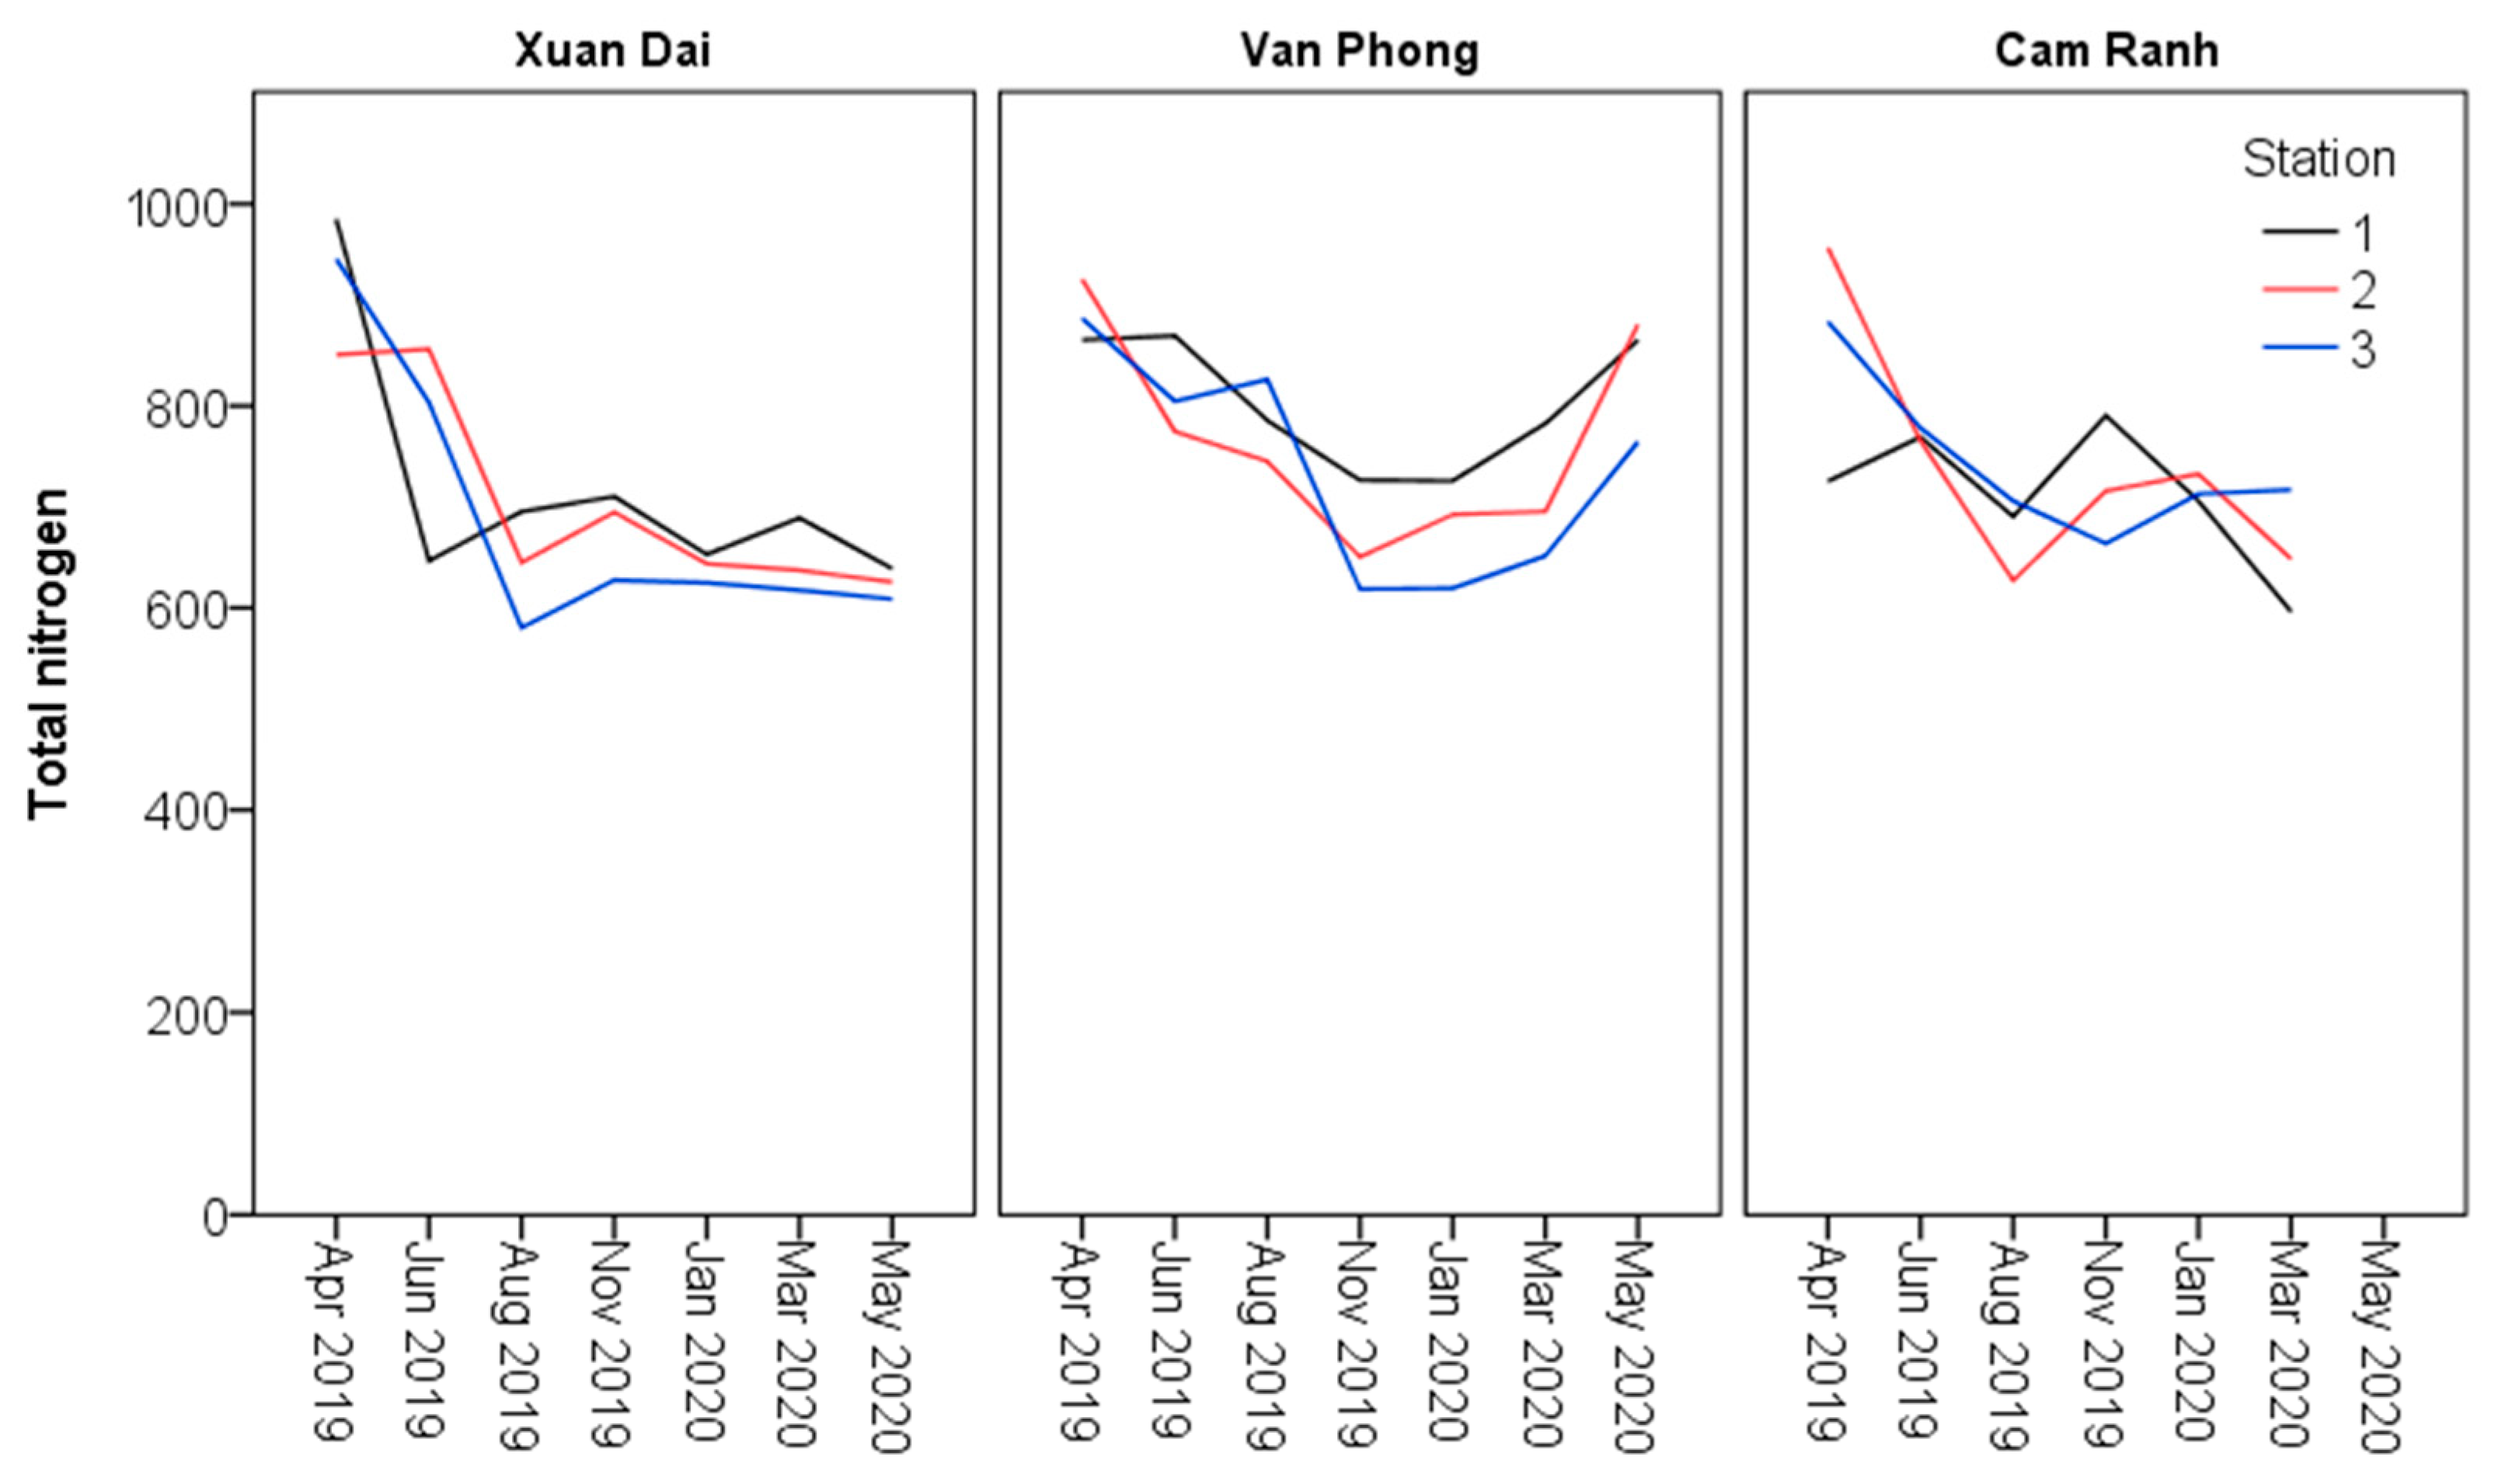
3.1. Water Environment
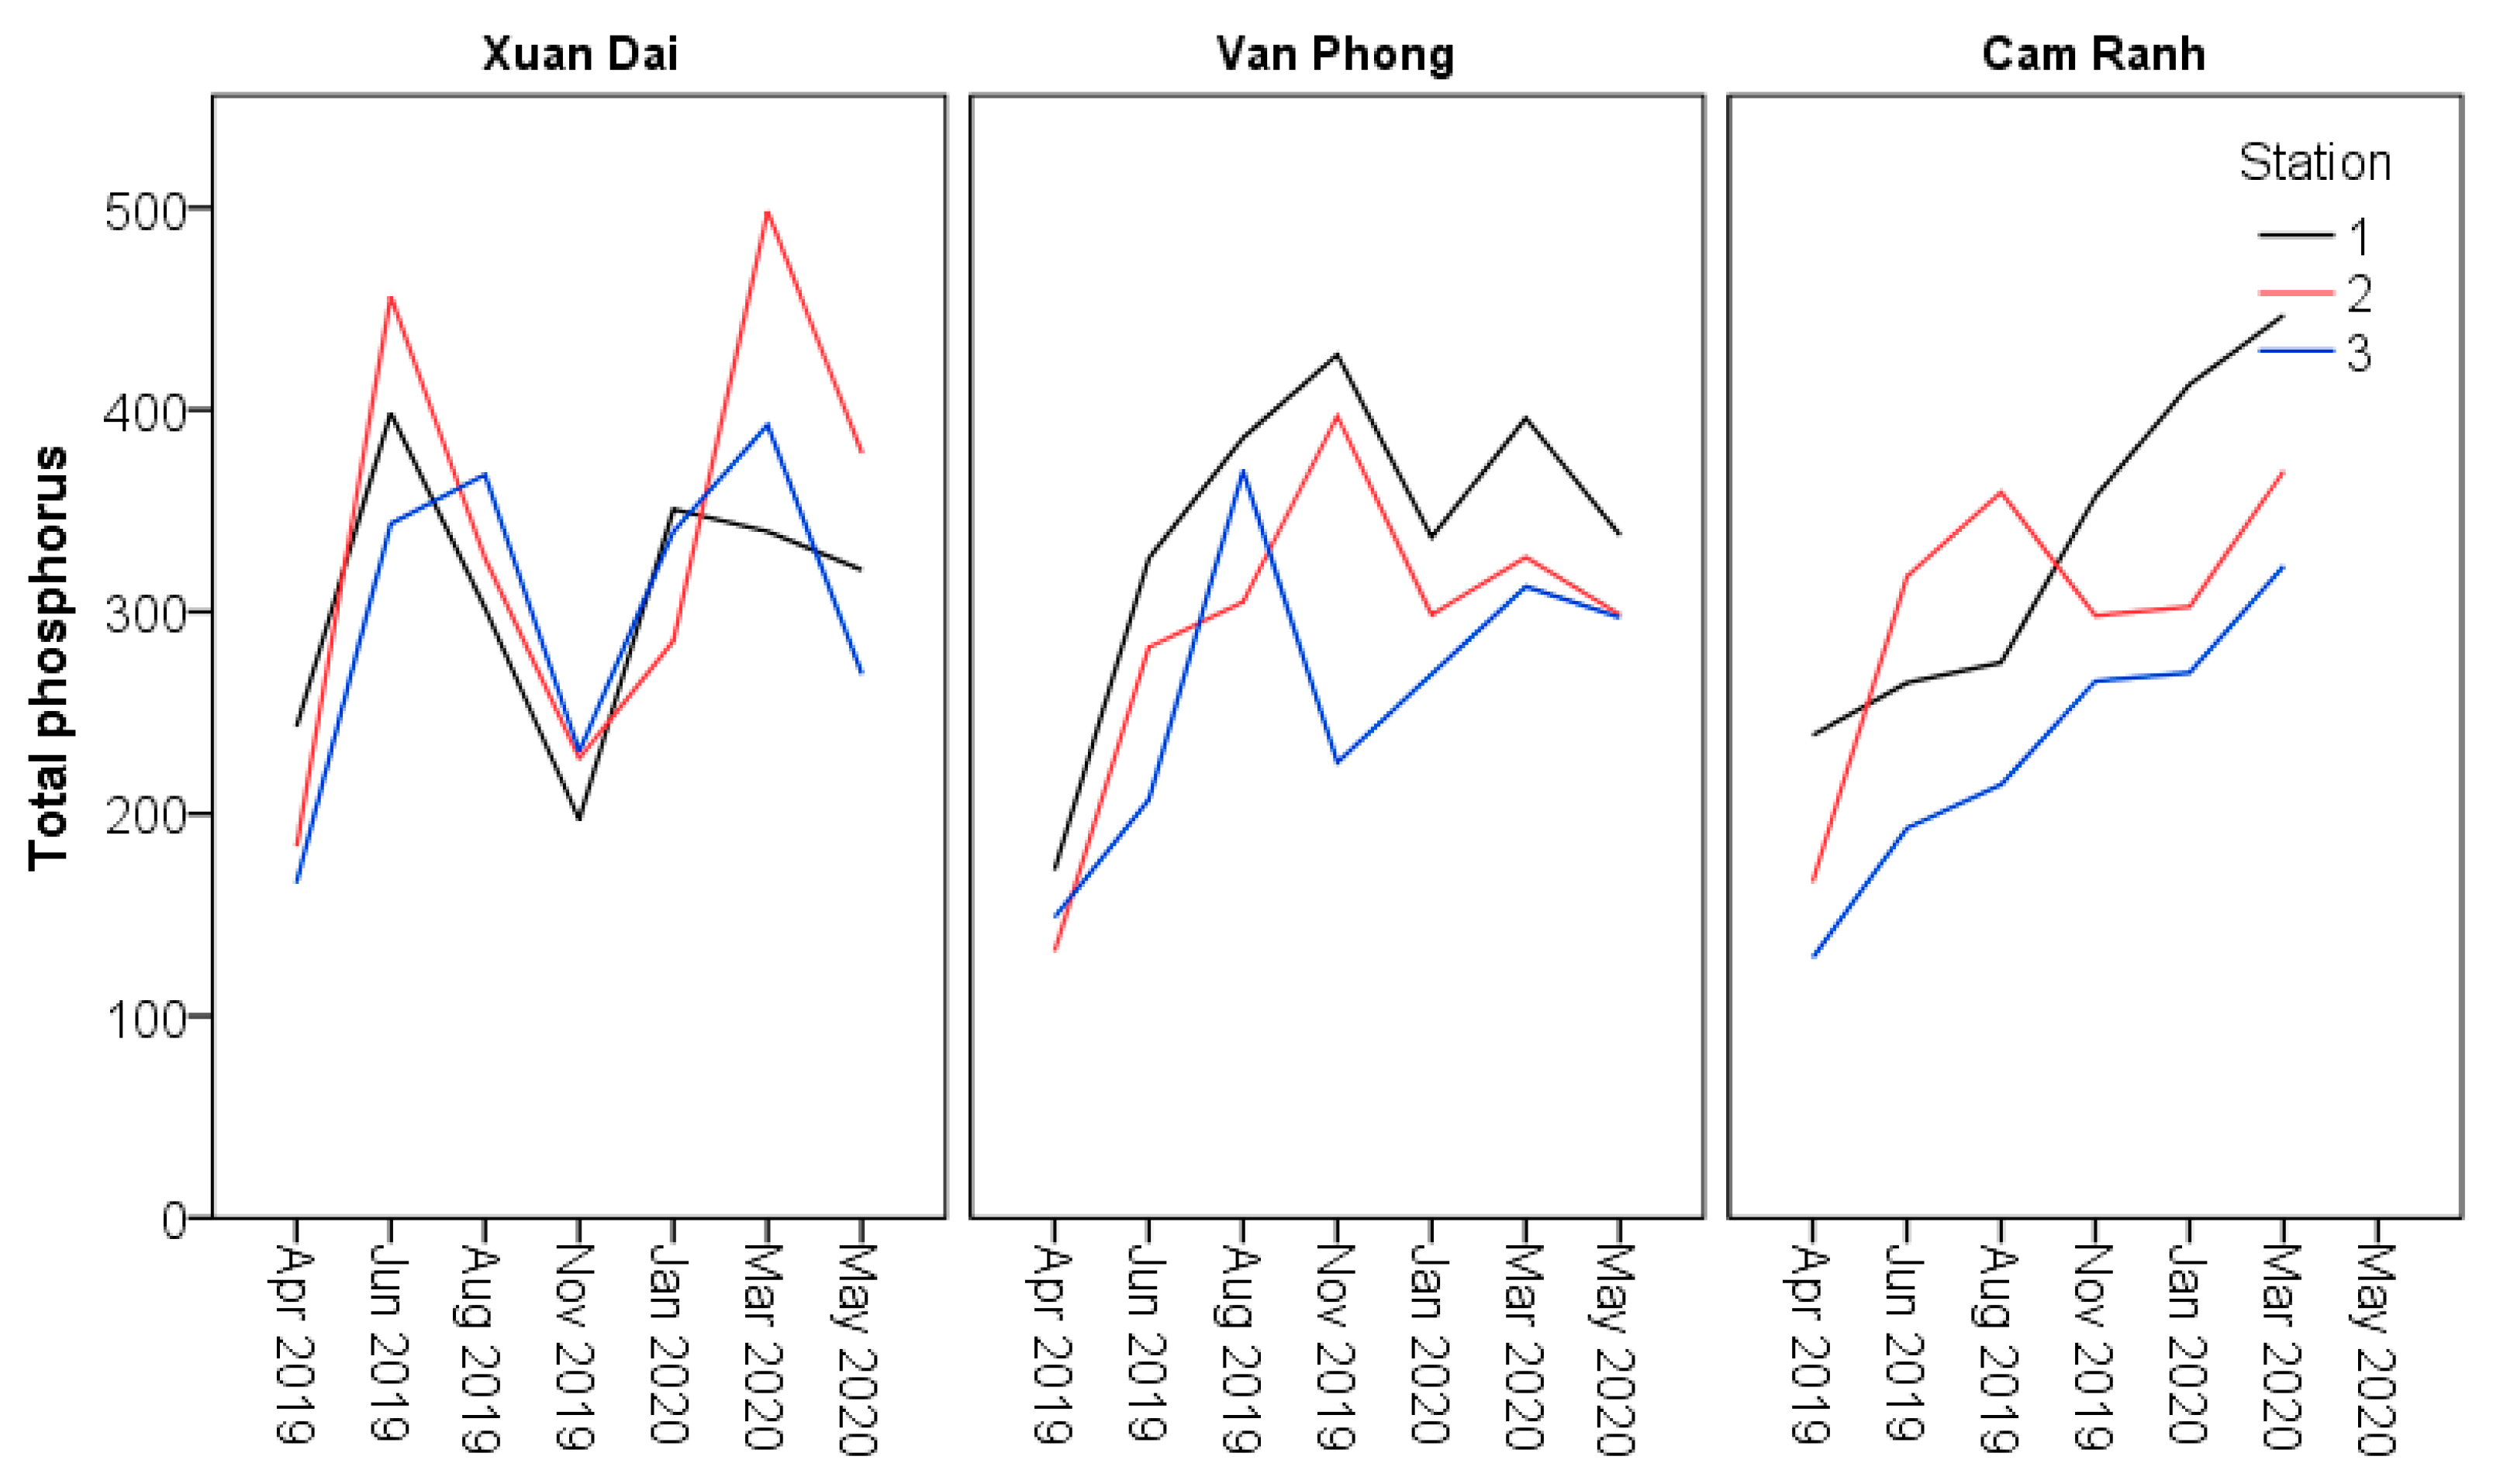
3.2. Sediment Environment
4. Discussion
5. Conclusions
Author Contributions
Funding
Institutional Review Board Statement
Informed Consent Statement
Data Availability Statement
Acknowledgments
Conflicts of Interest
References
- FAO. The State of World Fisheries and Aquaculture 2020. Sustainability in Action; The Food and Agriculture Organization of the United Nations: Rome, Italy, 2020. [Google Scholar]
- Tri, N.N.; Tu, N.P.C.; Nhan, D.T.; Tu, N.V. An overview of aquaculture development in Viet Nam. Proc. Int. Conf. Fish. Aquac. 2022, 7, 53–73. [Google Scholar] [CrossRef]
- GSO. Statistics Year Book. Available online: https://www.gso.gov.vn/ (accessed on 22 August 2021).
- Cao, L.; Wang, W.; Yang, Y.; Yang, C.; Yuan, Z.; Xiong, S.; Diana, J. Environmental impact of aquaculture and countermeasures to aquaculture pollution in China. Environ. Sci. Pollut. Res. Int. 2007, 14, 452–462. [Google Scholar] [CrossRef] [PubMed]
- Dosdat, A. Environmental impact of aquaculture. In Fisheries and Aquaculture; Safran, P., Ed.; Encyclopedia of Life Support Systems (EOLSS) Publishers Co. Ltd.: Oxford, UK, 2009; pp. 208–229. [Google Scholar]
- Pérez, Ó.; Almansa, E.; Riera, R.; Rodriguez, M.; Ramos, E.; Costa, J.; Monterroso, Ó. Food and faeces settling velocities of meagre (Argyrosomus regius) and its application for modelling waste dispersion from sea cage aquaculture. Aquaculture 2014, 420, 171–179. [Google Scholar] [CrossRef]
- Tičina, V.; Katavić, I.; Grubišić, L. Marine Aquaculture impacts on marine biota in oligotrophic environments of the mediterranean sea–A review. Front. Mar. Sci. 2020, 7, 217. [Google Scholar] [CrossRef]
- Casadevall, M.; Rodríguez-Prieto, C.; Torres, J.; Eira, C.; Marengo, M.; Lejeune, P.; Merciai, R.; Richir, J. Editorial: Marine aquaculture impacts on marine biota. Front. Mar. Sci. 2021, 8, 615267. [Google Scholar] [CrossRef]
- Chua Thia, E.; Paw, J.N.; Guarin, F.Y. The environmental impact of aquaculture and the effects of pollution on coastal aquaculture development in Southeast Asia. Mar. Pollut. Bull. 1989, 20, 335–343. [Google Scholar] [CrossRef]
- Frankic, A.; Hershner, C. Sustainable aquaculture: Developing the promise of aquaculture. Aquac. Int. 2003, 11, 517–530. [Google Scholar] [CrossRef]
- Buschmann, A.H.; Riquelme, V.A.; Hernandez-Gonzalez, M.C.; Varela, D.; Jimenez, J.E.; Henrıquez, L.A.; Vergara, P.A.; Guınez, R.; Filun, L. A review of the impacts of salmonid farming on marine coastal ecosystems in the southeast Pacific. ICES J. Mar. Sci. 2006, 63, 1338–1345. [Google Scholar] [CrossRef]
- Grigorakis, K.; Rigos, G. Aquaculture effects on environmental and public welfare–The case of mediterranean mariculture. Chemosphere 2011, 85, 899–919. [Google Scholar] [CrossRef]
- Faruk, M.A.R.; Ali, M.M.; Patwary, Z.P. Evaluation of the status of use of chemicals and antibiotics in freshwater aquaculture activities with special emphasis to fish health management. J. Bangladesh Agric. Univ. 2010, 6, 381–390. [Google Scholar] [CrossRef] [Green Version]
- Hall, P.O.J.; Anderson, L.G.; Holby, O.; Kollberg, S.; Samuelsson, M.-O. Chemical fluxes and mass balances in a marine fish cage farm. I Carbon. Mar. Ecol. Prog. Ser. 1990, 61, 61–73. [Google Scholar] [CrossRef]
- Hall, P.O.J.; Holby, O.; Kollberg, S.; Samuelsson, M.O. Chemical fluxes and mass balances in a marine fish cage farm. IV. Nitrogen. Mar. Ecol. Prog. Ser. 1992, 89, 81–91. [Google Scholar] [CrossRef]
- Aslam, S.N.; Venzi, M.S.; Venkatraman, V.; Mikkelsen, Ø. Chemical assessment of marine sediments in vicinity of norwegian fish farms–A pilot study. Sci. Total Environ. 2020, 732, 139130. [Google Scholar] [CrossRef]
- Tornero, V.; Hanke, G. Chemical contaminants entering the marine environment from sea-based sources: A review with a focus on European seas. Mar. Pollut. Bull. 2016, 112, 17–38. [Google Scholar] [CrossRef]
- Hedberg, N.; Stenson, I.; Nitz Pettersson, M.; Warshan, D.; Nguyen-Kim, H.; Tedengren, M.; Kautsky, N. Antibiotic use in Vietnamese fish and lobster sea cage farms; implications for coral reefs and human health. Aquaculture 2018, 495, 366–375. [Google Scholar] [CrossRef]
- Iwama, G.K. Interactions between aquaculture and the environment. Crit. Rev. Environ. Control 1991, 21, 177–216. [Google Scholar] [CrossRef]
- Sarà, G.; Lo Martire, M.; Sanfilippo, M.; Pulicanò, G.; Cortese, G.; Mazzola, A.; Manganaro, A.; Pusceddu, A. Impacts of marine aquaculture at large spatial scales: Evidences from N and P catchment loading and phytoplankton biomass. Mar. Environ. Res. 2011, 71, 317–324. [Google Scholar] [CrossRef] [Green Version]
- Kalantzi, I.; Karakassis, I. Benthic impacts of fish farming: Meta-analysis of community and geochemical data. Mar. Pollut. Bull. 2006, 52, 484–493. [Google Scholar] [CrossRef]
- Stickney, R.R.; McVey, J.P. Responsible Marine Aquaculture; CABI Publishing: Wallingford, UK, 2002; p. 391. [Google Scholar]
- Havel, J.E.; Kovalenko, K.E.; Thomaz, S.M.; Amalfitano, S.; Kats, L.B. Aquatic invasive species: Challenges for the future. Hydrobiologia 2015, 750, 147–170. [Google Scholar] [CrossRef]
- Ruykys, L.; Ta, K.A.T.; Bui, T.D.; Vilizzi, L.; Copp, G.H. Risk screening of the potential invasiveness of non-native aquatic species in Vietnam. Biol. Invasions 2021, 23, 2047–2060. [Google Scholar] [CrossRef]
- Gowen, R.J. Managing eutrophication associated with aquaculture development. J. Appl. Ichthyol. 1994, 10, 242–257. [Google Scholar] [CrossRef]
- Talbot, C.; Hole, R. Fish diets and the control of eutrophication resulting from aquaculture. J. Appl. Ichthyol. 1994, 10, 258–270. [Google Scholar] [CrossRef]
- Bouwman, L.; Beusen, A.; Glibert, P.M.; Overbeek, C.; Pawlowski, M.; Herrera, J.; Mulsow, S.; Yu, R.; Zhou, M. Mariculture: Significant and expanding cause of coastal nutrient enrichment. Environ. Res. Lett. 2013, 8, 044026. [Google Scholar] [CrossRef]
- Mungkung, R.; Phillips, M.; Castine, S.; Beveridge, M.; Chaiyawannakarn, N.; Nawapakpilai, S.; Waite, R. Exploratory Analysis of Resource Demand and the Environmental Footprint of Future Aquaculture Development Using Life Cycle Assessment; White Paper; WorldFish: Penang, Malaysia, 2014. [Google Scholar]
- Ahmed, N.; Thompson, S.; Glaser, M. Global aquaculture productivity, environmental sustainability, and climate change adaptability. Environ. Manag. 2019, 63, 159–172. [Google Scholar] [CrossRef] [PubMed]
- Lum, W.M.; Benico, G.; Doan-Nhu, H.; Furio, E.; Leaw, C.P.; Leong, S.C.Y.; Lim, P.T.; Lim, W.A.; Lirdwitayaprasit, T.; Lu, S.; et al. The harmful raphidophyte Chattonella (Raphidophyceae) in Western Pacific: Its red tides and associated fisheries damage over the past 50 years (1969–2019). Harmful Algae 2021, 107, 102070. [Google Scholar] [CrossRef] [PubMed]
- Luom, P.T.; Hai, D.N.; Lam, N.N. Dinoflagellate cysts in surface sediments at Van Phong Bay, Khanh Hoa Province, Vietnam: Distribution, abundance and potentially harmful algal blooms. Acad. J. Biol. 2021, 43. [Google Scholar] [CrossRef]
- Doan-Nhu, H.; Nguyen-Ngoc, L.; Son, B.M. Unusual fish killing blooms of Tripos furca in Van Phong Bay, South Viet Nam. Harmful Algae News IOC Newsl. Toxic Algae Algal Bloom. 2017, 57, 1–3. [Google Scholar]
- Brown, A.R.; Lilley, M.; Shutler, J.; Lowe, C.; Artioli, Y.; Torres, R.; Berdalet, E.; Tyler, C.R. Assessing risks and mitigating impacts of harmful algal blooms on mariculture and marine fisheries. Rev. Aquac. 2020, 12, 1663–1688. [Google Scholar] [CrossRef] [Green Version]
- Ferreira, J.G.; Taylor, N.G.H.; Cubillo, A.; Lencart-Silva, J.; Pastres, R.; Bergh, Ø.; Guilder, J. An integrated model for aquaculture production, pathogen interaction, and environmental effects. Aquaculture 2021, 536, 736438. [Google Scholar] [CrossRef]
- Nguyen, T.A. Evaluation of the oceanographical conditions and environmental capacity for mariculture development in coastal waters of Khanh Hoa Province. Collect. Mar. Res. Work. 2002, XII, 67–82. [Google Scholar]
- Jones, C.M.; Le Anh, T.; Priyambodo, B. Lobster aquaculture development in Vietnam and Indonesia. In Lobsters: Biology, Fisheries and Aquaculture; Radhakrishnan, E.V., Phillips, B.F., Achamveetil, G., Eds.; Springer: Singapore, 2019; pp. 541–570. [Google Scholar] [CrossRef]
- Tuan, L.A. Status of Aquaculture and Associated Environmental Management Issues in Vietnam. Available online: https://assets.publishing.service.gov.uk/media/57a08d01ed915d3cfd001764/RLAquaVietnamaquacultureR8094.pdf (accessed on 22 September 2021).
- Jones, C. Summary of disease status affecting tropical spiny lobster aquaculture in Vietnam and Indonesia. In Chapter 5.4. Spiny Lobster Aquaculture Development in Indonesia, Vietnam and Australia, Proceedings of the International Lobster Aquaculture Symposium, Lombok, Indonesia, 22–25 April 2014; Springer: Singapore, 2015; pp. 111–113. [Google Scholar]
- Shafer, C.S.; Inglis, G.J.; Martin, V. Examining residents’ proximity, recreational use, and perceptions regarding proposed aquaculture development. Coast. Manag. 2010, 38, 559–574. [Google Scholar] [CrossRef]
- Murray, G.; D’Anna, L. Seeing shellfish from the seashore: The importance of values and place in perceptions of aquaculture and marine social–ecological system interactions. Mar. Policy 2015, 62, 125–133. [Google Scholar] [CrossRef]
- Dalton, T.; Jin, D.; Thompson, R.; Katzanek, A. Using normative evaluations to plan for and manage shellfish aquaculture development in Rhode Island coastal waters. Mar. Policy 2017, 83, 194–203. [Google Scholar] [CrossRef]
- Cavallo, M.; Pérez Agúndez, J.A.; Raux, P.; Frangoudes, K. Is existing legislation supporting socially acceptable aquaculture in the European Union? A transversal analysis of France, Italy and Spain. Rev. Aquac. 2021, 13, 1683–1694. [Google Scholar] [CrossRef]
- Schlag, A.K. Aquaculture: An emerging issue for public concern. J. Risk Res. 2010, 13, 829–844. [Google Scholar] [CrossRef]
- Burgess, M.; Tansey, J. Complexity of public interest in ethical analysis of genomics: Ethical reflections on salmon genomics/aquaculture. In Electronic Working Papers Series. Vancouver: W. Maurice Young Centre for Applied Ethics; The University of British Columbia: Vancouver, BC, Canada, 2005. [Google Scholar]
- Boyd, C.E.; McNevin, A.A. Aquaculture, Resource Use, and the Environment; John Wiley & Sons, Inc.: Hoboken, NJ, USA, 2015; p. 349. [Google Scholar]
- Sanchez-Jerez, P.; Karakassis, I.; Massa, F.; Fezzardi, D.; Aguilar-Manjarrez, J.; Soto, D.; Chapela, R.; Avila, P.; Macias, J.C.; Tomassetti, P.; et al. Aquaculture’s struggle for space: The need for coastal spatial planning and the potential benefits of Allocated Zones for Aquaculture (AZAs) to avoid conflict and promote sustainability. Aquac. Environ. Interact. 2016, 8, 41–54. [Google Scholar] [CrossRef] [Green Version]
- Porporato, E.M.D.; Pastres, R.; Brigolin, D. Site suitability for finfish marine aquaculture in the central mediterranean sea. Front. Mar. Sci. 2020, 6, 772. [Google Scholar] [CrossRef] [Green Version]
- Barnaby, R.; Adams, S. Chapter 5: Aquaculture: Opportunity or threat to traditional capture fishermen. In Responsible Marine Aquaculture; Stickney, R.R., McVey, J.P., Eds.; CABI: Wallingford, UK, 2002. [Google Scholar]
- Orchard, S.E.; Stringer, L.C.; Quinn, C.H. Impacts of aquaculture on social networks in the mangrove systems of northern Vietnam. Ocean Coast. Manag. 2015, 114, 1–10. [Google Scholar] [CrossRef] [Green Version]
- Huong, L.L.; Thi, V.L.; Thai, T.H.; Jones, C.; Sang, H.M.; Kien, N.T.; Bich, N.T.K.; Kim, H.P.T.; An, K.N.; Trung, D.H.; et al. Comparative assessment of manufactured pellet feed and traditional trash fish feed on production of tropical rock lobster (Panulirus ornatus) and environmental effects in sea-cage culture in Vietnam. In Spiny Lobster Aquaculture Development in Indonesia, Vietnam and Australia, Proceedings of the International Lobster Aquaculture Symposium, Lombok, Indonesia, 22–25 April 2014; Springer: Singapore, 2015; pp. 68–81. [Google Scholar]
- Rice, E.W.; Baird, R.B.; Eaton, A.D. Standard Methods for the Examination of Water and WasteWater, 23rd ed.; American Public Health Association, American Water Works Association, Water Environment Federation: Washington, DC, USA, 2017. [Google Scholar]
- DEP. Maine Pollutant Discharge Elimination Sysytem Permit Marine Waste Discharge License; Maine Department of Environmental Protection: Augusta, ME, USA, 2014.
- Maroni, K. Monitoring and regulation of marine aquaculture in Norway. J. Appl. Ichthyol. 2000, 16, 192–195. [Google Scholar] [CrossRef]
- Hyland, J.; Balthis, L.; Karakassis, I.; Magni, P.; Petrov, A.; Shine, J.; Vestergaard, O.; Warwick, R. Organic carbon content of sediments as an indicator of stress in the marine benthos. Mar. Ecol. Prog. Ser. 2005, 295, 91–103. [Google Scholar] [CrossRef] [Green Version]
- Minh-Thu, P.; Minh Sang, H.; Thai An, H. Mariculture in southern central region, Vietnam: Status and orientation toward sustainable development. J. Agric. Ecol. Res. Int. 2021, 22, 28–37. [Google Scholar] [CrossRef]
- IUCN; IISD. Expanding Shrimp Aquaculture on Sandy Land in Vietnam: Challenges and Opportunities; World Conservation Union (IUCN) & International Institute for Sustainable Development (IISD): Hanoi, Vietnam, 2003. [Google Scholar]
- Dung, T.V.; Hung, P.Q.; Thong, N.T. Marine finfish farming in Vietnam: Status and direction. J. Fish. Sci. Technol. 2016, 2016, 104–110. [Google Scholar]
- Minh-Thu, P.; Thao, N.T.; Duan, H.D. Estimating chlorophyll-a variations with temporal MODIS data time series. In Proceedings of the 10th International GIS-IDEAS 2021 Conference, Phitsanulok, Thailand, 2–4 September 2021; pp. 102–108. [Google Scholar]
- Hoang, T.M.H.; Tran, T.K.N.; Ton, T.K.; Le, Q.H.; Nguyen, P.H. Investigating the status of centralised lobster cage cultureand water environment quality at Xuan Dai bay, Phu Yen province. J. Sci. Technol. Vietnam Part B 2018, 60, 53–58. [Google Scholar] [CrossRef]
- Long, B.H.; Tuan, V.S.; An, N.T.; Minh-Thu, P. Characteristics of Nature, Environment, Resources and Orientation to Exploit for Sustainable Development of Coastal Waters of the South-Central Region; Publishing House for Science and Technology: Ha Noi, Vietnam, 2016; p. 293. [Google Scholar]
- Black, K.D. Environmental aspects of aquaculture. In Aquaculture, Innovation and Social Transformation; Culver, K., Castle, D., Eds.; Springer: Dordrecht, The Netherlands, 2008; pp. 97–113. [Google Scholar] [CrossRef]
- Thanh, T.D.; Cu, N.H.; Thung, D.C.; Thanh, D.N. Coastal Bays in Vietnam and Potential Use; Publishing House for Science and Technology: Ha Noi, Vietnam, 2008; p. 295. [Google Scholar]
- Huan, N.H.; Long, B.H. Material balance in Xuan Dai Bay, Vietnam. Vietnam J. Mar. Sci. Technol. 2004, 4, 29–40. [Google Scholar]
- Smith, S.V.; Dupra, V.; Crossland, J.I.M.; Crossland, C.J. Estuarine Systems of the East Asia Region: Carbon, Nitrogen and Phosphorus Fluxes; LOICZ Reports and Studie 16; International Biosphere-Geosphere Programme (IGBP); LOICZ: Texel, The Netherlands, 2000; p. 127. [Google Scholar]
- Minh-Thu, P.; Chung, T.V.; Long, B.H.; An, N.T.; Thao, P.T.P.; Duan, H.D. Estimation of residence time in coastal waters of Vietnam: A comparison of radioactivity, hydrodynamics, and LOICZ approach. J. Mar. Sci. Technol. 2020, 28, 131–139. [Google Scholar]
- Phan, H.M.; Ye, Q.; Reniers, A.J.H.M.; Stive, M.J.F. Tidal wave propagation along the Mekong deltaic coast. Estuar. Coast. Shelf Sci. 2019, 220, 73–98. [Google Scholar] [CrossRef]
- Chung, T.V.; Huan, N.H.; Chien, T.N. Water exchange in Van Phong bay, Khanh Hoa province by hydrodynamic model. Vietnam J. Mar. Sci. Technol. 2021, 21, 97–106. [Google Scholar] [CrossRef]
- Long, B.H.; Chung, T.V. Calculations of tidal currents in VanPhong bay using the finite element method. Adv. Nat. Sci. 2010, 10, 478–495. [Google Scholar]
- Dauda, A.B.; Ajadi, A.; Tola-Fabunmi, A.S.; Akinwole, A.O. Waste production in aquaculture: Sources, components and managements in different culture systems. Aquac. Fish. 2019, 4, 81–88. [Google Scholar] [CrossRef]
- Schaanning, M.T. Distribution of Sediment Properties in Coastal Areas Adjacent to Fish Farms and Environmental Evaluation of Five Locations Surveyed in October 1993; Report No. O-93205, O-93062; Norwegian Institute for Water Research (NIVA): Oslo, Norway, 1994; p. 29. [Google Scholar]
- Pearson, T.H.; Stanley, S.O. Comparative measurement of the redox potential of marine sediments as a rapid means of assessing the effect of organic pollution. Mar. Biol. 1979, 53, 371–379. [Google Scholar] [CrossRef]
- Kristensen, E.; Anderson, F. Determination of organic carbon in marine sediments: A comparison of two CHN-analyzer methods. J. Exp. Mar. Biol. Ecol. 1987, 109, 15–23. [Google Scholar] [CrossRef]
- Tsutsumi, H.; Kikuchi, T.; Tanaka, M.; Higashi, T.; Imasaka, K.; Miyazaki, M. Benthic faunal succession in a cove organically polluted by fish farming. Mar. Pollut. Bull. 1991, 23, 233–238. [Google Scholar] [CrossRef]
- Hamoutene, D. Sediment sulphides and redox potential associated with spatial coverage of Beggiatoa spp. at finfish aquaculture sites in Newfoundland, Canada. ICES J. Mar. Sci. 2014, 71, 1153–1157. [Google Scholar] [CrossRef] [Green Version]
- Cromey, C.J.; Nickell, T.D.; Black, K.D. DEPOMOD—Modelling the deposition and biological effects of waste solids from marine cage farms. Aquaculture 2002, 214, 211–239. [Google Scholar] [CrossRef]
- Ton Nu Hai, A.; Speelman, S. Economic-environmental trade-offs in marine aquaculture: The case of lobster farming in Vietnam. Aquaculture 2020, 516, 734593. [Google Scholar] [CrossRef]
- Ton Nu Hai, A.; Speelman, S. Involving stakeholders to support sustainable development of the marine lobster aquaculture sector in Vietnam. Mar. Policy 2020, 113, 103799. [Google Scholar] [CrossRef]
- Minh, M.D. Lobster Culture Zoning Plan for 2020 and Toward 2030 in Vietnam. Khanh Hoa, Vietnam; Research Institute of Aquaculture III: Khanh Hoa, Vietnam, 2015. [Google Scholar]
- People’s Committee of Phu Yen Province. Announcement on the Causes of Dead Lobster in Xuan Phuong and Xuan Yen Commune, Song Cau Town; Local Report: Phu Yen, Vietnam, 2017. [Google Scholar]
- d’Orbcastel, E.R.; Blancheton, J.-P.; Aubin, J. Towards environmentally sustainable aquaculture: Comparison between two trout farming systems using life cycle assessment. Aquacult. Eng. 2009, 40, 113–119. [Google Scholar] [CrossRef] [Green Version]


| Provinces | Location | Type of Farming | Number of Cages | Products (tonnes) |
|---|---|---|---|---|
| Phu Yen | Total | Lobster cages | 79,073 | 732 |
| Xuan Dai Bay | Lobster cages | 79,073 | 732 | |
| Finfish cages | 721 | 65.5 | ||
| Khánh Hòa | Total | Lobster cages | 60,647 | 1540.4 |
| Finfish cages | 9072 | 8288.4 | ||
| Van Phong Bay | Lobster cages | 33,167 | - | |
| Cam Ranh Bay | Lobster cages | 34,914 | - |
| Regions | District | Station Code in Figure 1 | Dry Seasons | Rainy Seasons |
|---|---|---|---|---|
| Xuan Dai Bay | Song Cau Town | XD_# | April, June, August 2019 March & May 2020 | November 2019 & Januray 2020 |
| Van Phong Bay | Van Ninh District | VP_# | April, June, August 2019 March & May 2020 | November 2019 & Januray 2020 |
| Cam Ranh Bay | Cam Ranh City | CR_# | April, June, August 2019 March 2020 | November 2019 & Januray 2020 |
| Factor | Rainy Season | Dry Season | QCVN 10:2015 | |||||
|---|---|---|---|---|---|---|---|---|
| Xuan Dai | Van Phong | Cam Ranh | Xuan Dai | Van Phong | Cam Ranh | |||
| pH | Minimum | 8.02a | 8.01a | 8.01a | 7.80a | 7.78a | 7.71a | 6.5–8.5 |
| Maximum | 8.09a | 8.09a | 8.05a | 8.14a | 8.31a | 8.32a | ||
| Mean | 8.05a | 8.04a | 8.02a | 8.01a | 8.10a | 8.07a | ||
| SE | 0.01a | 0.01a | 0.01a | 0.03a | 0.05a | 0.07a | ||
| Temperature (°C) | Minimum | 24.3a,b | 24.4a | 24.1b | 27.0a | 28.0a | 28.6a | |
| Maximum | 24.7a,b | 24.9a | 24.5b | 31.3a | 30.6a | 31.6a | ||
| Mean | 24.4a,b | 24.7a | 24.2b | 29.4a | 29.3a | 30.0a | ||
| SE | 0.1a,b | 0.1a | 0.1b | 0.4a | 0.2a | 0.2a | ||
| Salinity (‰) | Minimum | 30.90a | 32.20b | 32.10b | 30.64a | 32.35a | 30.90a | |
| Maximum | 31.80a | 32.50b | 32.60b | 34.30a | 33.50a | 33.70a | ||
| Mean | 31.43a | 32.30b | 32.30b | 32.61a | 32.81a | 32.65a | ||
| SE | 0.15a | 0.05b | 0.09b | 0.29a | 0.12a | 0.29a | ||
| DO (mg O2/L) | Minimum | 5.76a | 6.56a | 5.06b | 3.94a | 4.65a | 4.16a | ≥5 |
| Maximum | 6.99a | 6.93a | 5.80b | 7.11a | 7.12a | 7.45a | ||
| Mean | 6.52a | 6.81a | 5.53b | 5.61a | 6.27a | 5.61a | ||
| SE | 0.21a | 0.05a | 0.14b | 0.30a | 0.19a | 0.29a | ||
| BOD5 (mg O2/L) | Minimum | 0.84a | 0.67a | 0.45a | 0.59a | 0.97a | 0.27a | |
| Maximum | 3.06a | 2.61a | 2.10a | 3.28a | 5.42a | 3.11a | ||
| Mean | 1.94a | 1.59a | 1.24a | 2.29a | 2.77a | 1.93a | ||
| SE | 0.38a | 0.35a | 0.29a | 0.21a | 0.31a | 0.34a | ||
| NO2 (mg N/m3) | Minimum | 3.9a | 4.9a | 3.6a | 2.7a | 1.9a | 1.8a | |
| Maximum | 5.7a | 6.1a | 8.3a | 8.8a | 6.9a | 12.7a | ||
| Mean | 4.8a | 5.5a | 5.5a | 5.0a | 3.7a | 6.4a | ||
| SE | 0.3a | 0.2a | 0.6a | 0.5a | 0.5a | 1.1a | ||
| NO3 (mg N/m3) | Minimum | 65.0a | 62.0b | 79.0a | 42.0a | 43.0a | 39.0a | |
| Maximum | 126.0a | 85.0b | 125.0a | 85.0a | 92.0a | 81.0a | ||
| Mean | 106.0a | 75.3b | 106.7a | 65.2a | 67.1a | 64.6a | ||
| SE | 8.6a | 3.1b | 7.6a | 4.3a | 4.4a | 4.5a | ||
| Total nitrogen (mg N/m3) | Minimum | 624.9a | 618.7a | 663.7a | 580.5a | 651.5a | 596.3a | |
| Maximum | 710.3a | 726.5a | 790.6a | 985.2a | 925.7a | 956.8a | ||
| Mean | 659.0a | 672.3a | 720.2a | 721.7a | 808.3a | 738.6a | ||
| SE | 14.5a | 20.3a | 16.9a | 33.9a | 19.7a | 29.7a | ||
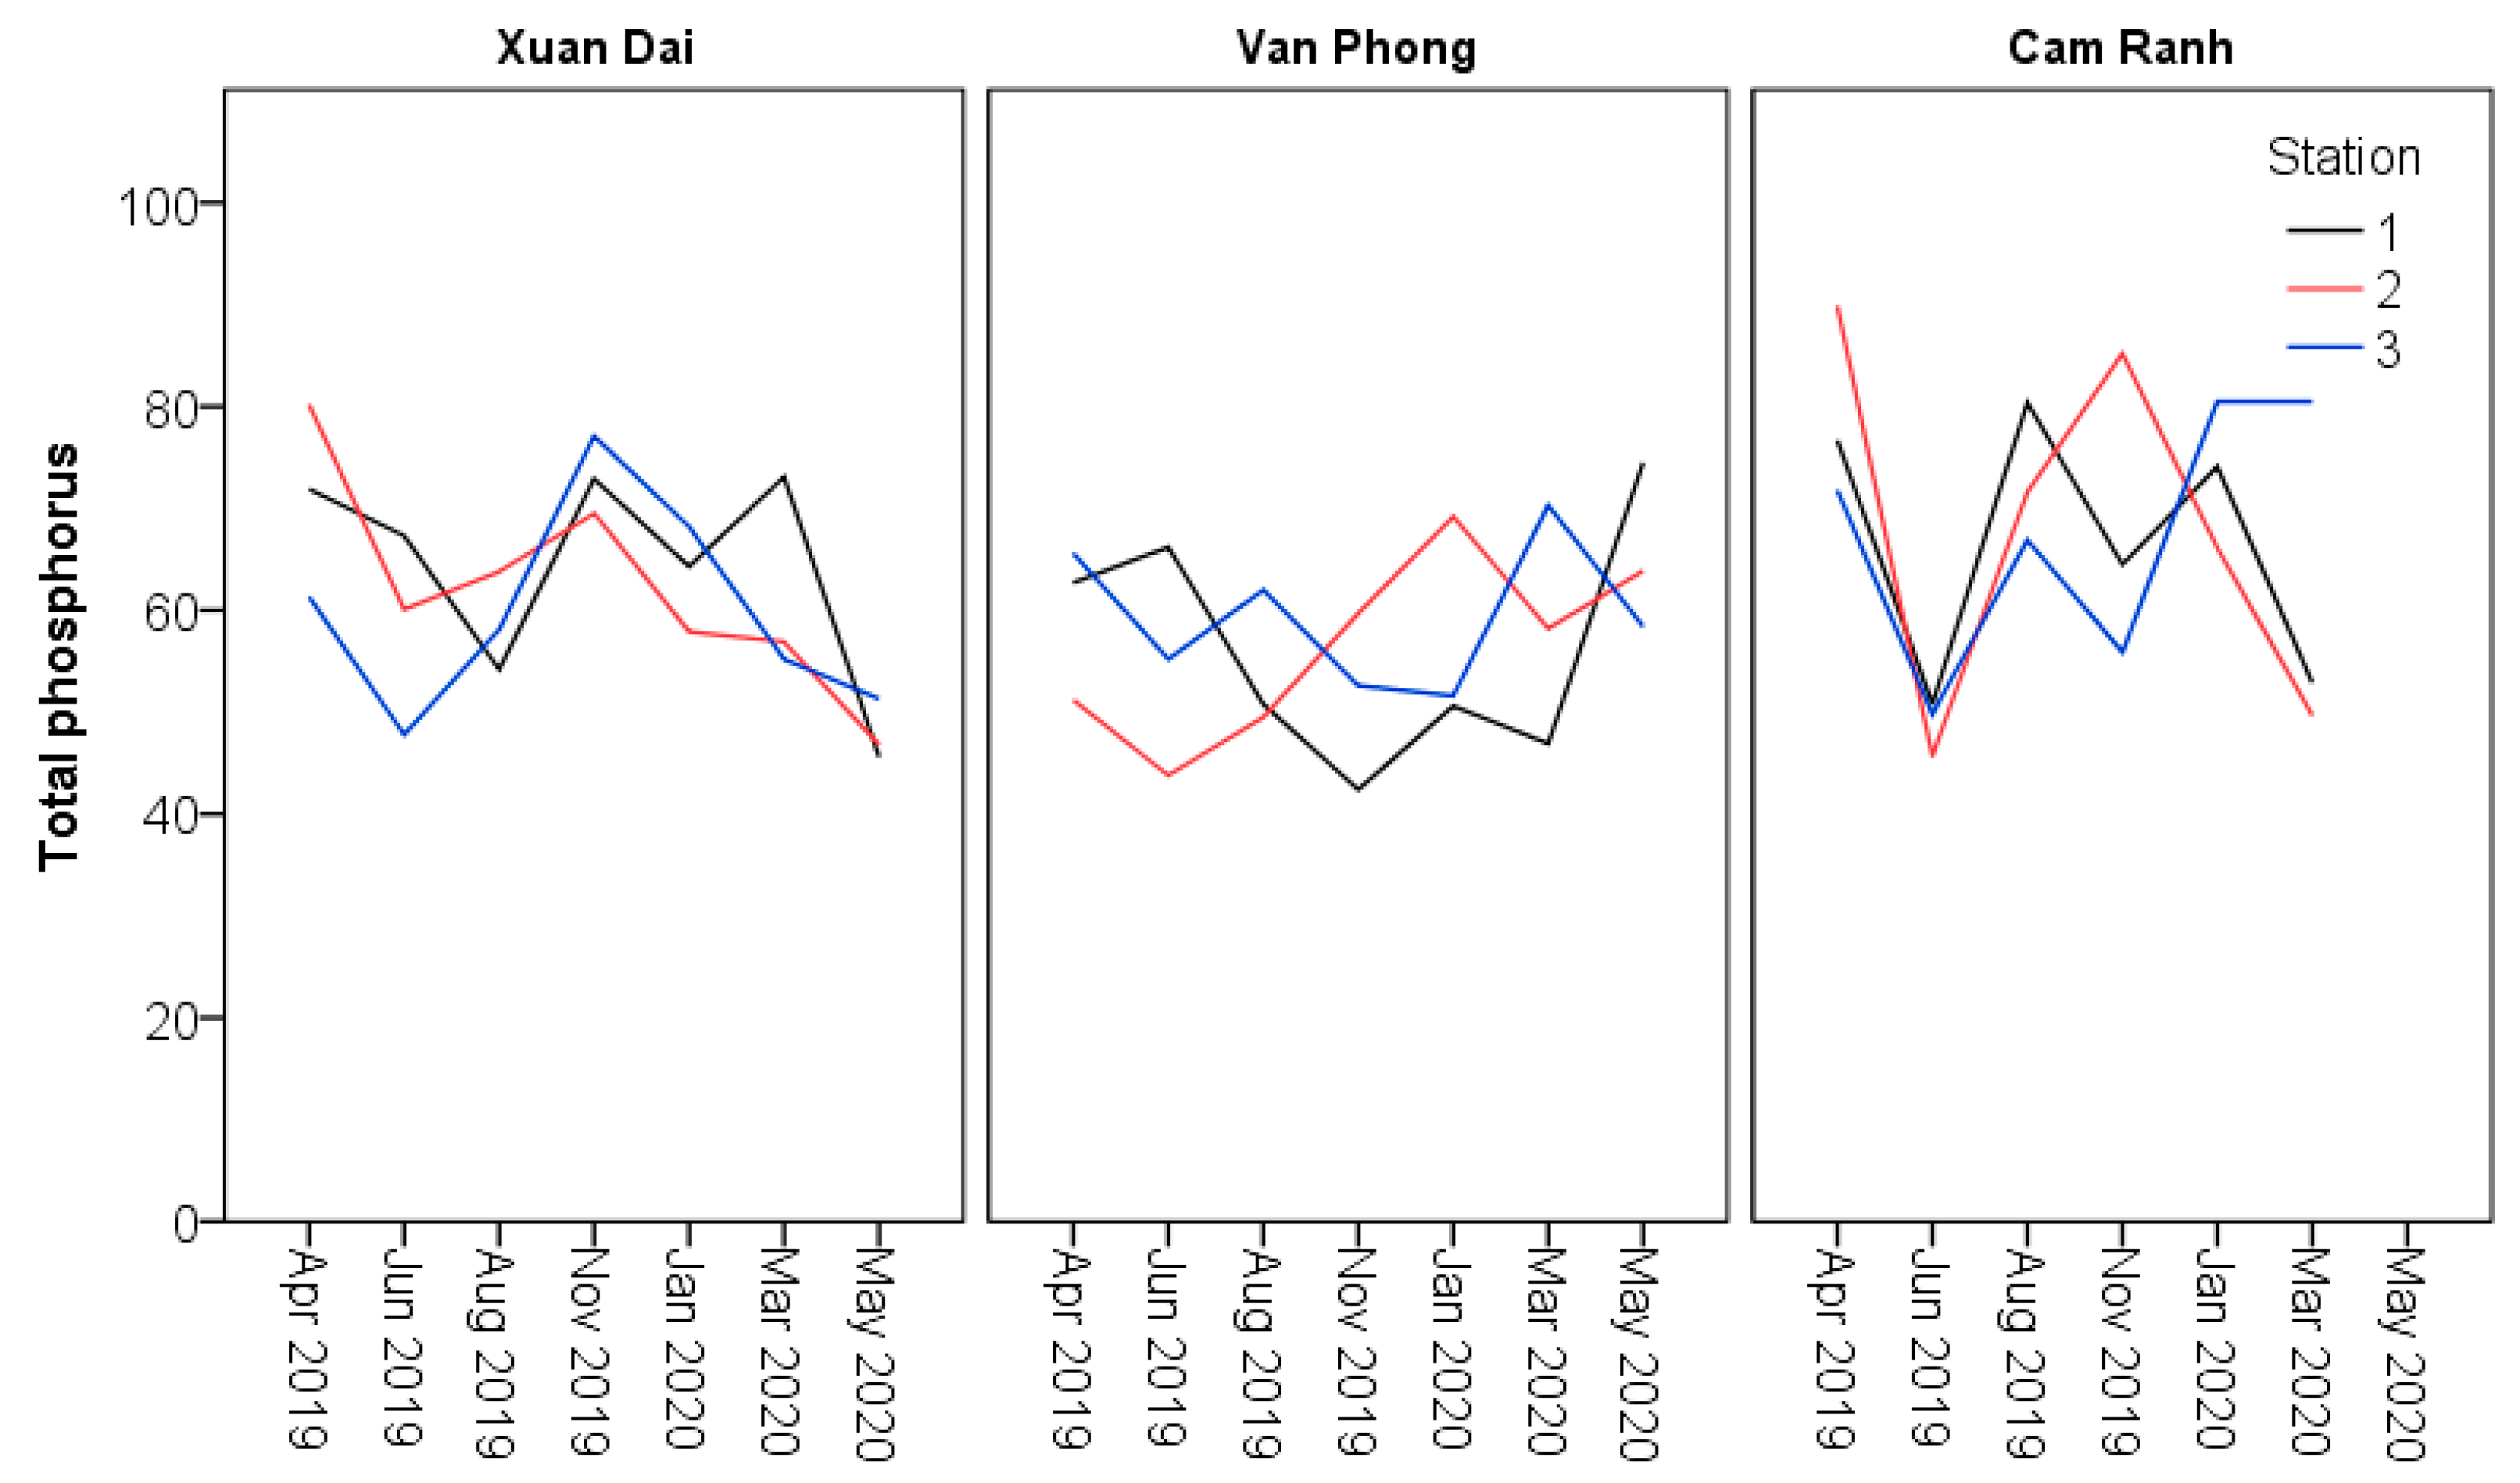
| Total phosphorus (mg P/m3) | Minimum | 57.9a | 42.4b | 55.9a | 45.6a | 43.8a | 45.7a | ≤200 |
| Maximum | 77.1a | 69.2b | 85.2a | 80.2a | 74.5a | 89.9a | ||
| Mean | 68.3a | 54.4b | 71.1a | 59.6a | 58.6a | 65.6a | ||
| SE | 2.7a | 3.7b | 4.5a | 2.6a | 2.3a | 4.4a | ||
| Factor | Rainy season | Dry season | Sediment Standards | |||||
|---|---|---|---|---|---|---|---|---|
| Xuan Dai | Van Phong | Cam Ranh | Xuan Dai | Van Phong | Cam Ranh | |||
| Eh mV | Minimum | −53.6a | −59.3a | −58.2a | −61.6a | −66.3a | −51.2a | |
| Maximum | −38.3a | −35.0a | −35.0a | −26.4a | −28.0a | −17.6a | ||
| Mean | −47.2a | −49.5a | −47.6a | −46.0a | −41.9a | −37.8a | ||
| SE | 2.7a | 3.7a | 3.3a | 2.9a | 3.2a | 3.2a | ||
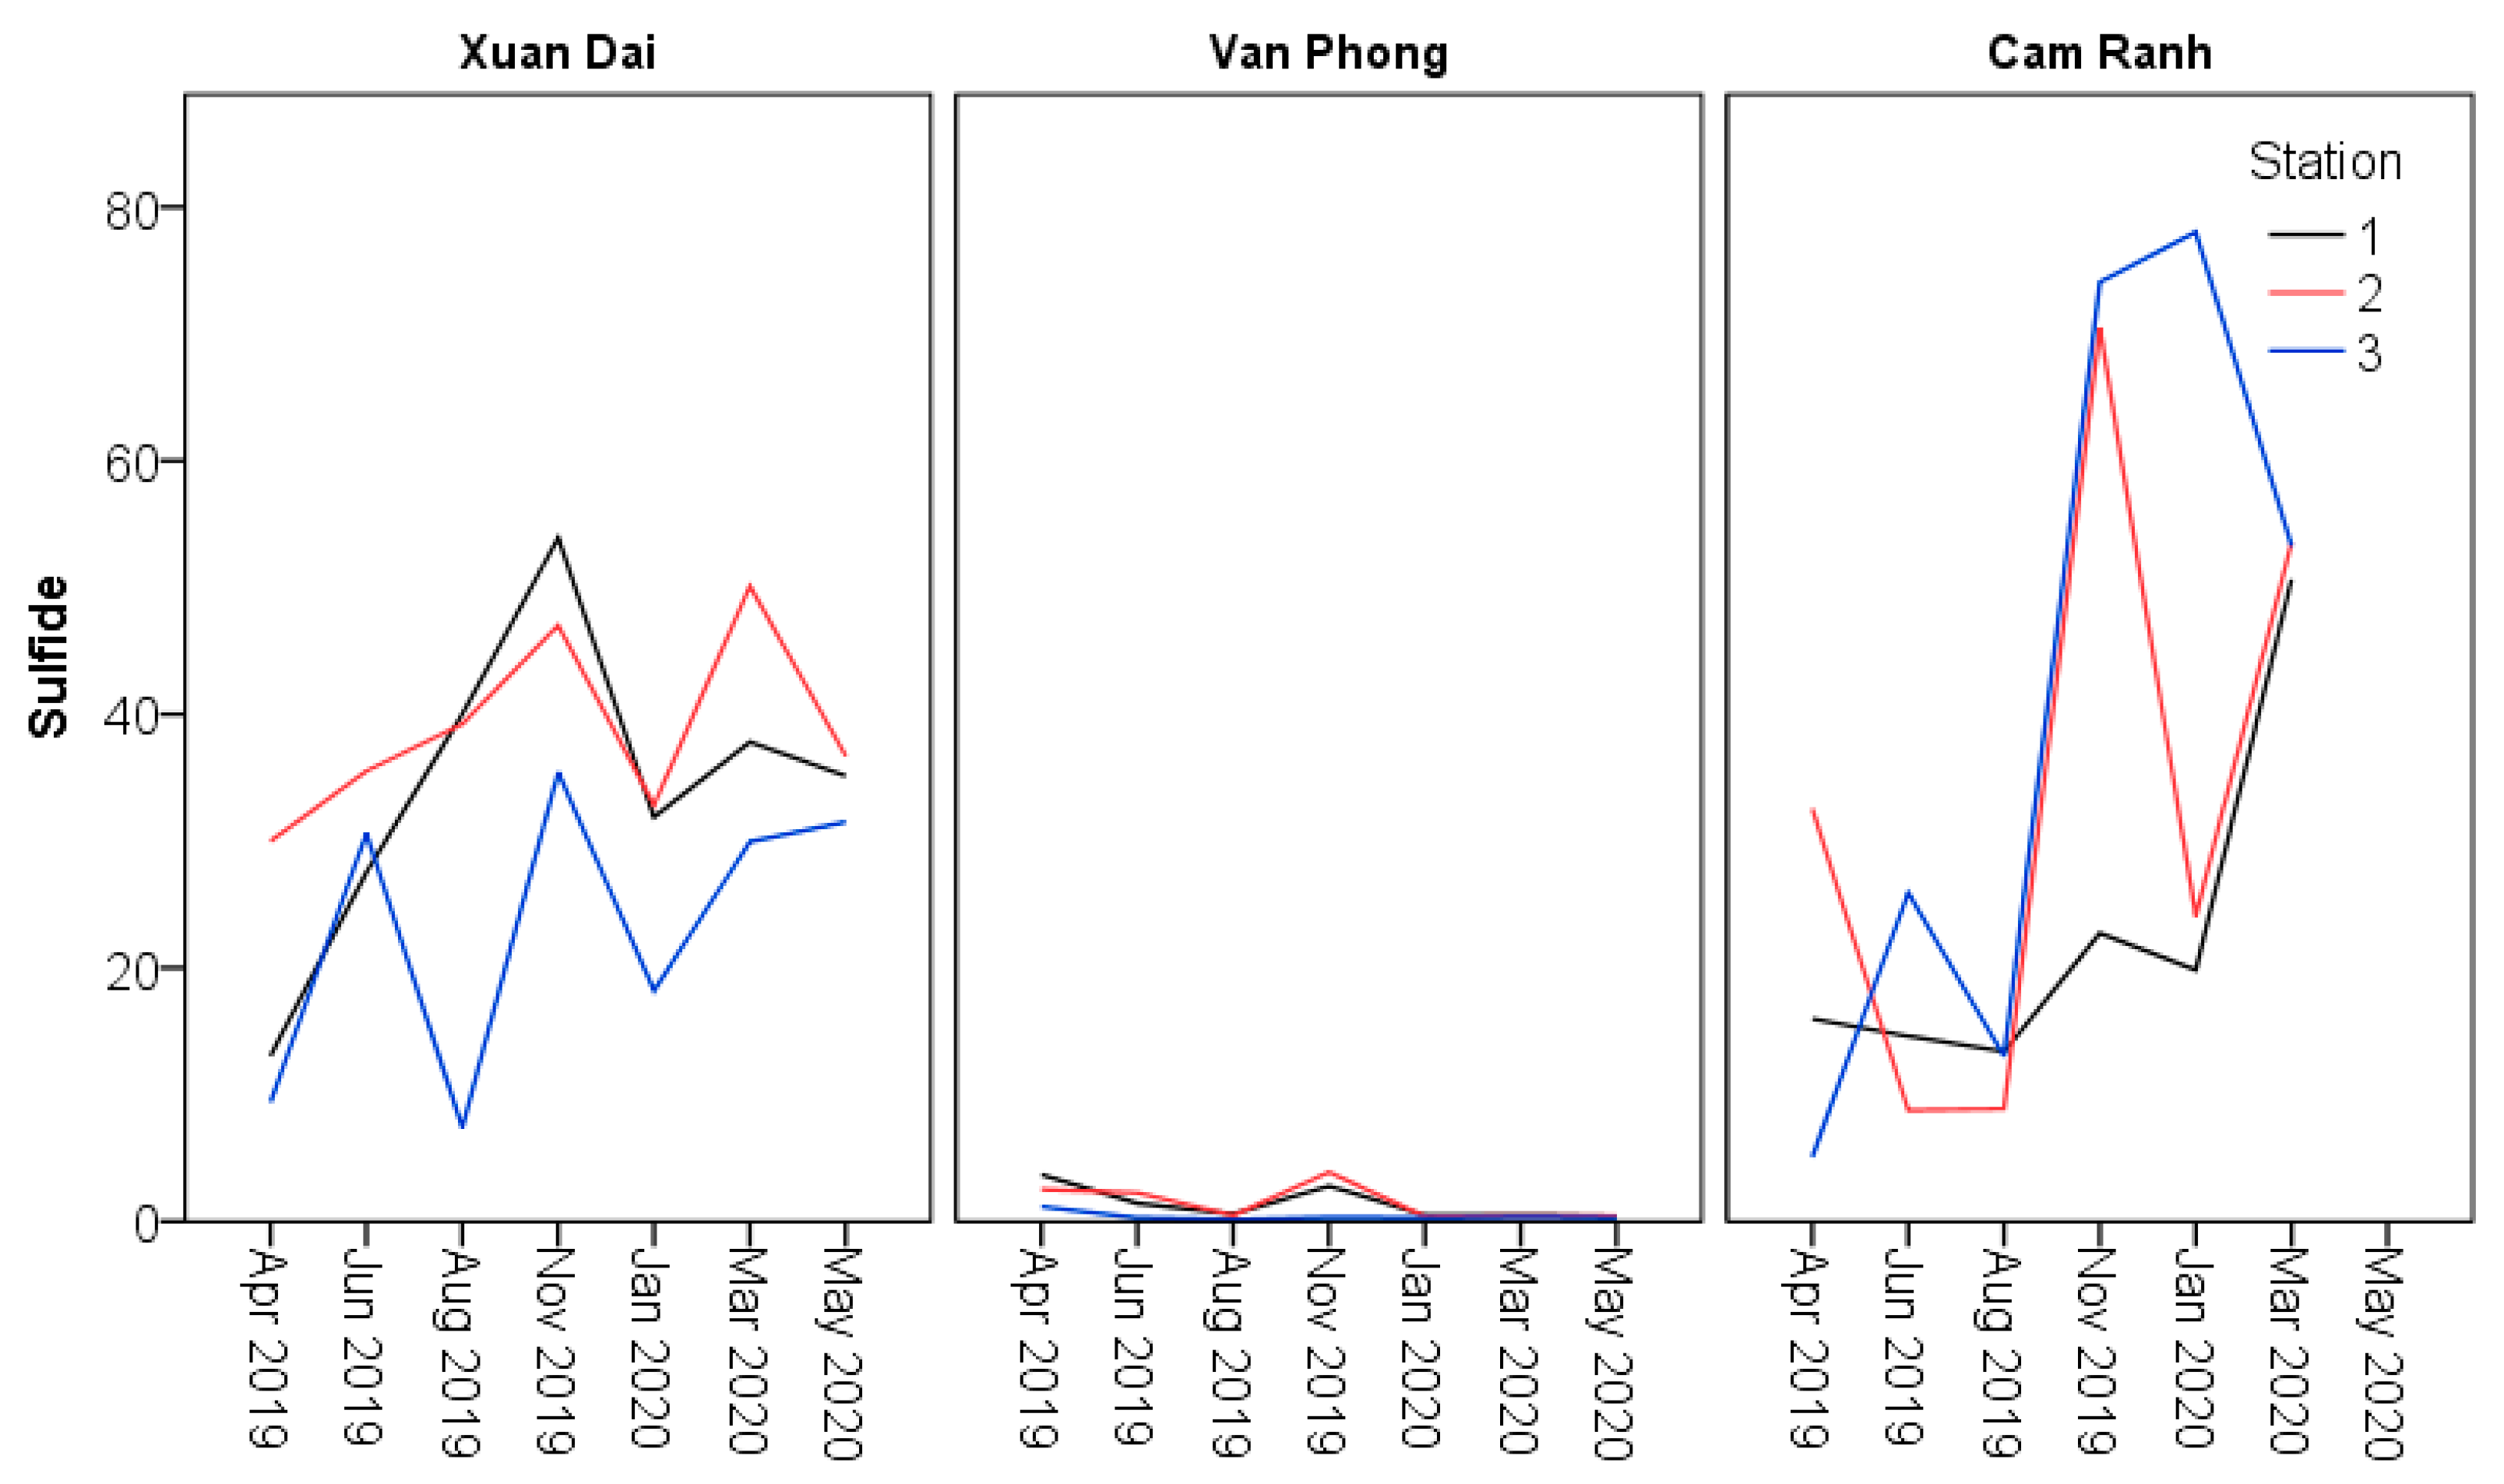
| Sulfide mg S kg−1 | Minimum | 18.204a | 0.274b | 19.834a | 7.396a | 0.149b | 5.085a | ≤1500 µM [52] (≤ 48.097 mg S kg−1) |
| Maximum | 53.898a | 3.888b | 78.031a | 50.115a | 3.680b | 53.559a | ||
| Mean | 36.546a | 1.358b | 48.214a | 30.264a | 1.002b | 24.638a | ||
| SE | 5.111a | 0.644b | 11.679a | 3.072a | 0.268b | 5.305a | ||
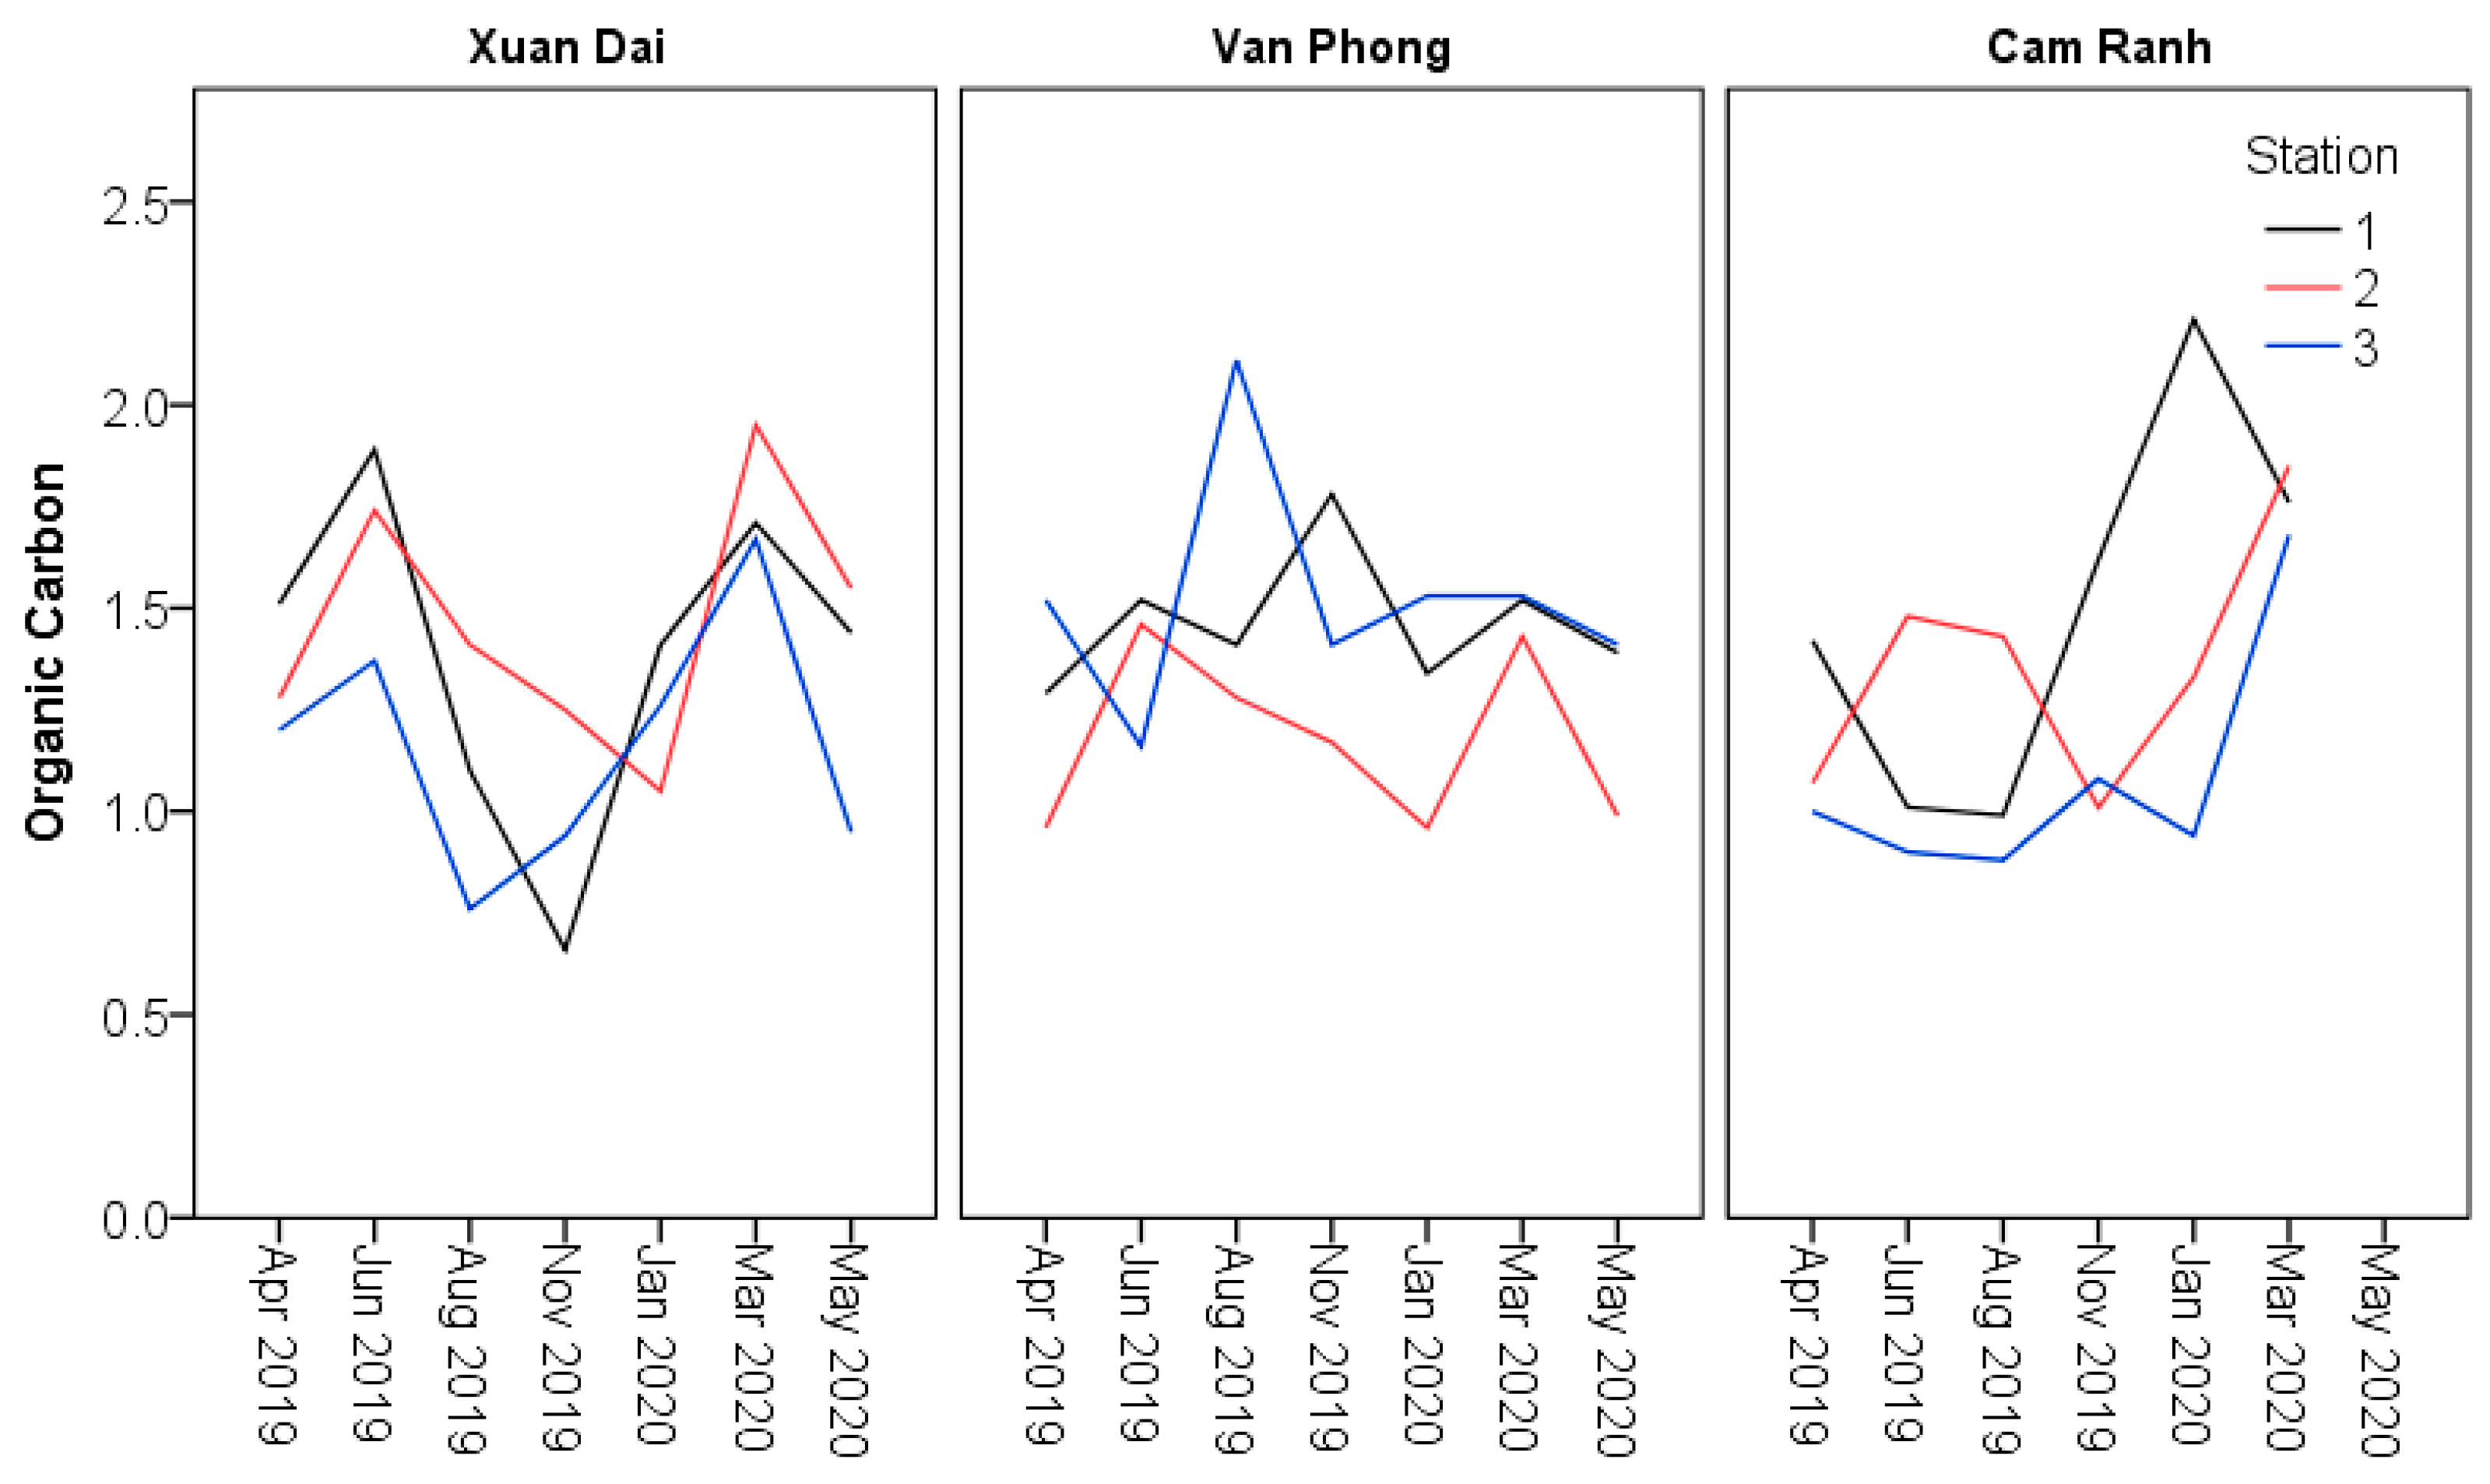
| Organic Carbon % | Minimum | 0.66a | 0.96a | 0.94a | 0.76a | 0.96a | 0.88a | ≤20 mg/g [53] (≤ 2%) |
| Maximum | 1.41a | 1.78a | 2.21a | 1.95a | 2.11a | 1.85a | ||
| Mean | 1.10a | 1.37a | 1.37a | 1.44a | 1.40a | 1.29a | ||
| SE | 0.11a | 0.12a | 0.20a | 0.09a | 0.07a | 0.10a | ||
| Total Phosphorus mg P kg−1 | Minimum | 197.2a | 225.4a | 265.7a | 165.8a | 132.0a | 128.8a | |
| Maximum | 350.7a | 427.2a | 412.5a | 498.2a | 395.8a | 446.9a | ||
| Mean | 271.9a | 325.7a | 317.6a | 332.4a | 286.6a | 274.8a | ||
| SE | 26.0a | 31.4a | 23.2a | 23.6a | 21.6a | 26.8a | ||
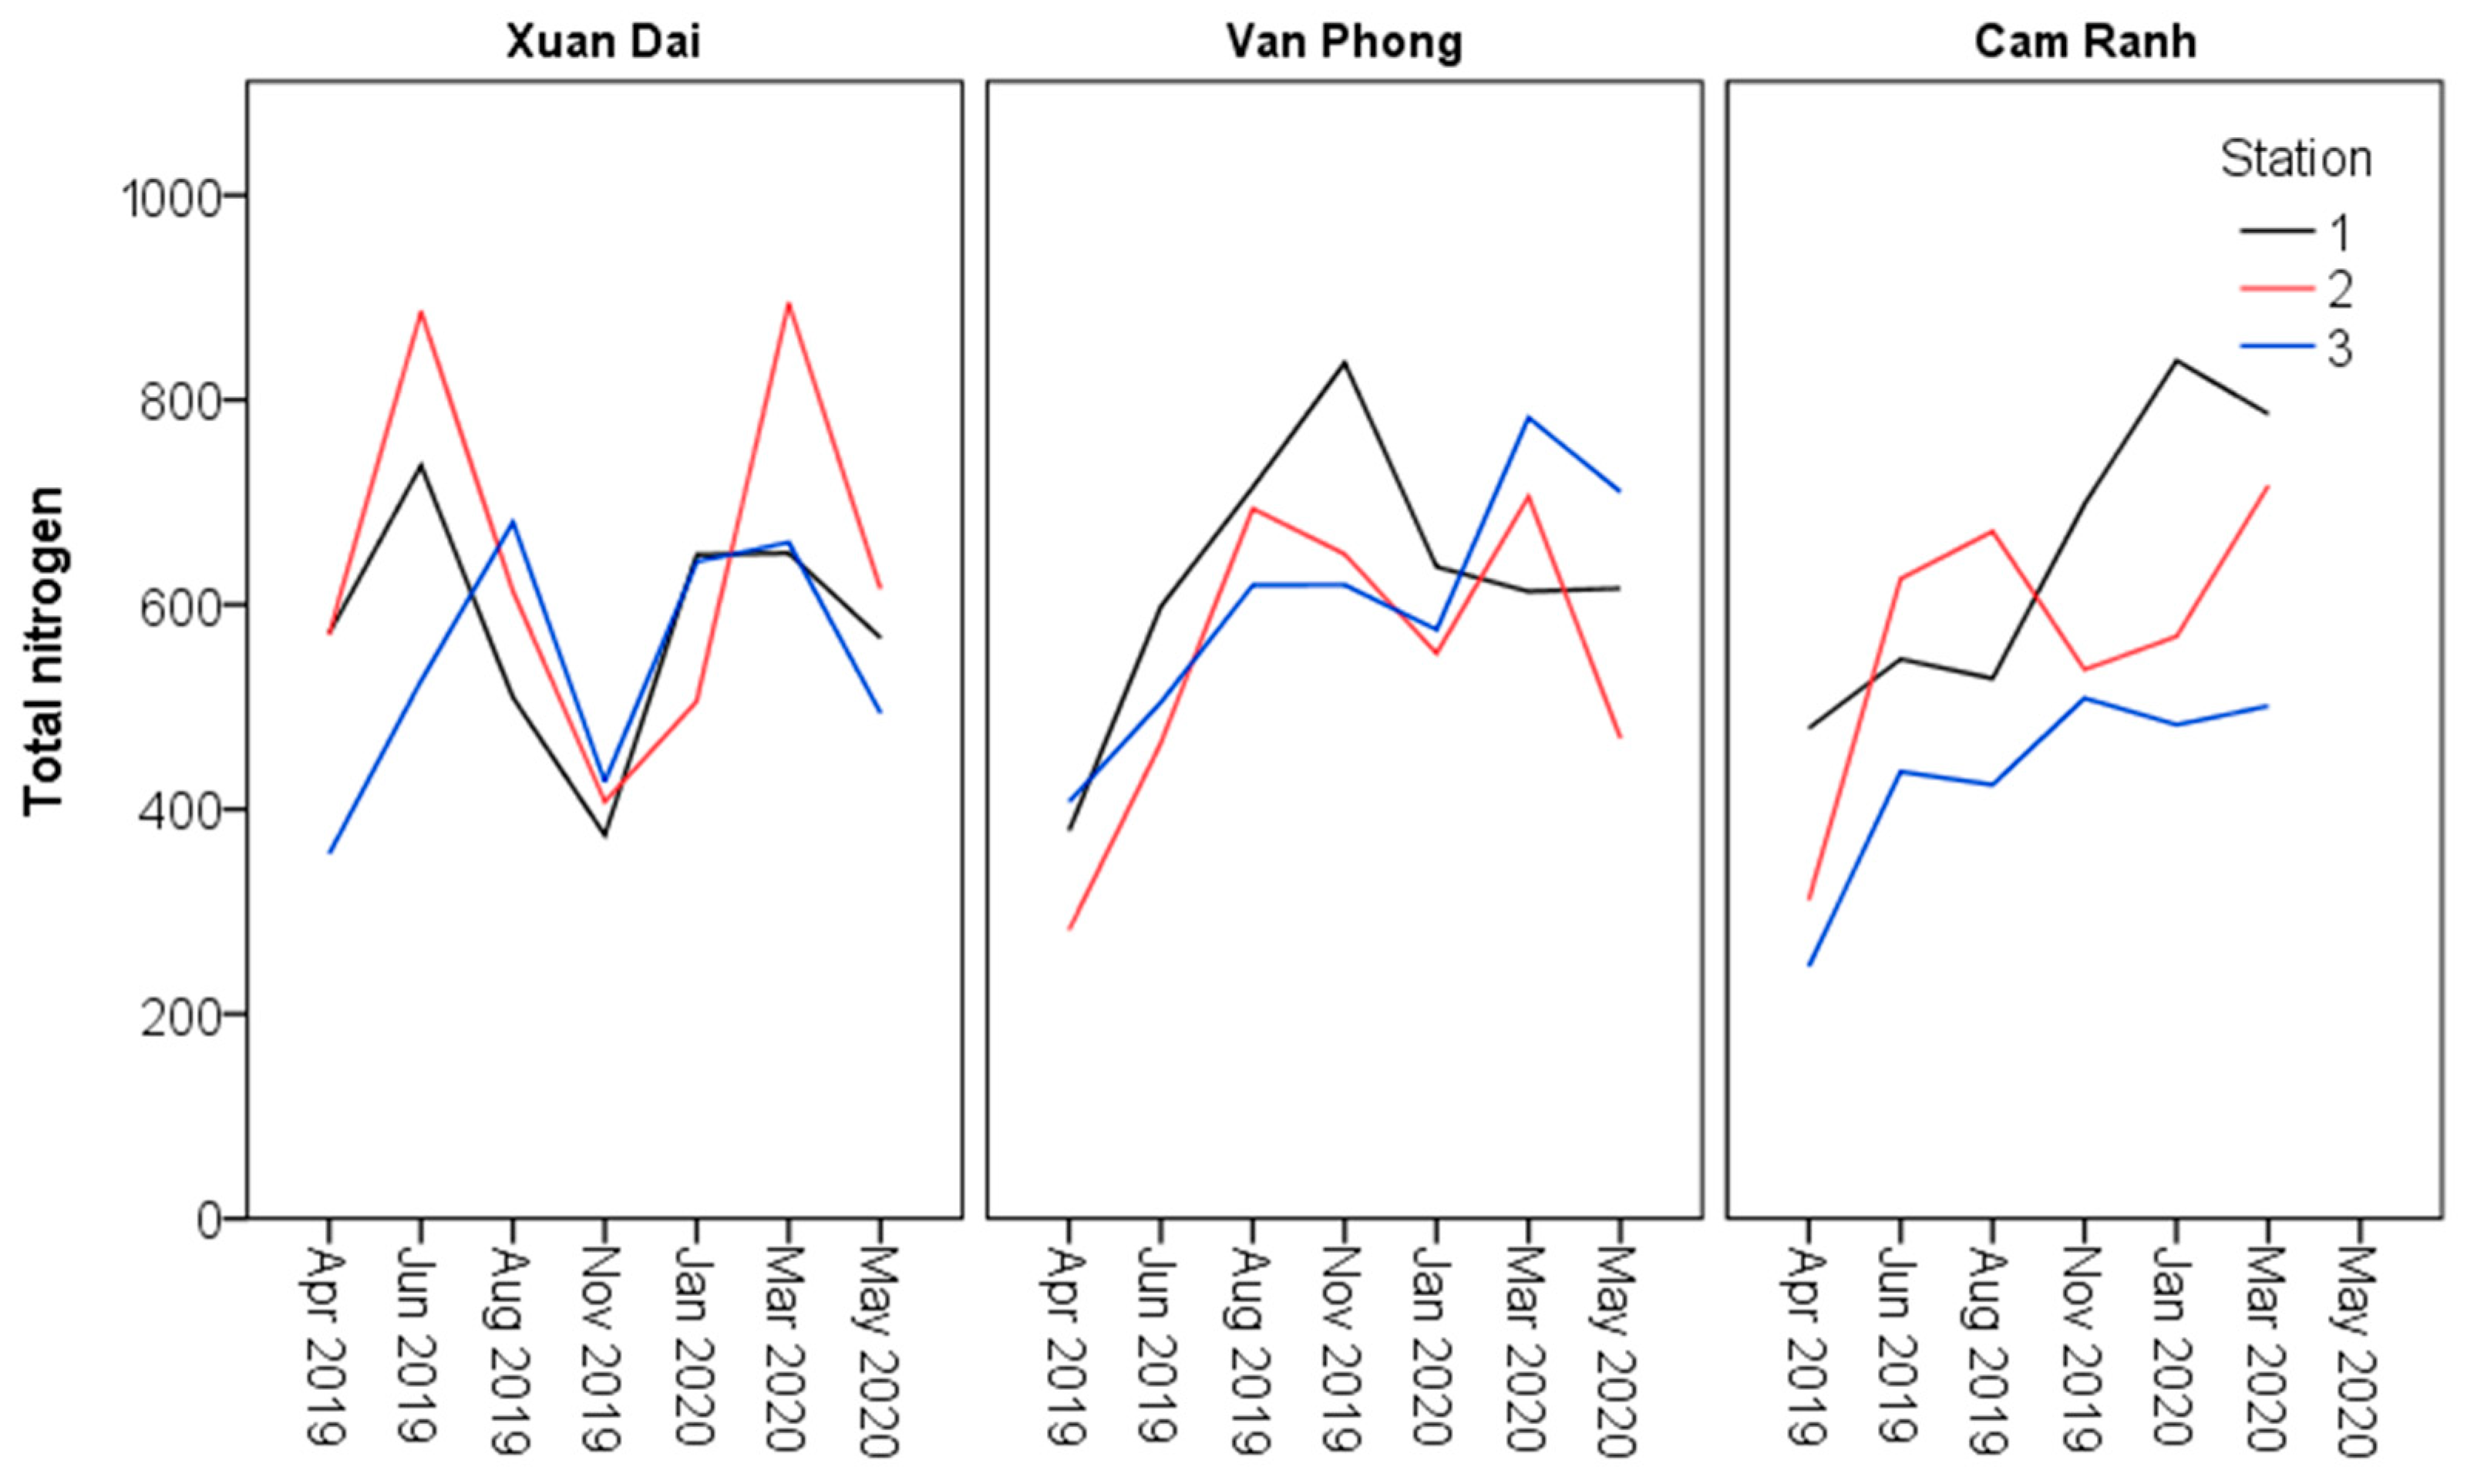
| Total Nitrogen mg N kg−1 | Minimum | 374.60a | 552.23a | 482.60a | 356.41a | 281.82a | 246.40a | |
| Maximum | 648.80a | 836.24a | 838.38a | 894.60a | 782.70a | 786.30a | ||
| Mean | 500.89a | 644.86a | 605.48a | 622.09a | 570.60a | 522.74a | ||
| SE | 48.98a | 41.13a | 55.80a | 36.52a | 37.68a | 46.12a | ||
| Factors | Unit | Xuan Dai Bay | Van Phong Bay | Cam Ranh Bay | References |
|---|---|---|---|---|---|
| Area | km2 | 60.8 | 425 | 71.1 | [62] |
| Ave./Max. depth 1 | m/m | 11/18 | 16/32 | 10/24 | [62] |
| Type of bay | Semi-closed | Semi-closed | Enclosed | [62] | |
| Size of gate: Width/Max. depth 2 | km/m | 4.5/18 | 17/30 0.25/32 | 3/24 | [60] |
| Water exchange times | Day | 5-29 | 43-61 | 15–67 | [63,65] |
Publisher’s Note: MDPI stays neutral with regard to jurisdictional claims in published maps and institutional affiliations. |
© 2022 by the authors. Licensee MDPI, Basel, Switzerland. This article is an open access article distributed under the terms and conditions of the Creative Commons Attribution (CC BY) license (https://creativecommons.org/licenses/by/4.0/).
Share and Cite
Phu, L.H.; Kim-Hong, P.T.; Chung, T.V.; Binh, T.V.; Dung, L.T.; Ngoc, P.H.; Thu, N.H.; Thu, N.T.T.; Anh, N.T.H.; Nguyen, A.L.; et al. Environmental Concerns for Sustainable Mariculture in Coastal Waters of South-Central Vietnam. Sustainability 2022, 14, 8126. https://doi.org/10.3390/su14138126
Phu LH, Kim-Hong PT, Chung TV, Binh TV, Dung LT, Ngoc PH, Thu NH, Thu NTT, Anh NTH, Nguyen AL, et al. Environmental Concerns for Sustainable Mariculture in Coastal Waters of South-Central Vietnam. Sustainability. 2022; 14(13):8126. https://doi.org/10.3390/su14138126
Chicago/Turabian StylePhu, Le Hung, Phan Thi Kim-Hong, Tran Van Chung, Tran Van Binh, Le Trong Dung, Pham Hong Ngoc, Nguyen Hong Thu, Nguyen Thi Toan Thu, Nguyen Thai Hai Anh, Anh Lam Nguyen, and et al. 2022. "Environmental Concerns for Sustainable Mariculture in Coastal Waters of South-Central Vietnam" Sustainability 14, no. 13: 8126. https://doi.org/10.3390/su14138126