Review

Mapping Roofing with Asbestos-Containing Material by Using Remote Sensing Imagery and Machine Learning-Based Image Classification: A State-of-the-Art Review

by
Mohammad Abbasi
1,2,
Sherif Mostafa
1,2,
Abel Silva Vieira
1,3,*,
Nicholas Patorniti
2,3 and
Rodney A. Stewart
1,2
1
Griffith School of Engineering and Built Environment, Griffith University, Parklands Drive, Southport, QLD 4222, Australia
2
Cities Research Institute, Griffith University, Parklands Drive, Southport, QLD 4222, Australia
3
UACS Consulting Pty Ltd., 12/102 Burnett Street, Buderim, QLD 4556, Australia
*
Author to whom correspondence should be addressed.
Sustainability 2022, 14(13), 8068; https://doi.org/10.3390/su14138068
Submission received: 16 May 2022 / Revised: 26 June 2022 / Accepted: 28 June 2022 / Published: 1 July 2022

Abstract

:
Building roofing produced with asbestos-containing materials is a significant concern due to its detrimental health hazard implications. Efficiently locating asbestos roofing is essential to proactively mitigate and manage potential health risks from this legacy building material. Several studies utilised remote sensing imagery and machine learning-based image classification methods for mapping roofs with asbestos-containing materials. However, there has not yet been a critical review of classification methods conducted in order to provide coherent guidance on the use of different remote sensing images and classification processes. This paper critically reviews the latest works on mapping asbestos roofs to identify the challenges and discuss possible solutions for improving the mapping process. A peer review of studies addressing asbestos roof mapping published from 2012 to 2022 was conducted to synthesise and evaluate the input imagery types and classification methods. Then, the significant challenges in the mapping process were identified, and possible solutions were suggested to address the identified challenges. The results showed that hyperspectral imagery classification with traditional pixel-based classifiers caused large omission errors. Classifying very-high-resolution multispectral imagery by adopting object-based methods improved the accuracy results of ACM roof identification; however, non-optimal segmentation parameters, inadequate training data in supervised methods, and analyst subjectivity in rule-based classifications were reported as significant challenges. While only one study investigated convolutional neural networks for asbestos roof mapping, other applications of remote sensing demonstrated promising results using deep-learning-based models. This paper suggests further studies on utilising Mask R-CNN segmentation and 3D-CNN classification in the conventional approaches and developing end-to-end deep semantic classification models to map roofs with asbestos-containing materials.

1. Introduction

Asbestos exposure remains a significant cause of death and health problems [1]. Preventing asbestos-related diseases such as asbestosis, mesothelioma, and lung cancer [2,3,4] is difficult because inadvertent exposure to unknown asbestos contaminations in buildings and the environment is unavoidable [5]. Moreover, asbestos-related diseases have a long latency and continuous disease progression after exposure, which may not be diagnosed early [6]. The release of airborne asbestos fibres can be caused by human activities that produce dust [7] (e.g., the maintenance, repair, and demolition of buildings with asbestos-containing materials (ACMs) and the unsafe disposal of waste) and degradation via environmental causes, such as acid rain [8]. Asbestos contamination, particularly in buildings, can remain in a wide area and cause infection to occupants and the surrounding neighbourhoods [9]. This highlights the significance of identifying ACMs in constructed buildings.
Despite the harmful effect of ACMs on human health and the environment, there are still many buildings with ACM roofs [10,11,12]. Due to their physical and chemical properties, such as poor heat conduction and tensile strength, ACMs were largely used in various contexts between the 1970s and 1990s; mainly residential and industrial roof coverings [13]. For example, in the United States, 62% of asbestos usage is in roofing compounds [14], and in Poland, 90% of ACMs are evaluated to be roof coverings [12]. While the use and production of ACMs has been banned in an increasing number of countries, the presence and impacts of existing ACM roofs must be identified and evaluated.
Mapping an accurate and up-to-date distribution of ACM roofs could lead to a decrease in the asbestos pollution of detected ACMs through the safe disposal of waste and an increase in occupants′ awareness of asbestos presence in their buildings [11]. Moreover, the accurate mapping of ACM roofs leads to efficient monitoring and management of changes in ACM roofs, supporting decision-making strategies and policies [10]. Estimating the quantity and concentration of ACM roofs is challenging and involves high uncertainty because of issues such as inspection barriers and inaccurate self-declarations [13]. Attempts have been made in this regard through various methods, such as the estimation of ACMs based on field inventory indicators of a particular area [15]; however, these methods are unreliable due to the high degree of uncertainty [13], and because they are expensive, time consuming, and labour intensive [12].
Remote sensing imagery (RSI) has proven to be efficient input data for detecting and mapping ACM roofs [16,17,18]. Optical remote sensing systems provide data on the Earth′s surface acquired from electromagnetic sensors in remote platforms (e.g., aircraft and satellites) [19]. Remote sensors capture different numbers of spectral bands, resulting in various imagery types. In the reviewed studies of ACM roof mapping, two RSI types are often utilised as the input data: (1) hyperspectral imagery (HSI) [13,20,21,22,23,24], which provides hundreds of narrow bands [25]; and (2) multispectral imagery (MSI) [10,11,12,26,27,28,29,30,31,32], which provides a few numbers of wider bands (e.g., blue, green, red, and near-infrared bands) and often has very high spatial resolution [33].
Providing rich spectral information has made HSI reliable input data to classify ACM roofs based on their spectral characteristics. While the use of HSI has shown success in achieving acceptable ACM roof classification accuracy, some challenges have made HSI unsuitable for wide-scale mapping of ACM roofs [12]. Due to the low resolution of early HSI, small ACM roofs could not be detected, causing a large omission error (OE) [13,20,21,22,23]. Moreover, using the optimal number of bands was a significant challenge due to the high dimensionality of HSI [23,24]. Non-optimal selection of bands could cause issues such as reducing classification accuracy (i.e., the curse of dimensionality) [34], inter-class confusion [35], and noisy maps [36] (see Section 5).
On the other hand, when extracting urban features such as ACM roofs, spatial image resolution is often more beneficial than spectral resolution [37]. In the past, multispectral images from satellite sensors mostly had lower spatial resolution than HSI from aerial sensors; however, MSI currently provides very high resolutions, is usually cheaper, and covers larger areas. The earlier medium-resolution images from satellites such as LANDSAT 7 were not fine enough to identify small roofs, thus decreasing the classification accuracy. With improvement in the resolution of satellite images, several researchers have studied very high-resolution (VHR) multispectral methods, such as WorldView-3 (WV-3) [11]. Given that some roofs are composed of different materials, different roofs exhibited similar spectral responses due to more details in VHR images [10,27,30,31]. With the finer resolution of VHR images, the variability among different roofs increases, causing confusion among roof classes and a salt-and-pepper result [10].
Given the problems with input data, several studies have focused on classification methods and techniques to improve the process of ACM roof mapping. In the reviewed studies of ACM roof mapping, three approaches were adopted: (1) pixel-based image analysis (PBIA), (2) object-based image analysis (OBIA), and (3) a deep-learning-based approach (DL). In PBIA methods, individual pixels are the analysis units, which are classified based on spectral values without considering the spatial and contextual information [38]. On the other hand, in OBIA methods, pixels are grouped in segments (also known as objects), and the objects produced are analysed based on spectral, spatial, and contextual information [39]. As a more sophisticated approach to image processing, DL methods are capable of automatic extraction of features directly from images by adding hidden layers to the conventional machine learning classifiers [40].
While the appropriate adoption of the classification methods could address the problems with input images, several challenges remained in the classification process (see Section 5). For example, the OBIA methods showed good performance in handling the high dimensionality problems in PBIA methods; however, adopting non-optimised segmentation parameters caused mixed objects and low classification accuracy. Moreover, inadequate training data in supervised methods [41,42] and analysts’ subjectivity in rule-based classifications [43,44,45,46] were major challenges in the ACM roof mapping studies. Several attempts have been made to address the noted challenges. Using multisource images [30,32], segmentation optimisation techniques [47], and advanced non-parametric classifiers [48] have shown good enhancement in the reviewed studies. Moreover, further research on methods such as DL-based semantic segmentation adopted in other remote sensing applications [49] could improve the ACM roof mapping process. An in-depth exploration of the state-of-the-art studies of ACM roof mapping assists in better understanding the challenges in the mapping process and highlighting the possible strategies to address them. To date, no previous research has comprehensively reviewed studies on mapping ACM roofs.
This paper reviews the state-of-the-art studies of ACM roof mapping and synthesises the challenges and opportunities for enhancing the mapping performance. The research studies the current matters associated with input imagery and classification methods in order to identify the priorities in future research. In particular, this review study summarises, synthesises, and evaluates the ACM roof mapping studies in terms of (1) input imagery type, sensor attributes, image resolutions, and non-technical factors such as cost and availability of the data; (2) image classification process, classification accuracies, classifiers performances, segmentation methods, training data in supervised methods, and computational requirements. Due to the adoption of different RSI and image classification methods, it was difficult to compare and evaluate the ACM studies using quantitative analysis methods. Moreover, the study areas consist of different characteristics, such as topography, geometry, and condition of roofs, which was not comparable. In regards to study selection for this review, almost all research prior to 2012 was limited to small study areas, often urban blocks with flat topography; additionally, wide-scale mapping over different sites such as rural places was conducted in a few areas [20,21,22]. Moreover, the low resolution of earlier RSI resulted in a rough classification of roofing materials [50], and previous works were not consistent when reporting achieved accuracies [12]. Hence, this paper focused on peer-reviewed journal articles from 2012 to 2022.
The ACM roof mapping procedure of the reviewed studies includes three main steps (see Figure 1): preprocessing, feature engineering, and image classification. The preprocessing stage consists of subtasks to prepare input data for the subsequent steps. At this stage, the input data may be corrected, denoised, synchronised, or fused with other RSI to develop an appropriate version of the original data. In the next stage, the features (i.e., the sets of RSI information) are determined by subtasks such as feature selection, extraction, and transformation. This step provides relevant information for the classification process by reducing the dimensionality of the RSI data. The last stage is image classification, where pixels are labelled to roof classes (e.g., ACM roof). The mathematical classification model is developed based on training data in supervised methods or analysts’ knowledge in expert system methods [49].
The review paper is structured to cover all stages of the ACM roof mapping procedure in the targeted studies. Firstly, the various types of RSI used in the literature, including HSI, MSI, and the fusion of RSI, are explained, and the preprocessing methods are discussed in detail. Secondly, the feature engineering and classification methods are explained based on their classifying approaches, including pixel based, object based, and deep learning classification techniques. Based on the conventional procedure of ACM roof mapping, the challenges affecting the accuracy results of the studies are extracted and synthesised in tabular structures. Then, the challenges are studied in other applications of RSI and image classification to identify possible solutions for enhancing the ACM roof mapping process and accuracy results.

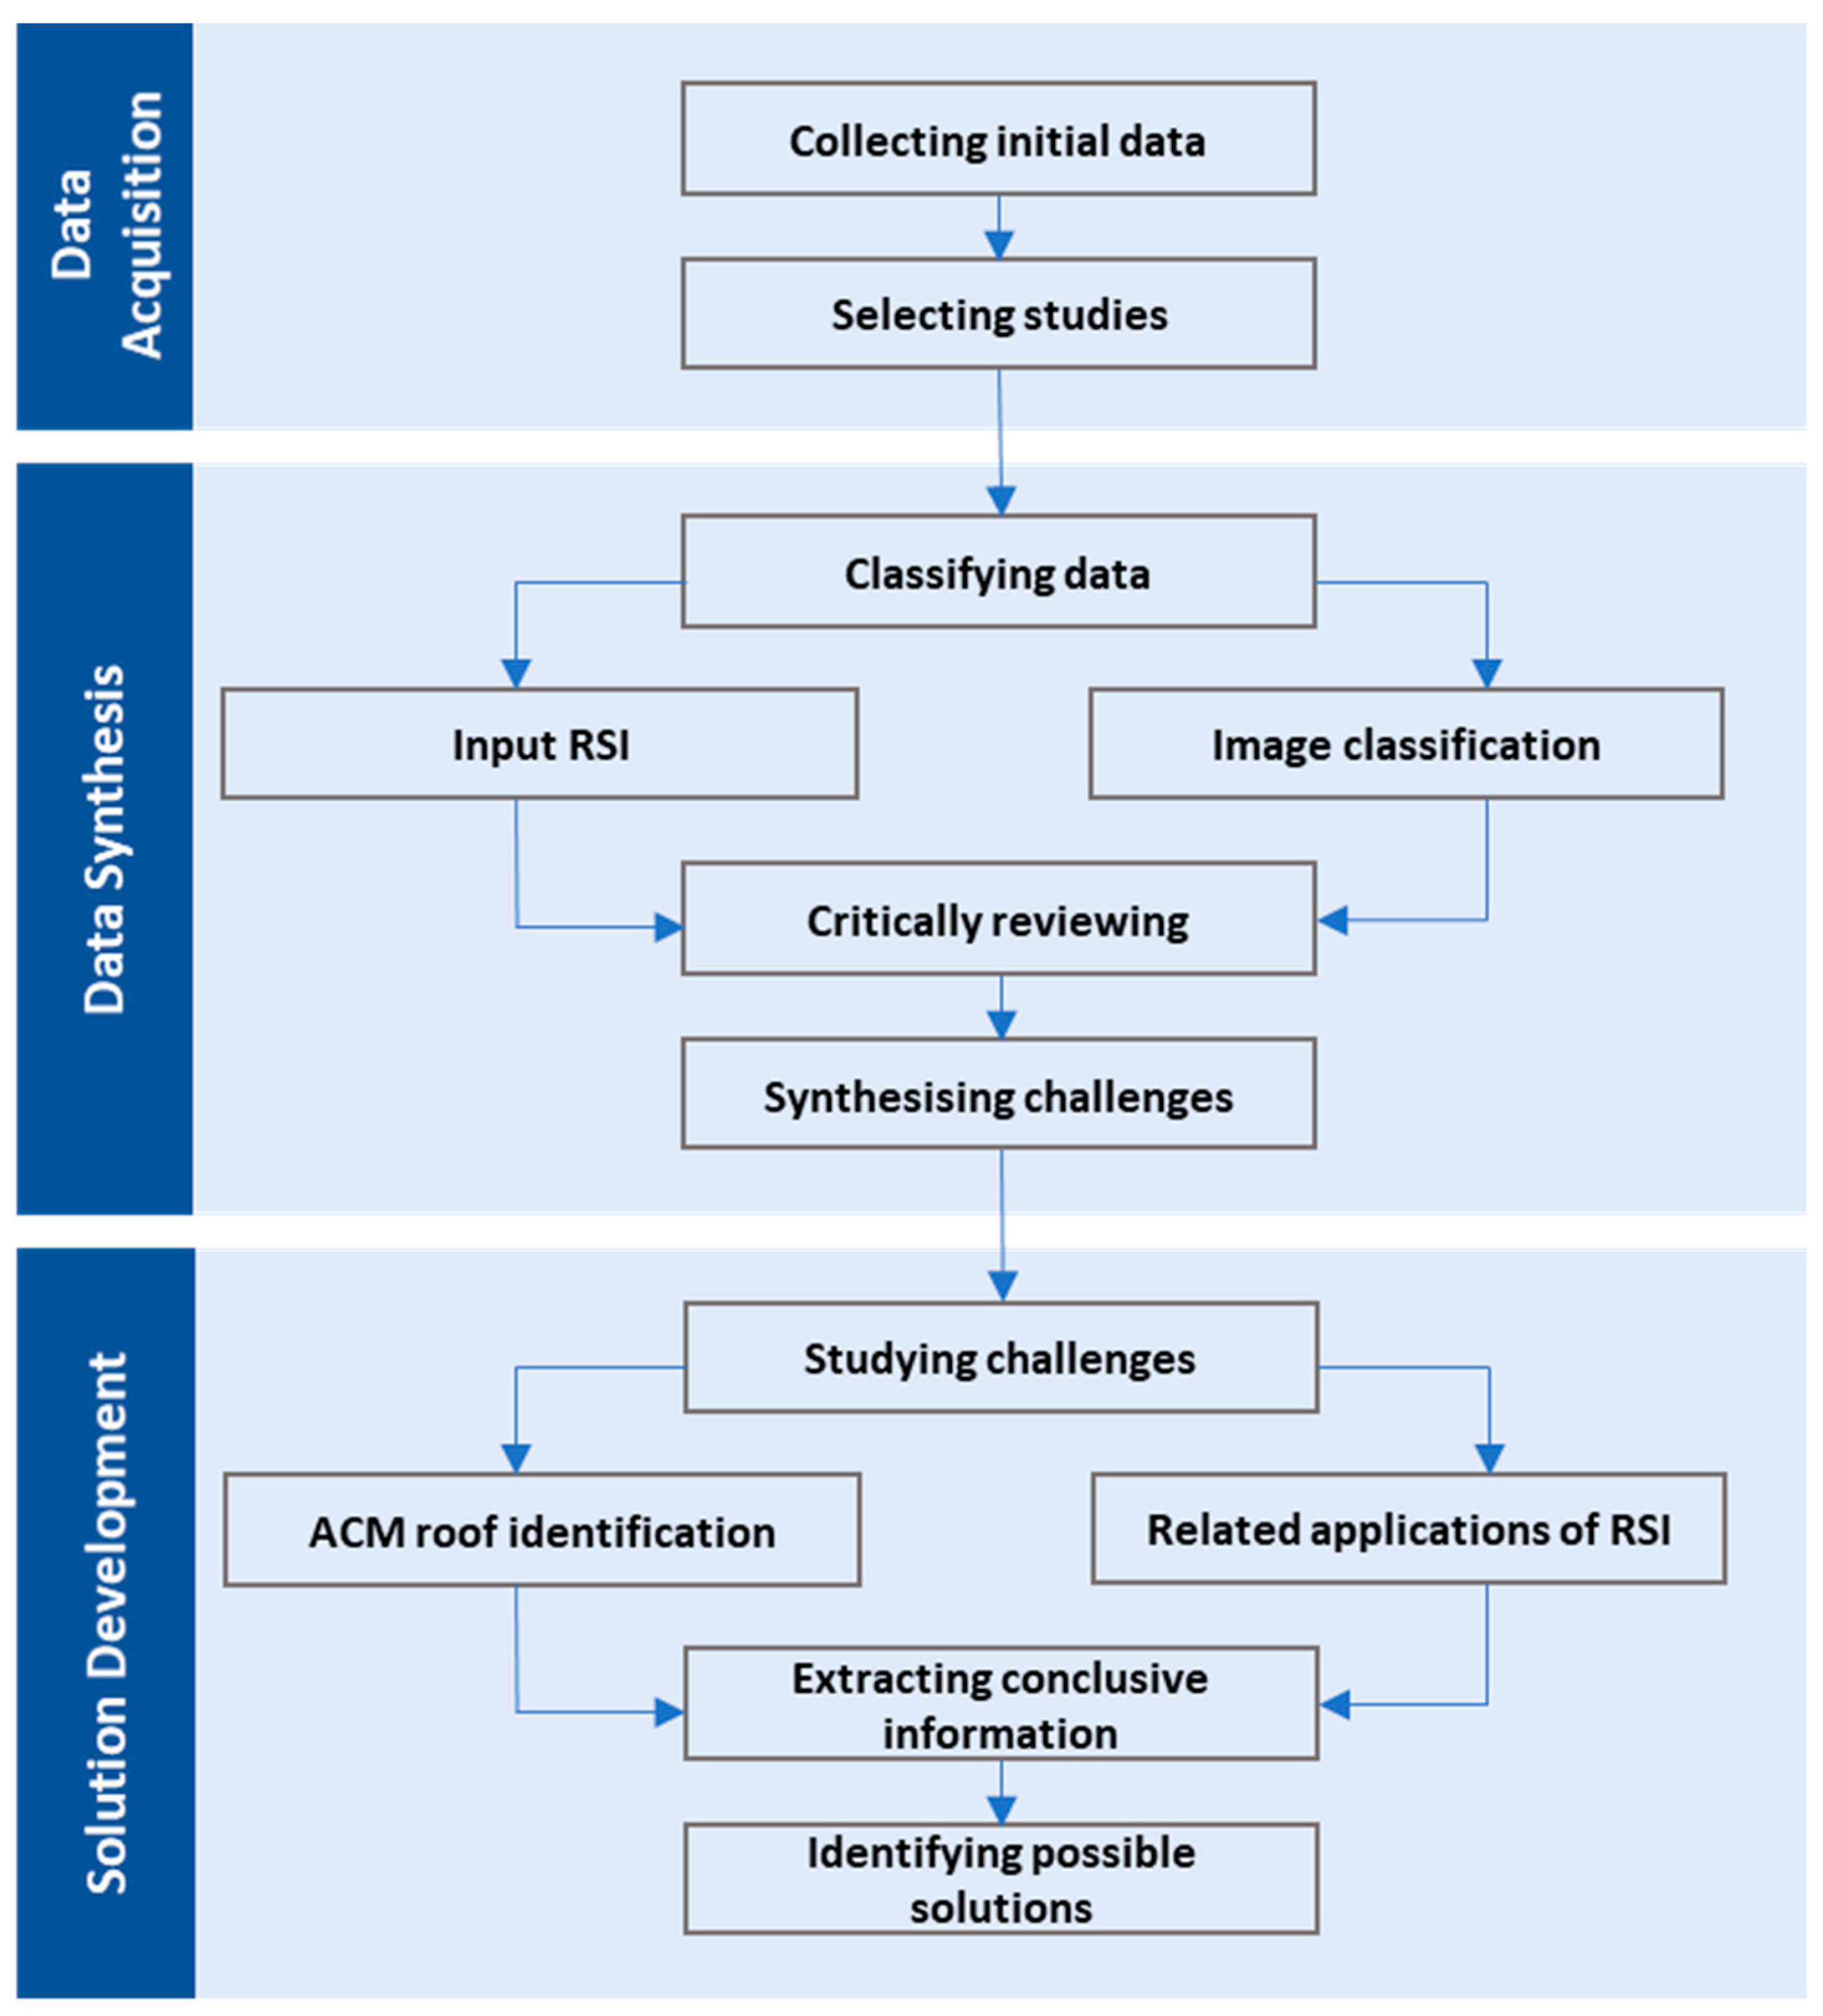
2. Materials and Methods

Ref. [51] defined the characteristics of state-of-the-art review by comparing the HSI type of review with the other common review types using the Search, Appraisal, Synthesis, and Analysis (SALSA) analytical framework. For this review, no formal quality assessment and predefined method (e.g., systematic review) were considered to collect and analyse the sources [51]. Due to the non-numerical nature of the input data, a qualitative research design approach was adopted to structure the paper. The identified challenges [10,11,13,16,20,21,22,23,26,27,28,30,31] are narratively synthesised and presented in Section 5.
As shown in Figure 2, the study was designed in three stages: (1) data acquisition, (2) data synthesis, and (3) solution development. In the first stage, the search was conducted within Scopus, ScienceDirect, and Google Scholar; then, the target studies were selected based on criteria noted in Section 2.1. In the second stage, selected sources were summarised and grouped based on the input RSI (i.e., HSI, MSI, and multisource data) and the image classification approach (i.e., PBIA, OBIA, and DL). In the third stage, the studies were critically reviewed to identify challenges affecting the ACM roof mapping process and classification accuracy results. Finally, the synthesised challenges were studied in reviewed sources and other applications of RSI (e.g., object detection in urban areas) to develop possible strategies to address the ACM roof identification challenges.

2.1. Data Acquisition

The targeted sources for reviewing mainly originate from two categories of RSI applications: (1) ACM roof identification, or (2) roof classification with at least one ACM roof class. Data for the review were initially gathered from related research satisfying the following three criteria: (1) studied the identification of ACM roofs or studied roof classification with at least one ACM class, (2) used at least one type of RSI, and (3) used machine learning methods in the classification process.
Peer-reviewed journal articles and conference papers from 2012 onwards were extracted from the collected sources in the initial search. ACM roof identification studies prior to 2012 were often conducted on small study samples and mainly included flat urban areas [24,52]. Moreover, the input data had a low spatial resolution (e.g., more than 5 m), causing the problem of mixed pixels in urban studies [36,53,54]. Hence, focusing on the peer-reviewed research of the past ten years is considered appropriate for studying the recent findings of ACM roof identification. The searched databases were Scopus, ScienceDirect, Google Scholar, and some high-impact journals such as Remote Sensing of Environment, the ISPRS Journal of Photogrammetry and Remote Sensing, IEEE Transactions on Geoscience and Remote Sensing, and the International Journal of Remote Sensing.

2.2. Data Analysis

Accuracy assessment indicates the performance of a classification process by calculating (1) user accuracy (UA), showing the omission error (OE), where pixels are incorrectly classified as a labelled class; (2) producer accuracy (PA), which represents the probability that a particular pixel of an area on the ground is classified as such, and also allows calculating commission error (CE); and (3) overall accuracy (OA) represents the percentage of total pixels correctly classified [33]. As shown in Figure 1, the process of ACM roof identification includes different stages that could be performed by various methods, techniques, and tools. ACM roof mapping studies have used numerous remote sensing data, feature engineering methods and machine learning classification algorithms [28,29,32]. The accuracy assessment of ACM classes is thus affected by different attributes of RSI data and the various factors used in the mapping procedures [55,56]. Hence, it may be inappropriate to compare the accuracy results in quantitative analysis. In other words, comparing the percentage-based accuracies of the works might be inconclusive in terms of determining the most effective methods and techniques of ACM roof mapping. Moreover, other contributing factors, such as the available RSI data, the research cost, and the researchers′ expertise, affect the mapping accuracy results.
Given the unmeasurable factors in the ACM roof mapping process, a qualitative approach was adopted to review, synthesise, and discuss the conducted works. First, a summary of each selected ACM roof mapping study is provided; then, all studies are grouped based on their input imagery data and classification methods. Second, each study is critically reviewed in terms of RSI attributes, image processing, feature extraction, classification method, and the accuracy or presence of errors in the mapping results. The major challenges affecting the mapping process are determined, and sources are compared to identify the common challenges. Then, the results are narratively synthesised, and their general themes are evaluated in both the reviewed studies and other closely related applications of RSI. The conclusive information is discussed to develop strategies associated with input RSI, image fusion and processing, feature engineering, and the classification process. Moreover, further avenues of study are recommended by reviewing several successful applications of image classification in urban studies.

3. Input Data for ACM Roof Classification

Satellite and aerial sensors provide a wide array of remote sensing data (i.e., optical, LiDAR, and synthetic aperture radar images), differing in spatial, spectral, and radiometric resolution. RSI provides useful data for classifying different surfaces on the earth. The first remote sensing studies attempted to map aggregated land-cover classes—for example, forests and artificial surfaces—and, later, change the detection of land-cover land use [57]. The evolution of remote sensing systems over the past 30–40 years has led several studies to focus on roof classification, particularly ACM roof mapping.
In studies of ACM roof mapping, various types of hyperspectral data, multispectral data, and their fusion with auxiliary data have been used as the input data. The first studies investigated detection of ACM roofs based on spectral features without considering the pixel sizes of images [20,21,22,23]. Due to issues such as mixed pixels caused by the low spatial resolution of the images acquired from early hyperspectral sensors, these studies did not generate a consistent accuracy result. However, with advancements in the features of hyperspectral sensors, a number of studies have demonstrated acceptable classification accuracy of ACM roofs [58]. Furthermore, other studies have focused on the use of a combination of bands from multispectral images [10,11,12,31]. While these studies reported acceptable accuracy results, issues such as spectral confusion affected the mapping process of ACM roofs. However, the fusion of different image types, such as the combination of multispectral and LiDAR images [30,32], significantly improved the accuracy results of ACM roof mapping. From the different results gained by using various remote sensing data types, it can be concluded that there is no fit-for-all input data to obtain an acceptable ACM roof accuracy result.
Different image types are used due to the various features that each RSI type can provide. Selection of the input data requires prior knowledge of the quality and adequacy of RSI and corresponding sensors. RSI types have common characteristics despite the different resolutions of RSI types. First, they are geolocated, which means that each pixel of an image corresponds to a spatial coordinate. This facilitates the fusion of multiple spatial and non-spatial sources with a single pixel or a segment of the image [37]. Second, remote sensing images are geodetic measurements that provide accurate estimates of geoparameters. This allows the utilised images to provide geophysical quantities through detection or classification processes. On the other hand, remote sensing images differ in their attributes and contents. For instance, while multispectral infrared visible imaging spectrometer (MIVIS) images are rich in hyperspectral bands, most satellite sensors provide a limited number of spectral bands but wide area coverage.
Therefore, selecting the required imagery types and their processing architecture is a trade-off between multiple factors. While the image resolution (i.e., spatial, spectral, temporal, and radiometric) is a key factor, other factors such as cost and the availability of data [22] play a role in selecting the required imagery type. Moreover, potential challenges should be considered when gathering the input data. For example, there are generally errors in roof classification due to some independent factors affecting the OA of the classification [23]. These errors may be caused by the diverse colour of ACM roof coverings exposed to U.V. radiation, decreased homogeneity of the surface due to mixed materials, or different geometrical shapes resulting in different lighting effects [29]. In this regard, adopting multisource RSI by combining the input RSI with other auxiliary data could improve the classification accuracy results. Using LiDAR data acquired from active sensors has shown the enhanced performance of the conventional classification methods [30,32]. Despite the advantages of RSI’s rich content, “big data” are a challenge, requiring the process architecture and classification algorithms to be efficient and fast enough to handle the massive volume of remote sensing data [37]. While this issue could be unavoidable, DL-based architectures perform better than PIBA and OBIA methods when extracting features from large datasets [37,49]. Moreover, attempts have been made to design lightweight and compact classification models, which could significantly assist in handling the challenges of large volume and complexity of remote sensing data [59,60].

3.1. Hyperspectral Imagery (HSI)

HSI has been widely used in studies of ACM roof mapping. Hyperspectral systems generally record more than 20 to 1000 bands and are generally acquired by airborne platforms [25]. Furthermore, hyperspectral systems provide images with both high spatial and spectral resolutions, making them efficient input data for ACM studies [24]. In fact, HSI from aerial sensors represents the spectral heterogeneity of roof classes as well as provides very high spatial resolution [52]. Thus, several studies have focused on the single use of spectral data to investigate the efficiency of HSI itself or compare the OA gained by different classifiers [13,20,21,22,23,24]. Table 1 provides a summary of studies associated with ACM roof classification using airborne HSI.
The early HSI used for ACM mapping did not provide adequate spatial resolution to classify small roofs. While sensors such as MIVIS were rich in hyperspectral data, they led to significant omission errors (OEs) of ACM roofs with a small surface [12]. Fiumi et al. (2012) [20] used MIVIS images with a spatial resolution of 4 × 4 m, including 102 spectral channels ranging between 0.433 and 12.70 μm. The Spectral Angle Mapper (SAM) algorithm was adopted to classify HSI using ENVI software. Moreover, the error caused by the atmosphere layer between the sensor and the earth′s surface was corrected using the international average relative reflectance radiometric calibration method. While a high classification accuracy was reported, identified roofs had large areas with an average roof area of around 1200 m2. As the accuracy will increase when the average roof area increases [53], the results of this study may not be inconsistent.
Large OE of ACM roofs was reported in the other studies in which the OA was acceptable. Frassy et al. (2014) [22] worked on the quantitative mapping of roofs with asbestos cement (AC) covering a large region in Italy. The 102-channel MIVIS data with different pixel resolutions from 4 m to 9 m were classified using the SAM algorithm. Concerning AC roof units, while the result revealed a small commission error with less than 10% misclassification (false positives), the OE was quite large. Approximately 50% of the ACM roofs were not identified with the MIVIS images (false negatives) and thus were omitted in the thematic map. As a result, only 43% of the ACM roofs were correctly mapped considering the roof units, despite the OA of the roofs′ surface being approximately 80%.
To detect ACM roof units, Frassy et al. (2014) [22] suggested that a window of 3 × 3 pixels is a threshold for classifying an individual ACM roof. For example, using MIVIS images with a 4 m spatial resolution, only roof units with an area of at least 144 m2 (RSLT144) are detected with reasonable confidence. Computing statistics for RSLT144 led to significant improvements in the classification results of another independent study by [20]. They reported that OA increased from 43% to 75%, and OE decreased from 48% to 19% for the entire dataset. The study indicated that the spatial resolution of images was the main source of errors, while the topographic features of the area did not significantly affect the accuracy of roof classification results.
Another issue with HSI in early studies was that the single use of spectral data was not practical for discriminating ACM roofs with complex geometry. Other than flat roofs, numerous forms of ACMs roofs (e.g., vaulted and pitched typologies) have geometry that reflects complex patterns captured by sensors. With particular attention to the various forms, Fiumi et al. (2014) [21] utilised MIVIS images with 3 m spatial resolution and 102 spectral channels to investigate the mapping of AC roofs over the Lazio Region in Italy. The results indicated that while the SAM classifier failed to accurately discriminate ACM roofs, during an additional process using the minimum bounding algorithm, only 63% of vaulted ACM roofs and 71% of pitched ones were classified accurately. However, using HSI of these roof typologies has been less investigated in ACM roof mapping studies despite the low accuracies resulting from the complex relationship between a light source and a roof-covering geometry [21].
The mixed spectral reflectance caused by complex geometry shapes was also reported as a source of error. Szabo et al. (2014) [23] used AISA Eagle II images with the spatial resolution of 1 m and 126 spectral bands over the 7 km2 area of Debrecen, East Hungary. The original HSI dataset was denoised using the maximum noise fraction (MNF) transformation, and a new dataset was created. The original HSI and the MNF-transformed dataset were classified by the SAM, support vector machine (SVM), and maximum likelihood (ML) algorithms. While the classification details of ACM roofs were not provided in the study, SVM performed best for both datasets with an OA of around 80% [23].
With the advancement of hyperspectral sensors, several studies have reported significant improvement in the classification accuracy of ACM roofs. Recent aerial sensors could provide both high spectral and high spatial resolution. Hamedianfar et al. (2014) [24] worked on two subsets of HSI by combining a data mining (DM) method with object-based image analysis (OBIA) to classify the urban surface materials of the study areas. One of the datasets provided 20 spectral bands with a 1 m spatial resolution, and the other provided 102 spectral bands with 0.68 m pixel sizes. An OA of 93.42% was achieved by one of the subsets with a PA and UA of 100% for asbestos roofs. Cilia et al. (2015) [13] also reported acceptable results of deploying MIVIS images with 102 channels classified by SAM algorithm. An average UA of 89% and PA of 86% was achieved for the ACM class, which indicated a reliable result of using HSI in roof mapping studies [11].
However, despite the advantages of using HSI, some limiting factors for accurately classifying ACM roofs exist. The high dimensionality of hyperspectral data can adversely affect the accuracy of the classification process. Traditional classification algorithms generally do not perform well due to the massive volume of spectral data [52]. The intrinsic dimensionality of the original data must usually be compressed, and the maximum amount of information should be preserved for classification. This is due to the traditional algorithms′ limited capabilities to perform in large dimensional spaces. In particular, the selection of bands, wavelengths, and an optimal resolution of hyperspectral data is a challenging task in the classification process [28,29]. Moreover, the scene features could cause challenges. The mixed materials of roof coverings or the near homogeneity of spectral data [32], different materials in parts of the roofs, and different colours of aged roofs [16] could cause spectral confusion in the classification of roofs [13]. Given the issues with hyperspectral data, other studies have investigated different remote sensing paradigms for ACM roof mapping.

3.2. Multispectral Imagery (MSI)

Several studies have indicated the possibility of using MSI for mapping ACM roofs. MSI commonly comprises remote sensing images with spectral bands of 2 to 13 (i.e., Sentinel-2). The number of bands is the main difference between MSI and HSI, despite their similar 3D structure [49]. MSI acquired by space-born sensors provides a broader coverage area [11] and cheaper cost [10] in comparison with airborne hyperspectral sensors, which have limited coverage and availability. Furthermore, although HSI usually provides both higher spatial and higher spectral resolution [11], the use of MSI could address the problems with HSI, such as high dimensionality and different noises caused by the large number of bands [27]. Hence, many ACM roof mapping studies have focused on MSI and its fusion with other remote sensing data. Table 2 provides a summary of studies that adopted MSI in ACM roof mapping.
In the reviewed studies of ACM roof mapping, very-high-resolution MSI from space-borne sensors is mostly used as the input data. Among the MSI categories based on the spatial resolution (i.e., coarse, medium, and high spatial resolution data) [13], images with a spatial resolution of more than five meters are usually inappropriate for urban studies due to the problem of mixed pixels [56]. When the pixel size is bigger than a roof unit, the pixel of the ACM roof mixes with the pixels of the surrounding roof units or other objects, causing salt-and-pepper errors [57]. WorldView-2 (WV-2) images with eight multispectral bands (2 m spatial resolution) and a panchromatic band (0.5 m resolution) are considered to be appropriate input data for ACM roof mapping [10,27,28,29,30,31]. Moreover, since the launch of the WorldView-3 (WV-3) satellite in 2014, images with finer resolution (eight bands with a 1.24 m resolution and a 0.3 m-resolution panchromatic band) have been used in the studies of ACM roof mapping [32].
Multispectral data from aerial imagery have also been used for ACM roof mapping. While the input data used in the literature stemmed primarily from satellite sensors, airborne MSI provides higher resolution than satellite images. However, aerial images may not be available for the areas under study and have limited coverage compared with images acquired from satellite images. Krówczyńska et al. (2020) [12] used two sets of aerial images in natural colour (RGB) and colour infrared (CIR) to identify AC roofs in Chęciny, Poland. As one of the few studies of ACM roof mapping, the work investigated a deep learning algorithm, namely the convolutional neural network (CNN). The classification results revealed a PA of 89% and an OA of more than 87% for both datasets. However, the proposed method may not successfully classify roofs in dense urban areas, although it yielded acceptable results for rural areas. Furthermore, the trained database could not be transferable to other study areas, and studying different areas required the creation of newly trained databases.
Attempts have been made to achieve the autonomous identification of ACM roofs using MSI. Tommasini et al. (2019) [11] worked on autonomous identification of ACM roofs over a metropolitan area in Prato (Italy) using a tool in QGIS software. WV-3 images were used as the input data, and the classification result was reasonably good, with only some false positives and negatives. Although this study illustrated a proper tool for automatically identifying asbestos, preprocessing images (i.e., pan sharpening) required a non-automatic process. The preprocessing of MSI, mostly pan sharpening, is a significant factor in improving the resolution of images by combining required bands.

3.2.1. Pan Sharpening of Satellite Imagery

For extracting land-cover information (e.g., roofs with ACM coverings), spatial resolution is considered a key factor. Images with finer spatial resolutions are more valuable than those with a higher spectral resolution [11]. The pan sharpening method is commonly applied to improve multispectral bands′ spatial resolution by combining them with panchromatic (PAN) images. The reason is that the spatial resolution of multispectral images is lower than panchromatic images of the same scenes acquired by the same satellite sensor [61,62]. Therefore, while multispectral bands provide the required spectral content for discriminating roof covers, their fusion with PAN images of the same scenes improves the spatial resolution of the input dataset, resulting in a more accurate description of roof textures and shapes [63].
The pan sharpening method has been widely used to improve the classification accuracy of ACM roof classes in studies of roofing material identification. Abriha et al. (2018) [31] conducted a study on WV-2 to identify roof materials and investigate the potential efficiency of pan sharpening. By adopting pan sharpening with the Gram–Schmidt method, the panchromatic band (450–800 nm) with a 0.5 m resolution was fused with the lower resolution multispectral bands with a 2 m geometric resolution. The roof materials were divided into three and six roof classes (asbestos, brown tile, and red tile); the data were then divided into shadowed and sunny roof parts and classified by discriminant function analysis (DFA) and random forest (RF) classifiers. The results revealed that while the OA was above 85%, asbestos was classified with more than 95% accuracy and identified successfully with all classifiers.
On the other hand, the classifier adapted for pan-sharpened images plays a significant role in increasing the classification accuracy. While the accuracy of classified ACM roofs increases with pan sharpening, some image processing techniques and classification algorithms work more efficiently with pan-sharpened images [64]. To evaluate the accuracy results of different classifiers on pan-sharpened WV-2 images, Gibril et al. (2017) [10] employed both supervised classifiers and a rule set combined with the Taguchi optimisation technique. The supervised classifiers showed some misclassifications between ACM roofs and spectrally similar materials, while some classifiers provided acceptable results. On the other hand, combining the rule-based OBIA method with the Taguchi technique showed a high overall accuracy of around 90% and 93% for two pan-sharpened WV-2 datasets.

3.2.2. Fusion of MSI with Light Detection and Ranging (LiDAR)

The fusion of MSI with 3D point cloud data from LiDAR sensors has shown significant enhancement in ACM roof classification results [30,32]. LiDAR provides 3D topographic information of surveyed areas on the Earth′s surface. These sensors do not provide information on the lighting colour and intensity of the surface, but the depth measurement offers information to extract 3D building information and the features of roof shapes. In fact, LiDAR sensors are insensitive to lighting conditions and are unaffected by shadows or poor lighting intensity [65]. While 2D planimetric multispectral data could be affected by factors such as poor contrast, skewed image perspectives, and shadows [66], the fusion of MSI with LiDAR data could not only provide 3D measurements of ACM roof shapes, but could also address the lighting condition problems affecting 2D data.
Using multisource images, moreover, could result in assessing the roof surfaces′ details. Norman et al. [32] utilised the combination of WV-3 with LiDAR data to map detailed roof surfaces and evaluate the condition of the covering materials. The results reported a high OA of roof detection and analysed the degradation status of detected roofs. While the layer stacking method for the combination of WV-3 and LiDAR data resulted in an OA of 87%, another tested fusion method, namely principal components spectral sharpening, was not efficient enough, resulting in only 43% OA. Hence, while multisource images could enhance the mapping performance, the fusion method used in the process could significantly affect the results.
Furthermore, the algorithms and techniques adopted in the classification phase are key factors in improving ACM roof mapping accuracy. Hamedianfar et al. (2014) [30] studied the combination of WV-2 and LiDAR for detailed urban mapping. The study used different pixel-based classifiers and developed a ruleset to evaluate the results of the classification methods. The pixel-based classifier provided lower-accuracy results than rule-based classification methods with the same multisource images of the studied area. Furthermore, while pixel-based classifiers resulted in mixed pixels and a salt-and-pepper effect, using fused images significantly improved classification results by decreasing the spectral variation and spatial heterogeneities of intra-urban classes. This indicates that while the input data and preprocessing image method are important, the accuracy of the mapping process also depends on the classification methods and techniques.

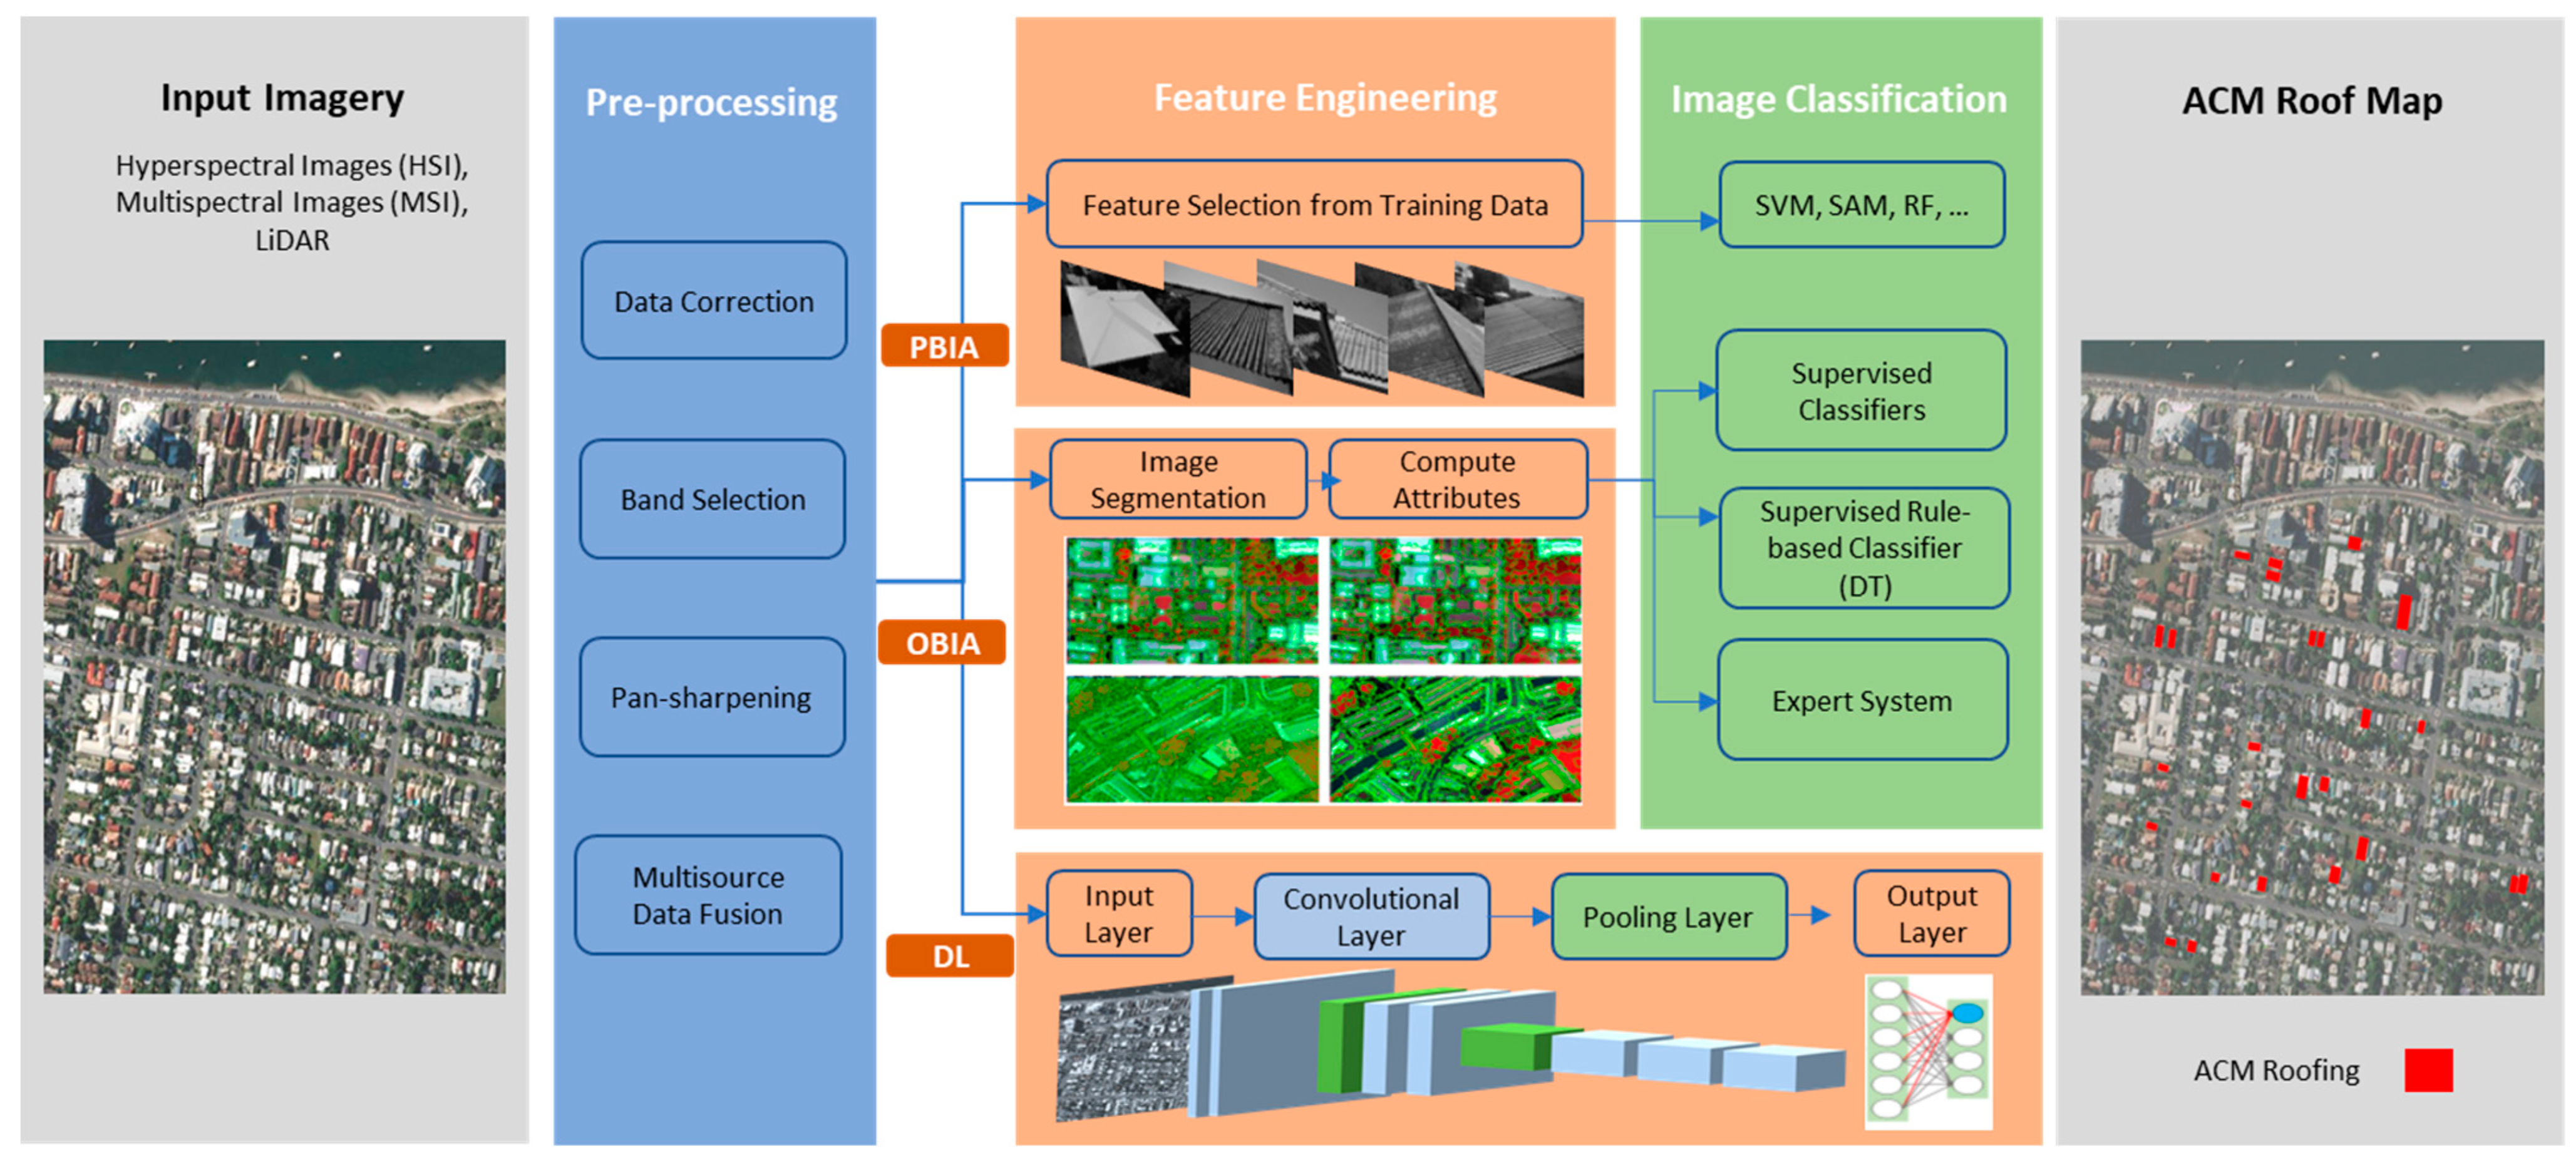
4. Classification Methods of ACM Roof Mapping

This section reviews the image processing tasks performed to map ACM roofs. The targeted studies are categorised based on the adopted image classification approaches and critically reviewed in terms of deployed classifiers and their accuracy assessment results.

4.1. Pixel-Based Image Analysis (PBIA) Approach

Early studies on mapping ACM roofs adopted the PBIA approach [13,20,21,22,23], which relies on a basic image processing concept developed in the 1970s [38]. Pixel-based methods analyse spectral information on individual pixels. In traditional PBIA methods, pixels are labelled to a predefined class by comparing the similarity of spectral values (i.e., spectral signature). In particular, RSI is classified by conducting spectral pattern recognition, a category of image classification that uses the pixel-by-pixel spectral features as the basis of image processing [39], wherein no spatial patterns and contextual information are employed in the classification process.
Selecting a suitable classifier is a challenging task in per-pixel spectral-based image classification [67]. Uncertainty often exists in identifying the appropriate classification algorithm because multiple factors, such as the type of input data, as well as the size and quality of training data, should be considered when comparing the available methods [68]. Several ACM roof mapping studies have thus used different algorithms for pixel-based classification of the images. While several ACM mapping studies have utilised the SAM classifier [20,21,22], other studies have obtained the best results from classifiers such as DFA and RF [13,31]. Moreover, few studies have attempted to classify the same subset of input data by using different classifiers. For example, Szabo et al. (2014) [23] tested the SAM, SVM, and ML algorithms for mapping asbestos roofs. According to the results, SVM had the highest OA (79.9%) and SAM had the lowest OA (59.9%). Li et al. (2010) [69] claimed that SVM is a suitable classifier for classifying impervious surfaces, while the SAM algorithm exhibits a better performance when an adequate amount of training data are available. Therefore, it is difficult to define a fit-for-all algorithm for classifying ACM roofs. Table 3 summarises the PBIA studies of ACM roof mapping.
As explained in Section 3.1, the pixel size of the images in early studies was not fine enough for one to identify roof units in an image [22,23]. As indicated by [70], a 4 m wide object requires a minimum spatial resolution of 2 × 2 m (i.e., a minimum of four pixels is required). Consequently, the spatial resolution of the image must be at least half the size of the smallest roof unit. However, this does not align with the real-world location of roof units over image pixels [71]. For example, an object with a 4 m length and width is unlikely to fit perfectly over four pixels with a 2 m spatial resolution [72]. Frassy et al. (2014) [22] indicated that 3 × 3 image pixels are a threshold for optimal detection of ACM roof units. Considering this assumption, when the remotely sensed image has a 4 m spatial resolution, only roofs larger than 144 m2 will be detected with reasonable confidence, as illustrated in Figure 3.
On the other hand, with the improvement of RSI resolution, the per-pixel spectral-based method was no longer effective for classifying ACM roofs. Several features on the Earth′s surface are composed of materials that may show similar spectral responses when using high-resolution data [72]. By deploying very high-resolution RSI, the spectral responses of some roofing classes in urban areas showed complex patterns [73]. This affects the accuracy results of image classification because of the increasing intra-class variability of classes. The use of the PBIA approach with traditional classifiers led to unreliable classification results because it works on only spectral information without considering the spatial patterns of roofs [74]. Hence, due to the issues such as confusion among classes, adopting traditional pixel-based classifiers may not be efficient for classifying very high-resolution images [30].

4.2. Object-Based Image Analysis (OBIA) Approach

Taking into account the limitations associated with PBIA (refer to Section 4.1), object-based image analysis (OBIA) has emerged as a more sophisticated approach, classifying images with a high spatial resolution by analysing both spatial and spectral features of RSI [75]. In OBIA methods, images are segmented at multiple scales, the analysis units rather than pixels [76,77,78]. Segmented pixels (also known as objects) are contiguous homogenous pixels grouped by similar attributes. In OBIA methods, when objects are created, segments′ attributes are computed, and a number of rules are developed for classifying features. These rules assist the classification process using attributes such as texture, size, and geometry (area and length) [26]. Several ACM roof mapping studies utilised OBIA methods using different RSI data. Table 4 summarises the studies that have used OBIA methods.

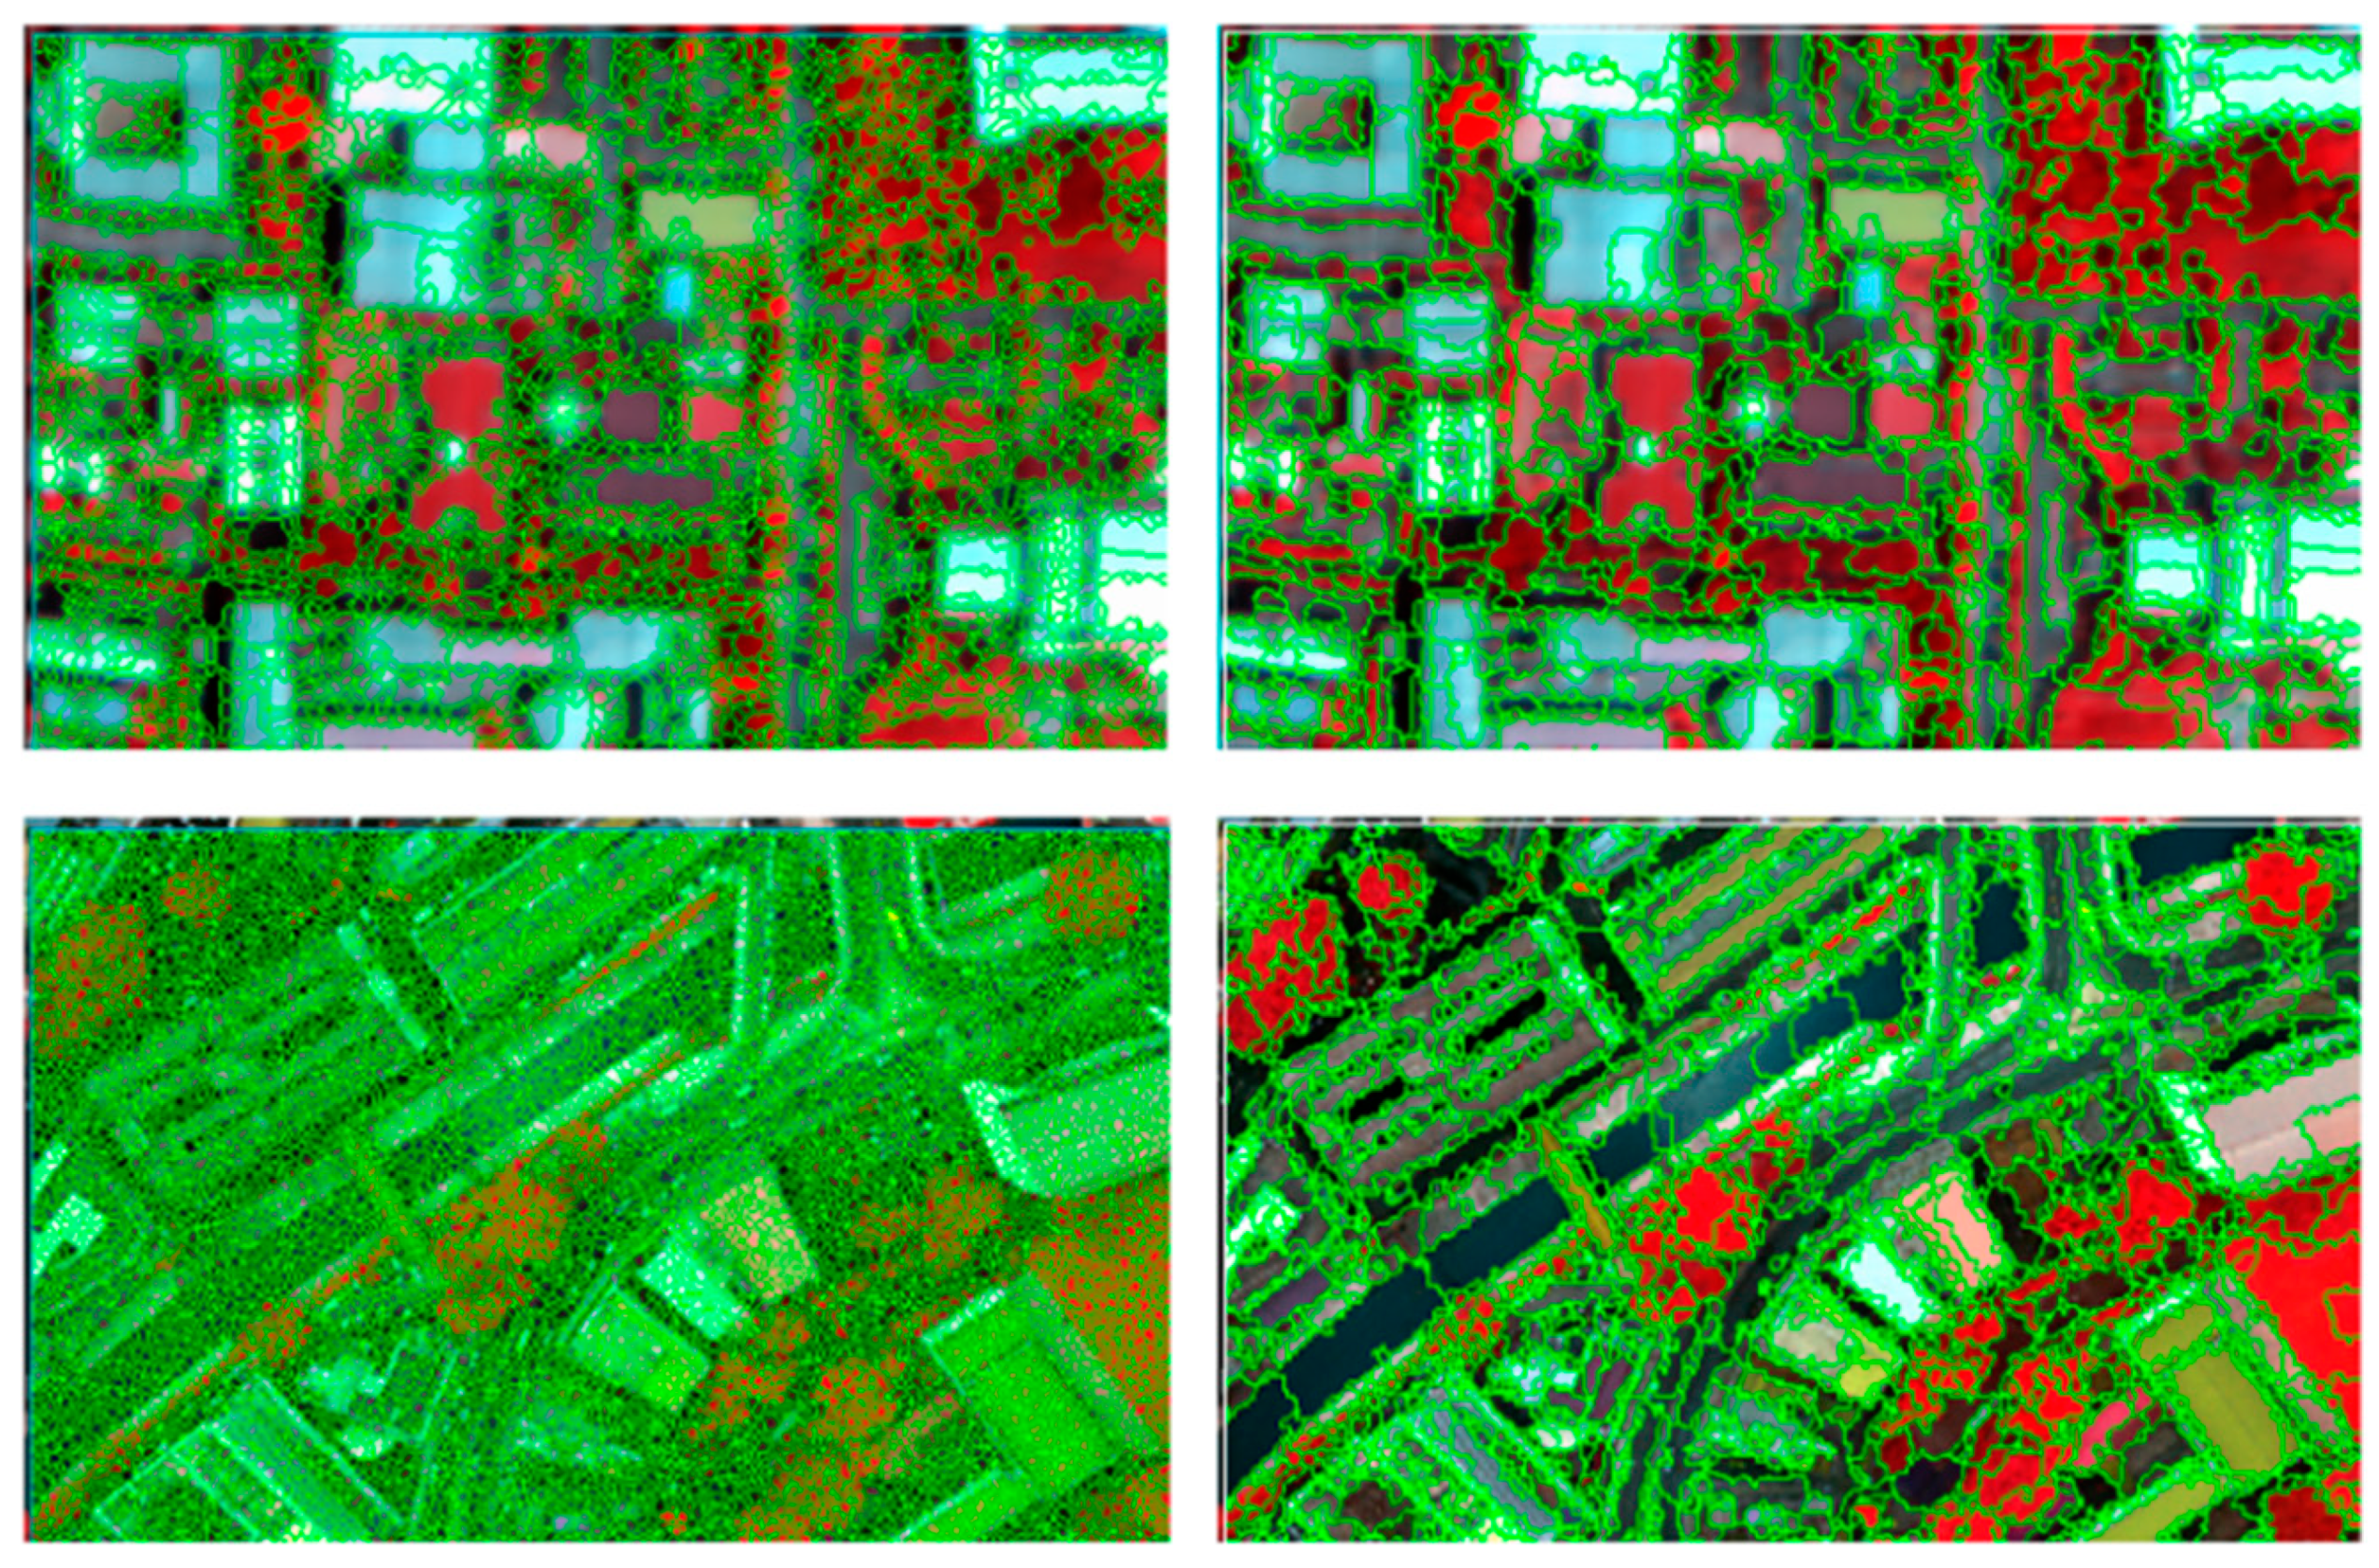
4.2.1. Image Segmentation in the OBIA Process

Two main steps in OBIA methods are often image segmentation and classification [79,80]. OBIA starts with image segmentation, which critically affects the accuracy of the following feature engineering and classification steps [81,82]. In the image segmentation process, images are divided into homogeneous patches [83]. These patches represent the Earth′s surface features, such as roofs, roads, and grasslands [84]. Studies of ACM roof mapping have often employed two segmentation techniques: (1) edge based and (2) region based. While edge-based and region-based techniques theoretically demonstrate the same object in different representations, edge-based methods could lead to different results than region-based methods [85,86].
Among the object-based ACM roof classification literature, several studies have implemented an edge-based segmentation approach using a multiscale segmentation algorithm featured as an ENVI feature extraction tool [24,27,28,29,30]. In edge-based techniques, the edges are first identified and then connected to one another using contouring algorithms [87,88,89,90] with the assumption that the pixel features abruptly change between edges [91]. From this perspective, edges are defined as boundaries between objects and where changes occur [92]. A multiscale edge-based segmentation [93] generates objects based on having similar attributes such as textural, spatial, and spectral index indicators. An example of multiscale edge-based segmentation of HSI is shown in Figure 4.
Other object-based ACM roof classification studies have adopted region-based methods as a suitable way to create roof segments [10,26,32]. In region-based methods, the determination of segments starts from the inside of the objects and then expands outward until the value of neighbouring pixels changes [94,95]. Moreover, it is assumed that the neighbouring pixels within the same region have similar values [43], which is the opposite of edge-based methods [96]. Multiresolution segmentation (MRS) is a region-growing algorithm that has been widely used in remote sensing applications [41,80,97]. This algorithm considers a pixel as a seed that grows until it produces meaningful objects based on predefined local thresholds of scale, shape, and compactness parameters [44,98].
The segmentation scale is a significant aspect of the RSI segmentation process. Large image objects caused by high-scale values (under-segmentation) and small objects produced by low-scale values (over-segmentation) make it challenging to generate meaningful objects effectively [47]. For MRS, the segmentation scale is even more significant, as it determines the size and shapes of the objects affecting the classification results [99,100,101,102]. As mentioned above, therefore, it is crucial to identify the appropriate segmentation scale for generating meaningful objects [103].
Several methods have been used to optimise segmentation scale parameters [104,105]. In ACM roof-mapping studies, integrative image segmentation optimisation [47] and the robust statistical Taguchi method have optimised MRS parameters [10]. However, a number of ACM studies have adopted a trial and error approach, in which the segmentation parameters have been determined based on analysts′ experience, which may not be reliable [106]. In another paradigm of segmentation approaches, some studies suggested that the collaboration of segmentation with classification effectively addresses the challenges of selecting optimal parameters for segmentation algorithms [41]. In this approach, while the object parameters may not be optimised, adding a segmentation step in the classification process addresses issues such as over-segmentation [42,107].

4.2.2. Image Classification in the OBIA Process

By generating the objects and computing their features (i.e., object characteristics), the classification step is performed in the OBIA methods. In the ACM roof identification studies, three classification approaches are often adopted to assign a class label to objects: supervised [10,27,29,32], supervised rule-based [24,26], and expert systems [28,30]. The first approach is the supervised classification approach, also known as nearest neighbour classifiers [72], which utilises training data to assign the segmented objects to the classes. The second approach is a form of rule-based classification, also known as membership function classifiers (providing fuzzy or crisp membership functions), which utilise a ruleset to extract the features. The crisp function computes the rules from a training sample, also known as a supervised ruleset. The third approach uses a ruleset to assign labels to roofs, which relies on an analyst′s knowledge. Some studies adopted multiple methods to compare the efficiency of different methods [108].

Supervised Classification

Supervised classification utilises training data to assign segmented objects to roofing classes, which can be defined by any existing data, such as field surveys, laboratory measurements, and libraries of RSI with high spatial resolution [109]. The ease of use, high degree of accuracy [110], and features offered by various software have led a vast number of studies to adopt the supervised approach in applications such as roofing material classification. The supervised classification approach is a dominant and widely used trend in OBIA studies [111]. However, the studies that adopted supervised classifiers reported several issues in workflow steps [112], such as sample selection [113], feature selection [114], and accuracy assessment [115].
Reliance on training data in supervised classification causes major problems that make this method unsuitable for universal use. The size and representativeness of training data require the consideration of different factors, such as the spatial resolution of input data, the availability of ground references, and the geophysical situation of study areas [116]. The sample collection strategies could significantly affect the classification accuracy results [117]. Moreover, gathering sufficient training data could be challenging when the study areas are complex and heterogeneous. Therefore, poorly defined or insufficient training samples could significantly affect the accuracy of the classification [118,119]. Furthermore, the training data make the supervised technique less transferrable to other images [65,120]. The classification of wider-scale and multi-image areas requires configuration or a new set of training samples due to the different inherent attributes among images [121], while the collection of the training data could be costly in terms of time and money [122]. This is a limitation of autonomous ACM roof classification over wide-scale study sites.

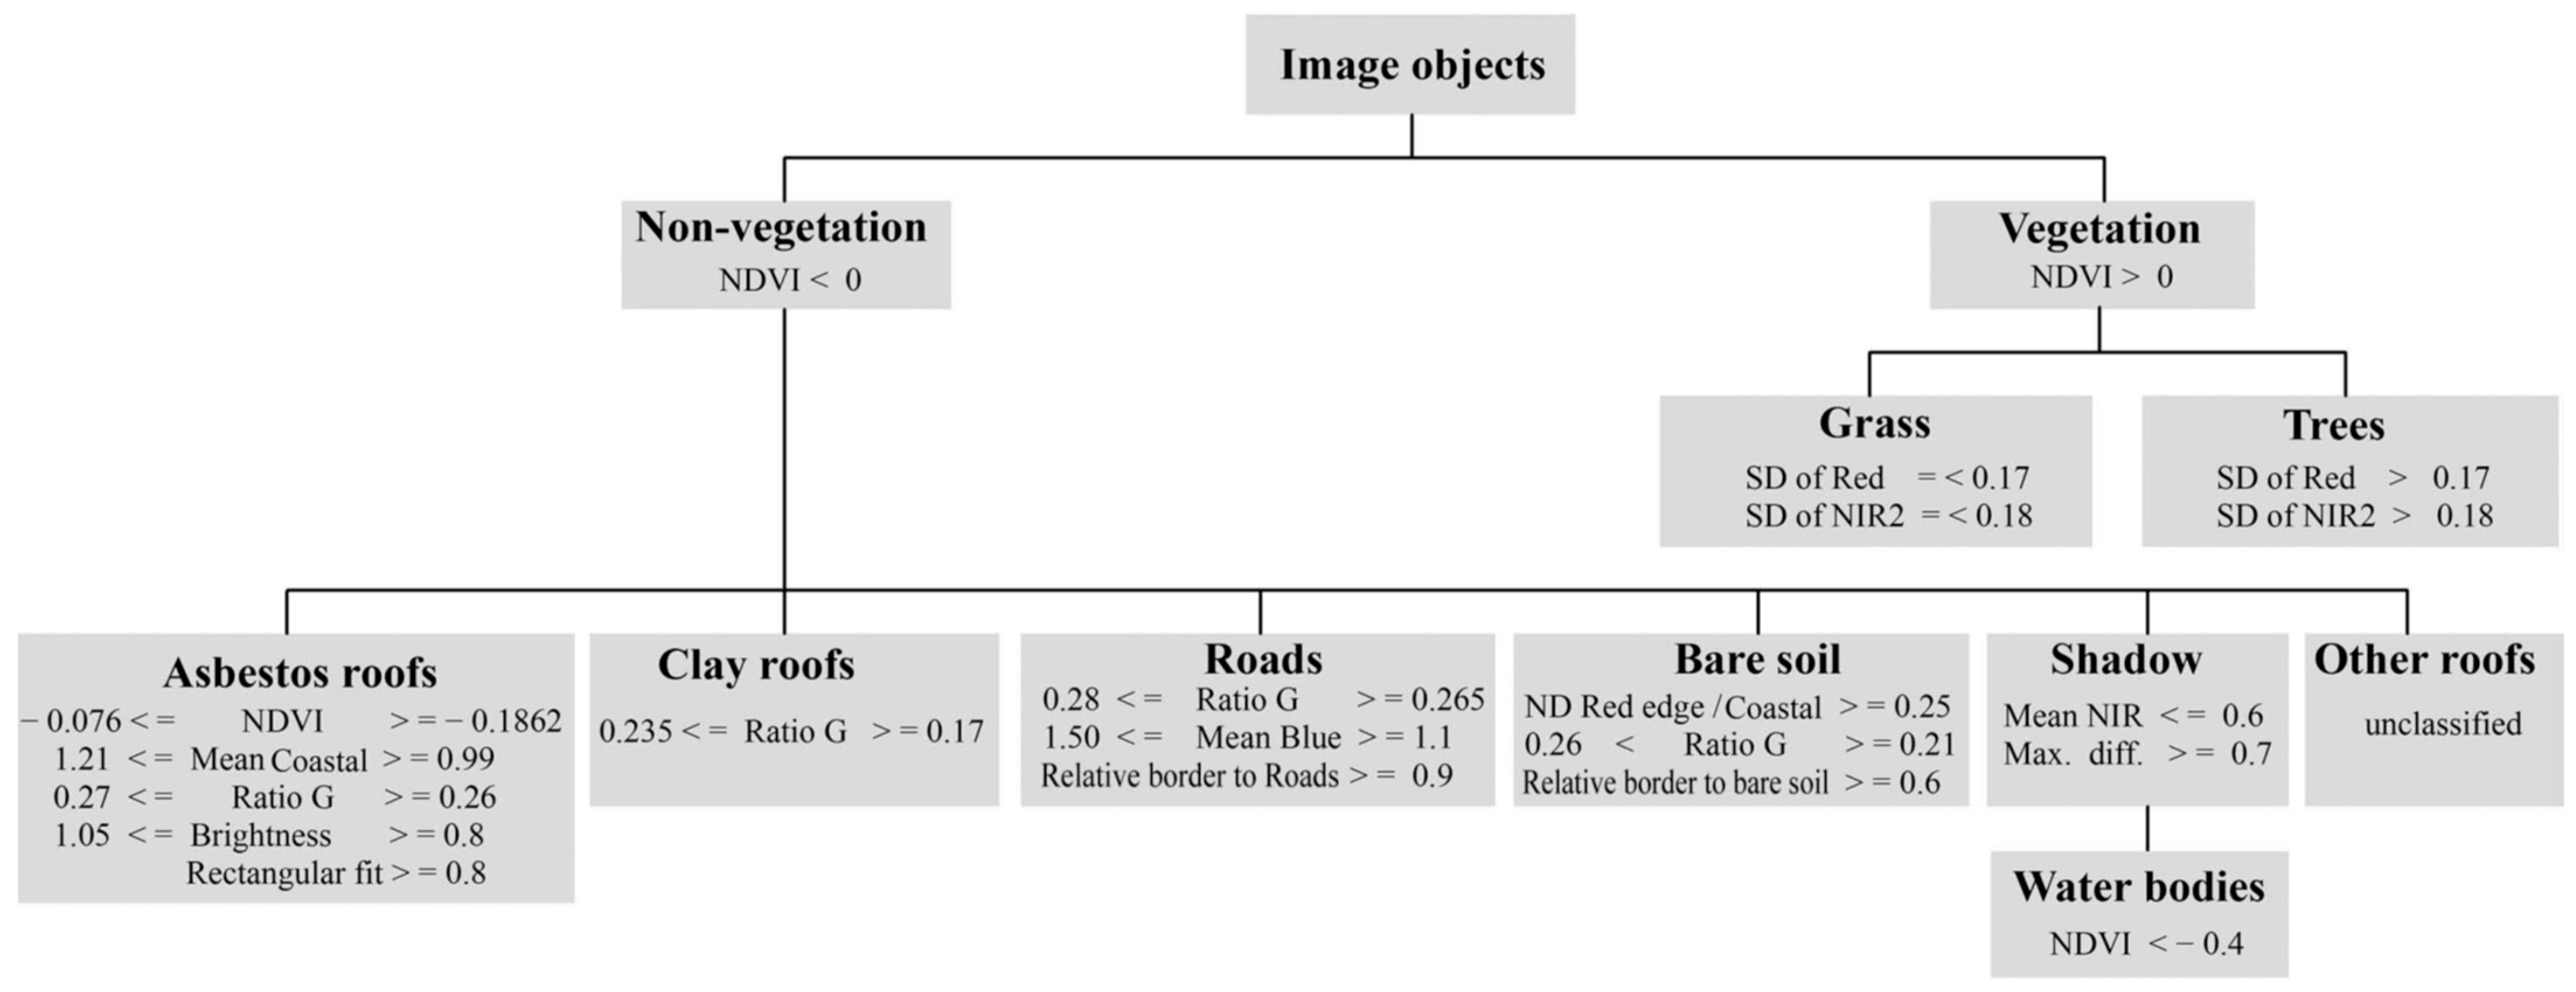
Supervised Rule-Based Classification

Generally, rule-based systems in the OBIA image classification methods adopt “If…Then…Else” threshold rules to assign classes (e.g., ACM roof) to segmented pixels [123]. In supervised rule-based classification methods, rules are autonomously developed from training data to determine the relationships between RSI and the defined classes. In ACM roof studies, decision trees (DTs) are widely used for autonomous generating rulesets of roof classification [124]. In this method, training data are divided into homogenous subsets based on the threshold values of image features. By defining subset variances, subsequent subsets are generated in a hierarchical structure until they reach the predefined classification tree levels [125].
A significant advantage of rule-based methods is the transparency of the feature engineering and classification procedure because the attributes and rulesets are represented [108,126,127]. Unlike “black-box” supervised methods, the analyst can measure data on different scales and interpret the ruleset data [128]. Moreover, DTs make no assumptions regarding the frequency distributions of image classes, and classification performance can be improved using boosting techniques [129]. Hence, the supervised rule-based OBIA may be a more appropriate method than the supervised OBIA due to the transparency of image processing steps.
Successful applications of DT methods are reported in ACM roof studies. Pinho et al. (2012) [26] adopted DT to classify urban feature classes using IKONOS images. ACM roofs were defined in three categories: dark, medium-toned, and light asbestos. The study found that while light asbestos roofs gained acceptable accuracy with a PA of 90% and a UA of 94%, dark and medium-toned asbestos roofs had lower classification accuracies. In this study, while the method′s transferability was not tested in more study areas, DT significantly improved image classification accuracy, achieving an OA of 71.91% [130].
In another study by Hamedianfar et al. (2014) [24], two sets of AISA imagery and the C4.5 data mining algorithm were combined with DT to develop a knowledge model of HSI. The DT method identified relevant attributes with a high classification capability based on the training images. The DT learning algorithm used in this study offered an autonomous feature selection capability to develop the classification ruleset. The results of HSI study demonstrated high accuracy for asbestos roofs, with an OA between 88% and 93% and an asbestos PA of 100% and 84% for the two sets of images, respectively [24]. The explained method is suitable for autonomously developing the rule sets from training data with several attributes and image segments, addressing the high dimensionality of HSI.

Fuzzy Rule-Based Classification (Expert System)

The rule set in an expert system is based on the analyst′s knowledge and reasoning to extract the features [131]. In an expert system, the analyst determines various parameters such as spectral, spatial, and contextual attributes to create classification rules [10]. In the fuzzy rule-based methods, fuzzy logic is utilised as an effective tool for generating ruleset parameters, and based on the knowledge of the analyst, the attributes are selected and examined to create the classification ruleset. This approach has several advantages compared to supervised and supervised rule-based OBIA approaches. On the one hand, the presentation of ruleset data in a logical and flexible structure and, on the other hand, the modular arrangement of the ruleset allows for classification enhancement via easy updates and alterations [123].
Studies of intra-urban mapping with ACM classes showed that expert systems often outperform supervised classifiers [10,28,29,30,127]. Gibril et al. (2018) [10] utilised two subsets of WV-2 to map AC roofs by using an expert-developed ruleset (see Figure 5) and different supervised classifiers of SVM, RF, k-NN, and Bays. While the overall accuracy of the supervised classifiers was acceptable, results showed misclassification of surfaces with similar spectral responses with ACM roof materials. On the other hand, the ruleset result revealed a better performance in the classification of ACM roofs compared to supervised classifiers for the two subsets of WV-2 images. Hamedianfar et al. (2014) [30] developed a ruleset considering spatial, elevation, and spectral features to map urban areas by combining WV-2 and LiDAR images. The PBIA classifiers (i.e., SVM and ML) were also used to compare the accuracy results with the rule-based classification. While the OA of the RF and SVM classifiers gained 72.46% and 75.69%, respectively, the rule-based classification gained an OA of 92.84%. Moreover, asbestos roofs gained a higher PA and UA than the supervised classifiers. However, the transferability of the proposed ruleset was not investigated in other images.
Transferability is a significant advantage of a classification model, which allows acceptable results to be obtained when reusing the model for other image datasets [132]. The OBIA rulesets are often transferable or reproducible, and can be used to classify other RSI datasets with different spatial and spectral features [133]. As mentioned before, the supervised OBIA methods rely on training data that may not be transferable to other study areas [65], whereas developed rulesets in expert systems can be reapplied to other areas [134] and temporal images with or without some manual editing [135]. In studies of ACM roof classification, successful attempts have been made to develop transferable models using fuzzy rule-based methods. Hamedianfar et al. (2015) [28] tested the transferability of fuzzy rulesets on the WV-2 images of three different study areas. The classification rules were developed based on expert knowledge of the spatial features and spectral indexes. Without any changes in the features′ thresholds, the rulesets performed well for all datasets, resulting in OAs of more than 86%.

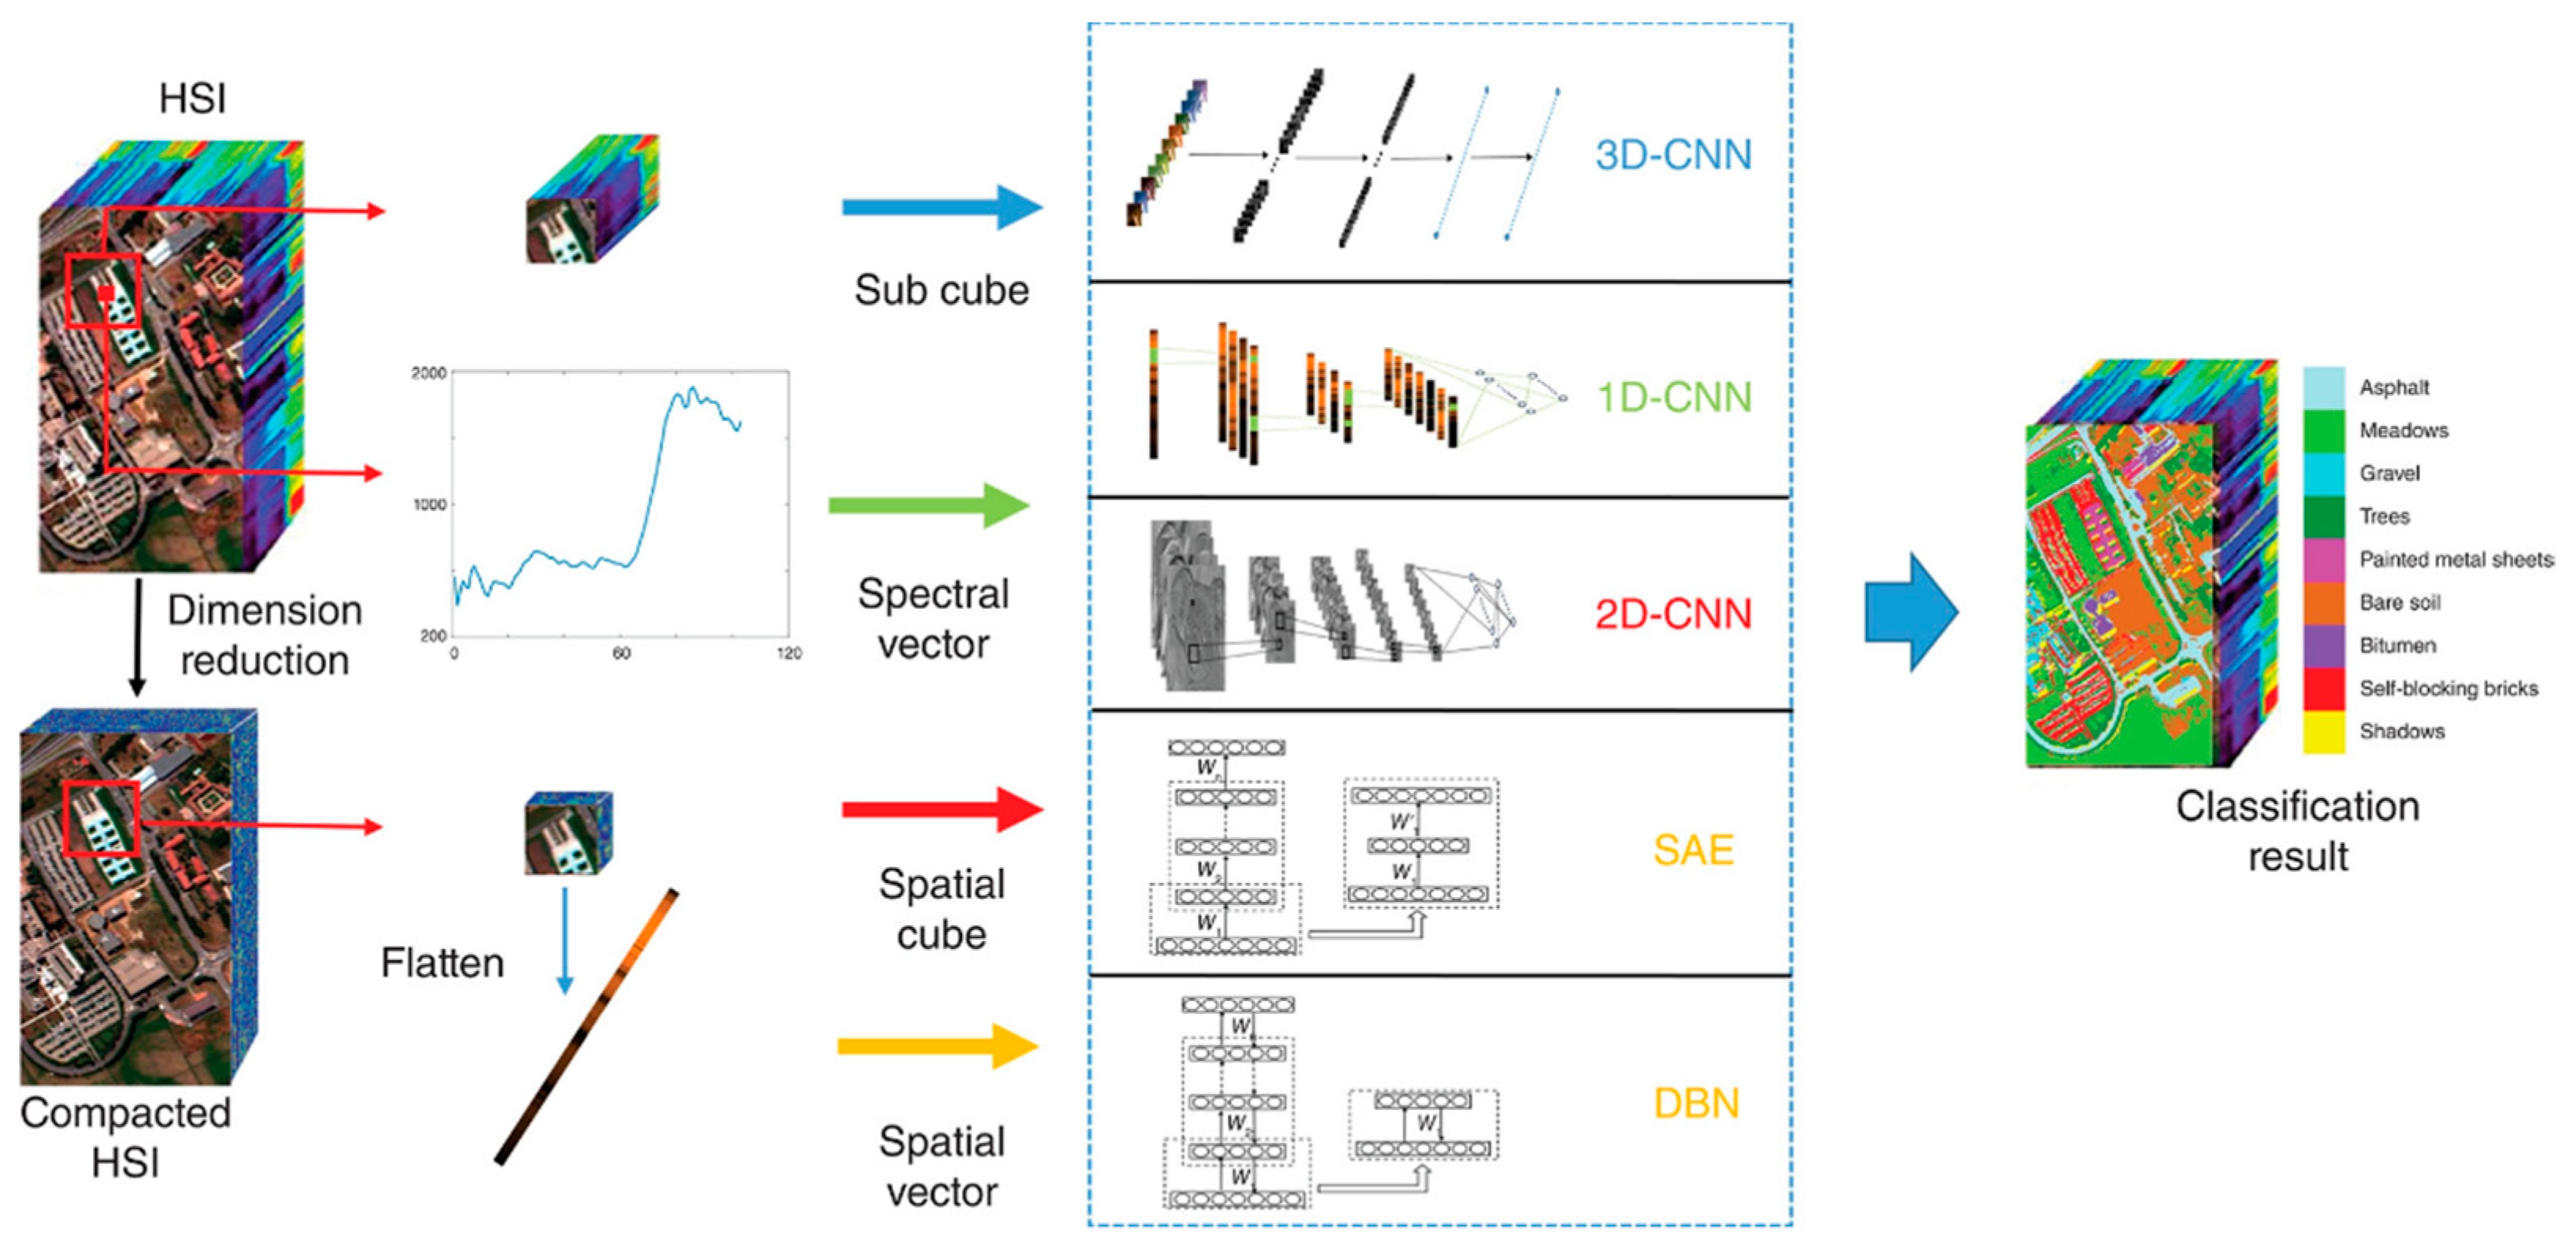
4.3. Deep-Learning-Based (DL-Based) Approach

Deep-learning-based (DL-based) methods and techniques have recently been rapidly used in several image processing applications [136,137]. By increasing the number of “depths” or “hidden layers” of machine learning methods, these architectures improve the performance and accuracy of the computation process [40]. While OBIA was considered more suitable than PBIA for many years, both approaches had limitations in widespread applications because of issues such as classification errors and imbalances in classes [37]. Deep learning methods enhance the image classification process through efficient and automatic feature extraction from a large number of images, and they reduce classification errors by adopting complex models in regression [138]. Additionally, DL-based methods have a better performance than PBIA and OBIA methods when handling the massive volume of image data, particularly in supervised classifications with large training datasets [37,49,60]. Hence, several studies have shifted to deep-learning-based methods, such as the pixel-based semantic segmentation of VHR images [139,140,141,142,143].
Despite the promising results of using deep-learning-based methods, they are not extensively explored in ACM roof mapping studies. To date, the only study that took a deep learning approach to ACM roofing identification was conducted by Krówczyńska et al. (2020) [12], who used convolutional neural networks (CNNs) to identify AC roofs. In this study, the RGB and CIR compositions of aerial photographs with 25 cm resolution were classified by a CNN network consisting of two convolutional blocks. ACM roofs were detected with an OA of around 89% and a PA of 89%. While the result of this study may not be conclusive for the successful adoption of the proposed model in dense urban areas [12], using the DL-based method resulted in an acceptable classification accuracy using images with few spectral bands.
The DL architectures such as fully convolutional networks (FCNs) have shown promising accuracy results in other image classification applications, such as urban object detection and LULC classification [144,145,146,147]. Moreover, DL-based techniques have been successfully combined with conventional approaches in image processing [148,149,150]. DL-based three-dimensional spectral–spatial classification methods such as 3D-CNN (see Figure 6) have shown good performance in handling the high dimensionality of HSI [151]. Mask R-CNN has been widely used for object instance segmentation, which simultaneously generates high-quality segmentation masks and identifies objects in images [45]. Furthermore, the end-to-end deep learning architectures are a new paradigm wherein features are learnt automatically instead of being engineered [49]. Over the last few years, the end-to-end use of deep learning models has been prevalent within the remote sensing community. Despite the challenges arising from model development complexities and computational requirements, the end-to-end DL-based approach is a future avenue in ACM roof mapping.

5. Discussion

This section represents a summary of the reviewed studies (Section 5.1), discusses the synthesised challenges, and highlights possible solutions identified in both ACM roof mapping studies and other remote sensing applications (Section 5.2).

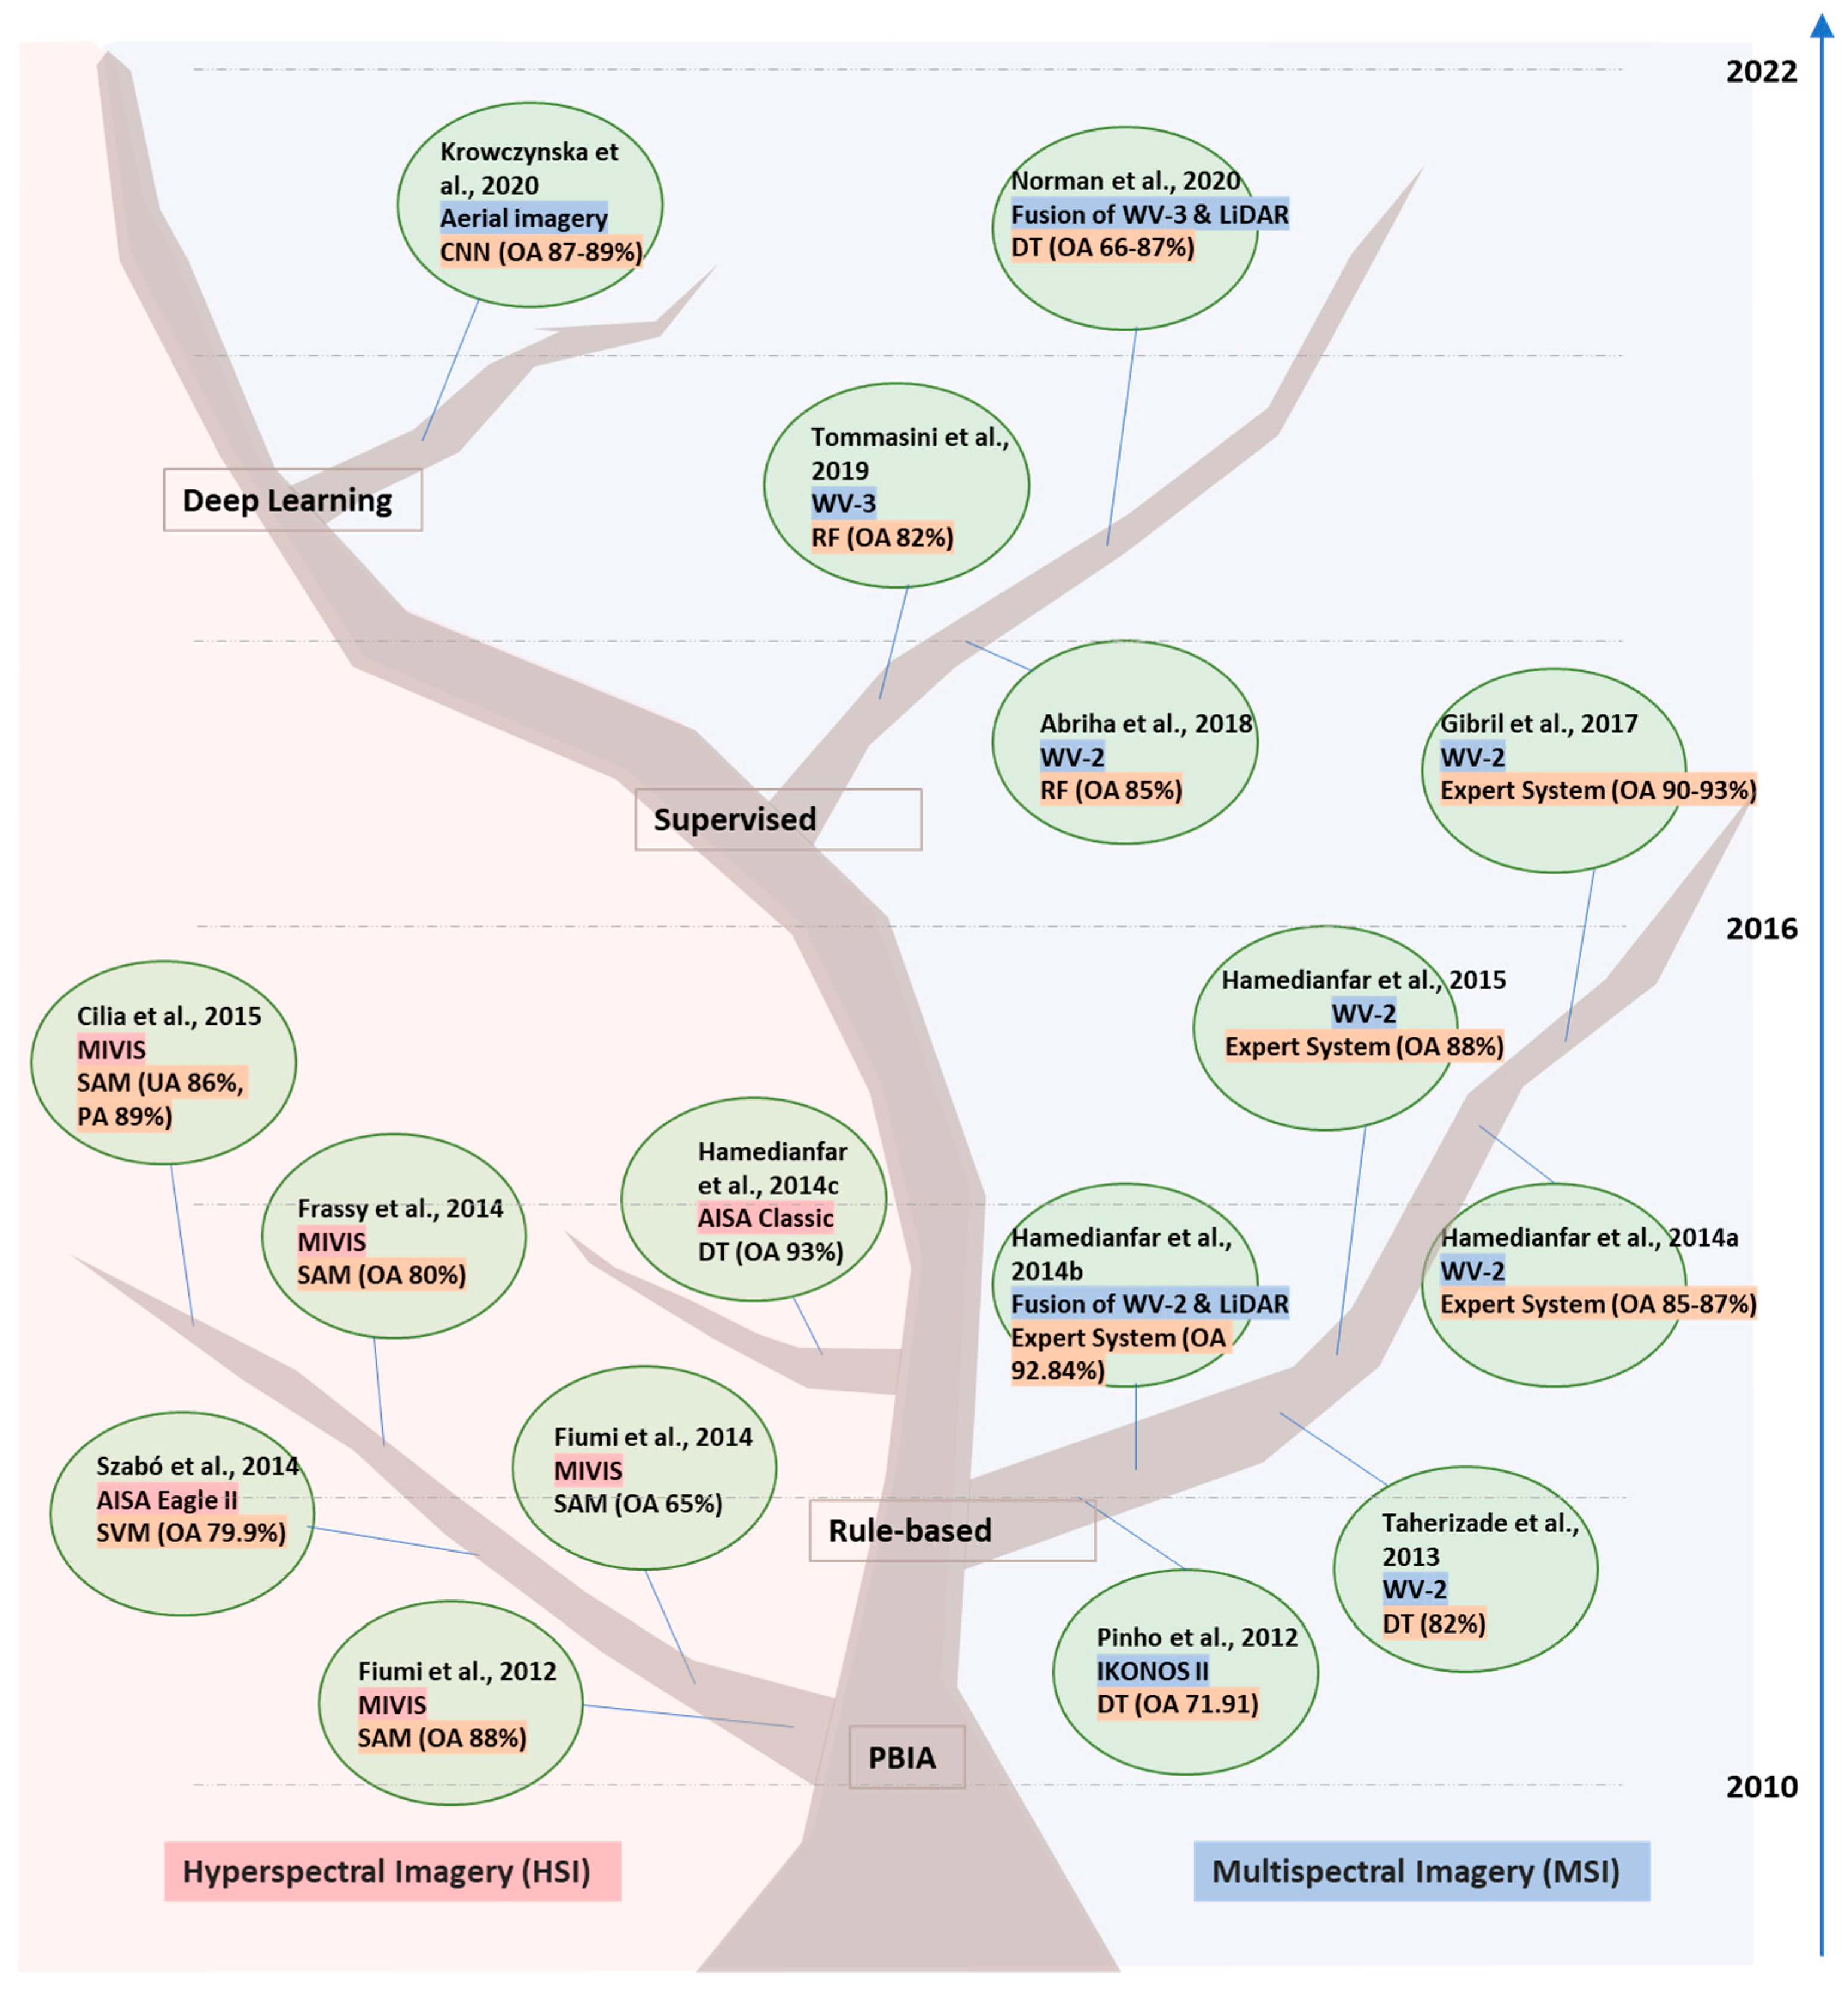
5.1. Summary of the Reviewed Studies

Figure 7 illustrates a tree diagram of the studies categorised according to their RSI, classifiers, and date order. The RSI, classier, and OA of each study are shown with colour codes for a comparison of their features. This study reviewed sixteen peer-reviewed journal articles investigating ACM roof mapping in a ten-year timeframe from 2012 to 2022. Furthermore, the studies are grouped based on the input RSI and classification methods.
In terms of RSI, six papers [13,20,21,22,23,24] used HSI as the input data, whereas ten studies worked on MSI [10,11,12,26,27,28,29,31], in which two works combined RSI with LiDAR data [30,32] (see Table 5). The early HSI studies adopted the PBIA approach and often used SAM and SVM algorithms as the classifiers. Relying on the spectral information in traditional PBIA methods caused many issues, such as large OE and salt-and-pepper error. Hence, many recent studies adopted the OBIA approach, which takes the contextual factors into account for more accurate classification results. Supervised, supervised rule-based, and fuzzy rule-based methods were investigated for feature engineering and the classification process of ACM roof mapping. Only one paper [12] investigated the potential capabilities of deep-learning-based methods for ACM roof classification. While these studies mostly reported acceptable classification results, several challenges affected the mapping process or classification accuracy results. The following section discusses the major challenges synthesised from the reviewed works and highlights solutions adopted in other studies across different applications.

5.2. Major Challenges and Opportunities

Table 6 demonstrates the synthesis of major challenges in the reviewed ACM roof mapping studies and highlights the opportunities to enhance the procedure. The challenges and their associated opportunities are further discussed in the corresponding paragraphs. As explained in Section 2.2, adopting a systematic assessment approach to compare the accuracy results was inappropriate. The reviewed ACM roof mapping studies worked on different study areas, which have different characteristics. Apart from that, the mapping processes often differ in the details, such as image preprocessing, feature extraction, and segmentation optimisation techniques. A valid comparison of the mapping processes assists in identifying the optimal approaches and opportunities. Future works are suggested to focus on a particular challenge and its corresponding opportunities by adopting the same study area and minimising the variation in research conditions and mapping workflow. This synthesis aims to provide guidance on the general performance of the reviewed methods, assisting the researchers in identifying best practices and improving areas in future research.
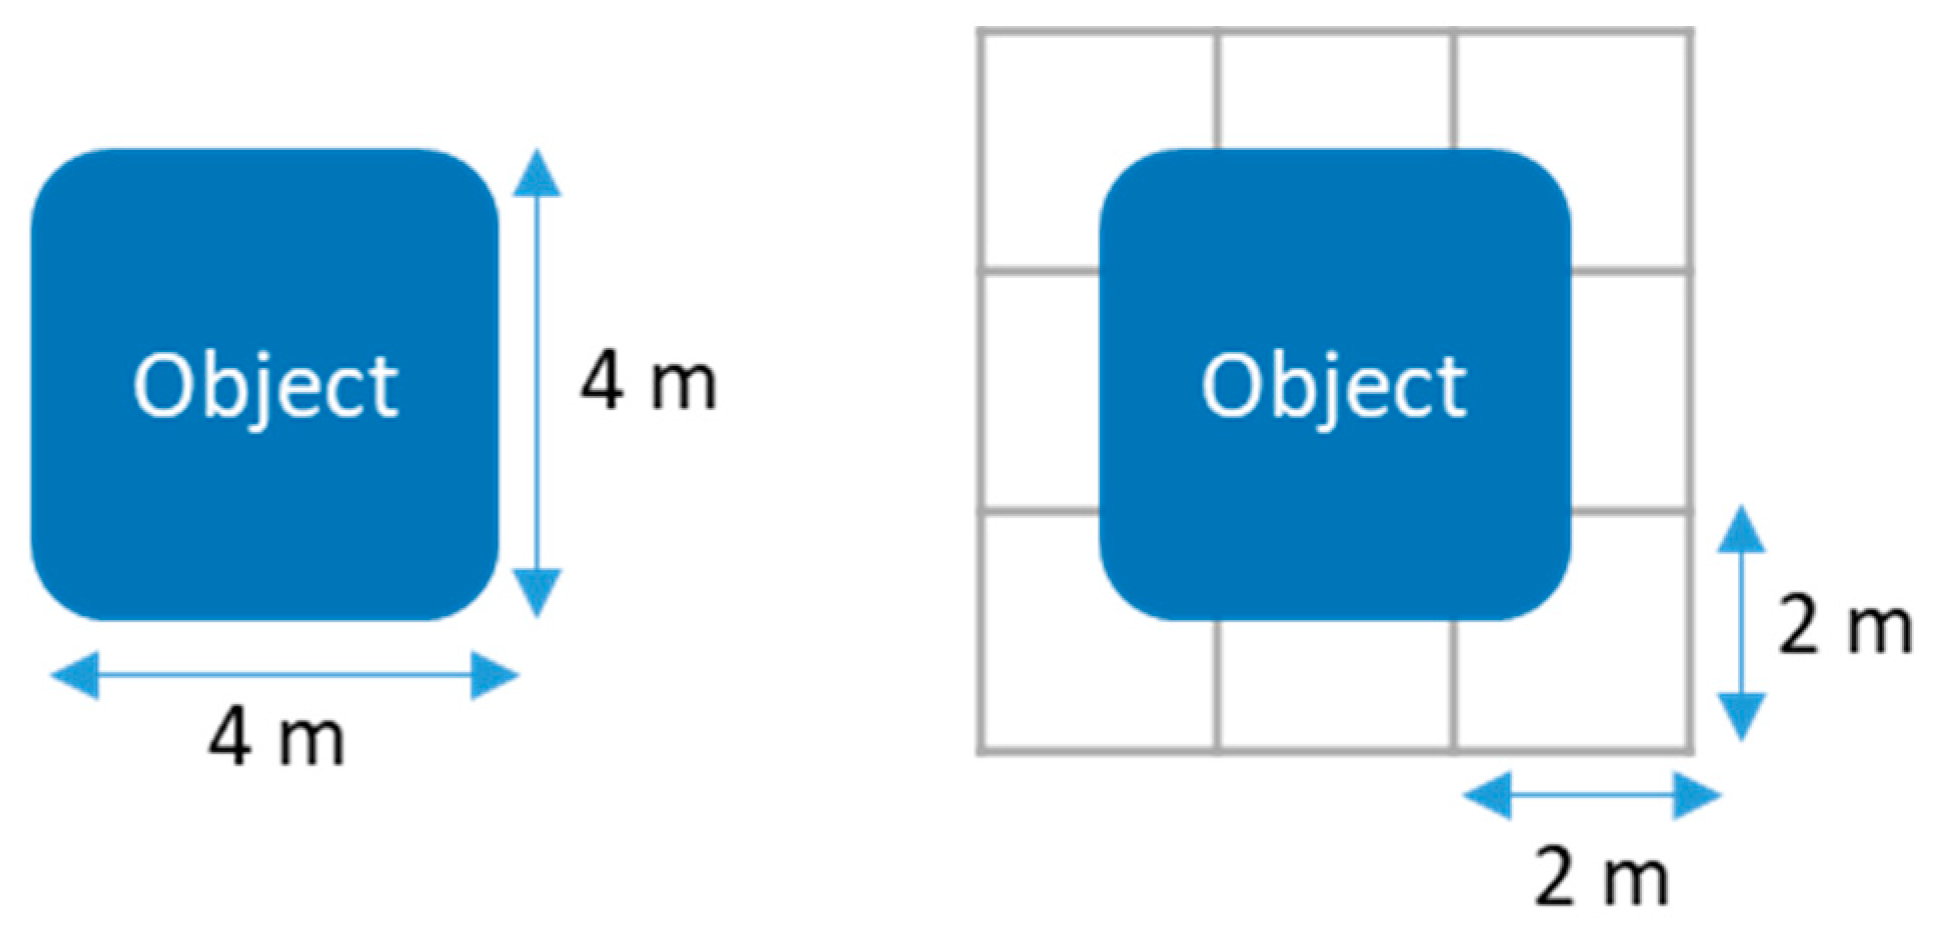
  • The low spatial resolution of early HSI was a significant challenge causing large OEs [13,20,21,22,23]. As explained in Section 4.1, a window of 3 × 3 image pixels is required to detect a roof unit with reasonable confidence [72]; consequently, for HSI with a 4 m spatial resolution, traditional pixel-based classifiers often were able to detect roof units with an area of larger than 144 m2 [22]. While large OEs were reported in early studies of ACM roof mapping using HSI, two studies [13,20] indicated high OAs. This was due to the large areas of the classified roof units, because the classification accuracy increases when roof units have large areas. In the study by Cilia et al. (2014) [13], roofs with an area smaller than 36 m2 were excluded from accuracy assessment, which resulted in high OA. Hence, the results of the above studies may not be consistent due to the high OEs of asbestos classes. Due to the advancement in remote sensors, low spatial resolution is not a challenge with current hyperspectral images, as they often provide both high spectral and spatial resolutions. Additionally, for low-resolution HSI, DL-based semantic classification could enhance the accuracy results by assigning class membership to subpixels instead of a single label [141,142,145].
  • High dimensionality remained a challenge in ACM roof mapping studies, despite enhancement in the spatial resolution of recent HSI [23,24]. Using the non-optimal number of bands and features could adversely affect the classification accuracy (i.e., the curse of dimensionality) [34]. Furthermore, the high dimensionality of the data increases image processing time and causes inter-class confusion [35]. High dimensional space causes noisy maps due to the atypical or mixed pixels in pixel-based methods [36]. Dimensionality reduction techniques such as principal component analysis (PCA), and sequential forward selection (SFS) could significantly enhance the classification accuracy via optimal selection of features [152]. In the study by Szabo et al. (2014) [23], the PA of asbestos increased from 23% to 86.9% by reducing the dimensionality of another dataset. Several studies suggested OBIA methods could have a better performance in handling high dimensionality of HSI in comparison with PBIA classification methods [152,153]. Moreover, Hamedianfar et al. (2014) [24] indicated that integrating a data mining (DT) algorithm with OBIA classification could significantly improve attribute selection and classification accuracy.
  • On the other hand, while very-high-resolution MSIs have been suitable input data, the pixel-based classification methods could not handle the detailed data of MSI with fine resolution [72]. The Earth′s surface is a mixture of various natural and artificial materials, so the finer resolution of MSI represents more details, resulting in complex spectral responses, particularly in heterogeneous urban areas [30]. Using spectral information in PBIA methods increases intra-class variability, confusion among classes, and salt-and-pepper errors when classifying very-high-resolution MSI [37,154]. Apart from that, other challenges may arise from interconnection among image resolutions, bands, and the cost of acquiring very high-resolution data in which using new technologies such as drones could reduce the survey costs [29]. As mentioned above, OBIA methods have been an appropriate alternative for classifying very high-resolution MSI [10,11,26,27,28,29,30,31,32]. However, misclassification errors were reported [27,29,32] as another challenge that was often connected to variability in the roof condition and geometry. In this regard, [30,32] showed that the fusion of MSI with LiDAR could not only significantly enhance the classification accuracy, but also could be capable of evaluating the ACM roof conditions.
  • Generating the optimised segmentation parameters plays a significant role in achieving acceptable accuracy results in OBIA classifications. Both over-segmentation and under-segmentation [157] can result in too many small objects or large objects corresponding to mixed classes. A trial-and-error approach was adopted in ACM roof mapping studies [29] to identify the optimal parameters of objects; however, this segmentation process is subjective, which may cause poor results [155]. Apart from that, ENVI tools were utilised [28,30] for the segmentation of images, while no method was adopted to evaluate the segmentation quality. Several techniques for segmentation optimisation are proven to enhance the results, reduce the processing time, and minimise trial efforts [48,158]. A Taguchi optimisation technique, which has been widely used in OBIA studies, showed acceptable results [32,47,130,155]. In other remote sensing applications, DL-based image segmentation methods such as Mask R-CNN have shown good performance [45]. Moreover, it is suggested that the collaboration of segmentation with classification [115] could identify more accurate objects by adding a segmentation step in the classification process [41,42,107].
  • The reliance on training data was the main barrier to transferability and widespread use of supervised classification methods [111,112]. The size, representativeness, cost, and sample collection strategies could significantly affect the classification accuracy [117]. When training samples are gathered from field surveys, the availability of ground references and the geophysical situation of study areas raise more challenges, particularly in complex and heterogeneous urban areas [110,118]. Moreover, because of the differences in inherent attributes among study areas [40], it is usually required to develop a new dataset for transferring the model to other areas, which is a limitation of autonomous ACM roof classification over wide-scale study sites. While defining training data requires several factors to consider, Mather et al. (2011) [118] suggested that the sample size should preferably be 30 times greater than the number of RSI spectral bands used in classification. Furthermore, adopting advanced non-parametric classifiers such as RF and SVM could have an acceptable performance when a small number of training data are available [46]. Supervised classifications were often outperformed by rule-based methods in the reviewed studies of ACM roof mapping [10,32]. Hence, fuzzy rule-based (expert systems) could be an alternative when adequate training data are not available.
  • Analysts’ subjectivity in expert systems could cause biased and error-prone results because the rules are defined based on the analyst′s knowledge and reasoning on feature classes [101,105,153,156]. Consequently, when rulesets are developed by different operators, different results may be achieved. In the ACM roof mapping studies, while [10,28,29,30] reported acceptable accuracy results of rule-based classification, a systematic evaluation of the subjectivity [101] is missing. In this regard, adopting automatic induction (i.e., data mining) methods could be a suitable solution to reduce the effects of the analyst′s subjectivity [24,65,120]. Moreover, within the end-to-end deep learning structure, feature extraction is replaced by feature learning as a part of the classifier training phase. In this case, instead of defining the inner steps of the feature engineering phase, the end-to-end architecture generalises the model generation involving feature learning as part of it [49]. Hence, DL-based end-to-end architectures have been suggested as a practical approach to replace conventional rule-based OBIA classifications.

6. Conclusions and Future Direction

This paper reviewed the state-of-the-art of ACM roof mapping using remote sensing imagery and machine-learning-based classification. This paper synthesised the critical challenges of the ACM mapping process in two main contexts: (1) RSI and image preprocessing, and (2) classification methods and techniques. Further, other applications of machine learning and remote sensing were used to inform any priorities for future research. Literature model results were provided in this paper as example results for each modelling approach. Due to the variety of approaches and analysis of results, a comparison of results was not provided. Therefore, this review does not conclude with an optimal method, but rather provides an overview of best practices from the existing literature.
Six major challenges were identified in the reviewed studies: (1) the low spatial resolution of early HSI classified by traditional PBIA in early studies; (2) the high dimensionality of HSI, which often causes inter-class confusions; (3) complex patterns of surface materials in VHR MSI classified by traditional PBIA; (4) non-optimised segmentation parameters causing low classification accuracy and mixed objects in OBIA approach; (5) inadequate training data in supervised methods; and (6) analysts’ subjectivity causing biased or error-prone classification results in fuzzy rule-based OBIA (expert system). By identifying these challenges and integrating them in this review paper, we aim to assist in the research and development of ACM roof mapping models.
Among the reviewed studies of ACM roof mapping, adopting OBIA classifications on MSI often showed more accurate results than the PBIA methods. The fusion of MSI with LiDAR resolved skewed image perspectives and complex geometry of roofs. Segmentation optimisation techniques such as a Taguchi optimisation technique resulted in improved accuracies in OBIA classification. While utilisation of DL-based classification methods is in its infancy in ACM roof mapping studies, the review of other remote sensing applications has shown several opportunities to enhance the performance of ACM roof mapping. Two future research directions for ACM roof mapping are to explore: (1) deploying DL-based end-to-end semantic classification on aerial imagery; and (2) integrating conventional classification approaches in ACM roof mapping with DL-based architectures such as Mask R-CNN and 3D-CNN.

Author Contributions

Conceptualization, M.A. and R.A.S.; methodology, M.A., R.A.S. and S.M.; formal analysis, M.A.; visualisation, M.A.; writing—original draft preparation, M.A.; writing—review and editing, R.A.S., S.M., A.S.V. and N.P.; supervision, R.A.S. All authors have read and agreed to the published version of the manuscript.

Funding

This research received no external funding.

Institutional Review Board Statement

Not applicable.

Informed Consent Statement

Not applicable.

Data Availability Statement

The datasets during and/or analysed during the current study are available from the corresponding author on reasonable request.

Conflicts of Interest

The authors declare no conflict of interest.

References

  1. Sen, D. Working with asbestos and the possible health risks. Occup. Med. 2015, 65, 6–14. [Google Scholar] [CrossRef] [PubMed] [Green Version]
  2. Snabe, L.; Candscientsanpubl, N.; Baelum, J.; Rasmussen, J.; Dahl, S.; Olsen, K.E.; Albin, M.; Hansen, N.C.; Sherson, D. Occupational asbestos exposure and lung cancer—a systematic review of the literature. Arch. Environ. Occup. Health 2014, 69, 191–206. [Google Scholar] [CrossRef]
  3. Currie, G.P.; Watt, S.J.; Maskell, N.A. An overview of how asbestos exposure affects the lung. BMJ 2009, 339, b3209. [Google Scholar] [CrossRef] [PubMed] [Green Version]
  4. Doll, R.; Peto, J. Effects on Health of Exposure to Asbestos; Health & Safety Commission: London, UK, 1985. [Google Scholar]
  5. Banks, D.E.; Wang, M.-l.; Parker, J.E. Asbestos exposure, asbestosis, and lung cancer. Chest 1999, 115, 320–322. [Google Scholar] [CrossRef] [PubMed]
  6. LaDou, J. The asbestos cancer epidemic. Environ. Health Perspect. 2004, 112, 285–290. [Google Scholar] [CrossRef] [Green Version]
  7. Campopiano, A.; Ramires, D.; Zakrzewska, M.; Ferri, R.; Annibale, A.D.; Pizzutelli, G. Risk Assessment of the Decay of Asbestos Cement Roofs. Ann. Occup. Hyg. 2009, 53, 627–638. [Google Scholar] [CrossRef]
  8. Bloise, A.; Catalano, M.; Teresa, C.; Carmine, A.; Domenico, M. Naturally occurring asbestos: Potential for human exposure, San Severino Lucano (Basilicata, Southern Italy). Environ. Earth Sci. 2017, 76, 648. [Google Scholar] [CrossRef]
  9. Zen, I.S.; Ahamad, R.; Rampal, K.G.; Omar, W.; Safitri, I.; Ahamad, R.; Rampal, K.G.; Omar, W.; Zen, I.S.; Ahamad, R.; et al. Use of asbestos building materials in Malaysia: Legislative measures, the management, and recommendations for a ban on use. Int. J. Occup. Environ. Health 2013, 19, 169–178. [Google Scholar] [CrossRef]
  10. Gibril, M.B.A.; Shafri, H.Z.M.; Hamedianfar, A. New semi-automated mapping of asbestos cement roofs using rule-based object-based image analysis and Taguchi optimization technique from WorldView-2 images. Int. J. Remote Sens. 2017, 38, 467–491. [Google Scholar] [CrossRef]
  11. Tommasini, M.; Bacciottini, A.; Gherardelli, M. A QGIS Tool for Automatically Identifying Asbestos Roofing. ISPRS Int. J. Geo-Inf. 2019, 8, 131. [Google Scholar] [CrossRef] [Green Version]
  12. Krówczyńska, M.; Raczko, E.; Staniszewska, N.; Wilk, E. Asbestos-cement roofing identification using remote sensing and convolutional neural networks (CNNs). Remote Sens. 2020, 12, 408. [Google Scholar] [CrossRef] [Green Version]
  13. Cilia, C.; Panigada, C.; Rossini, M.; Candiani, G.; Pepe, M.; Colombo, R. Mapping of Asbestos Cement Roofs and Their Weathering Status Using Hyperspectral Aerial Images. ISPRS Int. J. Geo-Inf. 2015, 4, 928–941. [Google Scholar] [CrossRef] [Green Version]
  14. Virta, R.L. Asbestos: Geology, Mineralogy, Mining, and Uses; USGS: Washington, DC, USA, 2002.
  15. Krówczyńska, M.; Wilk, E. Aerial imagery and geographic information systems used in the asbestos removal process in Poland. In Proceedings of the 33rd EARSeL Symposium “Towards Horizon 2020: Earth Observation and Social Perspectives”, Matera, Italy, 3–6 June 2013. [Google Scholar]
  16. Samsudin, S.H.; Shafri, H.Z.; Hamedianfar, A. Development of spectral indices for roofing material condition status detection using field spectroscopy and WorldView-3 data. J. Appl. Remote Sens. 2016, 10, 025021. [Google Scholar] [CrossRef]
  17. Bhaskaran, S.; Paramananda, S.; Ramnarayan, M. Per-pixel and object-oriented classification methods for mapping urban features using Ikonos satellite data. Appl. Geogr. 2010, 30, 650–665. [Google Scholar] [CrossRef]
  18. Taherzadeh, E.; Shafri, H.Z.M.; Shahi, K. Roof material detection based on object-based approach using WorldView-2 satellite imagery. J. Comput. Electr. Autom. Control. Inf. Eng. 2014, 8, 1737–1740. [Google Scholar]
  19. Manolakis, D.; Shaw, G. Detection algorithms for hyperspectral imaging applications. IEEE Signal Process. Mag. 2002, 19, 29–43. [Google Scholar] [CrossRef]
  20. Fiumi, L.; Campopiano, A.; Casciardi, S.; Ramires, D. Method validation for the identification of asbestos–cement roofing. Appl. Geomat. 2012, 4, 55–64. [Google Scholar] [CrossRef]
  21. Fiumi, L.; Congedo, L.; Meoni, C. Developing expeditious methodology for mapping asbestos-cement roof coverings over the territory of Lazio Region. Appl. Geomat. 2014, 6, 37–48. [Google Scholar] [CrossRef]
  22. Frassy, F.; Candiani, G.; Rusmini, M.; Maianti, P.; Marchesi, A.; Nodari, F.R.; Via, G.D.; Albonico, C.; Gianinetto, M. Mapping asbestos-cement roofing with hyperspectral remote sensing over a large mountain region of the Italian western alps. Sensors 2014, 14, 15900–15913. [Google Scholar] [CrossRef] [Green Version]
  23. Szabó, S.; Burai, P.; Kovács, Z.; Szabó, G.; Kerényi, A.; Fazekas, I.; Paládi, M.; Buday, T.; Szabó, G. Testing algorithms for the identification of asbestos roofing based on hyperspectral data. Environ. Eng. Manag. J. 2014, 143, 2875–2880. [Google Scholar] [CrossRef]
  24. Hamedianfar, A.; Shafri, H.Z.M.; Mansor, S.; Ahmad, N. Combining data mining algorithm and object-based image analysis for detailed urban mapping of hyperspectral images. J. Appl. Remote Sens. 2014, 8, 085091. [Google Scholar] [CrossRef]
  25. Camps-Valls, G.; Tuia, D.; Gómez-Chova, L.; Jiménez, S.; Malo, J. Remote Sensing Image Processing. Synth. Lect. Image Video Multimed. Process. 2011, 12, 1–194. [Google Scholar] [CrossRef]
  26. De Pinho, C.M.D.; Fonseca, L.M.G.; Korting, T.S.; de Almeida, C.M.; Kux, H.J.H. Land-cover classification of an intra-urban environment using high-resolution images and object-based image analysis. Int. J. Remote Sens. 2012, 33, 5973–5995. [Google Scholar] [CrossRef]
  27. Taherzadeh, E.; Shafri, H.Z.M. Development of a generic model for the detection of roof materials based on an object-based approach using WorldView-2 satellite imagery. Adv. Remote Sens. 2013, 2, 312–321. [Google Scholar] [CrossRef] [Green Version]
  28. Hamedianfar, A.; Shafri, H.Z.M. Detailed intra-urban mapping through transferable OBIA rule sets using WorldView-2 very-high-resolution satellite images. Int. J. Remote Sens. 2015, 36, 3380–3396. [Google Scholar] [CrossRef]
  29. Hamedianfar, A.; Shafri, H.Z.M. Development of fuzzy rule-based parameters for urban object-oriented classification using very high resolution imagery. Geocarto Int. 2014, 29, 268–292. [Google Scholar] [CrossRef]
  30. Hamedianfar, A.; Shafri, H.Z.M.; Mansor, S.; Ahmad, N. Improving detailed rule-based feature extraction of urban areas from WorldView-2 image and lidar data. Int. J. Remote Sens. 2014, 35, 1876–1899. [Google Scholar] [CrossRef]
  31. Abriha, D.; Kovács, Z.; Ninsawat, S.; Bertalan, L.; Balázs, B.; Szabó, S. Identification of roofing materials with Discriminant Function Analysis and Random Forest classifiers on pan-sharpened WorldView-2 imagery—A comparison. Hung. Geogr. Bull. 2018, 67, 375–392. [Google Scholar] [CrossRef] [Green Version]
  32. Norman, M.; Shafri, H.Z.M.; Mansor, S.; Yusuf, B.; Radzali, N.A.W.M. Fusion of multispectral imagery and LiDAR data for roofing materials and roofing surface conditions assessment. Int. J. Remote Sens. 2020, 41, 7090–7111. [Google Scholar] [CrossRef]
  33. Richards, J.A.; Richards, J.A. Remote Sensing Digital Image Analysis; Springer: Berlin/Heidelberg, Germany, 1999. [Google Scholar]
  34. Hughes, G. On the mean accuracy of statistical pattern recognizers. IEEE Trans. Inf. Theory 1968, 14, 55–63. [Google Scholar] [CrossRef] [Green Version]
  35. Kavzoglu, T.; Mather, P.M. The role of feature selection in artificial neural network applications. Int. J. Remote Sens. 2002, 23, 2919–2937. [Google Scholar] [CrossRef]
  36. Hountondji, Y.C.; Sokpon, N.; Ozer, P. Analysis of the vegetation trends using low resolution remote sensing data in Burkina Faso (1982–1999) for the monitoring of desertification. Int. J. Remote Sens. 2006, 27, 871–884. [Google Scholar] [CrossRef] [Green Version]
  37. Neupane, B.; Horanont, T.; Aryal, J. Deep learning-based semantic segmentation of urban features in satellite images: A review and meta-analysis. Remote Sens. 2021, 13, 808. [Google Scholar] [CrossRef]
  38. Blaschke, T.; Strobl, J. What’s wrong with pixels? Some recent developments interfacing remote sensing and GIS. Z. Geoinf. 2001, 14, 12–17. [Google Scholar]
  39. Aggarwal, N.; Dutta, M. Comparative Analysis of Pixel-Based and Object-Based Classification of High Resolution Remote Sensing Images—A Review. Int. J. Eng. Trends Technol. 2016, 38, 5–11. [Google Scholar] [CrossRef]
  40. LeCun, Y.; Bengio, Y.; Hinton, G. Deep learning. Nature 2015, 521, 436–444. [Google Scholar] [CrossRef]
  41. Hossain, M.D.; Chen, D. Segmentation for Object-Based Image Analysis (OBIA): A review of algorithms and challenges from remote sensing perspective. ISPRS J. Photogramm. Remote Sens. 2019, 150, 115–134. [Google Scholar] [CrossRef]
  42. Guo, Z.; Du, S. Mining parameter information for building extraction and change detection with very high-resolution imagery and GIS data. GIScience Remote Sens. 2016, 54, 38–63. [Google Scholar] [CrossRef]
  43. Tremeau, A.; Borel, N. A region growing and merging algorithm to color segmentation. Pattern Recognit. 1997, 30, 1191–1203. [Google Scholar] [CrossRef]
  44. Benz, U.C.; Hofmann, P.; Willhauck, G.; Lingenfelder, I.; Heynen, M. Multi-resolution, object-oriented fuzzy analysis of remote sensing data for GIS-ready information. ISPRS J. Photogramm. Remote Sens. 2004, 58, 239–258. [Google Scholar] [CrossRef]
  45. Minaee, S.; Boykov, Y.Y.; Porikli, F.; Plaza, A.J.; Kehtarnavaz, N.; Terzopoulos, D. Image segmentation using deep learning: A survey. IEEE Trans. Pattern Anal. Mach. Intell. 2021, 44, 3523–3542. [Google Scholar] [CrossRef] [PubMed]
  46. Kavzoglu, T. Increasing the accuracy of neural network classification using refined training data. Environ. Model. Softw. 2009, 24, 850–858. [Google Scholar] [CrossRef]
  47. Gibril, M.B.A.; Idrees, M.O.; Yao, K.; Shafri, H.Z.M. Integrative image segmentation optimization and machine learning approach for high quality land-use and land-cover mapping using multisource remote sensing data. J. Appl. Remote Sens. 2018, 12, 016036. [Google Scholar] [CrossRef]
  48. Drǎguţ, L.; Csillik, O.; Eisank, C.; Tiede, D. Automated parameterisation for multi-scale image segmentation on multiple layers. ISPRS J. Photogramm. Remote Sens. 2014, 88, 119–127. [Google Scholar] [CrossRef] [Green Version]
  49. Vali, A.; Comai, S.; Matteucci, M. Deep learning for land use and land cover classification based on hyperspectral and multispectral earth observation data: A review. Remote Sens. 2020, 12, 2495. [Google Scholar] [CrossRef]
  50. González-Audícana, M.; Otazu, X.; Fors, O.; Alvarez-Mozos, J. A low computational-cost method to fuse IKONOS images using the spectral response function of its sensors. IEEE Trans. Geosci. Remote Sens. 2006, 44, 1683–1690. [Google Scholar] [CrossRef]
  51. Grant, M.J.; Booth, A. A typology of reviews: An analysis of 14 review types and associated methodologies. Health Inf. Libr. J. 2009, 26, 91–108. [Google Scholar] [CrossRef]
  52. Shafri, H.Z.M. Machine Learning in Hyperspectral and Multispectral Remote Sensing Data Analysis. In Artificial Intelligence Science and Technology, Proceedings of the 2016 International Conference on Artificial Intelligence Science and Technology (AIST2016), Shanghai, China, 15–17 July 2016; World Scientific: Singapore, 2016; pp. 3–9. [Google Scholar] [CrossRef]
  53. Zhou, W.; Newsam, S.; Li, C.; Shao, Z. Learning Low Dimensional Convolutional Neural Networks for High-Resolution Remote Sensing Image Retrieval. Remote Sens. 2017, 9, 489. [Google Scholar] [CrossRef] [Green Version]
  54. Rembold, F.; Atzberger, C.; Savin, I.; Rojas, O. Using Low Resolution Satellite Imagery for Yield Prediction and Yield Anomaly Detection. Remote Sens. 2013, 5, 1704–1733. [Google Scholar] [CrossRef] [Green Version]
  55. Braun, A.; Warth, G.; Bachofer, F.; Hochschild, V. Identification of roof materials in high-resolution multispectral images for urban planning and monitoring. In Proceedings of the 2019 Joint Urban Remote Sensing Event (JURSE), Vannes, France, 22–24 May 2019. [Google Scholar] [CrossRef]
  56. Li, X.; Zhou, Y. Urban mapping using DMSP/OLS stable night-time light: A review. Taylor Fr. 2017, 38, 6030–6046. [Google Scholar] [CrossRef]
  57. Berberoglu, S.; Akin, A. Assessing different remote sensing techniques to detect land use/cover changes in the eastern Mediterranean. Int. J. Appl. Earth Obs. Geoinf. 2009, 11, 46–53. [Google Scholar] [CrossRef]
  58. Castagno, J.; Atkins, E. Roof shape classification from LiDAR and satellite image data fusion using supervised learning. Sensors 2018, 18, 3960. [Google Scholar] [CrossRef] [PubMed] [Green Version]
  59. Zhang, B.; Zhang, Y.; Wang, S. A lightweight and discriminative model for remote sensing scene classification with multidilation pooling module. IEEE J. Sel. Top. Appl. Earth Obs. Remote Sens. 2019, 12, 2636–2653. [Google Scholar] [CrossRef]
  60. Cheng, G.; Xie, X.; Han, J.; Guo, L.; Xia, G.-S. Remote sensing image scene classification meets deep learning: Challenges, methods, benchmarks, and opportunities. IEEE J. Sel. Top. Appl. Earth Obs. Remote Sens. 2020, 13, 3735–3756. [Google Scholar] [CrossRef]
  61. Chen, Y.; Zhou, Y.; Ge, Y.; An, R.; Chen, Y. Enhancing land cover mapping through integration of pixel-based and object-based classifications from remotely sensed imagery. Remote Sens. 2018, 10, 77. [Google Scholar] [CrossRef] [Green Version]
  62. Pohl, C.; Van Genderen, J.L. Review article Multisensor image fusion in remote sensing: Concepts, methods and applications. Int. J. Remote Sens. 2010, 19, 823–854. [Google Scholar] [CrossRef] [Green Version]
  63. Dadrass, F.; Samadzadegan, F.; Mehravar, S.; Toosi, A.; Khatami, R.; Stein, A. A review of image fusion techniques for pan-sharpening of high-resolution satellite imagery. ISPRS J. Photogramm. Remote Sens. 2021, 171, 101–117. [Google Scholar] [CrossRef]
  64. Yuhendra; Alimuddin, I.; Sumantyo, J.T.S.; Kuze, H. Assessment of pan-sharpening methods applied to image fusion of remotely sensed multi-band data. Int. J. Appl. Earth Obs. Geoinf. 2012, 18, 165–175. [Google Scholar] [CrossRef]
  65. Hodgson, M.E.; Jensen, J.R.; Tullis, J.A.; Riordan, K.D.; Archer, C.M. Synergistic use of lidar and color aerial photography for mapping urban parcel imperviousness. Photogramm. Eng. Remote Sens. 2003, 69, 973–980. [Google Scholar] [CrossRef] [Green Version]
  66. Zhou, G. Seamless fusion of LiDAR and aerial imagery for building extraction. IEEE Trans. Geosci. Remote Sens. 2014, 52, 7393–7407. [Google Scholar] [CrossRef]
  67. Yu, Q.; Gong, P.; Tian, Y.Q.; Pu, R.; Yang, J. Factors affecting spatial variation of classification uncertainty in an image object-based vegetation mapping. Photogramm. Eng. Remote Sens. 2008, 74, 1007–1018. [Google Scholar] [CrossRef] [Green Version]
  68. Li, M.; Ma, L.; Blaschke, T.; Cheng, L.; Tiede, D. A systematic comparison of different object-based classification techniques using high spatial resolution imagery in agricultural environments. Int. J. Appl. Earth Obs. Geoinf. 2016, 49, 87–98. [Google Scholar] [CrossRef]
  69. Li, P.; Xu, H.; Li, S. Urban impervious surface extraction from very high resolution imagery by one-class support vector machine. In Proceedings of the ISPRS TC VII Symposium—100 Years ISPRS, Vienna, Austria, 5–7 July 2010. [Google Scholar]
  70. Cowen, D.J.; Jensen, J.R.; Bresnahan, P.J.; Ehler, G.B.; Graves, D. The design and implementation of an integrated geographic information system for environmental applications. Photogramm. Eng. Remote Sens. 1995, 61, 1393–1404. [Google Scholar]
  71. Jensen, J.R.; Im, J. Remote sensing change detection in urban environments. In Geo-Spatial Technologies in Urban Environments; Springer: Berlin/Heidelberg, Germany, 2007; pp. 7–31. [Google Scholar]
  72. Myint, S.W.; Gober, P.; Brazel, A.; Grossman-clarke, S.; Weng, Q. Per-pixel vs. object-based classi fi cation of urban land cover extraction using high spatial resolution imagery. Remote Sens. Environ. 2011, 115, 1145–1161. [Google Scholar] [CrossRef]
  73. Lin, S.-K. Introduction to Remote Sensing. Fifth Edition. By James B. Campbell and Randolph H. Wynne, The GuilfordPress, 2011; 662 pages. Price: £80.75, ISBN 978-1-60918-176-5. Remote Sens. 2013, 5, 282–283. [Google Scholar] [CrossRef] [Green Version]
  74. Wu, Z. Superpixel-based unsupervised change detection using multi-dimensional change vector analysis and SVM-based classification. ISPRS Ann. Photogramm. Remote Sens. Spat. Inf. Sci. 2012, I-7, 257–262. [Google Scholar] [CrossRef] [Green Version]
  75. Hay, G.J.; Castilla, G. Geographic Object-Based Image Analysis (GEOBIA): A new name for a new discipline. In Object-Based Image Analysis; Springer: Berlin/Heidelberg, Germany, 2008; pp. 75–89. [Google Scholar]
  76. Blaschke, T.; Hay, G.J.; Kelly, M.; Lang, S.; Hofmann, P.; Addink, E.; Queiroz Feitosa, R.; van der Meer, F.; van der Werff, H.; van Coillie, F.; et al. Geographic Object-Based Image Analysis—Towards a new paradigm. ISPRS J. Photogramm. Remote Sens. 2014, 87, 180–191. [Google Scholar] [CrossRef] [Green Version]
  77. Bioucas-Dias, J.M.; Plaza, A.; Camps-Valls, G.; Scheunders, P.; Nasrabadi, N.M.; Chanussot, J. Hyperspectral remote sensing data analysis and future challenges. IEEE Geosci. Remote Sens. Mag. 2013, 1, 6–36. [Google Scholar] [CrossRef] [Green Version]
  78. Navulur, K. Multispectral Image Analysis Using the Object-Oriented Paradigm; CRC Press: Boca Raton, FL, USA, 2006; pp. 1–155. [Google Scholar]
  79. Zhang, Y.J. Evaluation and comparison of different segmentation algorithms. Pattern Recognit. Lett. 1997, 18, 963–974. [Google Scholar] [CrossRef]
  80. Neubert, M.; Herold, H.; Meinel, G. Assessing image segmentation quality–concepts, methods and application. In Object-Based Image Analysis; Springer: Berlin/Heidelberg, Germany, 2008; pp. 769–784. [Google Scholar] [CrossRef]
  81. Su, T.; Zhang, S. Local and global evaluation for remote sensing image segmentation. ISPRS J. Photogramm. Remote Sens. 2017, 130, 256–276. [Google Scholar] [CrossRef]
  82. Mountrakis, G.; Im, J.; Ogole, C. Support vector machines in remote sensing: A review. ISPRS J. Photogramm. Remote Sens. 2011, 66, 247–259. [Google Scholar] [CrossRef]
  83. Pal, N.R.; Pal, S.K. A review on image segmentation techniques. Pattern Recognit. 1993, 26, 1277–1294. [Google Scholar] [CrossRef]
  84. Costa, H.; Foody, G.M.; Boyd, D.S. Supervised methods of image segmentation accuracy assessment in land cover mapping. Remote Sens. Environ. 2018, 205, 338–351. [Google Scholar] [CrossRef] [Green Version]
  85. Kavzoglu, T.; Tonbul, H. A comparative study of segmentation quality for multi-resolution segmentation and watershed transform. In Proceedings of the 8th International Conference on Recent Advances in Space Technologies, RAST 2017, Istanbul, Turkey, 19–22 June 2017; pp. 113–117. [Google Scholar] [CrossRef]
  86. Tautz, D. Segmentation. Dev. Cell 2004, 7, 301–312. [Google Scholar] [CrossRef] [PubMed] [Green Version]
  87. Zhou, Y.T.; Venkateswar, V.; Chellappa, R. Edge Detection and Linear Feature Extraction Using a 2-D Random Field Model. IEEE Trans. Pattern Anal. Mach. Intell. 1989, 11, 84–95. [Google Scholar] [CrossRef]
  88. Lu, Y.; Jain, R.C. Behavior of Edges in Scale Space. IEEE Trans. Pattern Anal. Mach. Intell. 1989, 11, 337–356. [Google Scholar] [CrossRef]
  89. Pong, T.C.; Shapiro, L.G.; Watson, L.T.; Haralick, R.M. Experiments in segmentation using a facet model region grower. Comput. Vis. Graph. Image Process. 1984, 25, 1–23. [Google Scholar] [CrossRef]
  90. Cao, W.; Li, J.; Liu, J.; Zhang, P. Two improved segmentation algorithms for whole cardiac CT sequence images. In Proceedings of the 2016 9th International Congress on Image and Signal Processing, BioMedical Engineering and Informatics (CISP-BMEI), Datong, China, 15–17 October 2016. [Google Scholar]
  91. Shih, F.Y.; Cheng, S. Adaptive mathematical morphology for edge linking. Inf. Sci. 2004, 167, 9–21. [Google Scholar] [CrossRef]
  92. Martin, D.R.; Fowlkes, C.C.; Malik, J. Learning to detect natural image boundaries using local brightness, color, and texture cues. IEEE Trans. Pattern Anal. Mach. Intell. 2004, 26, 530–549. [Google Scholar] [CrossRef] [PubMed]
  93. Jin, X.; Paswaters, S. A fuzzy rule base system for object-based feature extraction and classification. In Proceedings of the Defense and Security Symposium, Orlando, FL, USA, 9–13 April 2007; Volume 6567, pp. 547–558. [Google Scholar] [CrossRef]
  94. Guindon, B. Computer-Based Aerial Image Understanding: A Review and Assessment of its Application to Planimetric Information Extraction from Very High Resolution Satellite Images. Can. J. Remote Sens. 2014, 23, 38–47. [Google Scholar] [CrossRef] [Green Version]
  95. Zhang, Y.; Sorjonen-ward, P.; Ord, A.; Southgate, P.N. Numerical Modelling of Fluid Flow During Structural Closure of the Isa Superbasin in the Lawn Hill Platform, Northern Australia. ASEG Ext. Abstr. 2019, 2006, 1–5. [Google Scholar] [CrossRef]
  96. Ohta, Y.I.; Kanade, T.; Sakai, T. Color information for region segmentation. Comput. Graph. Image Process. 1980, 13, 222–241. [Google Scholar] [CrossRef]
  97. Fan, J.; Yau, D.K.Y.; Elmagarmid, A.K.; Aref, W.G. Automatic image segmentation by integrating color-edge extraction and seeded region growing. IEEE Trans. Image Process. 2001, 10, 1454–1466. [Google Scholar] [CrossRef] [PubMed] [Green Version]
  98. Adams, R.; Bischof, L. Seeded Region Growing. IEEE Trans. Pattern Anal. Mach. Intell. 1994, 16, 641–647. [Google Scholar] [CrossRef] [Green Version]
  99. Kim, M.; Warner, T.A.; Madden, M.; Atkinson, D.S. Multi-scale GEOBIA with very high spatial resolution digital aerial imagery: Scale, texture and image objects. Int. J. Remote Sens. 2011, 32, 2825–2850. [Google Scholar] [CrossRef]
  100. Smith, A. Image segmentation scale parameter optimization and land cover classification using the Random Forest algorithm. J. Spat. Sci. 2010, 55, 69–79. [Google Scholar] [CrossRef]
  101. Belgiu, M.; Drǎguţ, L.; Strobl, J. Quantitative evaluation of variations in rule-based classifications of land cover in urban neighbourhoods using WorldView-2 imagery. ISPRS J. Photogramm. Remote Sens. 2014, 87, 205–215. [Google Scholar] [CrossRef] [PubMed] [Green Version]
  102. Hussain, M.; Chen, D.; Cheng, A.; Wei, H.; Stanley, D. Change detection from remotely sensed images: From pixel-based to object-based approaches. ISPRS J. Photogramm. Remote Sens. 2013, 80, 91–106. [Google Scholar] [CrossRef]
  103. Arbiol, R.; Zhang, Y.; Comellas, V.P. Advanced classification techniques: A review. Rev. Catalana Geogr. 2007, 12, 1–4. [Google Scholar]
  104. Drǎguţ, L.; Eisank, C. Automated object-based classification of topography from SRTM data. Geomorphology 2012, 141–142, 21–33. [Google Scholar] [CrossRef] [Green Version]
  105. Martha, T.R.; Kerle, N.; van Westen, C.J.; Jetten, V.; Vinod Kumar, K. Object-oriented analysis of multi-temporal panchromatic images for creation of historical landslide inventories. ISPRS J. Photogramm. Remote Sens. 2012, 67, 105–119. [Google Scholar] [CrossRef]
  106. Johnson, B.; Xie, Z. Unsupervised image segmentation evaluation and refinement using a multi-scale approach. ISPRS J. Photogramm. Remote Sens. 2011, 66, 473–483. [Google Scholar] [CrossRef]
  107. Hadavand, A.; Saadatseresht, M.; Homayouni, S. Segmentation parameter selection for object-based land-cover mapping from ultra high resolution spectral and elevation data. Int. J. Remote Sens. 2017, 38, 3586–3607. [Google Scholar] [CrossRef]
  108. Tseng, M.H.; Chen, S.J.; Hwang, G.H.; Shen, M.Y. A genetic algorithm rule-based approach for land-cover classification. ISPRS J. Photogramm. Remote Sens. 2008, 63, 202–212. [Google Scholar] [CrossRef]
  109. Marino, C.M.; Panigada, C.; Busetto, L. Airborne hyperspectral remote sensing applications in urban areas: Asbestos concrete sheeting identification and mapping. In Proceedings of the IEEE/ISPRS Joint Workshop on Remote Sensing and Data Fusion over Urban Areas (Cat. No. 01EX482), Rome, Italy, 8–9 November 2001; pp. 212–216. [Google Scholar]
  110. Campbell, J.B.; Wynne, R.H. Introduction to Remote Sensing; Guilford Press: New York, NY, USA, 2011. [Google Scholar]
  111. Ma, L.; Li, M.; Ma, X.; Cheng, L.; Du, P.; Liu, Y. A review of supervised object-based land-cover image classification. ISPRS J. Photogramm. Remote Sens. 2017, 130, 277–293. [Google Scholar] [CrossRef]
  112. Ma, L.; Cheng, L.; Li, M.; Liu, Y.; Ma, X. Training set size, scale, and features in Geographic Object-Based Image Analysis of very high resolution unmanned aerial vehicle imagery. ISPRS J. Photogramm. Remote Sens. 2015, 102, 14–27. [Google Scholar] [CrossRef]
  113. Rougier, S.; Puissant, A.; Stumpf, A.; Lachiche, N. Comparison of sampling strategies for object-based classification of urban vegetation from Very High Resolution satellite images. Int. J. Appl. Earth Obs. Geoinf. 2016, 51, 60–73. [Google Scholar] [CrossRef]
  114. Laliberte, A.S.; Browning, D.M.; Rango, A. A comparison of three feature selection methods for object-based classification of sub-decimeter resolution UltraCam-L imagery. Int. J. Appl. Earth Obs. Geoinf. 2012, 15, 70–78. [Google Scholar] [CrossRef]
  115. Whiteside, T.G.; Maier, S.W.; Boggs, G.S. Area-based and location-based validation of classified image objects. Int. J. Appl. Earth Obs. Geoinf. 2014, 28, 117–130. [Google Scholar] [CrossRef]
  116. Lu, D.; Weng, Q. A survey of image classification methods and techniques for improving classification performance. Int. J. Remote Sens. 2007, 28, 823–870. [Google Scholar] [CrossRef]
  117. Chen, D.; Stow, D. The effect of training strategies on supervised classification at different spatial resolutions. Photogramm. Eng. Remote Sens. 2002, 68, 1155–1162. [Google Scholar]
  118. Mather, P.M.; Koch, M. Computer Processing of Remotely-Sensed Images: An Introduction; John Wiley & Sons: Hoboken, NJ, USA, 2011. [Google Scholar]
  119. Hubert-Moy, L.; Cotonnec, A.; Le Du, L.; Chardin, A.; Perez, P. A Comparison of Parametric Classification Procedures of Remotely Sensed Data Applied on Different Landscape Units. Remote Sens. Environ. 2001, 75, 174–187. [Google Scholar] [CrossRef]
  120. Weng, Q. Remote sensing of impervious surfaces in the urban areas: Requirements, methods, and trends. Remote Sens. Environ. 2012, 117, 34–49. [Google Scholar] [CrossRef]
  121. Pax-Lenney, M.; Woodcock, C.E.; Macomber, S.A.; Gopal, S.; Song, C. Forest mapping with a generalized classifier and Landsat TM data. Remote Sens. Environ. 2001, 77, 241–250. [Google Scholar] [CrossRef]
  122. Albert, T.H. Evaluation of Remote Sensing Techniques for Ice-Area Classification Applied to the Tropical Quelccaya Ice Cap, Peru. Polar Geogr. 2011, 26, 210–226. [Google Scholar] [CrossRef]
  123. BOLSTAD, P.; Lillesand, T. Rule-based classification models- Flexible integration of satellite imagery and thematic spatial data. Photogramm. Eng. Remote Sens. 1992, 58, 965–971. [Google Scholar]
  124. Lawrence, R.L.; Wright, A. Rule-based classification systems using classification and regression tree (CART) analysis. Photogramm. Eng. Remote Sens. 2001, 67, 1137–1142. [Google Scholar]
  125. Hansen, M.; Dubayah, R.; Defries, R. Classification trees: An alternative to traditional land cover classifiers. Int. J. Remote Sens. 2007, 17, 1075–1081. [Google Scholar] [CrossRef]
  126. Gu, X.; Angelov, P.P. Semi-supervised deep rule-based approach for image classification. Appl. Soft Comput. J. 2018, 68, 53–68. [Google Scholar] [CrossRef] [Green Version]
  127. Pal, M.; Mather, P.M. An assessment of the effectiveness of decision tree methods for land cover classification. Remote Sens. Environ. 2003, 86, 554–565. [Google Scholar] [CrossRef]
  128. Borak, J.S. Feature selection and land cover classification of a MODIS-like data set for a semiarid environment. Int. J. Remote Sens. 1999, 20, 919–938. [Google Scholar] [CrossRef]
  129. Roe, B.P.; Yang, H.J.; Zhu, J.; Liu, Y.; Stancu, I.; McGregor, G. Boosted decision trees as an alternative to artificial neural networks for particle identification. Nucl. Instrum. Methods Phys. Res. Sect. A Accel. Spectrometers Detect. Assoc. Equip. 2005, 543, 577–584. [Google Scholar] [CrossRef] [Green Version]
  130. Hamedianfar, A.; Barakat, A.; Gibril, M. Large-scale urban mapping using integrated geographic object-based image analysis and artificial bee colony optimization from worldview-3 data. Int. J. Remote Sens. 2019, 40, 6796–6821. [Google Scholar] [CrossRef]
  131. Xu, H. Rule-based impervious surface mapping using high spatial resolution imagery. Int. J. Remote Sens. 2012, 34, 27–44. [Google Scholar] [CrossRef]
  132. Kohli, D.; Warwadekar, P.; Kerle, N.; Sliuzas, R.; Stein, A. Transferability of Object-Oriented Image Analysis Methods for Slum Identification. Remote Sens. 2013, 5, 4209–4228. [Google Scholar] [CrossRef] [Green Version]
  133. Donnay, J.-P.; Barnsley, M.; Longley, P. Remote Sensing and Urban Analysis—Introduction; CRC Press: Boca Raton, FL, USA, 2001. [Google Scholar]
  134. Hofmann, P.; Blaschke, T.; Strobl, J. Quantifying the robustness of fuzzy rule sets in object-based image analysis. Int. J. Remote Sens. 2011, 32, 7359–7381. [Google Scholar] [CrossRef]
  135. Stumpf, A.; Kerle, N. Object-oriented mapping of landslides using Random Forests. Remote Sens. Environ. 2011, 115, 2564–2577. [Google Scholar] [CrossRef]
  136. Abunadi, I.; Albraikan, A.A.; Alzahrani, J.S.; Eltahir, M.M.; Hilal, A.M.; Eldesouki, M.I.; Motwakel, A.; Yaseen, I. An Automated Glowworm Swarm Optimization with an Inception-Based Deep Convolutional Neural Network for COVID-19 Diagnosis and Classification. Healthcare 2022, 10, 697. [Google Scholar] [CrossRef]
  137. Bacanin, N.; Zivkovic, M.; Al-Turjman, F.; Venkatachalam, K.; Trojovský, P.; Strumberger, I.; Bezdan, T. Hybridized sine cosine algorithm with convolutional neural networks dropout regularization application. Sci. Rep. 2022, 12, 6302. [Google Scholar] [CrossRef]
  138. Pan, S.J.; Yang, Q. A survey on transfer learning. IEEE Trans. Knowl. Data Eng. 2010, 22, 1345–1359. [Google Scholar] [CrossRef]
  139. Wang, H.; Wang, Y.; Zhang, Q.; Xiang, S.; Pan, C. Gated Convolutional Neural Network for Semantic Segmentation in High-Resolution Images. Remote Sens. 2017, 9, 446. [Google Scholar] [CrossRef] [Green Version]
  140. Liu, Y.; Piramanayagam, S.; Monteiro, S.T.; Saber, E. Semantic segmentation of multisensor remote sensing imagery with deep ConvNets and higher-order conditional random fields. J. Appl. Remote Sens. 2019, 13, 016501. [Google Scholar] [CrossRef] [Green Version]
  141. Panboonyuen, T.; Jitkajornwanich, K.; Lawawirojwong, S.; Srestasathiern, P.; Vateekul, P. Semantic Segmentation on Remotely Sensed Images Using an Enhanced Global Convolutional Network with Channel Attention and Domain Specific Transfer Learning. Remote Sens. 2019, 11, 83. [Google Scholar] [CrossRef] [Green Version]
  142. Ji, S.; Wei, S.; Lu, M. A scale robust convolutional neural network for automatic building extraction from aerial and satellite imagery. Int. J. Remote Sens. 2018, 40, 3308–3322. [Google Scholar] [CrossRef]
  143. Mou, L.; Zhu, X.X. RiFCN: Recurrent network in fully convolutional network for semantic segmentation of high resolution remote sensing images. arXiv 2018, arXiv:1805.02091. [Google Scholar]
  144. Long, J.; Shelhamer, E.; Darrell, T. Fully convolutional networks for semantic segmentation. In Proceedings of the IEEE Conference on Computer Vision and Pattern Recognition, Boston, MA, USA, 7–12 June 2015; pp. 3431–3440. [Google Scholar]
  145. Wang, F. Fuzzy Supervised Classification of Remote Sensing Images. IEEE Trans. Geosci. Remote Sens. 1990, 28, 194–201. [Google Scholar] [CrossRef] [Green Version]
  146. Yang, L.; Xian, G.; Klaver, J.M.; Deal, B. Urban land-cover change detection through sub-pixel imperviousness mapping using remotely sensed data. Photogramm. Eng. Remote Sens. 2003, 69, 1003–1010. [Google Scholar] [CrossRef]
  147. Deng, C.; Wu, C. A spatially adaptive spectral mixture analysis for mapping subpixel urban impervious surface distribution. Remote Sens. Environ. 2013, 133, 62–70. [Google Scholar] [CrossRef]
  148. Rasti, B.; Hong, D.; Hang, R.; Ghamisi, P.; Kang, X.; Chanussot, J.; Benediktsson, J.A. Feature Extraction for Hyperspectral Imagery: The Evolution from Shallow to Deep: Overview and Toolbox. IEEE Geosci. Remote Sens. Mag. 2020, 8, 60–88. [Google Scholar] [CrossRef]
  149. Zou, Q.; Ni, L.; Zhang, T.; Wang, Q. Deep Learning Based Feature Selection for Remote Sensing Scene Classification. IEEE Geosci. Remote Sens. Lett. 2015, 12, 2321–2325. [Google Scholar] [CrossRef]
  150. Han, W.; Feng, R.; Wang, L.; Cheng, Y. A semi-supervised generative framework with deep learning features for high-resolution remote sensing image scene classification. ISPRS J. Photogramm. Remote Sens. 2018, 145, 23–43. [Google Scholar] [CrossRef]
  151. Li, Y.; Zhang, H.; Xue, X.; Jiang, Y.; Shen, Q. Deep learning for remote sensing image classification: A survey. WIREs Data Min. Knowl. Discov. 2018, 8, e1264. [Google Scholar] [CrossRef] [Green Version]
  152. Kavzoglu, T.; Tonbul, H.; Yildiz Erdemir, M.; Colkesen, I. Dimensionality Reduction and Classification of Hyperspectral Images Using Object-Based Image Analysis. J. Indian Soc. Remote Sens. 2018, 46, 1297–1306. [Google Scholar] [CrossRef]
  153. Duro, D.C.; Franklin, S.E.; Dubé, M.G. A comparison of pixel-based and object-based image analysis with selected machine learning algorithms for the classification of agricultural landscapes using SPOT-5 HRG imagery. Remote Sens. Environ. 2012, 118, 259–272. [Google Scholar] [CrossRef]
  154. Blaschke, T. Object based image analysis for remote sensing. ISPRS J. Photogramm. Remote Sens. 2010, 65, 2–16. [Google Scholar] [CrossRef] [Green Version]
  155. Norman, M.; Mohd Shafri, H.Z.; Idrees, M.O.; Mansor, S.; Yusuf, B. Spatio-statistical optimization of image segmentation process for building footprint extraction using very high-resolution WorldView 3 satellite data. Geocarto Int. 2020, 35, 1124–1147. [Google Scholar] [CrossRef]
  156. Arvor, D.; Durieux, L.; Andrés, S.; Laporte, M.-A. Advances in Geographic Object-Based Image Analysis with ontologies: A review of main contributions and limitations from a remote sensing perspective. ISPRS J. Photogramm. Remote Sens. 2013, 82, 125–137. [Google Scholar] [CrossRef]
  157. Marpu, P.R.; Neubert, M.; Herold, H.; Niemeyer, I. Enhanced evaluation of image segmentation results. J. Spat. Sci. 2010, 55, 55–68. [Google Scholar] [CrossRef]
  158. Martha, T.R.; Kerle, N.; Van Westen, C.J.; Jetten, V.; Kumar, K.V. Segment optimization and data-driven thresholding for knowledge-based landslide detection by object-based image analysis. IEEE Trans. Geosci. Remote Sens. 2011, 49, 4928–4943. [Google Scholar] [CrossRef]
Figure 1. The general procedure of the reviewed studies of ACM roof mapping.
Sustainability 14 08068 g001
Figure 2. The research workflow.
Sustainability 14 08068 g002
Figure 3. Comparison of a 4 m wide object and image data with a resolution of 2 × 2 m. Only one pixel contains a pure spectral response from the object.
Sustainability 14 08068 g003
Figure 4. Multiscale edge-based segmentation of HSI (Reprinted/adapted with permission from Ref. [24]).
Sustainability 14 08068 g004
Figure 5. Definition of proposed rule sets for mapping ACM roofs (Reprinted/adapted with permission from Ref. [10]).
Sustainability 14 08068 g005
Figure 6. General framework of deep learning for spectral–spatial feature classification (Reprinted/adapted with permission from Ref. [151]).
Sustainability 14 08068 g006
Figure 7. A tree diagram of the reviewed studies on ACM roof mapping [10,11,12,13,20,21,22,23,24,26,27,28,29,30,31,32].
Sustainability 14 08068 g007
Table 1. The summary of the conducted studies associated with ACM roof mapping using airborne HSI.
ImagerySpectral ChannelsSpatial ResolutionResearch Purpose
MIVIS102 channels
from 433 to 1270 nm
4–9 mMapping ACM roofing [22]
4 mMapping ACM roofing [20]
3 mMapping ACM roofing [13,21]
AISA Eagle II126 channels
from 400 to 1000 nm
1 mMapping ACM roofing [23]
AISA Classic20 channels
from 400 to 970 nm
1 mMapping intra-urban land cover, including one ACM class [24]
AISA Eagle128 channels
from 400 to 970 nm
0.68 mMapping intra-urban land cover, including one ACM class [24]
Table 2. The summary of the conducted studies associated with ACM roof mapping using multispectral imagery (MSI).
ImageryImagery
Resolution
Band
Composition
Research Purpose
WV-2Panchromatic: 0.5 m
Multispectral: 1.85 m
Eight bandsMapping ACM roofing [10]
Mapping roofing materials, including one ACM class [27,31]
Mapping impervious and pervious surfaces, including one ACM class [29]
Mapping intra-urban land cover including three ACM classes [28]
Eight bands
Fusion with LiDAR
Mapping intra-urban land cover, including one ACM class [30]
WV-3Panchromatic: 0.31 m
Multispectral: 1.24 m
Eight bandsMapping ACM roofing [11]
Eight bands
Fusion with LiDAR
Mapping roofing materials, including two ACM classes [32]
Aerial imagerySpatial: 0.25 mRGB and CIRMapping ACM roofing [12]
IKONOS IIPanchromatic: 1 m
Multispectral: 4 m
Four bands
(Blue, Green, Red, and Near-infrared)
Mapping intra-urban land cover including three ACM classes [26]
Table 3. The summary of PBIA studies for ACM roof mapping.
AuthorsClassification/Segmentation MethodClassifierAccuracy Result %
Fiumi et al. (2012) [20]PBIASpectral Angle Mapper (SAM)OA: 88, PA (ACM class): 94.3
Fiumi et al. (2014) [21]PBIASpectral Angle Mapper (SAM)OA: 65
Frassy et al. (2014) [22]PBIASpectral Angle Mapper (SAM)OA: 80, PA (ACM class): 43
Szabó et al. (2014) [23]PBIASpectral Angle Mapper (SAM), Support Vector Machine (SVM)SVM OA: 79.9
SAM OA: 59.8
Krowczynska et al. (2020) [12]Pixel-based DLConvolutional Neural Networks (CNN)OA: 89, PA: 89, UA: 88 (ACM class)
Abriha et al. (2018) [31]PBIADiscriminant Function Analysis (DFA), Random Forest (RF)OA: 85
Tommasini et al. (2019) [11]PBIARandom Forest (RF)OA: 82
Table 4. The summary of the OBIA studies for ACM roof mapping.
AuthorsImagery TypeSegmentationClassificationAccuracy Result %
Pinho et al. (2012) [26]IKONOS IIRegion-based segmentation
(MRS)
Supervised
Decision Tree (DT)
OA: 71.91
PA (ACM class): 38–90
Taherizade et al. (2013) [27]WV-2Multiscale Edge-based segmentation
(ENVI Feature Extraction tool)
Supervised
(Maximum Likelihood)
Rule based
Per pixel
Supervised OA: 46, Rule-based OA: 82, PA (ACM class): 80, 95
Hamedianfar et al. (2014) [29]WV-2Edge-based segmentation
(ENVI Feature Extraction tool)
Supervised
(SVM)
Rule based
Per pixel
Supervised OA: 82.80, Rule-based OA: 85–87, PBIA OA: 73–77
Hamedianfar et al. (2014) [30]Fusion of WV-2 with LiDAREdge-based segmentation
(ENVI Feature Extraction tool)
Rule basedOA: 92.84, PA: 81, UA: 93 (ACM class)
Hamedianfar et al. (2014) [24]AISA ClassicEdge-based segmentation
(ENVI Feature Extraction tool)
Supervised
(DT)
OA: 93.42, PA and UA (ACM class): 100
Hamedianfar et al. (2015) [28]WV-2Edge-based segmentation
(ENVI Feature Extraction tool)
Rule-basedOA: 88, PA: 96, UA: 84 (ACM class)
Gibril et al. (2017) [10]WV-2Optimised Region-based segmentation
(MRS) by Taguchi optimisation technique
Supervised
(Bayes, k-NN, SVM, and RF)
Rule based
Supervised OA: 72–82, Rule-based OA: 90–93
Norman et al. (2020) [32]Fusion of WV-3 and LiDAROptimised Region-based segmentation
(MRS) by Taguchi optimisation technique
Supervised
(SVM, DT)
SVM OA: 70, DT: 87
Table 5. The summary of the reviewed studies of ACM roof mapping.
AuthorsImagery TypeSensorClassification
Approach
ClassifierHighest Accuracy Result %
Fiumi et al., 2012 [20]HSIMIVISPBIASAMOA: 88
PA: 94
Fiumi et al., 2014 [21]HSIMIVISPBIASAMOA: 65
Frassy et al., 2014 [22]HSIMIVISPBIASAMOA 80
PA: 43
Szabó et al., 2014 [23]HSIMIVISPBIASVMOA: 79.9
Cilia et al., 2015 [13]HSIAISA Eagle IIPBIASAMUA: 86
PA: 89
Hamedianfar et al., 2014 [24]HSIAISA Classic
AISA Eagle
OBIADTOA: 93
De Pinho et al., 2012 [26]MSIIKONOS IIOBIADTOA: 71.91
Taherzade et al., 2013 [27]MSIWV-2OBIADTOA: 82
Hamedianfar et al., 2014 [29]MSIWV-2OBIARule basedOA: 87
Hamedianfar et al., 2014 [30]Fusion of MSI and LiDARWV-2OBIARule basedOA: 92.84
Hamedianfar et al., 2015 [28]MSIWV-2OBIARule based OA: 88
Gibril et al., 2017 [10]MSIWV-2OBIARule basedOA: 93
Abriha et al., 2018 [31]MSIWV-2PBIARFOA: 85
Tommasini et al., 2019 [11]MSIWV-3PBIARFOA: 82
Norman et al., [32]Fusion of MSI and LiDARWV-3OBIADTOA: 87
Krowczynska et al., 2020 [12]MSIAerial imageryDLCNNOA: 89
PA: 89
UA: 88
Table 6. The synthesis of major challenges and opportunities in ACM roof mapping studies.
ItemChallengeAreaEffectOpportunity
1The low spatial resolution of early HSI classified by traditional PBIA [13,20,21,22,23] HSIOmission Error [13,20]DL-based semantic classification (e.g., 3D-CNN and FCN) [141,142,145]
2High dimensionality [23,24]HSICurse of dimensionality [34]
Inter-class confusions [35]
Noisy map [36]
Dimensionality reduction techniques (e.g., SFS and PCA) and OBIA classification [23,152,153]
3Complex patterns of surface materials in VHR MSI and traditional PBIA [10,11,26,27,28,29,30,31,32] MSIWithin-class spectral variability
Between-class spectral similarity
Salt-and-pepper error [37,154]
The fusion of MSI with LiDAR and OBIA classification [30,32]
4Non-optimised segmentation parameters (over- or under-segmentation) [28,30]OBIALow classification accuracy, mixed objects [155]Taguchi optimisation technique [32,47,130,155], and DL-based image segmentation methods such as Mask R-CNN [45], Fusion of segmentation with classification [41,42,107,115]
5Inadequate training data
(size and
representativeness) [111,112]
SupervisedLow classification accuracy, limitation in transferability and autonomous ACM roof classification areas [117,118]Adopting a training samples size 30 times greater than the number of RSI spectral bands [118] using advanced non-parametric classifiers (e.g., RF and SVM) [46]
Using expert systems [10,32]
6Analyst’s subjectivity [101,105,153,156]Expert systemsBiased or error-prone results [101,105,153,156]Adopting automatic induction (i.e., data mining) methods [24,65,120]
DL-based end-to-end semantic classification [49]
Publisher’s Note: MDPI stays neutral with regard to jurisdictional claims in published maps and institutional affiliations.

