Systematic Review

Service Quality of Bus Performance in Asia: A Systematic Literature Review and Conceptual Framework

by
Muhammad Fadhlullah Abu Bakar
1,*,
Shuhairy Norhisham
1,2,
Herda Yati Katman
1,2,
Chow Ming Fai
3,
Nor Najwa Irina Mohd Azlan
1 and
Nur Sarah Shaziah Samsudin
1
1
Department of Civil Engineering, College of Engineering, Universiti Tenaga Nasional, Kajang 43000, Selangor, Malaysia
2
Institute of Energy Infrastructure (IEI), Universiti Tenaga Nasional, Kajang 43000, Selangor, Malaysia
3
Discipline of Civil Engineering, School of Engineering, Monash University Malaysia, Jalan Lagoon Selatan, Bandar Sunway 47500, Selangor, Malaysia
*
Author to whom correspondence should be addressed.
Sustainability 2022, 14(13), 7998; https://doi.org/10.3390/su14137998
Submission received: 6 May 2022 / Revised: 16 June 2022 / Accepted: 21 June 2022 / Published: 30 June 2022

Abstract

:
Bus services have played a significant role in public transportation, especially in urban areas throughout the years. Since bus services compete greatly with other types of public transportation, such as e-hailing services and private vehicles, they have recently attracted scholars to conduct many relevant studies. However, research in assessing public transport networks in urban areas by researchers by using systematic literature review is lacking. There are definitive gaps between quality standards set by the transportation regulatory authority and what bus operators can provide based on their obligations. Therefore, the present study had concentrated on the service quality of bus services in Asia by using the systematic literature review of articles. This study was based on previous studies, specifically on service quality of performance. Several previous studies were selected by using the Preferred Reporting Items for Systematic Reviews and Meta-Analyses (PRIMSA) approach. SCOPUS and Science Direct were chosen as the main journal database. Through this approach, 41 articles were selected for further analysis. This study was focused on three primary themes: study approach, stakeholders, and service quality attributes. An advanced analysis on these primary themes was used to formulate another 18 sub-themes. All themes and sub-themes which reflected the significant impacts of service quality towards bus services were discussed in detail. This study addressed several qualities of bus services and bus performance in regard to the improvement of urban transportation polices. Several recommendations that can provide necessary knowledge and information for future research were also presented.

1. Introduction

Over the last decade, developed and developing countries in the Asian region had experienced a tremendous growth in urbanisation, and this process caused people to migrate from the rural to urban areas [1]. Consequently, new development of urban areas and increased living standards have escalated the daily traffic volume [2,3]. The World Health Organisation emphasised that global urbanisation is a process that is changing the social and environmental settings on every continent as the population migration occurs from rural to urban areas, causing a natural demographic growth [4,5]. To cater the huge population demand and reduce daily traffic densities on roads and highways [6,7], public transportation in urban areas have become critical challenges, especially in growing and developing countries, and it should be accessible to user age groups as well [8,9]. Congestion levels carry several challenges in urban mobility systems [10]. Competition with other sources of transportation has recently, increased; hence, to ensure that bus services are the preferred mode of travel the service quality of bus services needs to be quickly revised. Insufficient public transit systems can be relieved by providing a flexible travel mode choice [11].
In addition, some researchers emphasised that previously bus services had a significant impact on human life, and there was demand for an effective public transportation system to accommodate people’s movement. Research in assessing public transport networks in urban areas is lacking and their implications for urban mobility were less emphasised by researchers [12]. Therefore, it is essential to conduct an in-depth analysis which specifically targets the bus performance by measuring all related aspects of services provided by operators, specifically about quality and understanding the passenger, user perceptions, and expectations towards the services [13]. Passengers and user perceptions should be essential factors for operators and authorities to create significant implementations for bus services in urban areas [14]. A positive perspective towards a specific transport mode often results in higher travel satisfaction towards that transport mode [15].
On another note, the quality of services in public transportation is a measurement of the level of services provided by its operators to serve passengers and users. The increase in quality of service (QOS) for public transportation is attracting new passengers from private vehicles to switch to the public transportation system. Therefore, level of service (LOS) rating is used as a significant global assessment of transportation infrastructure to determine the service quality according to specific elements [16]. Passenger feedback can help to improve the LOS criteria, quality, and performance [17,18]. Good quality of service could be a factor to boost trade and commerce. Good quality of service not only contributes to improve environmental aspects, but also supports the population growth capacity. In addition, the quality of service assessment process involves subjective and heterogeneous data [19], the limitation of last-mile networks [20,21], and accessibility provided by the operator [22]. There are definitive gaps between quality standards set by the transportation regulatory authority and what bus operators can provide based on their obligations [23]. How do policy makers deal with a variety of interests and objectives which characterise bus stakeholders by providing a significant impact on policies to measure the service quality of bus services? [24]. How can the tension between policy formulation and operator views be addressed, as both have their specific purposes for public transportation and mobility as a service (MaaS)? [25]. This research provides an essential systematic literature review, including several significant attributes towards transportation polices, particularly when considering that research related to the service quality of bus performance is lacking. Various attributes should be reviewed and rectified to upgrade the quality of services, specifically for bus performance. Therefore, this study is concentrated on the service quality of bus services in Asia by using a systematic literature review of articles.

The Demand for a Systematic Literature Study

Researchers have addressed that the use of a systematic literature review can elucidate both quantitative and qualitative approaches in a literature study. This approach comprises identifying, evaluating, and combining all necessary and accessible data to produce and generate an outcome by using significant methods to engage the research questions. A systematic review can offer certain advantages in contrast to the conventional literature review approach. This review method can be enhanced through a correct and transparent retrieving technique of the literature review. On the other hand, research bias can be reduced by having eminent topics and an increased research scope with a notable objective. Apart from that, a systematic review encourages authors to develop significant evidence and produce a quality discussion [26].
A substantial number of systematic literature reviews that were linked to studies of service quality are found all over the world. Unfortunately, studies conducted on the service quality of bus services in Asia region are insufficient. Most available literature studies were focused on developed countries in European and American regions. Literature studies were also specific to three different perspectives, namely engineering, social science, and Internet of Things (IOT) [27]. Several problems on current situations have led researchers to understand the existing issues that arise from the related service quality of bus services, such as inconsistency on planned programmes, issues raised by stakeholder, and ability of bus operators to manage bus services. Therefore, this study attempts to perform a systematic literature review on the pertinent studies to fulfil the gap by analysing the outcome of previous studies on the service quality of bus services in Asia. The study was affected by each attribute of service quality. The present study is vital because current studies would provide current issues and problems related to stakeholder concerns in determining the quality of services, specifically on bus performance. This review would explain in detail the related reviewing processes which were adopted in the study, such as identification of keywords, article screening, article eligibility, and database usage. The method would facilitate potential researchers to recreate investigations, approve the understanding, or analyse the extent of information [28]. Furthermore, this study is important because the peer literature review provides information that can assist researchers to deliver the prospects and understand future attentions that are related to service quality and necessitate attention from researchers and scholars in the future.
In this study, the main research question for the current systematic literature review development was “How does service quality affect the bus performance in urban areas?”. The principal focus of research was previously produced. Specifically, further explanation must be addressed to each attribute as a fundamental issue that affects the whole service performance because each attribute was predicted to significantly influence bus services in urban areas due to the high expectation of passengers and users. Furthermore, the necessity in conducting a systematic literature review of services quality is also discussed in detail. In addition, Section 2 presents a suitable approach to answer the formulated research question. Section 3 explains the systematic literature review process and synthesises of scientific methods of previous studies so as to identify, determine, and assess the significance of study on the service quality of bus services in Asia region. In Section 4, the outcome from this study discusses the counter measures to improve the service quality of bus services by implementing specific policies that could be addressed by future policy makers, authority, and regulators.

2. Material and Methods
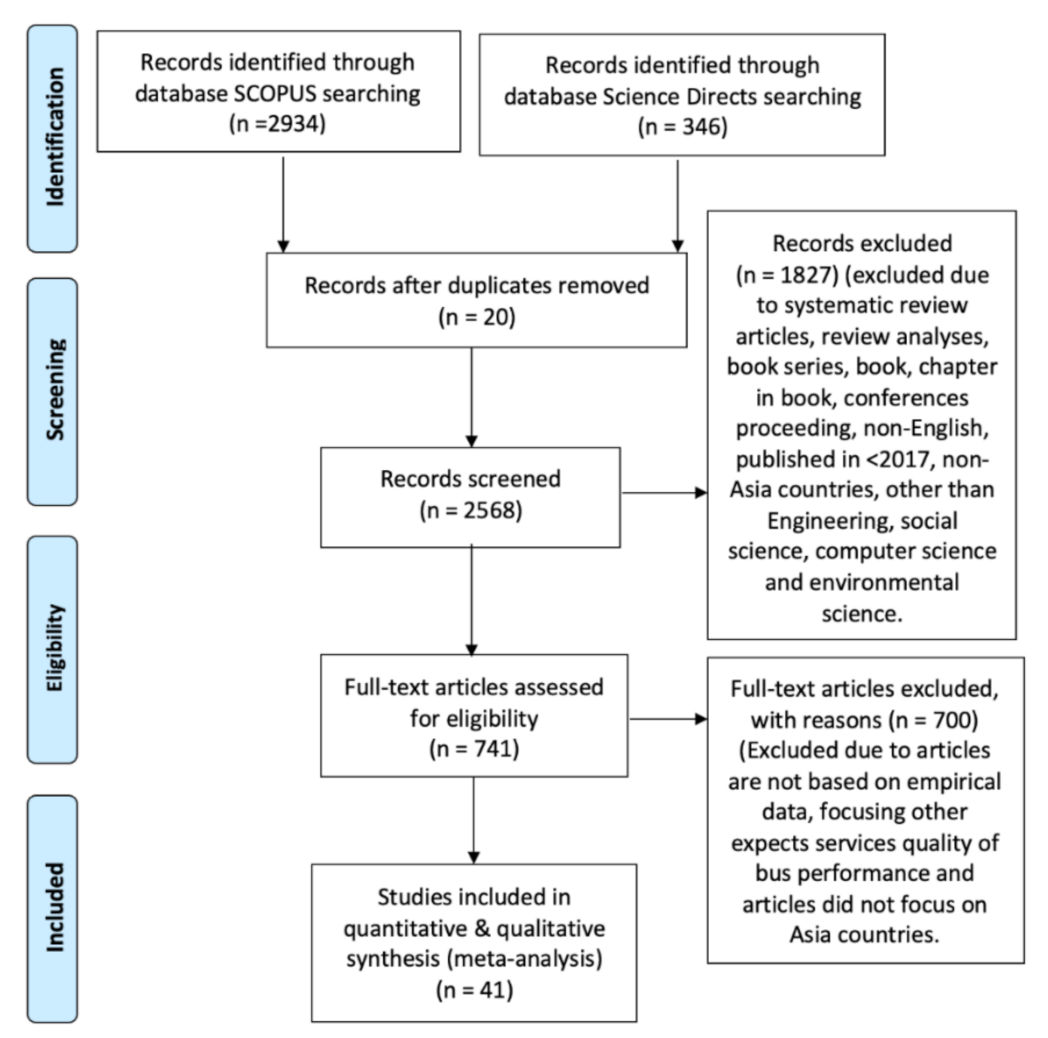
In this section, selected material and method are explained in detail, which comprises 5 subsections, namely PRISMA, resources, inclusion and criteria, systematic review process, as well as data abstraction and analyses.

2.1. PRISMA

PRISMA is also known as a preferred reporting item for systematic reviews and meta-analyses was a notable approach to conduct a systematic literature review study. The basic approach in developing the literature review analyses requisite all authors to collect all necessary information and research material for researchers and authors to generate and determine the quality and diligence of the review study. Furthermore, PRIMSA highlights the review report which evaluates a randomised examination and this method was employed as a basic procedure in the development of systematic reviews for other types of research [29]. Researchers emphasised that the PRIMSA approach is also ideal for environmental management fields due to well justified research question towards the needs of a systematic literature review. In addition, PRISMA is also applied in medical studies. Inclusion and exlusion for specific fields could be identified simultaneously during the process. Therefore, PRISMA can review a comprehensive scientific literature database at certain periods, which allow a systematic search of keywords and terms related to the literature review regarding the service quality of bus services in Asia regions. The use of PRIMA allows future researchers to identify all issues and problems that should be addressed as future concerns about public transportation in an urban area review.

2.2. Resources

The present study on systematic literature review was selected from SCOPUS and Science Direct databases. These databases are known as the main sources of research data and consist of more than 250 fields of study, including transportation engineering studies. In addition, the SCOPUS database has indexed almost 34,346 peer reviewed journals of top subject fields, such as life science, social science, physical science, and health science. Journals which were indexed in SCOPUS were reviewed yearly according to numerical measure based on the research quality of every title. In addition, the Science Direct database contributes access to a significant number of scientific databases, including engineering, science, and medical.
This database currently provides more than 4000 academic journals which were grouped into a few themes, such as engineering and physical science, health science, life science, humanities, and social sciences. Although both databases provide significant research and academic papers, yet so far there are no databases which are perfect or comprehensive. Previous research emphasised that researcher should regulate the literature study by using various sources so as to increase the possibilities to gain pertinent literature output [30]. Therefore, this study would oversee the literature study by using a manual searching approach for both sources, considering that these sources are well known and consist of journal articles related to transportation study.

2.3. The Systematic Review Process for Selecting Articles

2.3.1. Identification

Selecting articles for the systematic review process comprised three primary phases. Identification would be the preliminary step to develop the systematic literature review process. In this step, relevant articles were identified. Similar and related terms were subsequently searched from other reliable sources, such as encyclopaedia, dictionaries, thesauruses, and previous research studies. Therefore, the search string was deployed on SCOPUS and Science Direct in February 2021 (Table 1) after all relevant keywords were identified. A significant number of papers from the SCOPUS and Science Direct database were retrieved (3280 articles). A total of 2568 articles were selected during the preliminary process.

2.3.2. Screening

The second stage of data selection was the screening process. This process was to check and remove duplicates of the selected article. Therefore, 20 selected articles were excluded in the first stage of screening, and 2568 selected articles were screened in the second stage based on a few inclusions and exclusion criteria. In this study, as only research articles from journals were selected because journals are known as primary sources of empirical data. Therefore, research articles in the form of review, systematic review, meta-synthesis, meta-analysis, book, book chapter, book series, and conference proceedings were excluded. The study focused on published English articles. Research articles that were published in last five years (2021–2017) and were focused on Asia regions were selected. Articles published on engineering, social science, computer science, and stream science were also chosen to increase the chances of retrieving more relevant research articles. At this stage 1827 research articles were excluded according to these criteria (Table 2).

2.3.3. Eligibility

The third stage of data selection was eligibility. A total of 741 research articles were examined. Titles, abstracts, and main content of all selected articles were reviewed in detail to verify that all selected articles had complied with the inclusion criteria and were suitable for review. Consequently, 700 research articles were excluded at this stage as they did not rely on empirical data and were not focused on urban public transportation, service quality of bus services, or related to Asian countries and territories. Therefore, a total of 41 research articles were further analysed. The flow diagram of adapted in this study was shown in Figure 1.

2.4. Extraction of Data and Advances Analysis

The integration review approach on selected papers was conducted. It was a specific review approach which further analysed and synthesised a combination from various research designs, namely quantitative method, qualitative method and mix method. Through this approach, quantitating qualitative data and qualitising quantitative data cab be obtained from this type of research paper [31]. All types of research design were then selected. Next, appropriate themes and sub-themes were developed based on thematic analysis of selected research articles. The first theme development steps were compilation of data, whereby 41 designated research articles were analysed in detail to extract the output and statement which answered the research questions. In the second step, the research articles were grouped via a coding approach based on the nature of data. These raw data were converted into applicable data through theme identifications, concept, and idea to identify the relevance of selected research paper [32,33]. Therefore, this approach was developed into three main themes, namely study approach, stakeholder, and service quality attribute. Thereafter, the process in each of the created themes was resumed, whereby any theme, concept, or idea which had identified the connection between each research paper within the same theme will produce a sub-theme. Therefore, 18 sub-themes were developed. To maintain consistency of findings each theme was developed according to the findings of other co-authors within the extent of this study. In addition, the entire data analysis process was recorded. Next, the results were also highlighted to address any inconsistencies in the theme development process. If the themes were inconsistent, further discussions were addressed accordingly. Lastly, several adjustments were made for the developed themes and sub-themes to ensure their coherence in the study. Two experts performed the expert review to corroborate the effectiveness of theme and sub-theme. One of the experts was a community development expert and the other was a quantitative expert. This stage should be conducted to ensure the relevance, appropriateness, and clarity of every theme and sub-themes. Adjustments were made based on the authors’ feedback and comments.

3. Results

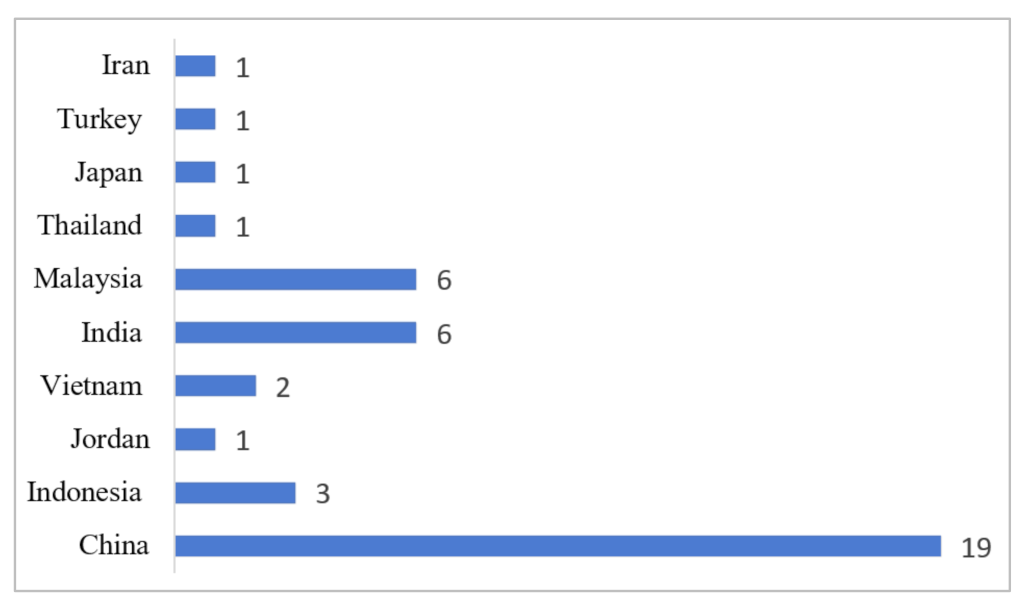
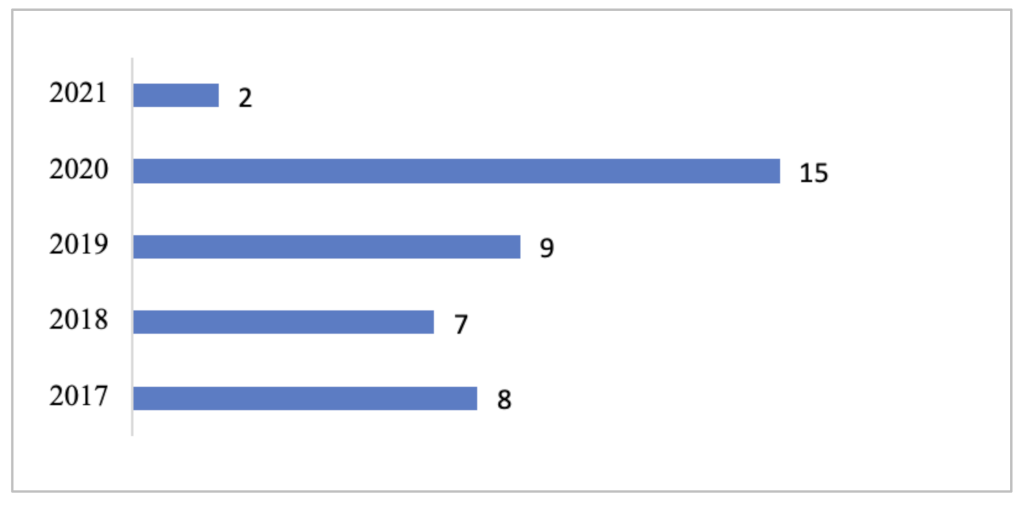
3.1. Background of the Selected Studies and General Findings

The analysis produced three themes and 18 sub-themes related to service quality of bus performance. As presented in Table 3, the three themes were study approach (3 sub-themes), stakeholder (2 sub-themes), and service quality attributes (13 sub-themes).
More specifically, there were 19 previous studies which addressed the quality of services of bus performance in China, 6 studies examined the service quality in Malaysia and India. In addition, 3 studies were conducted in Indonesia and 2 studies were found in Vietnam. Other studies included each from Jordon, Thailand, Japan, Turkey, and Iran (Figure 2). In the present study, 2 articles were published in 2021, 15 articles were published in 2020, and 9 articles were published in 2019. Next, 7 articles were published in 2018, and 8 articles were published in 2017 (Figure 3).

3.2. Main Findings

Selected literatures were categorised and classified based on the specific attributes or dimensions discussed in their studies. These attributes further facilitated the assessment of service quality based on the output of previous studies. The service quality might increase if the performance of every attribute improved. Therefore, the Main Finding section would discuss in detail the study findings of the 3 main themes and 18 sub-themes. They comprised the study approach, stakeholder, and service quality attributes (Table 3).

3.2.1. Study Approach

Study approach is one of the important steps to identify the types of pervious research study that were related to service quality of bus performance. Though bus performance is part of engineering knowledge, specifically in transportation engineering, some parts of the service quality could also be considered as social science analysis. In this study, a total of 48 studies were selected. Generally, the studies were focused on service quality of bus performance in Asia. It should be specifically noted that engineering was under this theme (19 studies), followed by social science (21 studies), and Internet of Things (IOT) (20 studies).

Engineering Approach

Service quality of bus performance is related to the engineering approach as several studies should be determined and measured by the engineering approach, for example, to measure the level of service (LOS) and determine the public services efficiency, especially in urban areas. The LOS criteria were developed by using service metrics, which classified each attribute into various classifications based on dissimilar thresholds. This quantitative LOS standards could be guidelines of transportation system, including bus services. The LOS standards are very indispensable for every stage of transportation services and facilities evaluation, including preparation stages, design stages, and operational stages. On the other hand, previous studies in China indicated that through the engineering approach, operators could decrease the waiting time and headway as the tremendous traffic volume was about 10 million trips per day. The tremendous traffic volume would cause traffic congestion and overloaded passengers, especially during peak hours in the early morning and late afternoon. Previous researchers had emphasised the importance of improving the efficiency of bus services because the improvement made could alleviate road congestion and decrease traffic volume, especially in urban and sub-urban areas and promote transportation mobility.

Social Science

Social science approach was also partly used to determine the bus performance by pursuing feedbacks and perceptions from customers and stakeholders. Bus performance should be continuously evaluated and assessed to ensure that the bus service could offer a significant movement for users and passengers, and thus could achieve their bus services satisfactory level. Previous research studies suggested the establishment of satisfaction matric from several social science perspectives [34]. The urbanisation phenomena have increased the demand for transportation as people migrate rapidly from the rural to urban areas [35]. Developing countries in Asia, such as Malaysia, Indonesia, and Vietnam, have densely populated urban areas and rely highly on public transportation. Previous studies justified that citizen choice behaviour should be considered when measuring possible attributes as variables (unobserved and observed) for bus performance. Unobserved factors, such as identification of policy proposed by the authority, tolerance of systems, and public apprehension should be added when assessing the service quality because these factors enhance psychological perceptions and mobility management actions to promote the use of bus services.
Table 3. The main and sub-themes.
AuthorsStudies Approach Stakeholder Service Quality Attributes
ESSIOTPOSFSHOTPLSCHDCVRLCFSSRTSDSP
Weng et al. (2018) (China) [36] X XX X XXXXXXX
Zhang et al. (2017) (China) [37]X XX X XXXX XX
Saleh et al. (2019) (Indonesia) [38] X X X X
Wang et al. (2017) (China) [39]X XXXX XX X X
Li et al. (2020) (China) [40]X XX XX XX
Al-Hawari et al. (2020) (Jordon) [41]X XXXX XXX X XXX
Zuo etal. (2019) (China) [42]X XX X XX X X
Abdullah et al. (2019) (Indonesia) [43] X X X X X
Liu et al. (2020) (China) [44] XX XX XXX XXX X
Hou et al. (2020) (China) [45] XXXX XX X X X
Tung and Hoang et al. (2019) (Vietnam) [46]X X XX X XX X
Basu et al. (2020) (India) [47]X X X X X X
Shukri et al. (2020) (Malaysia) [48]X XXX X X
Wu et al. (2020) (China) [49]X X X XX X
Cheng et al. (2018) (China) [50] X X X XXXX
Huo et al. (2018) (China) [51]X XXX XX XX X
Wang and Cao (2017) (China) [52]X X XXX X
Wei at al. (2020) (China) [53]X X XX XXX X
Zhao et al. (2017) (China) [54]X X XX X X X
Zhou et al. (2020) (China) [55]X X XX X X
Amrapala and Choocharukul (2019) (Thailand) [56] X X X XXXX X
Ponrahono et al. (2017) (Malaysia) [57] X X XX X X
Minhans et al. (2020) (Malaysia) [58] X X X XXXXXXXX
Mou et al. (2020) (China) [59]X XX X XX X XX X X
Wang et al. (2020) (Japan) [60]X X XX X X X X
Gogoi (2019) (India) [61] X X XXX X
Cui et al. (2020) (China) [62]X X X X X
Ngadiman et al. (2020) (Malaysia) [63] X XX XXX XX
Purba et al. (2017) (Indonesia) [64] X X X XXX
Norhisham et al. (2019) (Malaysia) [65] X XXXXXXX X
Borhan et al. (2019) (Malaysia) [66] X X XXX XXXXX
Canitez et al. (2018) (Turkey) [67] X XX XX XXX
Li and Wang (2018) (China) [68] X XX
Zhao et al. (2020) (China) [69]X X XX X X X X
Suman et al. (2017) (India) [70] X X X XXXX X
Sharma and Pandit (2021) (India) [71] X X XX X X X
Deb and Ahmed (2018) (India) [72] X X X XXXXXX X
Esmailpour et al. (2020) (Iran) [73] X X X X XXXX X
Cheranchery and Maitra (2018) (India) [74] X X XXX X X
Nguyen-Phuoc et al. (2021) (Vietnam) [75] XXX XXX
Wu et al. (2017) (China) [76]X X XX XX X XXX
Studies ApproachStakeholderAttribute of service quality
E = EngineeringP = Passenger SF = Service frequency SC = Service coverage CF = Comfort SP = Speed
SS = Social Science O = Operators SH = Service hours HD = Headway SS = Safety and Security
IOT = Internet of thing OT = On time performance CV = Convenience RT = Route and Time travelled
PL = Passenger loadRL = ReliabilitySD = Schedule

Internet of Things (IoT)

Industrial Revolution (IR 4.0) leads every angle on people’s life to relate to Internet of Things (IoT). IoT also plays a vital role in the bus system, especially in developed countries. IoT has many benefits in the bus system, such as real-time information (RTI), which supports the passenger travel decision, optimisation of bus schedule, designing a feeder transit to enhance the quality of service, measure the accessibility of bus services and many more. Results showed that 48% of articles retrieved in this study were focused on development of IoT. It justified that the expectation for bus services by passenger could be increased due to technology and IoT adaptation. Since passengers can obtain the routes and bus information about delays and expected trip durations, number of passengers and assists passengers to choose the optimum routes for their destinations. Although the application of IoT would lead to additional cost for operators, but it is considered as a profitable move for a long-term period. On the other hand, IoT application could be applied to forecast bus crowdedness level during peak hours as well as become a warning indicator for passengers and operators. Application of IoT should be optimised with engineering and social science to correlate with passenger and customer expectations and demands.

3.2.2. Stakeholder

Quality of service also describes the differentiation between service delivery and expectation of customer and users. To measure the quality of service is slightly difficult compared to quality of product. Therefore, quality of service of bus performance should be measured based on stakeholders’ perspective. Stakeholders have specific perceptions of service quality that they will typically use as a performance indicator which relates to bus services. The stakeholder perception level would affect trustworthiness level towards the bus services system. In this study, several studies that focused on stakeholder perception were identified and two sub-themes under the stakeholder themes were created, namely passenger (24 studies) and operator (24 studies).

Passenger

Satisfaction level with bus services plays a significant role to motivate users and customers towards bus services. Therefore, is it important to improve the quality of bus services regarding the satisfaction level of both urban and rural passengers. Passenger satisfaction towards bus services comprised several perspectives, such as perceptions, expectation, needs, and demands of prospective customers within household income and social echelon. Passengers commonly have direct involvement in good services delivery and operators would add several unexpected factors in delivering a good service. However, it is difficult to accommodate specific expectations and requirements for each passenger to reach their tolerance level for good quality of services. The diversity in demand and expectation towards bus services is subjective, which is greatly influenced by passenger travel behaviours, personality, and routine. The smoothness and effectiveness of services are factors that would develop trustworthiness towards bus services. Therefore, it is important to set specific guideline standards to measure and evaluate the service quality of bus performance. Moreover, bus services had contributed a significant effort to attract more passengers and users to use bus services.

Operators

A bus service is usually operated by designated operators who are approved by the authorities and government. Operators would manage the daily operation of bus service parameters, including dwell time, headway, capacity, and driver’s behaviour. The authorities have given the right to operators to carry the revenue and risk costs to operate bus services. Unfortunately, issues arise when less passengers use the bus services. This could cause a decrease in service quality because operators would receive their profit based on total number of passengers who have used their services. Without an adequate number of passengers, private operators could not operate their business and provide a good service quality. Moreover, without the government funding and budget it will decrease the routes, service hours, and daily frequency. Operators also should deliver a good service by providing well-trained drivers who would increase the efficiency of bus services. It should be highlighted that passenger and user trustworthiness and perceptions would increase by providing well-trained drivers. Drivers’ good attitude and quality bus services by operators also affect the instances of inconsistent service delivery, which potentially results in unfavourable customer experiences and perceptions.

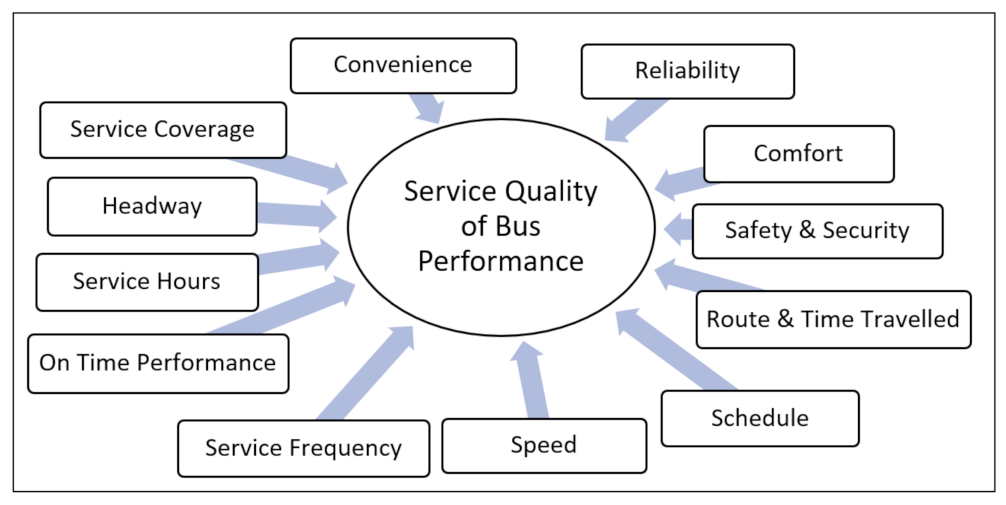
3.2.3. Service Quality Attribute

Service quality usually consists of specific elements or attributes. Each attribute will determine a different service quality parameter. In this study, the assessment of services quality specifically on bus performance in Asia consisted of science and engineering attributes as well as social science attributes, in which each attribute was addressed. Science and engineering would be measured based on quantitative transportation engineering measurement, whereas social science would be measured based on quantitative and qualitative studies about the passenger review and operator feedbacks. As previously mentioned, all selected studies were differentiated based on specific sub-themes in service quality attributes, which resulted in 13 sub-themes, namely service frequency (26 studies), service hours (7 studies), on time performance (19 studies), passenger load (21 studies), service coverage (13 studies), headway (19 studies), convenience (11 studies), reliability (18 studies), comfort (19 studies), safety and security (11 studies), routes and time travel (24 studies), schedule (10 studies), and speed (13 studies).

Service Frequency

Service frequency is considered as a very important factor which influence passengers and users’ decision. Service frequency of bus services is normally set up by service providers or operators, depending on level of demand by passenger and users. The frequency of bus services is directly proportionate to passenger transportation demand towards bus services and location. Generally, service frequency implementation was directly adopted to the daily schedule and passengers expect the consistency of departure frequency by bus operators. Unfortunately, this expectation should meet up the adequate number of demands by passenger. Therefore, the different and unbalanced distribution of passenger demand would affect the frequency for each route. Service frequency should determine how often potential passengers access the service transit. Several improvements were made to improve service frequency of bus services, such as optimisation models of bus frequency through algorithm solutions based on travel passenger and user demand. Providing adequate number of trips per day allow passengers and users to choose the optimum route to their destinations. Service frequency should be added during peak hours in the morning as compared to evening because passengers and users are willingly to pay more to arrive at their workplace on time.

Service Hours

Service hour is also known as duration of operations, which signifies to the total of hours of services daily, including day and night when the bus operates on the designated routes or segment from starting point until the end of designated routes. It also reports how passengers and users express their dissatisfaction towards service hours in the late afternoon and on public holidays due to less demand. Inadequate bus services were also observed outside the peak hour period, which affected the passengers and users who were employed for late shift. The longer hours of bus service should give passengers more flexibility in terms of their return trips, especially in urban areas and suburban areas. It is because many passengers and users would prefer to live in sub-urban and satellite town since the living cost in downtown areas is too expensive. Operators and the authority are highly suggested to continuously seek for feedbacks and perspectives from passengers.

On Time Performance

On time performance of bus services is also known as punctuality of services according to the schedule. Normally, one time departure will be considered if the bus departs between 0 and 5 min, as stated in the schedule. On time performance is defined as the number of on-time bus trips divided by all bus trips for the study systems. Many people refused to take bus services as their primary transport option due to the availability of bus services when people needed the services, especially outside peak hour periods. Researchers suggested that small and medium cities have very little resources and less monitoring on the level of service as on time performance. For example, studies conducted at State of Assam, in India showed on time performance level with the level of service (LOS). Moreover, the optimal number of on time performance should reflect the satisfaction of passengers and users, and the lack of on-time performance will cause dissatisfaction in services.

Passenger Load

Passenger load is an attribute that refers to number of passengers who manage to obtain a seat when boarding the bus and passenger load also addresses the level of crowdedness on the vehicle. Passenger load analysis is suggested to be conducted during peak hours, non-peak hours, weekdays, and weekends to analyse the number of passenger load, as well as the service provided by operators. Operators should try to utilise the maximum bus capacity while considering constraints in number of seats and available buses. In addition, researchers have also suggested an adjustable bus service by using an optimisation model to increase the efficiency of bus services by implementing multitargeted stations, including passenger demands, bus capacity, and the transportation network. The capacity demand should be continuously assessed as the demand reach maximum, especially during peak hours. Therefore, operators are highly recommended to increase the frequency number because lack of bus capacity will increase passenger waiting time at stations and bus stops.

Service Coverage

Bus operators are looking at expending their services and service coverage by adding new routes. The aim is to increase the number of customers and upgrade the company brand image by serving as many customers as they could. Surveys were conducted on stakeholder’s perceptions towards bus services in Klang Valley area. The results showed that most participants voted for ‘Good and Medium’ feedback with 40% and 35% of respond, respectively. Internet of Things (IoT) application was suggested to be applied so as to increase the service coverage of bus performance. For example, the index weight used to increase accessibility and service effectiveness of bus services with data envelopment analysis (DEA) was determined by an optimisation model, which maximised the service coverage for disadvantaged customers (i.e., elderly, children, and disabled). Good service coverage could be accessible with other transportation hubs (such as rail stations, airports, intra city stations), in which passengers and users can easily use the bus services. Previous studies on public perceptions were conducted in Johor Bahru, Malaysia based on user’s travel behaviour, which reported that passengers and users were satisfied with the total service network coverage.

Headways

Headways are described as intervals between two consecutive bus departures or arrivals. Inconsistent headways and bus bunching are frequent experiential in bus services, and holding control is one of the significant options to decrease bus bunching and improve service performance. The mean of bus headways was proven to have a positive linear relation with waiting time at the bus station. On the other hand, the implementation of a quasi-first-depart-first-holds (FDFH) approach in schedule design and headway-based holding control allows over taking of headway and decrease in both waiting time and on-board travel time. However, the correct fleet size for each route should be used to serve passenger effectively by providing adequate headway and less waiting time at terminal and bus stops. Therefore, headway can be regarded as an indicator to evaluate the behavioural intention (transit passenger perceptions) and the elasticity of bus services quality. In addition, the average of headways for bus services demonstrated in Harbin, China was an average of 12 min outside peak hours, and it was decreased to 8 min during peak hour periods (morning and afternoon) due to the high-volume of passengers and users.

Convenience

Convenience is also an attribute that focuses on passenger and user perspectives. A pervious study had identified a sub-component of convenience attributes which comprised frequency of bus services, convenience alighting and boarding, and seats availability. Most researchers addressed the facility convenience, travel convenience, and information services classified in the second level indexes of convenience. As opposed by other researchers, convenience attributes should concern about transfer time and transfer distance for passenger. Even the sub-attributes might be different between all studies on this attribute, but the feedback will still come from passengers and users who were customers for the bus services. Previous researchers had conducted a study by using an importance–performance analysis (IPA) approach, which showed that convenience attributes received 90% of confidence level, and it can be classified in Quadrant II of the IPA analysis grid. A researcher from China addressed that the score of convenience to the overall satisfaction was 78.7% towards bus services in Beijing, which was determined by two important circumstances, namely routes and bus type. Convenience was also justified as perceived quality of bus services. Convenience of bus services was part of the attributes that affected the bus passenger perception of service quality in developing countries.

Reliability

Reliability of service reflects the ability of transit to depart and arrive on time. Reliability of service is more to trustworthiness of passengers and users towards the bus services. Absolute value of the difference in arrival time is to compare the on-time performance with other public transportation modes. In addition, reliability should refer to the actualisation rate of scheduled trips. For example, the Government of Turkey through Istanbul Electricity, Tramway and Tunnel General Management (IETT) launched a policy throughout economic initiative for operators to encourage operators to maximise the users and passengers for every trip. However, the specific schedule regulated by IETT had clearly influenced the net income of operator. It is also important to highlight that the reliability of service would be an important factor to attract car users and it significantly affect individual perceptions, motivations, and context. Several factors are shown as reliability indicators, for example, line category, bus type and number of stops. Line Category was particularly, the most significant factor towards reliability indictors for a bus service [69]. A researcher developed an optimisation model to measure the reliability indictors and results showed that service reliability was improved by decreasing the passenger and user waiting time. The variance of stop service interval had reduced and simultaneously improved the reliability of stop-skipping operation.

Comfort

Comfort is shown as a valuable attribute to determine service quality of bus performance. A study conducted in Indonesia showed that the comfort attribute was the most recommended aspect to improve customer satisfaction towards bus services in Yogyakarta, Indonesia. Generally, comfort should be assessed by total number of halts, flexible to route adjustment, and waiting time. The study on comfort level of passengers and users in Delhi and Mumbai, India showed that public perception responses revealed the high comfort level towards bus services in Mumbai as compared to Delhi, which represented 1.266 and 1.534, respectively, of the relative likelihood. The studies also addressed the enhancement of comfort level would generate the satisfaction feeling by passengers and users towards bus services. A study confirmed that the sub-attributes of comfort which were appointed by passengers and users were bus condition, comfortability of seat, cleanliness, and behaviour of staff. Therefore, it is necessary for operators to rectify all sub-attributes addressed by passengers and users.

Safety and Security

Selection of transportation mode would be based on the safety concern by passenger users. Implication of negative incident such as unprofessional behaviour of employees and punctuality could decrease customer trustworthiness towards the bus services. Studies that were conducted in India justified that passenger were not fully satisfied with safety issues due to lack of safety information and guidelines in most buses. Urban bus safety could be increased by addressing the security of bus stops and inside the bus as well, in which some of the service aspects were not performed as per stakeholder expectation. Studies conducted in Tehran, Iran justified that 95% confidence level of satisfactory performance were raised by passengers and users had pointed out their security concern at the bus station and end route in the bus. On the other hand, studies conducted in India showed that safety and security of the city bus were classified as level of service (LOS) 3 or “C” which caused a bad perception towards bus services. Due to safety and security concern passengers and users would select the best daily transportation mode, especially amongst women passengers and users.

Routes and Time Travelled

Routes for bus services are normally proposed by operators and approved by authorities. It is impossible for operators to easily increase the potential of routes due to operational cost restriction and adequate number of passengers. The routes can also be evaluated by total distance travel, number of stops, and time travelled for each journey. Moreover, passengers and users travelled time, which is known as access–egress time, is listed as essential factors to determine passengers’ preference. It is important for operators to provide necessary information to passengers and users. They have developed a location tracking information system which allowed passengers and users to make a proper planning and estimate time to travel before their journey starts. Issues found that there were different demands by passengers and routes for a specific segment for each route, which presented the unbalanced distribution for the number of empty seats for the whole journey. Normally, these issues happen on feeder route, high demand of passenger but with less frequency. Therefore, it would decrease the efficiency of bus performance.

Schedule

Schedule for bus services is preliminary information provided by operators for passengers and users to plan their journey. Currently, some developed countries have developed the schedule together with real-time information. This latest improvement helps in travel planning. Studies which were conducted in nine cities in Malaysia suggested a very weak significant value of bus speed service quality with R value of less than 0.20. A survey session was conducted by Assam State Transport Corporation (ASTC), India mentioned that 95% of the respondent addressed issues on availability of time schedule for running bus at bus stations and most of the buses did not depart as per predetermined time schedule. Unsatisfaction with the schedule provided by operators was also expressed by people in Johor Bahru, Johor. The schedule is considered as crucial information and it is important to attract people to use bus services. People would prefer to use other alternatives, such as private transport, and e-hailing due to insufficient information provided by operators.

Speed

Speed of bus would be justified as an attribute that represents driving behaviour of a bus driver, which is ultimately observed through the movement of buses. The average travel speed was employed as a performance metrics and service characteristics for each route. Previous studies conducted in Malaysia found that the level of service for urban bus services in Malaysia was at level C, which caused a small increase in traffic; hence, causing a substantial increase in approach delay. Therefore, the decrease in arterial speed and bus speed is also affected by the bus condition. The speed difference between two buses also causes reliability degradation. Previously, driving behaviour of bus drivers can only be analysed by seeking passenger and user perceptions. However, today, operators and the authority can also monitor speed of buses by using the global positing system (GPS) and development of a web-based information system. A study in China had proposed bus rapid transit (BRT) fuzzy level of service (LOS) criteria for different passenger groups. The study applied user and passenger perceptions to re-evaluate the LOS of speed attribute for bus rapid transit (BRT) as a comparison with the existing guidelines.

3.3. Conceptual Frameworks for Service Quality

Although this study only reviewed some of the current literature, there is a need to a facilitate a future study of the state of the current literature. Figure 4 shows the outline key attributes of service quality of bus performance. Based on the reviews in this study, 12 attributes were addressed and these attributes had a positive relation towards service quality of bus performance. Unfortunately, the researcher only focused on certain attributes in the study and did not combine all 12 attributes. Figure 4 presents the key attributes of the affected service quality of bus performance in this study. All attributes should be outlined in the future study in this area and imply a framework for elaboration, further analysis of key elements of service quality [77]. Conceptual framework would assist researcher to define concepts, identify conceptual scope, systematise relating amongst concepts and identify gaps in the literature [78]. However, additional conceptual and theoretical development is highly recommended. The utilisation of a conceptual framework for future study should vary in methods, including quantitative and qualitative assessment so as to evaluate which attribute that would impact the service quality of bus performance.

4. Discussion

In this study, a systematic analysis was conducted on the existing literature study of service quality of bus performance. High volume of traffic users has caused major traffic congestions all over the world, especially in urban and sub-urban areas. It is important to capture all possible opportunities to decrease the number of traffic users by improving the bus performance in urban areas. A meticulous analysis sourced from both databases (SCOPUS and Web of Sciences) had captured 41 research articles linked to service quality of bus performance. The systematic literature review findings demonstrated a collective set of case studies on transport policy, specifically on several attributes of bus performance in Asia regions only. Previous studies were published for the latest five years, from 2017–2021, were selected since this study were conducted in 2021 and to retrieve recent outputs and new knowledge related to service quality of bus performance in Asia region. Researcher had adopted different methodologies to assess the service quality of bus performance. Researcher should carry out an extensive literature review and revalidate the results by consulting various stakeholder, including the local authorities.
Based on the observation in this study, most researchers underlined the difference in emphasis to determine the attributes of services quality between developed and developing countries. This study also found that developing countries were focused on service quality improvement at the core issues of bus performance only. Some under research were only highlighted. On the other hand, as justified in the previous section, most researchers from developed countries, such as China and Japan, were more focused on engineering and IoT approach. A total of 48% of articles retrieved in this study consisted of IoT development. In contrast, researchers in developing countries, such as Malaysia and Iran, were focused on social science studies. However, there were some social science studies that were also produced in developed countries and vice versa.
On an important note, the researchers also provided a significant novel contribution and finding of their research by optimised engineering combined with technology and IoT knowledge to solve existing problem related to service quality of bus performance. For instance, a researcher from China had proposed the modelling of bus delay at bus stops by using three types of delay which can be estimated by using occupy-based delay, transfer delay and block-based delay. Similarly, a model was developed which could predict bus stop for each route by using stop-skipping approach with capacity limitation. This model used the holding strategy as a control the gap to stop serving rather than the bus headways by utilising genetic algorithm to integrate with Monte Carlo simulation so as to increase the stop services stability and reduce extricate passenger and user travel time. Comparably, researcher from Dalian, Japan also investigated the effect of customised bus application towards public transportation systems by using regression models and multinomial logit model. The results showed that these services significantly improved the travel experiences in all aspects. Another study was conducted by developing a system which incorporated all the necessary information, such as buses, assigning drivers, stops, schedules, and trips [79].
Other than that, the finding highlighted researchers who have expressed the significant concerns about improving the service quality on passenger and user perceptions for customer satisfaction towards bus services. In line with recent research, all attributes or dimension of service quality should be combined and not restricted to human behaviour attribute or engineering attributes only. The results somewhat showed that 17% of articles addressed more than six attributes in their studies. The results emphasised that the hypothesised indicated that the service quality appeared to positively related to all service quality attributes, with some service quality attributes contributing more than other relationships [80]. Although passenger perception was focused on human behavioural concern, it is important to be addressed in this study to attract more private vehicles users to switch and use the bus services. To accommodate the high demand of passengers and users for bus services, the authority and operators should effectuate, in depth, a significant policy on bus services which focuses on specific attributes, namely convenience, safe, and informative bus service [81]. Researchers added attributes to the analysis to measure service quality of bus performance, such as comfort, reliability, safety, security and convenience, routes, and schedule. It is important to investigate the relation between passenger’s individual characteristic and service quality perceptions. A significant relation between the impact of expectation and perception of passenger satisfaction affects the overall service quality of bus performance.
On the other note, each attribute plays substantial roles to enhance the overall quality level of bus performance. For example, operators should provide sufficient frequency of bus services, especially during peak hours to cater the huge number of passengers and should reflect their operational cost as well. Long service hours might affect the performance of bus services if there is only one driver provided by operators for each route because a different total of passengers is covered at dissimilar times daily, which comprise different volumes of passenger (morning, evening, and off-peak hours). Trustworthiness factors towards bus services by passengers and users obviously depend on punctuality of bus services because the existing passengers and users would switch their transportation mode if operators and drivers could not provide services on time. Density of passenger’s load were measured, which consisted of the number of passenger seats and number of passengers for the whole journey (seated and standing). To measure the efficient level of passenger load, it should be noted that decease in jeopardy passenger on their bus ride would increase the connivence and comfort level of passenger on their journey.
The other aspects observed by researchers in previous studies had assumed marginal walking distance to bus stop as preliminary factors to access service coverage quality. In addition, a study had justified that of bus headway must reflected consistency of bus departure time and high value of departure were represented the irregularity concern of bus headways, such as a long interval between bus departures or arrivals and bus bunching. Convenience attributes were also justified as socioeconomic attributes to analyse passenger and user perspectives towards bus services as the results showed that convenience was the critical influential indicator of passenger satisfaction. The country socioeconomic situation strongly affects the use of bus services, and the governments must adequately develop a policy to address this influence [82]. It is also important to highlight that the reliability of service would be an essential consideration to attract new passengers and it highly affected by motivations, passenger perception and service context [83]. Passengers said that the discomfort found in facilities at bus stations, such as number of toilets, social facilities, waiting area, and not fully air conditioned, should be addressed by the authority and government. In addition, development of new strategies should continue as priorities bus services over private transportation and retains potential to invite additional passengers since attributes were shown to influence. Otherwise, the demand for bus services will continuously reduce if the government is still focused on policies which encourage people to use private means of transportation indirectly.
Generally, the safety indicator is mainly affected by types of line and bus as the types of line have the most significant influence on security. Security attributes in bus services should comprise security of waiting, boarding, traffic, and emergency management. Journey and time travelled would be different based on routes. For instance, the journey and time travelled would increase if the route consists of high-volume passenger and traffic densities. Study also emphasised that real-time information should be provided with expected delays and routes schedule and details of bus. On the other hand, there was a reduction of 20% of bus speed during rush hours in the morning and late afternoon due to excessive of traffic volume on the road and passengers tended to choose other public transport modes because of the decreasing of bus speed and irregularity of stoppage time and speed of bus.
The outcome from this study could provide a significant implication in various areas, such as research, theory, practice, and society. All outcomes from previous studies on service quality of bus performance in the Asia region could be convened through systematic literature review approach. Existing problems and new knowledge addressed by researchers in this area could be cumulated. Researchers also provided a new theory by applying IoT and new technology adaptation to improve quality of bus performance, such as proposing the modelling of bus delay, estimated by using occupy-based delay and predict bus stop for each route. Although researchers could provide an innovative knowledge and theory in improving service quality, workability on-site would be the main concern of bus operators and the authority. The output of this study showed that researchers also implemented different approaches of research area in developing countries and developed countries. Our study showed that research in developing countries focused on improving reliability aspects of services, such as on time performance, facility, passenger load, service frequency, and other areas, to increase the number of passengers of bus services and improve fundamental problem of bus services in Asia region. High number of vehicle and traffic congestions were shared problems addressed all over the world. Therefore, this study would provide a significant output on how to improve bus services and promote people to used bus services as a primary daily transportation mode. Consequently, the number of private vehicles and traffic congestion may reduce and stimulate a better society in future.

5. Limitation and Future Research

The outcomes and process of systematic literature review of this study have led to a few recommendations and suggestions which may be considered by other researchers for future studies. The major limitations in this study were only focused on reviewing the literature study of service quality of bus performance in Asian territories, which consisted of both developing and developed countries. Previous studies were published latest for five years (2017–2021) were selected since the study were conducted in 2021. However, the present study will be base for future research on service quality of bus performance. Previous studies showed that service quality of bus performance in developed countries (e.g., China and Japan) was more focused on engineering, system development and IoT. In addition, studies on developing countries (e.g., Malaysia, Indonesia, Thailand, India, and Iran) were focused on social science and passenger satisfaction towards bus performance. The process of systematic literature review should be addressed by future scholars by conducting advanced studies on service quality studies of bus performance in other regions (e.g., Europe, North America, and Oceania) because in this study only two developed countries were focused. Therefore, further investigation should be conducted because most of the studies only focused on service quality of bus performance in developing countries.
Although this study provided a valuable contribution, it seems that significant areas for future research can be explored. All attributes should be included in measuring the service quality of bus performance. Future studies should represent the overall representative of service quality of bus performance and it is highly recommended, including all stakeholder (policy maker, authority, bus operator, passenger, and bus driver) and other modes of transportation as well. Future study on the adaptation of IoT for sustainable public transportation is highly recommended since the providing of public transportation infrastructure might not be the only solution to improve quality of services in this era. Next, other quantitative and qualitative attributes of service quality need to be given attention in the future research to figure out the effect of each attribute towards the overall bus performance. Furthermore, it is important to examine which attribute is related to engineering, social science, and IoT aspects, as such to enhance the service quality of bus performance. These attributes increase the positive perceptions towards bus performance by passengers and users. Therefore, it can increase passenger volume and users for urban bus services and the volume of motor vehicles in urban areas could be reduced.
Lastly, it is highly suggested that advancement should be performed on the flow diagram, which was proposed in a previous study regarding the process of retrieving research articles for future studies on the systematic literature review. The current study had experienced a problem, whereby many articles were retrieved through this approach. On the other hand, additional effort and time were needed to download all research articles. Therefore, it was highly recommended to recheck all articles once the screening process was finished so as to avoid duplication of articles. This approach might facilitate the author in managing the excesses number of articles to remove any duplication of articles that were retrieved from various sources.

6. Conclusions

The recent literature on bus services quality in Asia reflected a basic understanding of how each service quality attribute responded towards bus performance. This study proposed various contributions towards the improvement of conceptual framework and particle knowledge of service quality of bus services. Furthermore, three main themes that represented bus performance in Asia were classified according to systematic literature review analysed in this study. Our study approach had classified as introductory approach in this study as this theme was described as a type of studies in determining bus services quality, namely engineering, social science and IoT. Secondly, the theme referred to types of stakeholders who were related to bus services in the study, specifically passengers and operators. Lastly, the theme referred to service quality attributes which were described in detail for each attribute, to examine the impacts of service quality for bus services in Asia. Therefore, 13 attributes were selected in this study. The results offered scientific finding knowledge and passenger perceptions in determining the service quality of bus services. This study also presented a strong case why the quality services of bus performance should be improved to rectify the mobility as a service (MaaS) in urban areas is highly suggested. Looking beyond Asia region, it is an opportunity to continue the research in this topic as it represents empirical evidence to share with policy makers. In terms of particle implications, it is clear from this research, as well as existing literature, that having a complex empirical output can assist policy decision and bus operators to develop effective strategies to improve bus services quality, specifically in the Asian region. Additionally, the study can be repeated to determine the appropriate service quality of bus services thresholds that can be replicated in developing nations.

Author Contributions

M.F.A.B. and S.N. conceived, design and performed a reviewed on the literature; M.F.A.B., S.N. and N.N.I.M.A. analysed the data; M.F.A.B. and N.S.S.S. wrote the paper; and H.Y.K. and C.M.F. reviewed and proofread the manuscript. All authors have read and agreed to the published version of the manuscript.

Funding

This research was funded by Yayasan Canselor Universiti Tenaga Nasional, grant numbers: 202101012YCU, 202101015YCU and 202101018YCU. The APC was funded by BOLD Publication Fund (J510050002—IC-6 BOLDREFRESH2025—CENTRE OF EXCELLENCE) by Universiti Tenaga Nasional.

Institutional Review Board Statement

Not applicable.

Informed Consent Statement

Not applicable.

Data Availability Statement

The authors confirm that the data supporting the findings of this study are available within the article.

Acknowledgments

The authors are grateful to the support from Yayasan Canselor Universiti Tenaga Nasional for facilitating this research under research grant (202101012YCU, 202101015YCU and 202101018YCU), providing a scholarship for postgraduate studies and BOLD Publication Fund (J510050002—IC-6 BOLDREFRESH2025—CENTRE OF EXCELLENCE). Authors sincerely thanks to Institute of Energy Infrastructure (IEI) and Innovation Research Management Centre (IRMC), Universiti Tenaga Nasional as well.

Conflicts of Interest

The authors declare no conflict of interest.

References

  1. Farahani, Z.R.; Fallah, S.; Ruiz, R.; Hosseini, S.; Asgari, N. OR models in urban services facility location: A critical review of applications and future developments. Eur. J. Oper. Res. 2019, 276, 1–27. [Google Scholar] [CrossRef]
  2. Chow, M.F.; Bakar, M.F.A. Environmental benefits of green roof to the sustainable urban development: A review. Lect. Notes Civ. Eng. 2019, 9, 1525–1541. [Google Scholar]
  3. Dantas, R.; Dantas, J.; Melo, C.; Maciel, P. Performance evaluation in BRT Systems: An analysis to predict the BRT systems planning. Case Stud. Transp. Policy 2021, 9, 1141–1150. [Google Scholar] [CrossRef]
  4. Tirziu, A.M. Urbanization and cities of the future. Int. J. Innov. Educ. Res. 2020, 8, 235–245. [Google Scholar] [CrossRef] [Green Version]
  5. Chow, M.F.; Bakar, M.F.A.; Arenanda, V. Influence of native plant species on substrate moisture content behaviour within extensive green roof system. In Proceedings of the 5th International Conference on Green Design and Manufacture 2019, Kota Bandung, Indonesia, 30 July 2019. [Google Scholar]
  6. Said, L.B.; Syafey, I. The scenario of reducing congestion and resolving parking issues in Makassar City, Indonesia. Case Stud. Transp. Policy 2021, 9, 1849–1859. [Google Scholar] [CrossRef]
  7. Tsigdinos, S.; Karolemeas, C.; Bkogiannis, E.; Nikitas, A. Introducing autonomous buses into street functional classification systems: An exploratory spatial approach. Case Stud. Transp. Policy 2021, 9, 813–822. [Google Scholar] [CrossRef]
  8. Ng, P.Y.; Phung, P.T. Public transportation in Hanoi: Applying an integrative model of behavioral intention. Case Stud. Transp. Policy 2021, 9, 395–404. [Google Scholar] [CrossRef]
  9. Mulley, C.; Ho, C.; Balbontin, C.; Hensher, D.; Stevens, L.; Nelson, J.D.; Wright, S. Mobility as a service in community transport in Australia: Can it provide a sustainable future? Transp. Res. Part A Policy Pract. 2020, 131, 107–122. [Google Scholar] [CrossRef]
  10. Lajas, R.; Macario, R. Public policy framework supporting “mobility-as-a-service” implementation. Res. Transp. Econ. 2020, 83, 100905. [Google Scholar] [CrossRef]
  11. Chang, X.; Wu, J.; Sun, H.; Correia, G.H.A.; Chen, J. Relocating operational and damaged bikes in free-floating systems: A data-driven modelling framework for level of service enhancement. Transp. Res. Part A Policy Pract. 2021, 153, 235–260. [Google Scholar] [CrossRef]
  12. Paundra, J.; Dalen, J.V.; Rook, L.; Ketter, W. Why is my bus suddenly so crowded? Spillover effects of the discontinuation of three-in-one policy in Jakarta. Case Stud. Transp. Policy 2021, 9, 995–1005. [Google Scholar] [CrossRef]
  13. Norhisham, S.; Bakar, M.F.A.; Tajri, A.A.; Mohamed, D.; Yatuka, S.; Masjuki, S.A.; Shkuri, N.S.M.; Zaini, N. Assessing stakeholder’s view for quality bus services in Kuala Lumpur. Int. J. Adv. Sci. Technol. 2018, 28, 359–369. [Google Scholar]
  14. Kerber, J.C.; De Souza, E.D.; Bouzon, M.; Cruz, R.M.; Govindan, K. Consumer behaviour aspects towards remanufactured electronic products in an emerging economy: Effect on demand and related risks. Resour. Conserv. Recycl. 2021, 170, 105572. [Google Scholar] [CrossRef]
  15. Acker, V.V.; Ho, L.; Mulley, C. “Satisfaction lies in the effort”. Is Gandhi’s quote also true for satisfaction with commuting? Transp. Res. Part A Policy Pract. 2021, 151, 214–227. [Google Scholar] [CrossRef]
  16. Georgiou, A.; Skoufas, A.; Basbas, S. Perceived pedestrian level of service in urban network: The case of a medium size Greek city. Case Stud. Transp. Policy 2021, 9, 889–905. [Google Scholar] [CrossRef]
  17. Pulugurtha, S.S.; Imran, M.S. Modeling basic freeway section level-of-service based on travel time and reliability. Case Stud. Transp. Policy 2021, 8, 127–134. [Google Scholar] [CrossRef]
  18. Norhisham, S.; Bakar, M.F.A.; Huri, A.H.; Mohammad, A.M.; Khalid, N.H.N.; Basri, H.; Mardi, N.H.; Zaini, N.A. Evaluting the travel demand using E-bike on Campus. Int. J. Eng. Adv. Technol. 2019, 9, 2083–2088. [Google Scholar] [CrossRef]
  19. Santos, J.B.; Lima, J.P. Quality of public transportation based on the multi-criteria approach and from the perspective of user’s satisfaction level: A case study in a Brazilian city. Case Stud. Transp. Policy 2021, 9, 1233–1244. [Google Scholar] [CrossRef]
  20. Bista, S.; Hollander, B.J.; Situ, M. A content analysis of transportation planning documents in Toronto and Montreal. Case Stud. Transp. Policy 2021, 9, 1–11. [Google Scholar] [CrossRef]
  21. Oeschger, G.; Carroll, P.; Caulfield, B. Micromobility and public transport integration: The current state of knowledge. Transp. Res. Part D Transp. Environ. 2020, 89, 102628. [Google Scholar] [CrossRef]
  22. Albacete, X.; Olaru, D.; Paul, V.; Biermann, S. Measuring the accessibility of public transport: A critical comparison between methods in Helsinki. Appl. Spat. Anal. 2017, 10, 161–188. [Google Scholar] [CrossRef] [Green Version]
  23. Plano, C.; Behrens, R. Integrating para-and scheduled transit: Minibus paratransit operators’ prespective on reform in Cape Town. Res. Transp. Bus. Manag. 2021, 42, 100664. [Google Scholar] [CrossRef]
  24. Pira, M.L.; Attrad, M.; Ison, S.G. Urban transport planning and policy in a changing world: Briding the gap between theory and practice. Res. Transp. Bus. Manag. 2021, 39, 100634. [Google Scholar] [CrossRef]
  25. Mulley, C.; Kronsell, A. Workshop 7 report: The “uberisation” of public transport and mobility as a service (MaaS): Implications for future mainstream public transport. Res. Transp. Econ. 2021, 69, 568–572. [Google Scholar] [CrossRef]
  26. Petrosino, A.; Boruch, R.F.; Soydan, H.; Duggan, L.; Sanchez-Meca, J. Meeting the challenges of evidence-based policy: The Campbell Collaboration. Ann. Am. Acad. Political Soc. Sci. 2001, 578, 14–34. [Google Scholar] [CrossRef]
  27. Shaffril, H.A.M.; Krauss, S.E.; Shamsuddin, S.F.A. Systematic review on Asian’s farmers’ adaptation practise towards climate change. Sci. Environ. 2018, 644, 683–695. [Google Scholar]
  28. Shaffril, H.A.M.; Samah, A.A.; Samsuddin, S.F.; Ali, Z. Mirror-mirror on the wall, what climate change adaptation strategies are practised by the Asian’s fisherman of all? J. Clean. Prod. 2019, 232, 104–117. [Google Scholar] [CrossRef]
  29. Moher, D.; Liberati, A.; Tetzlaff, J.; Altman, D.G.; The PRISMA Group. Preferred reporting items for systematic reviews and MetaAnalyses: The PRISMA statement. PLoS Med. 2009, 6, e1000097. [Google Scholar] [CrossRef] [Green Version]
  30. Younger, P. Using Google Scholar to conduct a literature search. Nurs. Stand. 2010, 24, 40–46. [Google Scholar] [CrossRef]
  31. Whitemore, R.; Knafl, K. The integrative review: Updated methodology. J. Adv. Nurs. 2005, 52, 546–553. [Google Scholar] [CrossRef]
  32. Sandelowski, M. Qualitative analysis: What it is and how to begin. Res. Nurs. Health 1995, 18, 371–375. [Google Scholar] [CrossRef] [PubMed]
  33. Patton, M.Q. Qualitative Research and Education Methods, 3rd ed.; Sage Publication: Thousand Oaks, CA, USA, 2002. [Google Scholar]
  34. Morton, C.; Caulfield, B.; Anable, J. Customer perceptions of quality of service in public transport: Evidence for bus transit in Scotland. Case Stud. Transp. Policy 2016, 4, 199–207. [Google Scholar] [CrossRef]
  35. Zakwan, R.M.; Khai, W.J.; Hamid, N.B.; Ibrahim, U.N. Level of service for pedestrian towards the performance of passenger information in integrated rail transit station: Sustainable criteria for station design. Int. J. New Technol. Res. 2016, 2, 127–129. [Google Scholar]
  36. Weng, J.; Di, X.; Wang, C.; Wang, J.; Mao, L. A Bus Service Evaluation Method Form Passenger’s Perspective Based on Satisfaction Surveys: A Case Study of Beijing, China. Sustainability 2018, 10, 2723. [Google Scholar] [CrossRef] [Green Version]
  37. Zhang, S.; Yuan, Z.; Cao, Z. A Frequency-Based Assignment Model under Day-to-Day Information Evolution of Oversaturated Condition on a Feeder Bus. Information 2017, 8, 19. [Google Scholar] [CrossRef] [Green Version]
  38. Saleh, S.M.; Sugiarto, S.; Anggraini, R. Analysis on Public’s Response towards Bus Reform Policy in Indonesia Considering Latent Variable. Open Transp. J. 2019, 13, 17–24. [Google Scholar] [CrossRef] [Green Version]
  39. Wang, H.; Peng, Z.; Lu, Q.; Sun, D.J.; Bai, C. Assessing Effects of Bus Services Quality on Passenger’ Taxi-Hiring Behavior. Transport 2017, 33, 1030–1044. [Google Scholar] [CrossRef] [Green Version]
  40. Li, R.; Xue, X.; Wang, H. Characteristics Analysis of Bus Stop Failure Using Automatic Vehicle Location Data. J. Adv. Transp. 2020, 2020, 8863262. [Google Scholar] [CrossRef]
  41. Al-Hawari, F.; Al-Sammarraie, M.; Al-Khaffaf, T. Design, Validation, and Comparative Analysis of a Private Bus Location Tracking Information system. J. Adv. Transp. 2020, 2020, 8895927. [Google Scholar] [CrossRef]
  42. Zuo, Z.; Yin, W.; Yang, G.; Zhang, Y.; Yin, J.; Ge, H. Determination of Bus Crowding Coefficient Based on Passenger Flow Forecasting. J. Adv. Transp. 2019, 2019, 2751916. [Google Scholar] [CrossRef]
  43. Abdullah, A.; Yudono, A.; Adisasmita, S.A.; Akil, A. Determination of Transit Service Accessibility Standard for Intercity Bus Passengers. Int. Rev. Spat. Plan. Sustain. Dev. 2020, 7, 92–105. [Google Scholar] [CrossRef] [Green Version]
  44. Liu, Y.; Chien, S.; Hu, D.; Wang, N.; Zhang, R. Developing an Extenics-Based for Evaluating Bus Transit System. J. Adv. Transp. 2020, 2020, 8879664. [Google Scholar] [CrossRef]
  45. Huo, Y.; Li, W.; Zhao, J.; Zhu, S. Modelling Bus Delay at Bus Stop. Transport 2018, 33, 12–21. [Google Scholar] [CrossRef] [Green Version]
  46. Tuang, H.N.; Hoang, T.L. Driving behavior in mixed traffic flow: A novel modal for assessing bus movement considering the interaction with motorcyclists. IATSS Res. 2019, 44, 125–131. [Google Scholar] [CrossRef]
  47. Basu, A.; Raja, B.; Gracious, R.; Vanajakshi, L. Dynamic Trip Planner for Public Transport Using Genetic Algorithm. Transport 2020, 33, 156–167. [Google Scholar] [CrossRef] [Green Version]
  48. Shukri, M.N.S.; Ponrahono, Z.; Sunoto, N.Y.; Ghazali, W.W.N.W. Evaluation of Level of Service (LOS) on Routes of Smart Bus in Kajang, Selangor. J. Malays. Inst. Plan. 2020, 18, 241–250. [Google Scholar] [CrossRef]
  49. Wu, J.; Ji, Y.; Sun, X.; Xu, Y. Guidance Optimization of Travellers’ Travel Mode Choice Based on Fuel Tax Rate and Bus Departure Quantity in Two-Mode Transportation System. J. Adv. Transp. 2020, 2020, 4190632. [Google Scholar] [CrossRef]
  50. Cheng, X.; Cao, Y.; Huang, K.; Wang, Y. Modelling the Satisfaction of Bus Traffic Transfer Service Quality at a High-Speed Railway Station. J. Adv. Transp. 2018, 2018, 7051789. [Google Scholar] [CrossRef]
  51. Huo, Y.; Liu, J.; Li, X. Development of Fuzzy Level of Service Criteria for Bus Rapid Transit considering User Heterogeneities in China. J. Adv. Transp. 2020, 2020, 8844590. [Google Scholar] [CrossRef]
  52. Wang, J.; Cao, Y. Operating Time Division for a Bus Route Based on the Recovery of GPS Data. J. Sens. 2017, 2017, 1321237. [Google Scholar] [CrossRef] [Green Version]
  53. Wei, M.; Liu, T.; Sun, B.; Jing, B. Optimal Integrated Model for Feeder Transit Route Design and Frequency-Setting Problem with Stop Selection. J. Adv. Transp. 2020, 2020, 6517248. [Google Scholar] [CrossRef]
  54. Zhao, S.; Wang, D.; Sun, J.; Liu, H. Optimization Model for Multiple-Vehicle-Type Structure in Urban Bus Systems. Math. Probl. Eng. 2017, 2017, 7914318. [Google Scholar]
  55. Zhou, F.; Wu, J.; Xu, Y.; Yi, C. Optimizing Scheme of Tradable Credits and Bus Departure Quantity for Travellers’ Mode Choice Guidance. J. Adv. Transp. 2020, 2020, 6665161. [Google Scholar] [CrossRef]
  56. Amrapala, C.; Choocharukul, K. Perceived Service Quality and Commuter Segmentation of Informal Public Transport Service in Bangkok, Thailand. Eng. J. 2019, 23, 1–18. [Google Scholar] [CrossRef]
  57. Ponrahono, Z.; Bachok, S.; Osman, M.M.; Ibrahim, M.; Abdullah, M.F. Public Bus Level of Service Performance in Peninsular Malaysia: Correlation Analyses on Level of Service (LOS) and Passenger’s Satisfaction Level. J. Malays. Inst. Plan. 2017, 15, 229–234. [Google Scholar]
  58. Minhas, A.; Chatterjee, A.; Popli, S. Public perceptions: An important determinant of transport users’ travel behaviour. J. Stud. Res. Hum. Geogr. 2020, 14, 177–196. [Google Scholar]
  59. Mou, Z.; Zhang, H.; Liang, S. Reliability Optimization Model of Stop-Skipping Bus Operation with Capacity Constraints. J. Adv. Transp. 2020, 2020, 4317402. [Google Scholar] [CrossRef] [Green Version]
  60. Wang, J.; Yamamoto, T.; Liu, K. Role of Customized Bus Service in the Transportation System: Insight from Actual Performance. J. Adv. Transp. 2020, 2019, 6171532. [Google Scholar] [CrossRef] [Green Version]
  61. Gogoi, L. Service Delivery and Consumer’s Satisfaction under Assam State Transport Corporation (ASTC). Int. J. Innov. Technol. Explor. Eng. 2019, 8, 1845–1850. [Google Scholar]
  62. Cui, J.; Gao, Y.; Cheng, J.; Shi, L. Study on the Selection Model of Staying adjustment Bus Lines along Rail Transit. J. Adv. Transp. 2020, 2020, 6385359. [Google Scholar] [CrossRef]
  63. Ngadiman, N.I.; Roslan, N.F.; Rahman, A.F.; Ahmad, F.; Daud, M.M.S.; Abdullah, R. Survey on Quality of Service (QoS) at Larkin Central Terminal (LCT), Johor Bahru. Int. J. Adv. Trends Comput. Sci. Eng. 2020, 9, 229–232. [Google Scholar] [CrossRef]
  64. Purba, A.; Nakamura, F.; Herianto, D.; Diana, W.I.; Jafri, M.; Niken, C. Transit Systems Service Quality in a Tourism-Education City and a Business City. Int. J. Technol. 2017, 6, 1159–1167. [Google Scholar] [CrossRef] [Green Version]
  65. Norhisham, S.; Bakar, M.F.A.; Tajri, A.A.; Mohamed, D.; Yatuka, S.; Masjuki, S.A.; Shukri, N.S.M.; Zaini, N. Statistical overview on quality bus service in Klang Valley. Int. J. Adv. Sci. Technol. 2019, 28, 370–380. [Google Scholar]
  66. Borhan, M.N.; Ibrahim, A.N.H.; Syamsunur, D.; Rahmat, R.A. Why Public Bus is a Less Attractive Mode of Transport: A Case Study of Putrajaya, Malaysia. Period. Polytech. Transp. Eng. 2019, 47, 82–90. [Google Scholar] [CrossRef] [Green Version]
  67. Canitez, F.; Alpkokin, P.; Black, J.A. Agency costs in Public Transport systems: Net-cost contracting between the transport authority and private operators-impact on passenger. Cities 2018, 86, 154–166. [Google Scholar] [CrossRef]
  68. Li, Z.; Wang, Y. Analysis of multimodal two-dimensional urban system equilibrium for cordon toll pricing and bus service design. Transp. Res. Part B 2018, 111, 244–265. [Google Scholar] [CrossRef]
  69. Zhao, X.; Ji, K.; Xu, P.; Qian, W.; Ren, G.; Shan, X. A round-trip bus evacuation model with scheduling and routing planning. Transp. Res. Part A 2020, 137, 285–300. [Google Scholar] [CrossRef]
  70. Suman, K.H.; Bolia, N.B.; Tiwari, G. Comparing public bus transport service attributes in Delhi and Mumbai: Policy implications for improving bus service in Delhi. Transp. Policy 2017, 56, 63–74. [Google Scholar] [CrossRef]
  71. Sharma, D.; Pandit, D. Determining the level of service measures to evaluate service quality of fixed route shared motorized para-transit services. Transp. Policy 2021, 100, 176–186. [Google Scholar] [CrossRef]
  72. Deb, S.; Ahmed, M.A. Determining the service quality of the city bus service based on users’ perceptions and expectations. Travel Behav. Soc. 2018, 12, 1–10. [Google Scholar] [CrossRef]
  73. Esmailpour, J.; Aghabayk, K.; Vajari, M.A.; Gruyter, C.D. Importance-Performance Analysis (IPA) of bus services attributes: A case study in a developing country. Transp. Res. Part A 2020, 142, 129–150. [Google Scholar] [CrossRef]
  74. Cheranchery, M.F.; Maitra, B. Investigating perceptions of captive and choice riders for formulating service standards of ordinary and premium buses in Indian cities. Transp. Policy 2018, 72, 89–96. [Google Scholar] [CrossRef]
  75. Nguyen-Phunoc, D.Q.; Tran, A.T.P.; Nguyen, T.V.; Le, P.T.; Su, D.N. Investigating the complexity of perceived service quality and perceived safety and security in building loyalty among bus passenger in Vietnam-A PLS-SEM approach. Transp. Policy 2021, 101, 162–173. [Google Scholar] [CrossRef]
  76. Wu, W.; Liu, R.; Jin, W. Modelling bus bunching and holding control with vehicle overtake and distributed passenger boarding behavior. Transp. Res. Board Part B 2017, 104, 175–197. [Google Scholar] [CrossRef]
  77. Cho, Y.; Egan, T.M. Action Learning Research: A Systematic Review and Conceptual Framework. Hum. Resour. Dev. Rev. 2009, 8, 431–462. [Google Scholar] [CrossRef]
  78. Rocco, T.S.; Plakhotnik, M.S. Literature Reviews, Conceptual Frameworks, and Theoretical Frameworks: Terms, Functions, and Distinctions. Hum. Resouces Dev. Rev. 2009, 8, 120–130. [Google Scholar] [CrossRef] [Green Version]
  79. Friman, M.; Lattman, K.; Olsson, L.E. Public Transport Quality, Safety, and Perceived Accessibility. Sustainability 2020, 12, 3563. [Google Scholar] [CrossRef]
  80. Pemberton, S. Optimizing Melbourne’s bus routes for real-life travel patterns. Case Stud. Transp. Policy 2020, 8, 1038–1052. [Google Scholar] [CrossRef]
  81. Tavares, V.B.; Lucchesi, S.T.; Larranaga, M.A.; Cybis, B.B.H. Influence of public transport quality attributes on user satisfaction of different age cohorts. Case Stud. Transp. Policy 2021, 9, 1042–1050. [Google Scholar] [CrossRef]
  82. Rabay, L.; Miera, L.H.; Andrade, M.O.; Oliveira, L.K. A portrait of the crisis in the Brazilian urban bus system: An analysis of factors influencing the reduction in usage. Case Stud. Transp. Policy 2021, 9, 1879–1887. [Google Scholar] [CrossRef]
  83. Joewono, T.B.; Kubota, H. User perception of private paratransit operation in Indonesia. J. Public Transp. 2007, 10, 99–118. [Google Scholar] [CrossRef] [Green Version]
Figure 1. Flow diagram of adapted in this study.
Sustainability 14 07998 g001
Figure 2. Countries where studies were conducted.
Sustainability 14 07998 g002
Figure 3. Year of publications.
Sustainability 14 07998 g003
Figure 4. The identified attribute towards services quality of bus performance.
Sustainability 14 07998 g004
Table 1. The search strings.
Database Search String
SCOPUSTITLE-ABS-KEY((“urban” OR “town” OR “ city” OR “ transport’’ OR “urban transport” OR “city transport” OR “public transport”) AND (“bus *” OR “urban bus *” OR “town bus *” OR “city bus *” OR “bus * service *” OR “stage bus *” OR “transit bus” OR “rapid bus *”) AND (“service *” OR “quality *” OR “service * quality *” OR “S” OR “quality * of service *” OR “level * of service *” OR “quality * standard” OR “quality * classif *” OR “service * performance” OR “bus capacity *” OR “service * attribute *”
Science DirectTS = ((“transport” OR “urban transport” OR “city transport” OR “public transport”) AND (“bus” OR “urban bus” OR “city bus” OR “bus service”) AND (“Service quality” OR “quality of service” OR “Level of Service” OR “service performance” OR “Bus capacity” OR “service Attribute”))
“*” represent the search for any terms that begin with certain word in retrieving article in Scopus.
Table 2. The inclusion and exclusion criteria.
CriteriaEligibilityExclusion
Type of literatureJournal (research articles)Journal (review), book series, book, book chapter, conference proceedings
LanguageEnglishNon-English
TimelineBetween 2021 and 2017<2017
Countries and RegionsAsian countriesNon-Asian countries
Subject areaEngineering, social science, computer science and environmental scienceOther than Engineering, social science, computer science, and environmental science
Publisher’s Note: MDPI stays neutral with regard to jurisdictional claims in published maps and institutional affiliations.

