Article

Automatically Generating Scenarios from a Text Corpus: A Case Study on Electric Vehicles

by
Christopher W. H. Davis
1,
Antonie J. Jetter
1 and
Philippe J. Giabbanelli
2,*
1
Department of Engineering & Technology Management, Portland State University, Portland, OR 97201, USA
2
Department of Computer Science and Software Engineering, Miami University, Oxford, OH 45056, USA
*
Author to whom correspondence should be addressed.
Sustainability 2022, 14(13), 7938; https://doi.org/10.3390/su14137938
Submission received: 1 June 2022 / Revised: 23 June 2022 / Accepted: 27 June 2022 / Published: 29 June 2022

Abstract

:
Creating ‘what-if’ scenarios to estimate possible futures is a key component of decision-making processes. However, this activity is labor intensive as it is primarily done manually by subject-matter experts who start by identifying relevant themes and their interconnections to build models, and then craft diverse and meaningful stories as scenarios to run on these models. Previous works have shown that text mining could automate the model-building aspect, for example, by using topic modeling to extract themes from a large corpus and employing variations of association rule mining to connect them in quantitative ways. In this paper, we propose to further automate the process of scenario generation by guiding pre-trained deep neural networks (i.e., BERT) through simulated conversations to extract a model from a corpus. Our case study on electric vehicles shows that our approach yields similar results to previous work while almost eliminating the need for manual involvement in model building, thus focusing human expertise on the final stage of crafting compelling scenarios. Specifically, by using the same corpus as a previous study on electric vehicles, we show that the model created here either performs similarly to the previous study when there is a consensus in the literature, or differs by highlighting important gaps on domains such as government deregulation.

1. Introduction

What-if questions are essential to making decisions by reasoning about the potential impacts of a situation. The situation could be an intervention (e.g., What happens to the sustainability of a city if we promote green spaces?) or a continuation of current trends (e.g., What happens in ten years if we continue with current emissions of pollutants?) [1]. A what-if question pertains to a specific system. For example, it would be impossible to answer the two questions above without a clear definition of the system (e.g., How do we measure sustainability? What is impacted by green spaces?). A scenario thus raises what-if questions of interest within the context of a clearly defined system, for example, by listing relevant factors and connecting them to track causal impacts. In other words, a scenario is a self-contained story about a potential future [2,3]. Scenarios have several demonstrated benefits for the decision-making activities of teams, such as raising awareness for the dynamics of an environment, managing uncertainty, evaluating different products, or breaking away from groupthink [4,5,6,7]. The field of scenario planning has articulated many approaches to craft such scenarios [8], often with the objective of producing a small number (typically 3–8) of plausible and alternative scenarios that cover different futures [9]. The quality of these scenarios is assessed through various criteria, such as plausibility [10], creativity [11], transparency [12], sufficient differentiation [13], relevance [14], or consistency [15].
A recurrent challenge is that scenario planning is a time-consuming and demanding process, for at least three reasons. First, the complexity of a system often calls for several subject-matter experts (SMEs), who are identified and involved via a trained facilitator to shed light on driving forces and current trends. Comprehensively understanding a system can thus be a significant endeavor, mobilizing numerous SMEs and necessitating the availability of a trained facilitator [16,17]. Second, there may be disagreements among SMEs on how some aspects of a system operate, or such mechanisms may simply by unknown. Similarly, some existing trends in the system or the actions planned by other stakeholders may not be known. There is thus a need to represent uncertainty. Third, under many scenario-planning techniques, teams focus on the ‘big picture’ to assess the futures of entire markets, industries, or even societies. While this is useful for high-level strategical thinking, it does not address the needs of teams who need more granular information to make tactical decisions related to specific products.
Given these challenges, there has been particular interest in automating some or all of the process of scenario planning, resulting in Foresight Support Systems [18,19]. Text collections have been an essential data source for such systems [20], as an indirect way to obtain vast amounts of domain expertise. This reflects a broader trend in future studies, which leverages unstructured data from websites, news posts, or academic journals [21,22,23,24]. These text collections have primarily been analyzed through web scrapping and topic modeling; recent examples include [25,26,27,28]. However, none of these studies fully automated the end-to-end process of scenario generation. For instance, [26] manually map the system, and [27,28] manually perform desk research and verification. Even works leveraging advances in natural language processing (NLP), such as BERT, contain a manual step of risk identification [29]. In this paper, we posit that there is a potential to go further in leveraging the information connected through massive text collection by using NLP to extract models of the system and craft scenarios.
In this paper, we improve the automatization of scenario generation by combining natural language processing and Fuzzy Cognitive Maps (FCMs). Our proposed tool is named SAAM, for Scenario Acceleration through Automated Modelling, and is available open source [30]. By emphasizing a fully automatic approach, we seek to drastically reduce the barriers to scenario development for teams who do not have the time or capacity to engage with subject-matter experts and trained facilitators.
To demonstrate the efficiency of our tool, we then apply it to a case study regarding electric vehicles (EVs). EVs were chosen as a guiding example for our technique as there is a demonstrated need and interest in scenario generation [31,32,33]. In particular, the scenarios covered by our case study include key themes about EVs, such as adoption [34,35,36], regulation and policy incentives [37,38,39], and technological enablers [40,41].
The remainder of this paper is structured as follows: To ensure that the manuscript is self-contained and usable both for computational scientists and sustainability specialists, our Background section provides the foundations for NLP and FCMs. Our Methods section builds on these foundations to introduce our proposed tool, SAAM. To demonstrate the efficiency of our tool, we then apply it to a case study regarding electric vehicles. Our results are compared with those obtained on the same corpus in a previous study performed by another group, showing that our model performs either similarly (with less manual involvement) or reveals important gaps. Our Discussion section contextualizes the potential of SAAM and outlines its limitations as well as opportunities for future improvements.

2. Background

2.1. Fuzzy Cognitive Maps

As evoked in the introduction, a scenario exists within the context of a clearly defined system. In other words, we need to model this system. Suitable modeling approaches fall into two broad categories. Conceptual models (e.g., causal maps, causal loop diagrams, mind maps) provide a structure to the system by identifying relevant factors and their interconnections [42,43,44]. Conceptual models have several benefits, such as identifying key factors in a system (e.g., via centrality), revealing themes (e.g., via community detection), or comparing perspectives (e.g., via Graph Edit Distance) [44,45,46]. However, these models offer limited support for scenario planning. For example, we can ask what will be impacted in a scenario, and we will follow links in the model to provide a list (e.g., via a Breadth-First Search). However, there is no quantification; hence, we cannot say whether some elements will be impacted more or less. In other words, the inability of a conceptual model to provide a quantitative estimate limits the decision-support tasks for which they are suitable. The second category of quantitative (aggregate) models offers these capabilities, but building them requires significantly more work [47]. Quantitative models are simulation models, which means that they can provide numerical answers by updating values based on certain rules. A well-known quantitative approach is System Dynamics [48], where the model runs differential equations to update concepts based on rates over time; this approach can provide highly accurate point-estimates, but requires significant quantitative data. Fuzzy Cognitive Maps (FCMs) do not include the notion of time; hence, they are simpler to build (e.g., entirely from qualitative data) at the expense of lower accuracy (i.e., cannot know exactly when an effect will be obtained) [49]. FCMs have been used in over 20,000 studies [50], including many works on scenario planning, as they provide quantitative system models that suffice to represent the driving forces that shape the future (e.g., technology, economy, social trends) and their interdependencies. Recent examples in sustainability include modeling the wind energy sector [51,52], social sustainability [53,54], planning viewed by rural communities [55] or urbanites [56], or managing waste flows [57]. Throughout these examples, the FCM is used for simulations by varying the input values to produce multiple scenarios; since the scenarios are all based on the same model, they are guaranteed to be internally consistent.
Mathematically, an FCM has two parts: a causal structure (similar to a conceptual model) and an inference engine (to run simulations). The causal structure is represented as a directed, weighted, labeled graph G = ( V , E ) , where V is the set of labeled nodes and E is the set of directed edges. Both nodes and edges have a weight. The weight of each node changes over each simulation step t to denote the extent to which a concept is present (1) or absent (1); it is denoted by v i t [ 0 , 1 ] . The weight of each edge is held constant as it is considered a property of the system (e.g., if there are many anglers, then there are much less fish), whereas nodes correspond to a case (How many fish are there at a given point?). Edges are represented with an adjacency matrix, where W i , j [ 1 , 1 ] indicates the weight from node i to j . The weight is 0 if there is no relationship, positive if an increase in i causes an increase in j , and negative if an increase in i causes a decrease in j . The inference engine operates by synchronously updating all the nodes’ values per Equation (1):
v i t + 1 = f ( v i t + j V , j i W j , i × v j t )                        
Intuitively, this update means that the next value of a node accounts for its current value (i.e., there is memory for one step), as well as the values of all incident nodes and the corresponding causal strengths. The function f serves to keep the output in the desired range [ 0 ,   1 ] . The update is performed until a stopping condition is met. The desired stopping condition is that a set of key nodes O (considered as outputs of the system) change by less than a user-defined value ε between two consecutive iterations. It is possible that this desired situation is not reached, due to oscillations or chaotic attractors. To ensure that the algorithm stops in any case, a secondary condition is a hard cap on the maximum number of iterations τ. Consequently, the updates stop if and only if Equation (2) holds true [58]:
o O ,   | v o t v o t 1 | ε   o r   t τ            
As the mathematics of FCMs have been abundantly covered elsewhere, we refer the reader to seminal reviews for further details [59,60]. In this paper, our interest is on (i) generating FCMs from text, and (ii) using them to craft scenarios. With regard to (i), we note that several works have extracted causal maps from text [26,61,62,63]; hence, they could generate the causal structure, but did not produce a complete FCM. Some works have focused on creating FCMs from summaries or large collection of documents [64,65], but they needed manual interventions (e.g., manual labeling, expert verification); hence, the process was only semi-automatic. The objective of (ii) building scenarios with FCMs is pursued by many studies [66,67,68], with several examining the role of FCMs as a communication tool to engage stakeholders in scenario generation [69,70].

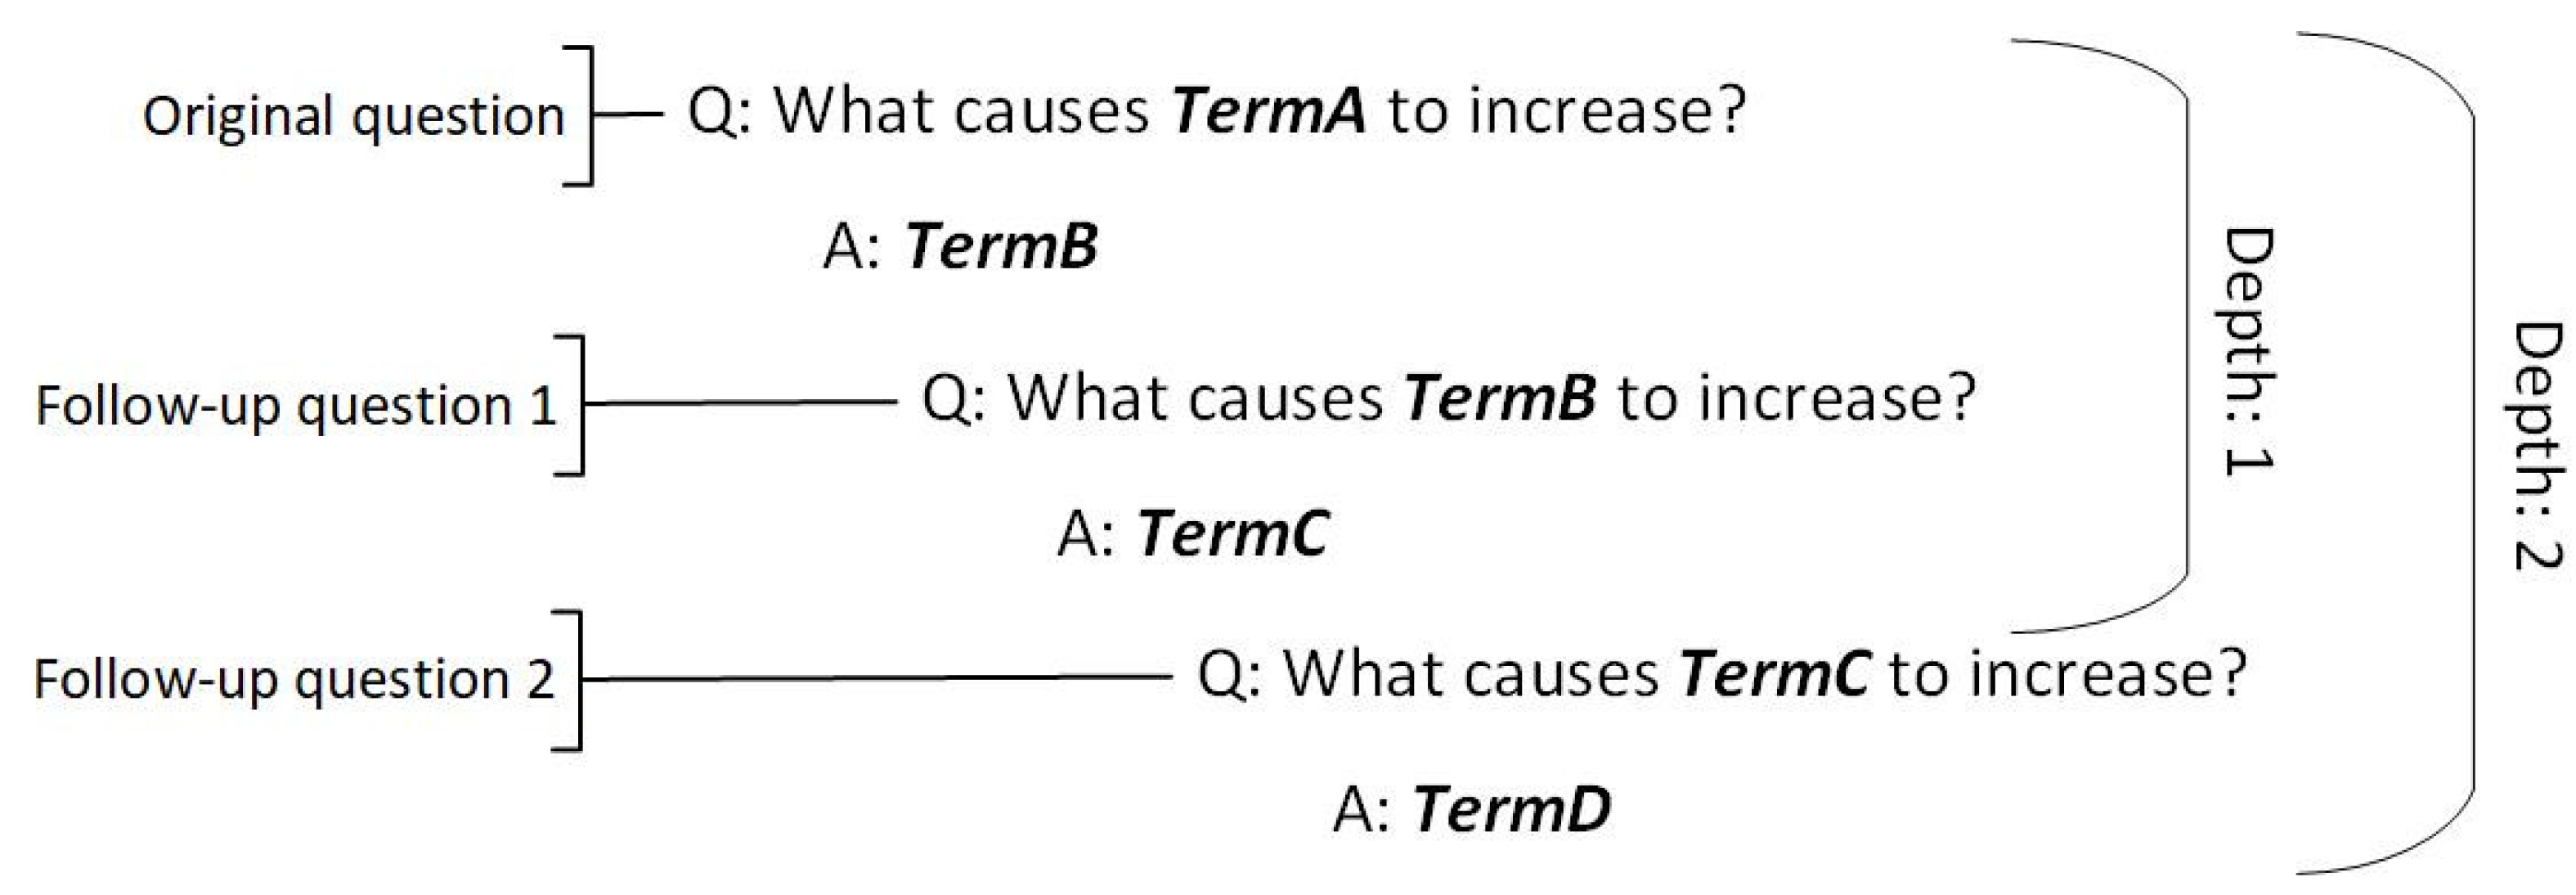
2.2. Natural Language Processing

The major companies that own big data (e.g., Microsoft, Google, Amazon) have heavily invested in model creation and made several of the resulting models available to researchers and practitioners through their web services. For example, Google provides pre-trained models for natural language processing via its Natural Language AI. Pre-trained models in NLP often leverage deep neural networks, resulting in highly used models such as BERT or GPT [71,72]. BERT is of particular interest here, as it has previously been used to extract causal models from text [29]. We recently described BERT as follows [73]:
“BERT is a pre-trained deep bidirectional transformer, whose architecture consists of multiple encoders, each composed of two types of layers (multi-head self-attention layers, feed forward layers). To appreciate the number of parameters, consider that the text first goes through an embedding process (two to three dozen million parameters depending on the model), followed by transformers (each of which adds 7 or 12.5 million parameters depending on the model), ending with a pooling layer (0.5 or 1 million more parameters depending on the model). All of these parameters are trainable.”
Intuitively, BERT models are trained by first creating a base model on a large unstructured dataset that can make predictions such as what word might appear next in a sentence. Secondly, the previous learnings are transferred, and models are fine-tuned on specific datasets that allow such functionality as answering questions based on the text in the dataset. To achieve this, BERT uses multiple layers of encoding so it can predict context and “understand” the difference between semantically similar terms such as “apple pie” or “apple tree” by encoding (1) the words, (2) the sentences, and (3) the positions of the words in the text. This combination of tokens is then fed into a neural network that creates the base model, which can be fine-tuned on specific text for NLP tasks. For a more detailed description of BERT, we refer the reader its highly cited source [74].
The core idea of repurposing BERT to extract a causal model is to build a question-answering (Q&A) system [75] in which we ask the question of what ‘causes’ or ‘results’ from a given factor, and then repeat the process on these causes and consequences to gradually build a model. In other words, a Q&A system can determine connections and causality between concepts in the model. By asking the system, “why do people buy more electric cars?” a human user identifies a concept of interest through the question—in this case, “electric cars”. Q&A systems provide the answer by treating a pre-selected text corpus as the context. In this example, the corpus would focus on the electric car industry.
To briefly illustrate this notion within the context of sustainability, consider the following example of the fashion supply chain and the guiding question, “What causes pollution?” By applying a Q&A BERT-based model from the Hugging Face project [76] on online books about the fashion supply chain, we obtain a sample output such as in Table 1. Items in the ‘answer’ columns are concepts, the ‘confidence’ is the degree of certainty with which the algorithm identified the answer, and the ‘context’ provides an excerpt from the most relevant document containing the answer. In this example, “fast fashion brands” is returned with high confidence because it is directly referenced in the text as a cause of pollution, whereas very low confidence was returned for the other concepts because they are mentioned together but do not answer the question based on the text provided. The more text that associates fast fashion brands with pollution, the higher the confidence value would be. The context can also help to identify more relevant concepts, which can be used for further questions [77]. For instance, ‘sustainable development’ is mentioned as part of the answer ‘global climate change’, and it could lead to another line of questioning by asking the Q&A system, “What types of sustainable development are happening in the fashion industry?”.

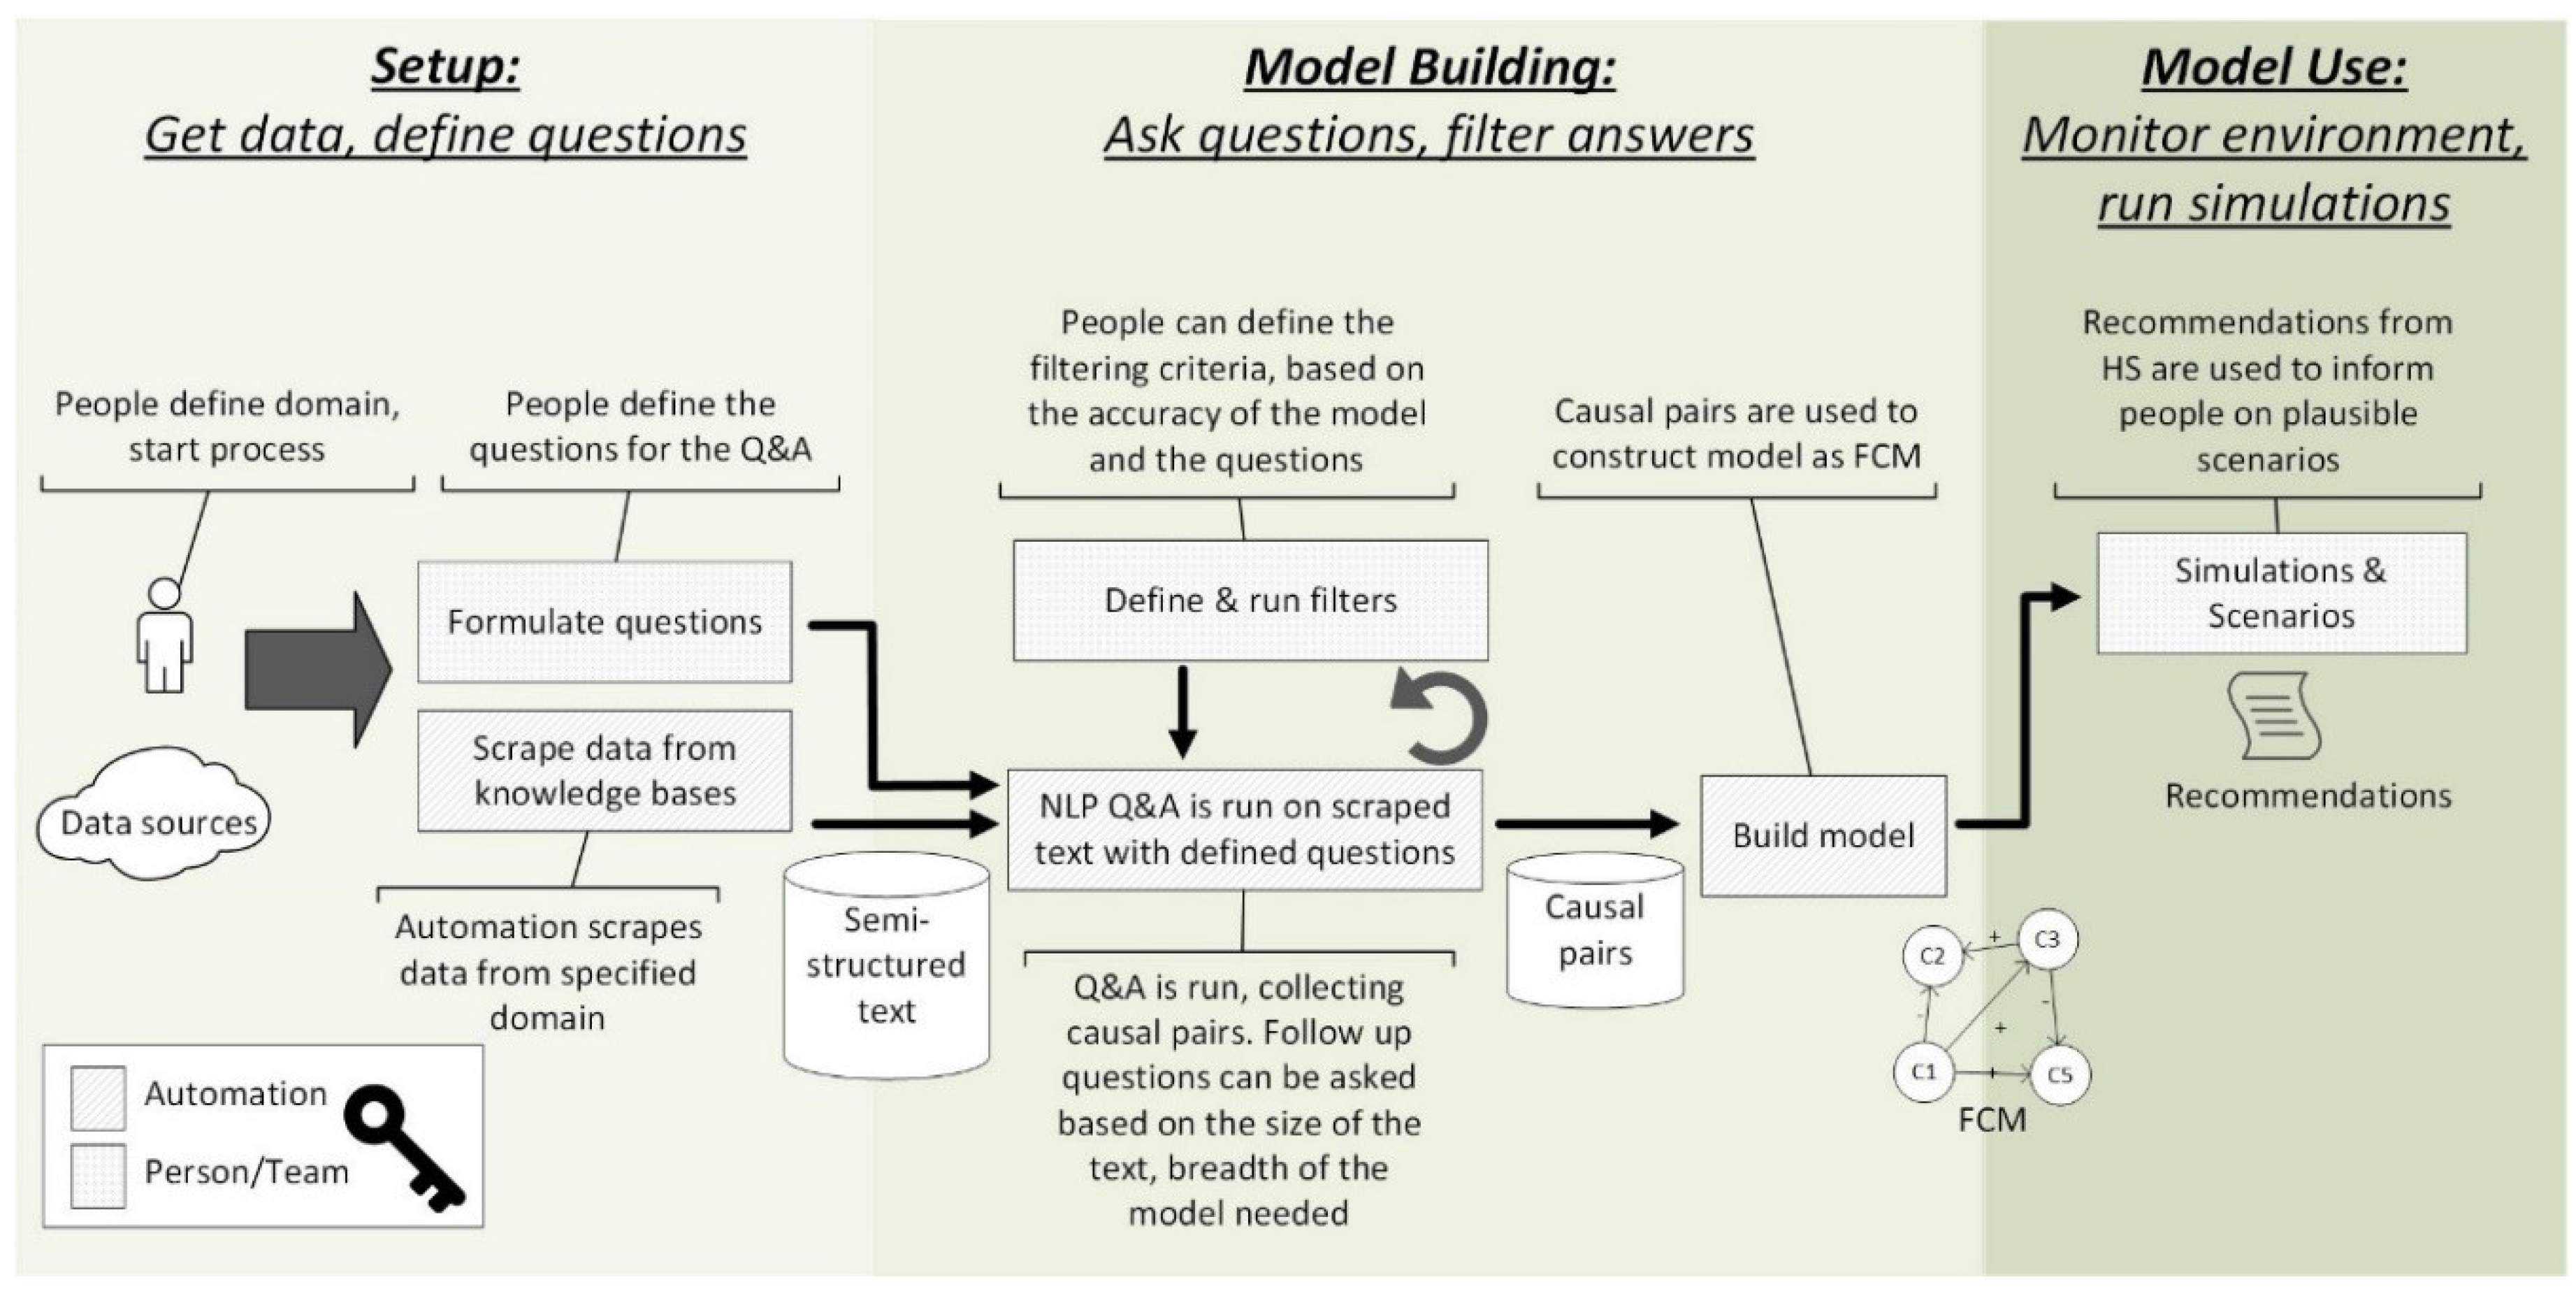
3. Design of the Proposed SAAM tool

Overview

Our work seeks to automate the process of scenario generation. However, the analysts still need to be involved in defining the question and pointing to acceptable data sources. From that point onward, the automatic process can run. Overall, our proposed SAAM tool is composed of three stages: setup (which is manual), model building (which is automatized), and model use by humans (Figure 1); each of these stages is explained in a dedicated subsection below. Several parameters are involved in these stages, as summarized in Table 2. In short, the automation collects the data, runs the Q&A algorithms to find traceable answers from the text corpus, and builds the initial model as a Fuzzy Cognitive Map. People can inspect the answers, define filters, and potentially ask more questions to build out the model further. Once the model is fully built, people use it to run their scenarios. This process promotes an interplay of human interaction and Artificial Intelligence, hence following the human-in-the-loop approach that is increasingly promoted in machine learning to create more explainable models [78,79].
Phase 1: Setup by defining questions and identifying relevant data sources.
Depending on the application domain, the modeling team starts by determining the questions to ask. This does not depend on their computational knowledge. It may depend on the stakeholders and commissioners, as is the case for any modeling endeavor [80]. For instance, if the modeling team seeks to better understand the future of self-driving vehicles, then they may ask questions that contain key terms such as “self-driving”, “vehicles”, or “self-driving cars”. That is, they are responsible for identifying a set of seed concepts (or “nodes” of an FCM) belonging to the domain. If the modeling team is unsure about keywords that characterize a domain, they can also use NLP on relevant documents to extract candidate keywords, for instance, by removing stop-words and then extracting keywords with high frequency using libraries such as RAKE or Gensim. The keywords need to be structured into a question that can be passed onto a Q&A system. Two main options are as follows: If the team seeks a model to perform cause-and-effect analyses, then they may start with questions such as “what causes [phenomenon] to increase” and its complementary “what causes [phenomenon] to decrease”; this is similar to a facilitated modeling process investigating risks and protective factors [43]. Alternatively, if the team seeks a model that explores drivers for a specific technology, then they define questions based on the Political, Economic, Social, Technical, Environmental, and Legal (PESTEL) aspects of the technology. The PESTEL framework has been commonly used in scenario planning [81,82] and will be exemplified in our case study.
The modeling team also identifies appropriate data sources. These may include journal articles, newspaper articles, or websites that provide detailed information for the target domain.
Phase 2: Model building through the Q&A System and filtering.
The modeling team is responsible for specifying the number of iterations through which the system should build a model (i.e., ‘question depth’). For example, after finding that A causes B, the model could be expanded to know what causes B, leading to another round of questions on increasing and decreasing causes of B; this would constitute a question depth of 1 (Figure 2). A modeler may choose a higher question depth if they only have a single question to start with, or if the corpus used is very large. After a certain number of iterations, answers typically start to decrease in confidence because they reach the knowledge limits of the corpus.
Given (i) the corpus and (ii) the set of questions originating from phase 1, as well as (iii) the question depth, we use an NLP Q&A system to repeatedly find connections between concepts. Our work specifically uses the Hugging Face Q&A pipelines, but implementations can also be achieved via other open-source solutions such as Sentence Transformers [83]. When a factor X is identified as increasing Y, then we create an edge from X to Y with the value 1; conversely, if X decreases Y, then the edge has the value −1. Tracking the polarity of the relationship is important to later create the FCM.
Similar to the example in Table 1, the Q&A system responds to each question by providing the answer, together with a confidence level between 0 and 1, indicating the probability that the model got the correct answer, and token markers indicating where in the document the answer was found. For example, if a document contains the sentence “Pollution is a direct cause of a lower standard of living,” and the Q&A algorithm asks the question, “what causes lower standards of living?”, the model will return “pollution” as the answer, a high probability such as 0.89, and the beginning position in the document to where the answer was found. From these values, the answer and confidence score are directly relevant to assisting the modeler, and the token marker can be used to find the sentence and the document the answer was found in to give people using SAAM the full context of the answer. In this example, it is as if the model is saying “I am pretty sure that pollution is the answer because of this excerpt from the text you showed me”. If responses were unfiltered, three problems could occur. First, answers with low confidence could be included, resulting in noise in the model. Second, words that look different but actually have the same meaning would be kept separately, hence resulting in a seemingly comprehensive but actually redundant model. Third, the name of a concept is usually a noun, but answers may consist of other types of words such as adjectives, which would be harder to interpret as labels in a causal model (e.g., the noun ‘height’ would be preferable to the adjective ‘tall’).
We handle these three situations through three filters, whose values can be set by the user. First, to avoid noise, the modeler may only keep connections that were returned with a high degree of confidence, thus filtering out results whose confidence is below a user-defined confidence threshold. The threshold depends on the Q&A model used and the corpus; hence, it should only be determined by the modeler after reviewing the initial results. Second, to avoid redundancy, the user provides a semantic similarity threshold between concepts such that answers above this value are deemed similar and merged. The semantic distance can be defined using Levenshtein or cosine distances. Our implementation uses the Levenshtein distance provided by the fuzzywuzzy library in Python [84], where a threshold of 100 is an exact match, and the closer to 0, the larger the distance between words. Finally, Part Of Speech (POS) tagging gives us the type for each word, and the user can filter out POS that do not belong to a causal model. We use the spaCy library [85] for this purpose. The default filter removes adjectives, punctuation, particles, symbols, and interjections.
Phase 3: Using the model.
Phase 2 produces a model in the form of a Fuzzy Cognitive Map. As explained in our background, scenarios can be built using this FCM, based on situations that are currently considered by stakeholders. This is illustrated in the next section through our application of SAAM to electric vehicles.

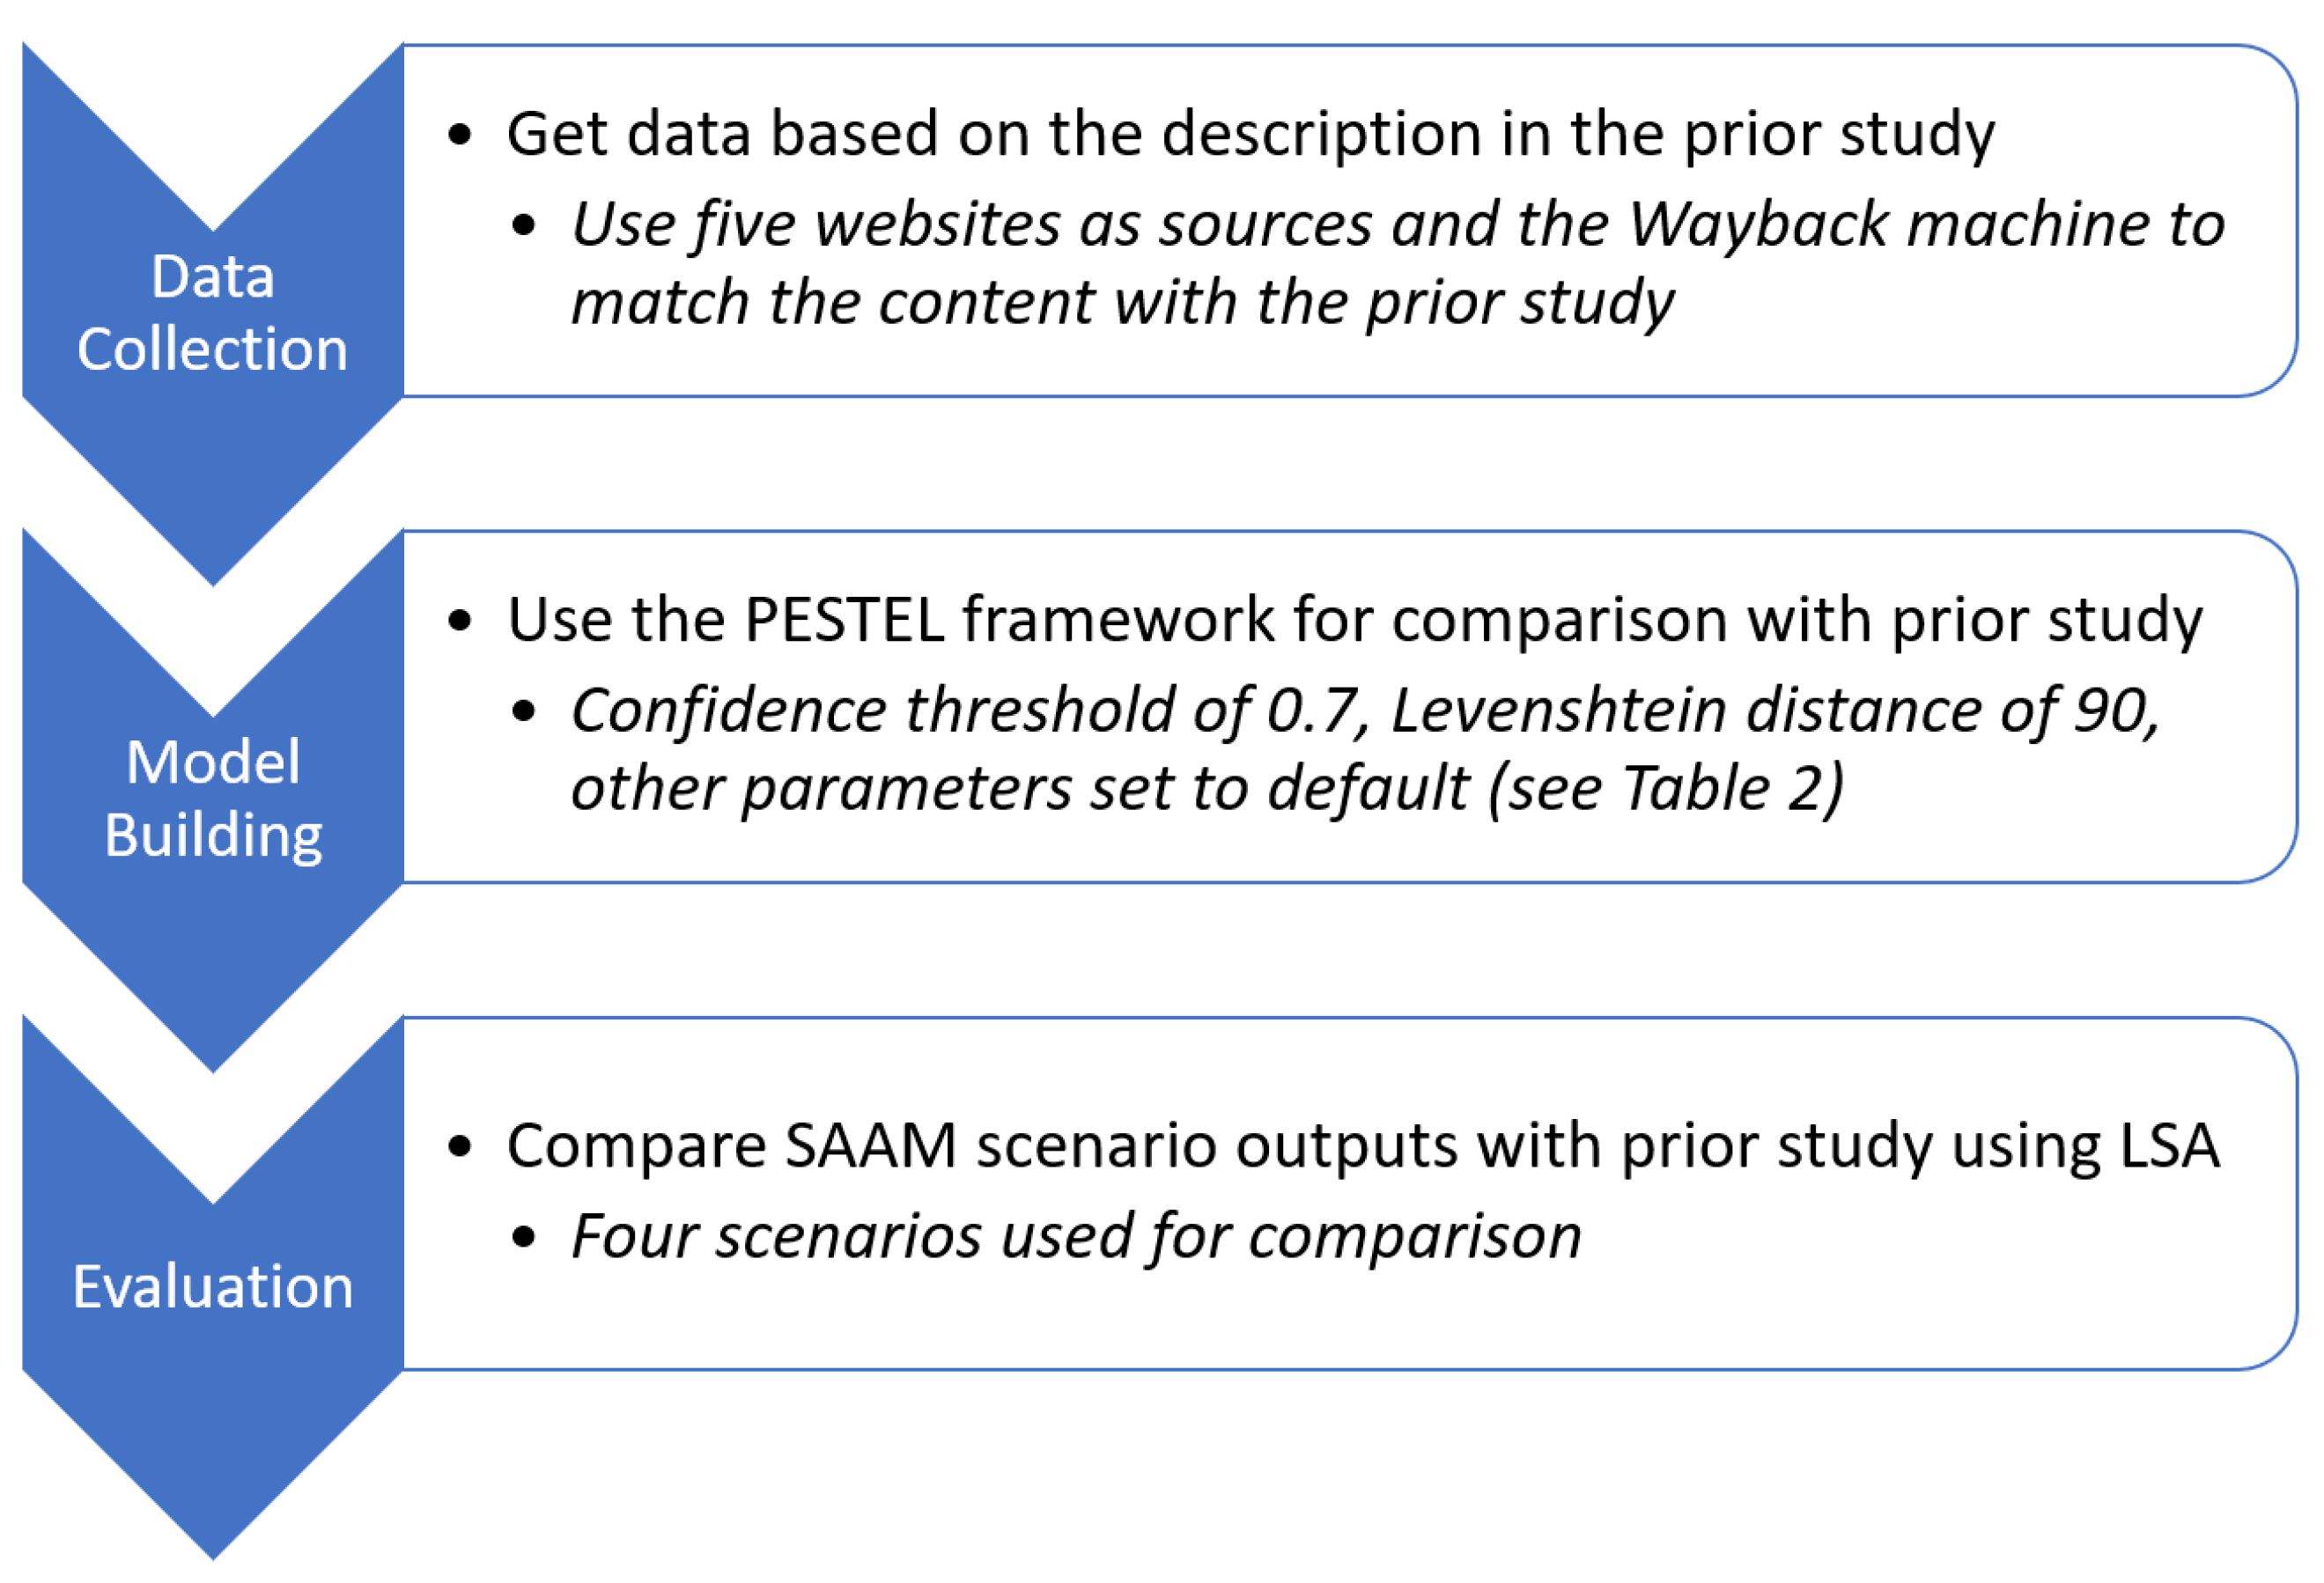
4. Methods: Applying SAAM to Study Electric Vehicles

4.1. Overview

Our case study demonstrates the ability of our proposed SAAM system to extract concepts and causal links from a text, structure them into an FCM model, and use the model to run simulations on alternative future scenarios that are plausible, decision-relevant, and cover the range of uncertainty. For a fair comparison of the results obtained by SAAM, our case study follows the published work of another research team, such that we have matching objectives (study of electric vehicles), but different techniques. Specifically, the prior work used the PESTEL framework, followed by Latent Semantic Analysis (LSA) and Fuzzy Association Rule Mining to build a model semi-automatically [87]. The differences between their work and our approach are visually summarized in Figure 3. Most importantly, concept mapping was a manual endeavor in the previous study, while our work seeks to automatize this task as part of model building. Consequently, our comparison of SAAM’s output with the previous study seeks to determine whether a more automatic approach can yield a similar model. Our workflow is summarized in Figure 4 and detailed in the following subsections.

4.2. System Setup: Data Sources, Seed Questions, Parameters

The authors of the comparison study did not publish the data they used. Consequently, we reconstructed the datasets from their description. Specifically, they scraped five websites: Siemens [88], MIT Technology Review [89], Kurzweil Accelerating Intelligence [90], World Future Society [91], and FutureTimeLine [92]. These sites were used by the authors of the prior work because they all provided articles that were future-oriented, hence, already containing an analysis of trends and expert insight on potential futures. Note that the prior work was published in 2016; hence, it would not be a fair comparison if we built a model based on the data available up to today (2022). In addition, some of the websites have ceased to exist, hence content may not only have expanded but also have been deleted. Consequently, we used the web archive Wayback Machine to re-create a dataset that most closely resembles the content available to authors of the prior work [91]. Specifically, we (i) only scraped articles discussing electric vehicles or alternative energy, as this filter was noted by the authors of the prior work; and (ii) we used the Wayback Machine to scrape data that would have been available as of March 2016.
Since the prior work used the PESTEL framework for its guiding questions, we also started by creating a set of questions about electric vehicles for each aspect of PESTEL. For example, under the environmental category, we asked, “What are benefits to the environment” and its complementary “What hurts the environment?” The full list of seed questions for our Q&A system is provided in Table 3. Parameter values for SAAM are listed in Figure 4.

4.3. Comparison: Model Content and Simulated Scenarios

Models can be compared on the basis of their structure (e.g., which variables do they include? How are they connected?) and outputs (e.g., given the same input, which results do they produce?).
To compare the structure of the models, we examined the terms that they contained. To guide the comparison, we grouped the content of the SAAM model using the same categories as in the prior work. We stress that our objective is not to find models with the same structure. Rather, the structural comparison can tell us whether the models include similar categories, or aspects where one model was more comprehensive than the other. In contrast, we do expect more similarities when comparing the output of the models. For each scenario, we ran the SAAM model by creating inputs corresponding to the ones used in the original study, and then we compared the outputs of the two models. The original study had four high-level scenarios: (1) application of EV to tourism, (2) failure to develop battery technology, (3) failure of EV adoption in general, and (4) relaxation of government regulation. Changes were necessary in our comparative study, for two reasons. First, the prior work grouped the terms “economy”, “consumer”, “customer”, “growth”, and “tourism” in the tourism category by assuming that tourism is driven by consumers and is directly related to the economy. To avoid this narrow assumption, we broadened the scenario to study economic factors. Second, scenarios (1) and (3) are actually linked because (1) studies the effects of widespread EV adoption, whereas (3) examines the failure of widespread EV adoption. If we performed two scenarios on the same aspect, then that specific aspect of the model would artificially be counted twice. Consequently, we ran simulations on three scenarios: (i) economic factors affecting EV adoption, whether the economy is good or bad; (ii) what happens if battery technology does not develop; and (iii) what happens if the government decides to not help the EV industry at all by removing any incentives for EV and stopping any regulation efforts to increase adoption.

5. Results

5.1. Structural Comparison: Content of the Models

After filtering, the model produced by SAAM resulted in 52 unique concepts with 110 connections, as compared to the 15 concepts and 44 connections from the original study. The terms identified are shown in Box 1. As described in the previous section, we start our comparison by applying the categories from prior work to group the terms found by SAAM. The comparison is shown in Table 4. SAAM identified some of the same terms that were identified in the original study (green highlights), but also found concepts that were not detected in the prior work. For example, SAAM identified aspects such as consumer confidence, infrastructure investments needed, and natural resources required to build required batteries. This more comprehensive assessment can provide deeper insight into the data and hence support the creation of more robust models. Asking specific questions about social impacts led to answers such as ‘thinking globally and acting locally’, which was not in the LSA method. On the other hand, a few of the topics identified only make sense when knowing the context; for instance, ‘your gas guzzler’ refers to today’s cars that run on gas, while ‘aboriginal training’ came from an Australian article about retraining individuals from underserved communities to work in new jobs created by the electric vehicles industry. Note neither the list of terms identified by SAAM nor those covered in the original study claim to address every facet of electric vehicles; rather, they extract information from a corpus focused on technology development. For example, emerging aspects such as electric mobility education [93] were absent from the corpus; hence, they are also absent in the list of terms.
Box 1. List of terms identified by SAAM.
‘EV’, ‘a completely carbon neutral transportation option’, ‘a comprehensive charge station network’, ‘aboriginal training’, ‘artificial intelligence’, ‘batteries’, ‘biomimicry’, ‘business development’, ‘carbon pricing’, ‘cities conservation’, ‘clean renewable energy sources’, ‘confidence’,  ‘current unit sales’, ‘durability’, ‘economic activity’, ‘economic and safety benefits’, ‘electric motor’, ‘employment’, ‘energy efficiency’, ‘energy pollution’, ‘environmentally conscious citizens’, ‘evs cost’, ‘fear’, ‘gaps’, ‘generic super charging stations’, ‘governments’, ‘greenhouse gas emissions’, ‘harmony’, ‘incentives’, ‘information technology’, ‘infrastructure’, ‘lack of hydrogen infrastructure’, ‘liability’, ‘no exhaust emissions’, ‘oil and gas volatility’, ‘polarisation systems’, ‘potential roadblocks’, ‘power and mileage limits’, ‘public investment’, ‘rare earth metals’, ‘recharge speed’, ‘regulation’, ‘remote communities’, ‘save lives’, ‘scholarships’, ‘self-driving vehicles’, ‘significant technology improvements’, ‘sustainability’, ‘the air’, ‘the falling price of batteries’, ‘the power and mileage limits’, ‘thinking globally and acting locally’, ‘traffic congestion’, ‘transform mobility’, ‘wealth’, ‘your gas guzzler’

5.2. Scenario Comparisons

Numerical results for each scenario are provided in the Table A1. Note that in the deregulation scenario, results are only indicative since the system oscillates instead of reaching stable values.
The original study showed that applying EV to tourism resulted in increased employment, a better economy, lower pollution levels, and improved energy efficiency. However, none of the data had articles about tourism; hence, the SAAM model did not directly cover tourism. After noting that the original study grouped tourism with economic benefits (see Section 4), we broadened the scenario to the economy. Specifically, we set the constructs ‘employment’, ‘business development’, ‘current unit sales’, ‘economic activity’, ‘economic and safety benefits’, and ‘wealth’ to high in one case (good economy) and to low in the other (poor economy). The SAAM model output a different result than the original study, noting that in a good economy ‘no exhaust emissions’ are adopted, but ‘greenhouse gas emissions’ increase and negatively affect ‘the air’. In addition, we got richer results with SAAM, through some of the concepts that were not identified in the prior work; for instance, ‘think globally act locally’ decreases in a good economy, ‘public investment’ increases, and ‘lack of infrastructure’ decreases (meaning that the infrastructure will start to improve). In a good economy, ‘EV adoption’ decreases and ‘your gas guzzler’ (representing existing gas-powered vehicles) increases. In a bad economy, the inverse happens. Although this may seem counterintuitive at first, the transparency of the SAAM model lets us realize that, while several variables (technology, consumer confidence, battery technology) are high, the focus on sustainability decreases and volatility in gas prices decreases, which ultimately hurts the adoption of EVs. In short, this scenario implies that in a good economy, several technological aspects improve (EV infrastructure, battery technology, energy efficiency), but there is no strong drive for consumers to adopt EV technology.
In the scenario where battery technology fails to develop, the original study concluded that there will be less job creation, less tourism, a poor economy, and an increase in pollution. To investigate this scenario, we set the corresponding variables in our model to low: ‘batteries’, ‘lithium-air batteries’, ‘lithium-ion’, ‘lithium-ion batteries’, ‘recharge speed’, ‘power and mileage limits’, and ‘energy efficiency’. SAAM also found that ‘employment’ decreased, and terms associated with the economy (‘economic activity’, ’business development’, ‘current unit sales’, ‘wealth’) all ended on low values. However, as in the previous scenario, SAAM had an inverse relationship between the economy and the environment; hence, it forecasted a decrease in ‘greenhouse gas emissions’ with an accompanying increase in the quality of ‘the air’. In this scenario, EV adoption starts to improve even though the cost of EVs (‘EVs cost’) is driven up. Although battery technology fails to improve, an increased desire for sustainable solutions (‘sustainability’) and growing investment from the government (‘public investment’) help to offset the high cost of EVs.
Finally, in the scenario of relaxing government regulations, the prior work concluded a reduction in costs, an increase in safety, and an increase in energy efficiency. We simulated this scenario by setting all relevant concepts to low (‘regulation’, ‘incentive’, ‘policy’, ‘government’, ‘limitation’, ‘standard’, ‘tax reduction’). Our simulation produced a limit cycle rather than a stable state. This indicates that if the government does nothing, then consumers would oscillate between EV adoption and rejection as the environment shifts from one preference to another based on competing factors. This sensitivity of our model to regulation suggests that it is a key concept in the adoption of EVs; hence, it deserves particular consideration when examining future strategies.

6. Discussion

6.1. Findings and Implications

Examining future scenarios is necessary to support decision-making activities [4,5,6,7]. These scenarios are created by teams and run on quantitative causal models, which forecast potential effects based on the evidence base. Creating a model is thus the cornerstone of scenario generation, yet it has long been a labor-intensive task [8,9]. Several works have brought automation to this process [18,19], in particular by deriving models from an evidence base consisting of a text corpus [25,26,27,28]. The recent work of Feblowitz and colleagues at IBM [29] is the closest to our approach in numerous regards: starting from a set seed of concepts (or ‘risk forces’), it automatically fetches documents (multiple times daily via the Watson Discovery service) and uses a Q&A system powered by Hugging Face’s Transformers to extract a model, noting when concepts can be deemed equivalent. A key limitation in previous works is that several steps continue to be performed by humans, as is the case in [29] where (meta)data on causal relationships is obtained via a crowd-sourced questionnaire, whereas we use the weights from the Fuzzy Cognitive Maps. In this paper, we proposed a step further in automation by only asking the modeling team to provide the initial guiding questions and the evidence base, and then creating a model. We demonstrated that the model could be used to investigate scenarios, by focusing on a case study in electric vehicles (EVs). EVs were chosen as a guiding example since (i) they have been the subject of several studies involving carefully crafted scenarios [31,94], and (ii) a previous study [87] with partial automation offered a direct comparison point with the model produced by our approach.
There are two key differences between our proposed approach (SAAM) and the prior study, which used less automation and involved Latent Semantic Analysis (LSA). First, LSA is used to find topics in a text collection and group terms together. Our system is not designed to perform such grouping, as we instead focus on finding terms by asking direct questions. The models are thus structured differently, with more granular content in SAAM offering a larger number of factors. However, it is possible that some of the content becomes too granular and needs to be interpreted given the context (e.g., ‘the air’). Second, our proposed method and the previous one both have parameters that should be tuned by users. However, the methods are different; hence, the parameters offer control on different aspects. In SAAM, the modeling team can control filters, for instance, to force a simplification of the model by (i) combining semantically similar concepts and/or (ii) only accepting concepts where the system has high certainty. In contrast, the LSA method requires people to set a topic cluster size and manually name each final topic. Although our machine learning algorithm requires some human intervention to set parameters, we note that involving humans to train algorithms has been shown to facilitate co-learning between people and computers [95], and give analysts a better overall understanding of the model [96]. The potential benefits of a human-in-the-loop approach are noteworthy since our work is based on BERT, which is part of the set of artificial neural networks that have historically been characterized as ‘lacking interpretability’ and hence faced drawbacks in terms of trustworthiness by human decision makers [97].
Scenarios are supposed to help us step back and see the bigger picture, think outside the box, and consider alternatives that might not be obvious. Our results have shown that SAAM was able to generate alternative future scenarios that met this objective. We also demonstrated that the scenarios created via SAAM often agree with those created in the prior study, or propose a plausible line of reasoning when results differ. We emphasize that the application to electric vehicles provided a thorough evaluation of SAAM, but our tool is not limited to this specific application as it constitutes a reusable approach to generate scenarios. SAAM could thus be applied to similar issues in sustainability, such as autonomous vehicles [98], which have already been the subject of scenario generation studies using Fuzzy Cognitive Maps [99]. Our tool can more broadly benefit areas that frequently engage in the development of data-informed scenarios [100,101].

6.2. Limitations and Opportunities for Future Studies

One limitation of our comparison was the inability to use the same data as the original study, since it did not publish it. We re-created a dataset based on the sources and selection criteria mentioned, and ensured that it reflected what was available to the authors at the time. However, we did not detect any application to tourism in the evidence base; hence, this aspect was missing from the model and ultimately the scenario based on tourism was broadened to the economy.
The inspiring work by Feblowitz and colleagues suggests several improvements [29]. In particular, they were able to automatically generate trajectories from their model, using a planner and a clustering algorithm. To the best of our knowledge, planners able to generate a set of high-quality solutions (i.e., top-k planners) have not been applied to Fuzzy Cognitive Maps; hence, such algorithms would have to first be developed before we can produce trajectories.
The ability to transparently examine how the model reached a certain conclusion also holds particular promise for future studies. Indeed, the socio-environmental systems examined in sustainability studies are often complex, and models are at risk of becoming a ‘black box’ by being almost as complex. Maeda and colleagues stressed that “as the increasing complexity of models starts to influence policy making, it is important for scientists to create new approaches to communicate their underlying assumptions, reasoning, data and methods to stakeholders” [102]. Future work can thus contribute further to this communication component, for instance, by leveraging the Q&A system not only to build the model but also to ask how conclusions were reached.

7. Conclusions

Generating scenarios is essential for decision-making activities, but it involves a labor-intensive step of model building. We proposed a system (SAAM) that goes beyond previous automation initiatives, and we demonstrated that the system can result in well-formed scenarios by contrast to a previous study on electric vehicles. As the first manuscript detailing and applying SAAM, there are several opportunities for future work in improving components of the system or applying it for other fields of sustainability that heavily depend on scenario generations.

Author Contributions

C.W.H.D. developed the software and wrote the first draft. P.J.G. edited the manuscript. A.J.J. and P.J.G. supervised C.W.H.D. All authors approved the manuscript. P.J.G. revised the manuscript. All authors have read and agreed to the published version of the manuscript.

Funding

This research did not receive any specific grant from funding agencies in the public, commercial, or not-for-profit sectors.

Institutional Review Board Statement

Not applicable.

Data Availability Statement

The code is available on our repository [30].

Acknowledgments

We thank Charles Weber and Ameeta Agrawal at Portland State University for their helpful feedback.

Conflicts of Interest

The authors declare no conflict of interest.

Appendix A

Table A1. Each scenario is designed by setting the values of relevant factors in the model. For each scenario, we note the effect on other variables, as well as on the key construct of adopting electric vehicles (bottom row).
CategoriesConceptsBad EconomyGood EconomyBattery FailDeregulation
air pollutiongreenhouse gas emissions−0.9523983230.952398323−0.957583063−0.959324401
air pollutionno exhaust emissions−0.9523983230.952398323−0.957583063−0.959324401
air pollutionthe air0.957140415−0.9571404150.9379570760.957801403
air pollutionyour gas guzzler−0.9523983230.952398323−0.957583063−0.959324401
alternative energy technologyclean renewable energy sources0.156727117−0.15672711700.121182442
alternative energy technologypolarisation systems−0.9523983230.952398323−0.957583063−0.959324401
battery technologybatteries−0.6916997320.691699732−1−0.646327877
battery technologypower and mileage limits0.156727117−0.156727117−10.121182442
battery technologyrecharge speed0.156727117−0.156727117−10.121182442
otherthinking globally and acting locally0.156727117−0.15672711700.121182442
charging technologya comprehensive charge station network−0.9523983230.952398323−0.957583063−0.959324401
charging technologygeneric super charging stations−0.6916997320.6916997320−0.646327877
costs reductionevs cost0.957140415−0.9571404150.9611797510.957801403
costs reductionthe falling price of batteries0.957500995−0.957500995−0.9296063560.932011183
economic activityeconomic activity−11−0.9853129750.990740486
economic revenebusiness development−11−0.957583063−0.959324401
economic revenecurrent unit sales−11−0.957583063−0.959324401
economic revenewealth−1100.121182442
energy effeciencyenergy efficiency−0.9523983230.952398323−1−0.959324401
energy pollutionenergy pollution0.388947408−0.3889474080.796604556−0.510951584
government regulationcarbon pricing0.156727117−0.15672711700.121182442
government regulationcities conservation0.873254834−0.873254834−0.774093871−1
government regulationgovernments0.156727117−0.1567271170−1
government regulationincentives−0.6916997320.6916997320−1
government regulationpublic investment−0.9026260960.9026260960.686233755−1
government regulationregulation−0.6916997320.6916997320−1
industry-university collaborationscholarships−0.9523983230.952398323−0.957583063−0.959324401
job creationemployment−11−0.901712810.940099166
motor technologyelectric motor0.972982612−0.9729826120.9999091880.976648732
othera completely carbon neutral transportation option−0.9523983230.952398323−0.957583063−0.959324401
industry-university collaborationaboriginal training−0.9523983230.952398323−0.957583063−0.959324401
usabilityartificial intelligence0.156727117−0.15672711700.121182442
otherbiomimicry0.156727117−0.15672711700.121182442
otherconfidence−0.9523983230.952398323−0.957583063−0.959324401
otherdurability0.156727117−0.15672711700.121182442
otherenvironmentally conscious citizens0.156727117−0.15672711700.121182442
usabilityinformation technology0.156727117−0.15672711700.121182442
otherinfrastructure0.96315824−0.96315824−0.7740938710.995526376
otherlack of hydrogen infrastructure0.924293982−0.92429398200.915954432
otherliability0.156727117−0.15672711700.121182442
otheroil and gas volatility0.156727117−0.15672711700.121182442
otherpotential roadblocks0.957140415−0.9571404150.9379570760.957801403
otherrare earth metals0.156727117−0.15672711700.121182442
otherremote communities0.156727117−0.15672711700.121182442
othersignificant technology improvements−0.9574793740.957479374−0.060843278−0.957345752
othersustainability0.255551223−0.2555512230.8179099460.497931899
otherthe power and mileage limits0.924293982−0.9242939820.9611797510.915954432
othertraffic congestion0.156727117−0.15672711700.121182442
othertransform mobility−0.9523983230.952398323−0.957583063−0.959324401
public transportationSelf-driving vehicles−0.742996870.742996870.542424672−0.816448312
safetyeconomic and safety benefits−11−0.957583063−0.959324401
EV adoption0.901968281−0.9019682810.7984537980.889187005

References

  1. Firmansyah, H.S.; Supangkat, S.H.; Arman, A.A.; Giabbanelli, P.J. Identifying the components and interrelationships of smart cities in Indonesia: Supporting policymaking via fuzzy cognitive systems. IEEE Access 2019, 7, 46136–46151. [Google Scholar] [CrossRef]
  2. Bowman, G.; MacKay, R.B.; Masrani, S.; McKiernan, P. Storytelling and the scenario process: Understanding success and failure. Technol. Forecast. Soc. Chang. 2013, 80, 735–748. [Google Scholar] [CrossRef]
  3. Van Notten, P. Scenario Development: A Typology of Approaches. In Think Scenarios, Rethink Education; OECD: Paris, France, 2006. [Google Scholar]
  4. Derbyshire, J.; Giovannetti, E. Understanding the failure to understand New Product Development failures: Mitigating the uncertainty associated with innovating new products by combining scenario planning and forecasting. Technol. Forecast. Soc. Chang. 2017, 125, 334–344. [Google Scholar] [CrossRef]
  5. Collier, Z.A.; Hendrickson, D.; Polmateer, T.L.; Lambert, J.H. Scenario analysis and PERT/CPM applied to strategic investment at an automated container port. ASCE-ASME J. Risk Uncertain. Eng. Syst. Part A Civ. Eng. 2018, 4, 04018026. [Google Scholar] [CrossRef]
  6. Relich, M.; Bocewicz, G.; Rostek, K.; Banaszak, Z.A. A declarative approach to new product development project prototyping. IEEE Intell. Syst. 2020, 36, 88–95. [Google Scholar] [CrossRef]
  7. Açikgöz, A.; Latham, G.P.; Acikgoz, F. Mediation of scenario planning on the reflection-performance relationship in new product development teams. J. Bus. Ind. Mark. 2020, 36, 256–268. [Google Scholar] [CrossRef]
  8. Tiberius, V.; Siglow, C.; Sendra-García, J. Scenarios in business and management: The current stock and research opportunities. J. Bus. Res. 2020, 121, 235–242. [Google Scholar] [CrossRef]
  9. Lindgren, M.; Bandhold, H. (Eds.) Scenario Planning in Practice. In Scenario Planning: The Link between Future and Strategy; Palgrave Macmillan: London, UK, 2009; pp. 49–117. [Google Scholar]
  10. Spaniol, M.J.; Rowland, N.J. Defining scenario. Futures Foresight Sci. 2019, 1, e3. [Google Scholar] [CrossRef]
  11. Alcamo, J.; Henrichs, T. Chapter two towards guidelines for environmental scenario analysis. Dev. Integr. Environ. Assess. 2008, 2, 13–35. [Google Scholar] [CrossRef]
  12. Durance, P.; Godet, M. Scenario building: Uses and abuses. Technol. Forecast. Soc. Chang. 2010, 77, 1488–1492. [Google Scholar] [CrossRef] [Green Version]
  13. Godet, M.; Roubelat, F.; Editors, G. Scenario Planning: An Open Future. Technol. Forecast. Soc. Chang. 2000, 65, 1–123. [Google Scholar] [CrossRef]
  14. Van der Heijden, K. Scenarios: The Art of Strategic Conversation; John Wiley & Sons: Hoboken, NJ, USA, 2005. [Google Scholar]
  15. Bradfield, R.; Derbyshire, J.; Wright, G. The critical role of history in scenario thinking: Augmenting causal analysis within the intuitive logics scenario development methodology. Futures 2016, 77, 56–66. [Google Scholar] [CrossRef] [Green Version]
  16. Giabbanelli, P.J.; Galgoczy, M.C.; Nguyen, D.M.; Foy, R.; Rice, K.L.; Nataraj, N.; Brown, M.M.; Harper, C.R. Mapping the complexity of suicide by combining participatory modeling and network science. In Proceedings of the 2021 IEEE/ACM International Conference on Advances in Social Networks Analysis and Mining, Online, 8–11 November 2021; pp. 339–342. [Google Scholar]
  17. Hedelin, B.; Gray, S.; Woehlke, S.; BenDor, T.; Singer, A.; Jordan, R.; Zellner, M.; Giabbanelli, P.; Glynn, P.; Jenni, K.; et al. What’s left before participatory modeling can fully support real-world environmental planning processes: A case study review. Environ. Model. Softw. 2021, 143, 105073. [Google Scholar] [CrossRef]
  18. Keller, J.; Markmann, C.; von der Gracht, H.A. Foresight support systems to facilitate regional innovations: A conceptualization case for a German logistics cluster. Technol. Forecast. Soc. Chang. 2015, 97, 15–28. [Google Scholar] [CrossRef]
  19. Von der Gracht, H.A.; Bañuls, V.A.; Turoff, M.; Skulimowski, A.M.; Gordon, T.J. Foresight support systems: The future role of ICT for foresight. Technol. Forecast. Soc. Chang. 2015, 97, 1–6. [Google Scholar] [CrossRef]
  20. Kayser, V.; Blind, K. Extending the knowledge base of foresight: The contribution of text mining. Technol. Forecast. Soc. Chang. 2017, 116, 208–215. [Google Scholar] [CrossRef] [Green Version]
  21. Berg, S.; Wustmans, M.; Bröring, S. Identifying first signals of emerging dominance in a technological innovation system: A novel approach based on patents. Technol. Forecast. Soc. Chang. 2019, 146, 706–722. [Google Scholar] [CrossRef]
  22. Jeong, Y.; Park, I.; Yoon, B. Identifying emerging Research and Business Development (R&BD) areas based on topic modeling and visualization with intellectual property right data. Technol. Forecast. Soc. Chang. 2019, 146, 655–672. [Google Scholar] [CrossRef]
  23. Kose, T.; Sakata, I. Identifying technology convergence in the field of robotics research. Technol. Forecast. Soc. Chang. 2019, 146, 751–766. [Google Scholar] [CrossRef]
  24. Robinson, D.K.; Lagnau, A.; Boon, W.P. Innovation pathways in additive manufacturing: Methods for tracing emerging and branching paths from rapid prototyping to alternative applications. Technol. Forecast. Soc. Chang. 2019, 146, 733–750. [Google Scholar] [CrossRef] [Green Version]
  25. Ulman, M.; Šimek, P.; Masner, J.; Kogut, P.; Löytty, T.; Crehan, P.; Charvát, K.; Oliva, A.; Bergheim, S.R.; Kalaš, M.; et al. Towards Future Oriented Collaborative Policy Development for Rural Areas and People. AGRIS-Line Pap. Econ. Inform. 2020, 12, 111–124. [Google Scholar] [CrossRef] [Green Version]
  26. Son, C.; Kim, J.; Kim, Y. Developing scenario-based technology roadmap in the big data era: An utilisation of fuzzy cognitive map and text mining techniques. Technol. Anal. Strat. Manag. 2020, 32, 272–291. [Google Scholar] [CrossRef]
  27. Kayser, V.; Shala, E. Scenario development using web mining for outlining technology futures. Technol. Forecast. Soc. Chang. 2020, 156, 120086. [Google Scholar] [CrossRef]
  28. Gokhberg, L.; Kuzminov, I.; Khabirova, E.; Thurner, T. Advanced text-mining for trend analysis of Russia’s Extractive Industries. Futures 2020, 115, 102476. [Google Scholar] [CrossRef]
  29. Feblowitz, M.; Hassanzadeh, O.; Katz, M.; Sohrabi, S.; Srinivas, K.; Udrea, O. IBM Scenario Planning Advisor: A Neuro-Symbolic ERM Solution. Proc. AAAI Conf. Artif. Intell. 2021, 35, 16032–16034. Available online: https://ojs.aaai.org/index.php/AAAI/article/view/18003 (accessed on 6 February 2022).
  30. Davis, C.D.W. Scenario Acceleration through Automated Modelling (SAAM). Available online: https://github.com/cwhd/fuzzy-cognitive-horizon-scanning (accessed on 6 February 2022).
  31. Blumberg, G.; Broll, R.; Weber, C. The impact of electric vehicles on the future European electricity system—A scenario analysis. Energy Policy 2022, 161, 112751. [Google Scholar] [CrossRef]
  32. Kafaei, M.; Sedighizadeh, D.; Sedighizadeh, M.; Fini, A.S. An IGDT/Scenario based stochastic model for an energy hub considering hydrogen energy and electric vehicles: A case study of Qeshm Island, Iran. Int. J. Electr. Power Energy Syst. 2022, 135, 107477. [Google Scholar] [CrossRef]
  33. Yu, Z.; Lu, F.; Zou, Y.; Yang, X. Quantifying energy flexibility of commuter plug-in electric vehicles within a residence–office coupling virtual microgrid. Part II: Case study setup for scenario and sensitivity analysis. Energy Build. 2022, 254, 111552. [Google Scholar] [CrossRef]
  34. Singh, V.; Singh, V.; Vaibhav, S. A review and simple meta-analysis of factors influencing adoption of electric vehicles. Transp. Res. Part D Transp. Environ. 2020, 86, 102436. [Google Scholar] [CrossRef]
  35. Song, R.; Potoglou, D. Are Existing Battery Electric Vehicles Adoption Studies Able to Inform Policy? A Review for Policymakers. Sustainability 2020, 12, 6494. [Google Scholar] [CrossRef]
  36. Asif, U.; Schmidt, K. Fuel Cell Electric Vehicles (FCEV): Policy Advances to Enhance Commercial Success. Sustainability 2021, 13, 5149. [Google Scholar] [CrossRef]
  37. Capuder, T.; Sprčić, D.M.; Zoričić, D.; Pandžić, H. Review of challenges and assessment of electric vehicles integration policy goals: Integrated risk analysis approach. Int. J. Electr. Power Energy Syst. 2020, 119, 105894. [Google Scholar] [CrossRef]
  38. Whiston, M.M.; Azevedo, I.M.L.; Litster, S.; Samaras, C.; Whitefoot, K.S.; Whitacre, J.F. Expert elicitation on paths to advance fuel cell electric vehicles. Energy Policy 2022, 160, 112671. [Google Scholar] [CrossRef]
  39. Baumgarte, F.; Kaiser, M.; Keller, R. Policy support measures for widespread expansion of fast charging infrastructure for electric vehicles. Energy Policy 2021, 156, 112372. [Google Scholar] [CrossRef]
  40. Van Mierlo, J.; Berecibar, M.; El Baghdadi, M.; De Cauwer, C.; Messagie, M.; Coosemans, T.; Jacobs, V.A.; Hegazy, O. Beyond the State of the Art of Electric Vehicles: A Fact-Based Paper of the Current and Prospective Electric Vehicle Technologies. World Electr. Veh. J. 2021, 12, 20. [Google Scholar] [CrossRef]
  41. Bhatti, G.; Mohan, H.; Singh, R.R. Towards the future of smart electric vehicles: Digital twin technology. Renew. Sustain. Energy Rev. 2021, 141, 110801. [Google Scholar] [CrossRef]
  42. De Pinho, H. Generation of Systems Maps: Mapping Complex Systems and Population Health. In Systems Science and Population Health; Oxford University Press: Oxford, UK, 2017; pp. 61–67. [Google Scholar]
  43. Giabbanelli, P.J.; Rice, K.L.; Galgoczy, M.C.; Nataraj, N.; Brown, M.M.; Harper, C.R.; Nguyen, M.D.; Foy, R. Pathways to suicide or collections of vicious cycles? Understanding the complexity of suicide through causal mapping. Soc. Netw. Anal. Min. 2022, 12, 60. [Google Scholar] [CrossRef]
  44. McGlashan, J.; Johnstone, M.; Creighton, D.; De La Haye, K.; Allender, S. Quantifying a Systems Map: Network Analysis of a Childhood Obesity Causal Loop Diagram. PLoS ONE 2016, 11, e0165459. [Google Scholar] [CrossRef] [Green Version]
  45. Giabbanelli, P.J.; Tawfik, A.A.; Gupta, V.K. Learning Analytics to Support Teachers’ Assessment of Problem Solving: A Novel Application for Machine Learning and Graph Algorithms. In Utilizing Learning Analytics to Support Study Success; Springer: Cham, Switzerland, 2019; pp. 175–199. [Google Scholar] [CrossRef]
  46. Anjum, M.; Voinov, A.; Taghikhah, F.; Pileggi, S.F. Discussoo: Towards an intelligent tool for multi-scale participatory modeling. Environ. Model. Softw. 2021, 140, 105044. [Google Scholar] [CrossRef]
  47. Voinov, A.; Jenni, K.; Gray, S.; Kolagani, N.; Glynn, P.D.; Bommel, P.; Prell, C.; Zellner, M.; Paolisso, M.; Jordan, R.; et al. Tools and methods in participatory modeling: Selecting the right tool for the job. Environ. Model. Softw. 2018, 109, 232–255. [Google Scholar] [CrossRef] [Green Version]
  48. Lofgren, E. System Dynamics Models. In Systems Science and Population Health; Oxford University Press: Oxford, UK, 2017; pp. 77–86. [Google Scholar]
  49. Mkhitaryan, S.; Giabbanelli, P.J.; de Vries, N.K.; Crutzen, R. Dealing with complexity: How to use a hybrid approach to incorporate complexity in health behavior interventions. Intell. Med. 2020, 3, 100008. [Google Scholar] [CrossRef]
  50. Kininmonth, S.; Gray, S.; Kok, K. Expert modelling. In The Routledge Handbook of Research Methods for Social-Ecological Systems; Taylor & Francis: Oxfordshire, UK, 2021; p. 231. [Google Scholar]
  51. Amer, M.; Daim, T.U.; Jetter, A. Technology roadmap through fuzzy cognitive map-based scenarios: The case of wind energy sector of a developing country. Technol. Anal. Strat. Manag. 2016, 28, 131–155. [Google Scholar] [CrossRef]
  52. Zare, S.G.; Alipour, M.; Hafezi, M.; Stewart, R.A.; Rahman, A. Examining wind energy deployment pathways in complex macro-economic and political settings using a fuzzy cognitive map-based method. Energy 2022, 238, 121673. [Google Scholar] [CrossRef]
  53. Nasirzadeh, F.; Ghayoumian, M.; Khanzadi, M.; Cherati, M.R. Modelling the social dimension of sustainable development using fuzzy cognitive maps. Int. J. Constr. Manag. 2020, 20, 223–236. [Google Scholar] [CrossRef]
  54. Averbuch, B.; Thorsøe, M.H.; Kjeldsen, C. Using fuzzy cognitive mapping and social capital to explain differences in sustainability perceptions between farmers in the northeast US and Denmark. Agric. Hum. Values 2022, 39, 435–453. [Google Scholar] [CrossRef]
  55. Papageorgiou, K.; Singh, P.K.; Papageorgiou, E.; Chudasama, H.; Bochtis, D.; Stamoulis, G. Fuzzy Cognitive Map-Based Sustainable Socio-Economic Development Planning for Rural Communities. Sustainability 2019, 12, 305. [Google Scholar] [CrossRef] [Green Version]
  56. Aminpour, P.; Gray, S.A.; Beck, M.W.; Furman, K.L.; Tsakiri, I.; Gittman, R.K.; Grabowski, J.H.; Helgeson, J.; Josephs, L.; Ruth, M.; et al. Urbanized knowledge syndrome—erosion of diversity and systems thinking in urbanites’ mental models. npj Urban Sustain. 2022, 2, 11. [Google Scholar] [CrossRef]
  57. Morone, P.; Yilan, G.; Imbert, E. Using fuzzy cognitive maps to identify better policy strategies to valorize organic waste flows: An Italian case study. J. Clean. Prod. 2021, 319, 128722. [Google Scholar] [CrossRef]
  58. Mkhitaryan, S.; Giabbanelli, P.J. How modeling methods for fuzzy cognitive mapping can benefit from psychology research. In Proceedings of the 2021 Winter Simulation Conference (WSC), Phoenix, AZ, USA, 12–15 December 2021; pp. 1–2. [Google Scholar]
  59. Papageorgiou, E.I.; Salmeron, J.L. A Review of Fuzzy Cognitive Maps Research During the Last Decade. IEEE Trans. Fuzzy Syst. 2012, 21, 66–79. [Google Scholar] [CrossRef]
  60. Felix, G.; Nápoles, G.; Falcon, R.; Froelich, W.; Vanhoof, K.; Bello, R. A review on methods and software for fuzzy cognitive maps. Artif. Intell. Rev. 2019, 52, 1707–1737. [Google Scholar] [CrossRef]
  61. Kwon, H.; Park, Y. Proactive development of emerging technology in a socially responsible manner: Data-driven problem solving process using latent semantic analysis. J. Eng. Technol. Manag. 2018, 50, 45–60. [Google Scholar] [CrossRef]
  62. Sandhu, M.; Giabbanelli, P.J.; Mago, V.K. From Social Media to Expert Reports: The Impact of Source Selection on Automatically Validating Complex Conceptual Models of Obesity. In Society Computing and Social Media; Meiselwitz, G., Ed.; Springer: Cham, Switzerland, 2019; Volume 11578. [Google Scholar]
  63. Villalon, J.; Calvo, R.A. Concept maps as cognitive visualizations of writing assignments. J. Educ. Technol. Soc. 2011, 14, 16–27. Available online: https://www.jstor.org/stable/jeductechsoci.14.3.16?seq=1 (accessed on 6 February 2022).
  64. Hajek, P.; Prochazka, O.; Pachura, P. Fuzzy cognitive maps based on text analysis for supporting strategic planning. In Proceedings of the 2017 International Conference on Research and Innovation in Information Systems (ICRIIS), Langkawi, Malaysia, 16–17 July 2017; pp. 1–6. [Google Scholar]
  65. Pillutla, V.S.; Giabbanelli, P.J. Iterative generation of insight from text collections through mutually reinforcing visualizations and fuzzy cognitive maps. Appl. Soft Comput. 2019, 76, 459–472. [Google Scholar] [CrossRef]
  66. Lavin, E.A.; Giabbanelli, P.J.; Stefanik, A.T.; Gray, S.A.; Arlinghaus, R. Should we simulate mental models to assess whether they agree? In Proceedings of the Annual Simulation Symposium, San Diego, CA, USA, 15–18 April 2018; pp. 1–12. [Google Scholar]
  67. Kok, K. The potential of Fuzzy Cognitive Maps for semi-quantitative scenario development, with an example from Brazil. Glob. Environ. Chang. 2009, 19, 122–133. [Google Scholar] [CrossRef]
  68. Jetter, A.; Schweinfort, W. Building scenarios with Fuzzy Cognitive Maps: An exploratory study of solar energy. Futures 2011, 43, 52–66. [Google Scholar] [CrossRef]
  69. Van Vliet, M.; Kok, K.; Veldkamp, T. Linking stakeholders and modellers in scenario studies: The use of Fuzzy Cognitive Maps as a communication and learning tool. Futures 2010, 42, 1–14. [Google Scholar] [CrossRef]
  70. Jetter, A.J.; Kok, K. Fuzzy Cognitive Maps for futures studies—A methodological assessment of concepts and methods. Futures 2014, 61, 45–57. [Google Scholar] [CrossRef]
  71. Acheampong, F.A.; Nunoo-Mensah, H.; Chen, W. Transformer models for text-based emotion detection: A review of BERT-based approaches. Artif. Intell. Rev. 2021, 54, 5789–5829. [Google Scholar] [CrossRef]
  72. Dale, R. GPT-3: What’s it good for? Nat. Lang. Eng. 2021, 27, 113–118. [Google Scholar] [CrossRef]
  73. Galgoczy, M.C.; Phatak, A.; Vinson, D.; Mago, V.K.; Giabbanelli, P.J. (Re)shaping online narratives: When bots promote the message of President Trump during his first impeachment. PeerJ Comput. Sci. 2022, 8, e947. [Google Scholar] [CrossRef]
  74. Devlin, J.; Chang, M.W.; Lee, K.; Toutanova, K. Bert: Pre-training of deep bidirectional transformers for language understanding. arXiv 2018, arXiv:1810.04805. [Google Scholar]
  75. Sabharwal, N.; Agrawal, A. BERT Model Applications: Question Answering System. In Hands-on Question Answering Systems with BERT; Apress: Berkeley, CA, USA, 2021. [Google Scholar]
  76. Hugging Face Project. Available online: https://huggingface.co/models (accessed on 6 February 2022).
  77. Sandhu, M.; Vinson, C.D.; Mago, V.K.; Giabbanelli, P.J. From associations to sarcasm: Mining the shift of opinions regarding the Supreme Court on twitter. Online Soc. Netw. Media 2019, 14, 100054. [Google Scholar] [CrossRef]
  78. Xin, D.; Ma, L.; Liu, J.; Macke, S.; Song, S.; Parameswaran, A. Accelerating human-in-the-loop machine learning: Challenges and opportunities. In Proceedings of the Second Workshop on Data Management for End-to-End Machine Learning, Houston, TX, USA, 15 June 2018; pp. 1–4. [Google Scholar]
  79. Wu, X.; Xiao, L.; Sun, Y.; Zhang, J.; Ma, T.; He, L. A survey of human-in-the-loop for machine learning. Future Gener. Comput. Syst. 2022, 135, 364–381. [Google Scholar] [CrossRef]
  80. Treasury, H.M. The Aqua Book: Guidance on Producing Quality Analysis for Government; H. M. Government: London, UK, 2015. [Google Scholar]
  81. Oliver, J.J.; Parrett, E. Managing future uncertainty: Reevaluating the role of scenario planning. Bus. Horiz. 2018, 61, 339–352. [Google Scholar] [CrossRef]
  82. Norouzi, N.; Fani, M.; Ziarani, Z.K. The fall of oil Age: A scenario planning approach over the last peak oil of human history by 2040. J. Pet. Sci. Eng. 2020, 188, 106827. [Google Scholar] [CrossRef]
  83. Reimer, N. SentenceTransformers. Available online: www.sbert.net (accessed on 6 February 2022).
  84. SeatGeek. Fuzzy String Matching in Python. Available online: https://github.com/seatgeek/thefuzz (accessed on 6 February 2022).
  85. Explosion. spaCy: Industrial-Strength Natural Language Processing. Available online: https://spacy.io/ (accessed on 6 February 2022).
  86. Universal Dependencies Contributors. Universal POS Tags. Available online: https://universaldependencies.org/u/pos/ (accessed on 6 February 2022).
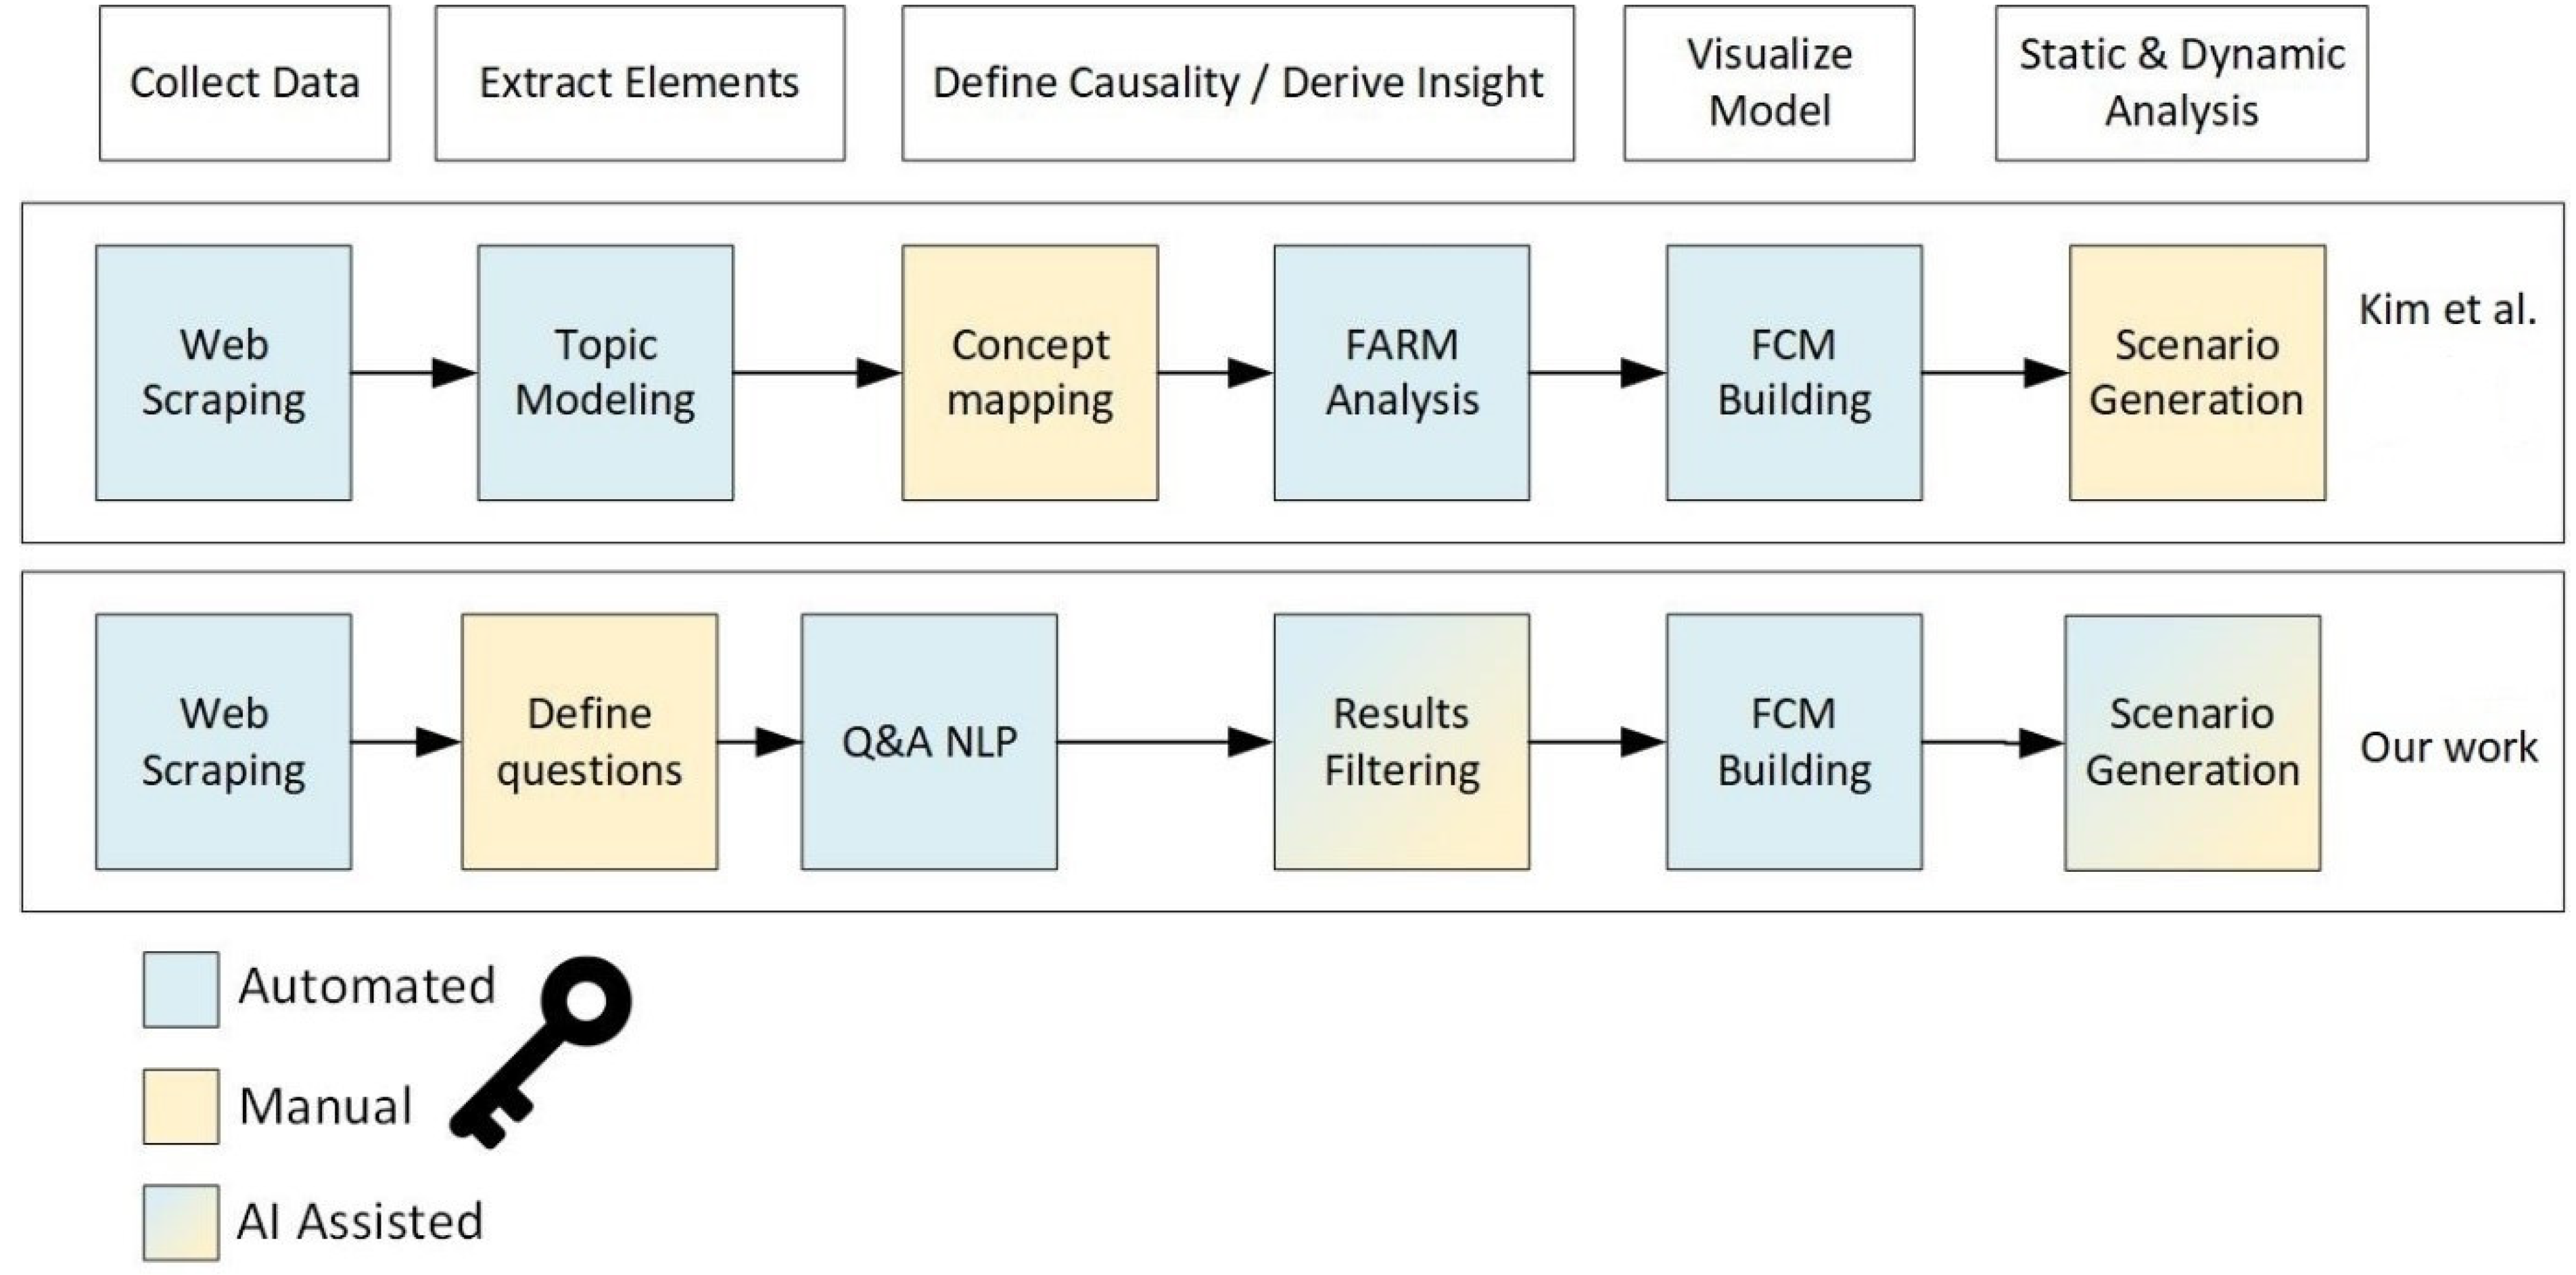
  87. Kim, J.; Han, M.; Lee, Y.; Park, Y. Futuristic data-driven scenario building: Incorporating text mining and fuzzy association rule mining into fuzzy cognitive map. Expert Syst. Appl. 2016, 57, 311–323. [Google Scholar] [CrossRef]
  88. Siemens. Company, Innovation. Available online: https://new.siemens.com/global/en/company/innovation.html (accessed on 6 February 2022).
  89. MIT Technology Review. Available online: https://www.technologyreview.com/all-topics (accessed on 6 February 2022).
  90. Kurzweil. Tracking the Acceleration of Intelligence. Available online: http://www.kurzweilai.net (accessed on 6 February 2022).
  91. World Future Society. Available online: http://web.archive.org/web/*/http://www.wfs.org (accessed on 6 February 2022).
  92. FutureTimeLine. Available online: http://futuretimeline.net/index.htm (accessed on 6 February 2022).
  93. Turoń, K.; Kubik, A.; Chen, F. When, What and How to Teach about Electric Mobility? An Innovative Teaching Concept for All Stages of Education: Lessons from Poland. Energies 2021, 14, 6440. [Google Scholar] [CrossRef]
  94. Seljom, P.; Kvalbein, L.; Hellemo, L.; Kaut, M.; Ortiz, M.M. Stochastic modelling of variable renewables in long-term energy models: Dataset, scenario generation & quality of results. Energy 2021, 236, 121415. [Google Scholar] [CrossRef]
  95. Fiebrink, R.; Cook, P.R.; Trueman, D. Human model evaluation in interactive supervised learning. In Proceedings of the SIGCHI Conference on Human Factors in Computing Systems, Vancouver, BC, Canada; 2011; pp. 147–156. [Google Scholar]
  96. Robert, S.; Büttner, S.; Röcker, C.; Holzinger, A. Reasoning Under Uncertainty: Towards Collaborative Interactive Machine Learning. In Machine Learning for Health Informatics. Lecture Notes in Computer Science; Holzinger, A., Ed.; Springer: Cham, Switzerland, 2016; Volume 9605. [Google Scholar]
  97. Merritt, S.M. Affective Processes in Human—Automation Interactions. Hum. Factors J. Hum. Factors Ergon. Soc. 2011, 53, 356–370. [Google Scholar] [CrossRef]
  98. Czech, P. Autonomous vehicles: Basic issues. Sci. J. Silesian Univ. Technol. Ser. Transp. 2018, 100, 15–22. [Google Scholar] [CrossRef]
  99. Zhang, P.; Jetter, A. A framework for building integrative scenarios of autonomous vehicle technology application and impacts, using fuzzy cognitive maps (FCM). In Proceedings of the 2018 Portland International Conference on Management of Engineering and Technology (PICMET), Honolulu, HI, USA, 19–23 August 2018; pp. 1–14. [Google Scholar]
  100. Chapaloglou, S.; Varagnolo, D.; Marra, F.; Tedeschi, E. Data-informed scenario generation for statistically stable energy storage sizing in isolated power systems. J. Energy Storage 2022, 51, 104311. [Google Scholar] [CrossRef]
  101. Kamari, A.; Kirkegaard, P.H.; Schultz, C.P.L. PARADIS-A process integrating tool for rapid generation and evaluation of holistic renovation scenarios. J. Build. Eng. 2020, 34, 101944. [Google Scholar] [CrossRef]
  102. Maeda, E.E.; Haapasaari, P.; Helle, I.; Lehikoinen, A.; Voinov, A.; Kuikka, S. Black Boxes and the Role of Modeling in Environmental Policy Making. Front. Environ. Sci. 2021, 9, 63. [Google Scholar] [CrossRef]
Figure 1. Overview of our proposed SAAM system.
Sustainability 14 07938 g001
Figure 2. The ‘question depth’ is a key parameter governing model complexity.
Sustainability 14 07938 g002
Figure 3. Comparison between our study (bottom row) and the prior work of Kim and colleagues [87].
Sustainability 14 07938 g003
Figure 4. Key steps and specifications for our comparative study on electric vehicles.
Sustainability 14 07938 g004
Table 1. Sample output from an NLP Q&A system when asked, “What causes pollution to increase?”.
AnswerConfidenceContext
Fast fashion brands0.489on the other hand, fast fashion brands such as h & m, Zara, Topshop, have been blamed for creating poor labor welfare, severe environmental pollution as well as a massive amount of clothing disposal at the end of the product life cycle.
Global climate change0.00713introduction due to the aggravation of environmental pollution and global climate change, sustainable development has attracted more and more attention.
Overconsumption of energy0.00669by doing so, these companies alleviate conflicts of interest among participants and reduce pollution and overconsumption of energy.
Table 2. Parameters and inputs to our proposed SAAM system. Additional libraries were used for the system as a whole: Azure Machine Learning for data hosting and computing, and Machine Learning Pipelines for coordination of tasks.
Parameter/InputValuesPurposeLibraries Involved
Seed questionsStringThe modeling team must define the problem of interest, which anchors the model. N/A
Text collectionResource setNatural language processing is performed over a text corpus. It can be provided directly (e.g., as files or URLs) or retrieved from databases with search keywords.Power Automate Desktop (to automate data collection)
Confidence threshold[0, 1]Filter results based on the confidence returned by the Q&A algorithm. The threshold range will vary based on the context; thus, the cut-off is up to the modeler.Hugging Face Q&A
Semantic similarity threshold[0, 100]
(100 indicates perfect match)
Combine concepts that are semantically similar. This can use Levenshtein or cosine distance. A lower value will group many concepts, a higher value may create a model with different concepts but similar meanings.fuzzywuzzy
POS FilteringArray of POS tags
(universal POS tags [86])
Parts of speech may be returned as answers, but would not make intuitive sense as concepts. In addition, aggregate models often limited to only using nouns as concepts.spaCy
Table 3. Seed questions based on PESTEL for our comparative study on electric vehicles.
QuestionSubjectWeightPESTEL Category
What technology is needed for electric vehicles?EV adoption1Technology
Why use an electrified vehicle?1Open
What are impediments?−1
What are political factors?1Political
What are the benefits to the environment?1Environmental
What hurts the environment?Environment−1
What are social benefits?EV adoption1Social
What are social problems?−1
What social aspects affect electric vehicles?1
What are the economic benefits?Economy1Economic
What are economic problems?−1
What are economic drivers?−1
What are legal problems?EV adoption−1Legal
What are legal drivers?1
What are legal benefits?1
Table 4. Comparison of concepts found by our SAAM system with the prior work’s use of LSA. Categories are taken from the prior work to facilitate the alignment of the two models. Simple matches are shown in green, while noting that additional terms are equivalent within this context.
CategorySAAM ConceptsLSA Concepts
Air pollutiongreenhouse gas emissions, no exhaust emissions, the air, your gas guzzler, energy pollutionTemperature, environment, pollution, atmosphere, carbon dioxide emission, greenhouse gas, CO2, eco
Alternative energy technologyclean renewable energy sources, polarization systemsRenewable energy, diesel, biofuel, biomass, geothermal, petroleum, gasoline, hybrid, photovoltaic, solar energy
Battery technologybatteries, power and mileage limits, recharge speedLithium battery, ion battery, acid battery, storage, battery life, lightweight, BMS, lithium ion battery
Charging technologya comprehensive charge station network, generic supercharging stationsWireless power, charger, recharge, power transmission, charger
Costs reductionEVs cost, the falling price of batteries, incentivesCost reduction, incentive, support, maintenance cost
Economic revenuebusiness development, current unit sales, wealth, economic activityEconomy, growth, sales, investment, revenue, GDP, trade, import, export
Energy efficiencyenergy efficiencyEnergy efficiency, energy consumption, efficiency improvement, energy density, mileage
Government regulationcarbon pricing, cities conservation, governments, incentives, public investment, regulationRegulation, incentive, policy, government, limitation, standard, tax reduction, policy
Industry-university collaborationscholarships, aboriginal trainingCompany, startup, university, laboratory, investment, partnership, entrepreneur, grid
Job creationemploymentJob, worker, manufacturing, services, employment
Motor technologyelectric motorEngine, inverter, magnet, DC, AC, torque, capacity, motor
Usabilityinformation technologyAutomation, sensor, network connection, software, comfort, assistant, internet
Public transportationSelf-driving vehiclesTransportation, electric bus, driver, passenger
Safetyeconomic and safety benefits, self-driving vehiclesSafety, driverless, collision, vibration, pressure, security, stability, obstacle warning, monitoring
Otherthinking globally and acting locally, a completely carbon neutral transportation option, biomimicry, confidence, durability, environmentally conscious citizens
Application to tourism Consumer, customer, tourism, growth, economy
Publisher’s Note: MDPI stays neutral with regard to jurisdictional claims in published maps and institutional affiliations.

