
Efficient Data-Driven Crop Pest Identification Based on Edge Distance-Entropy for Sustainable Agriculture


Abstract
:1. Introduction
2. Materials and Methods
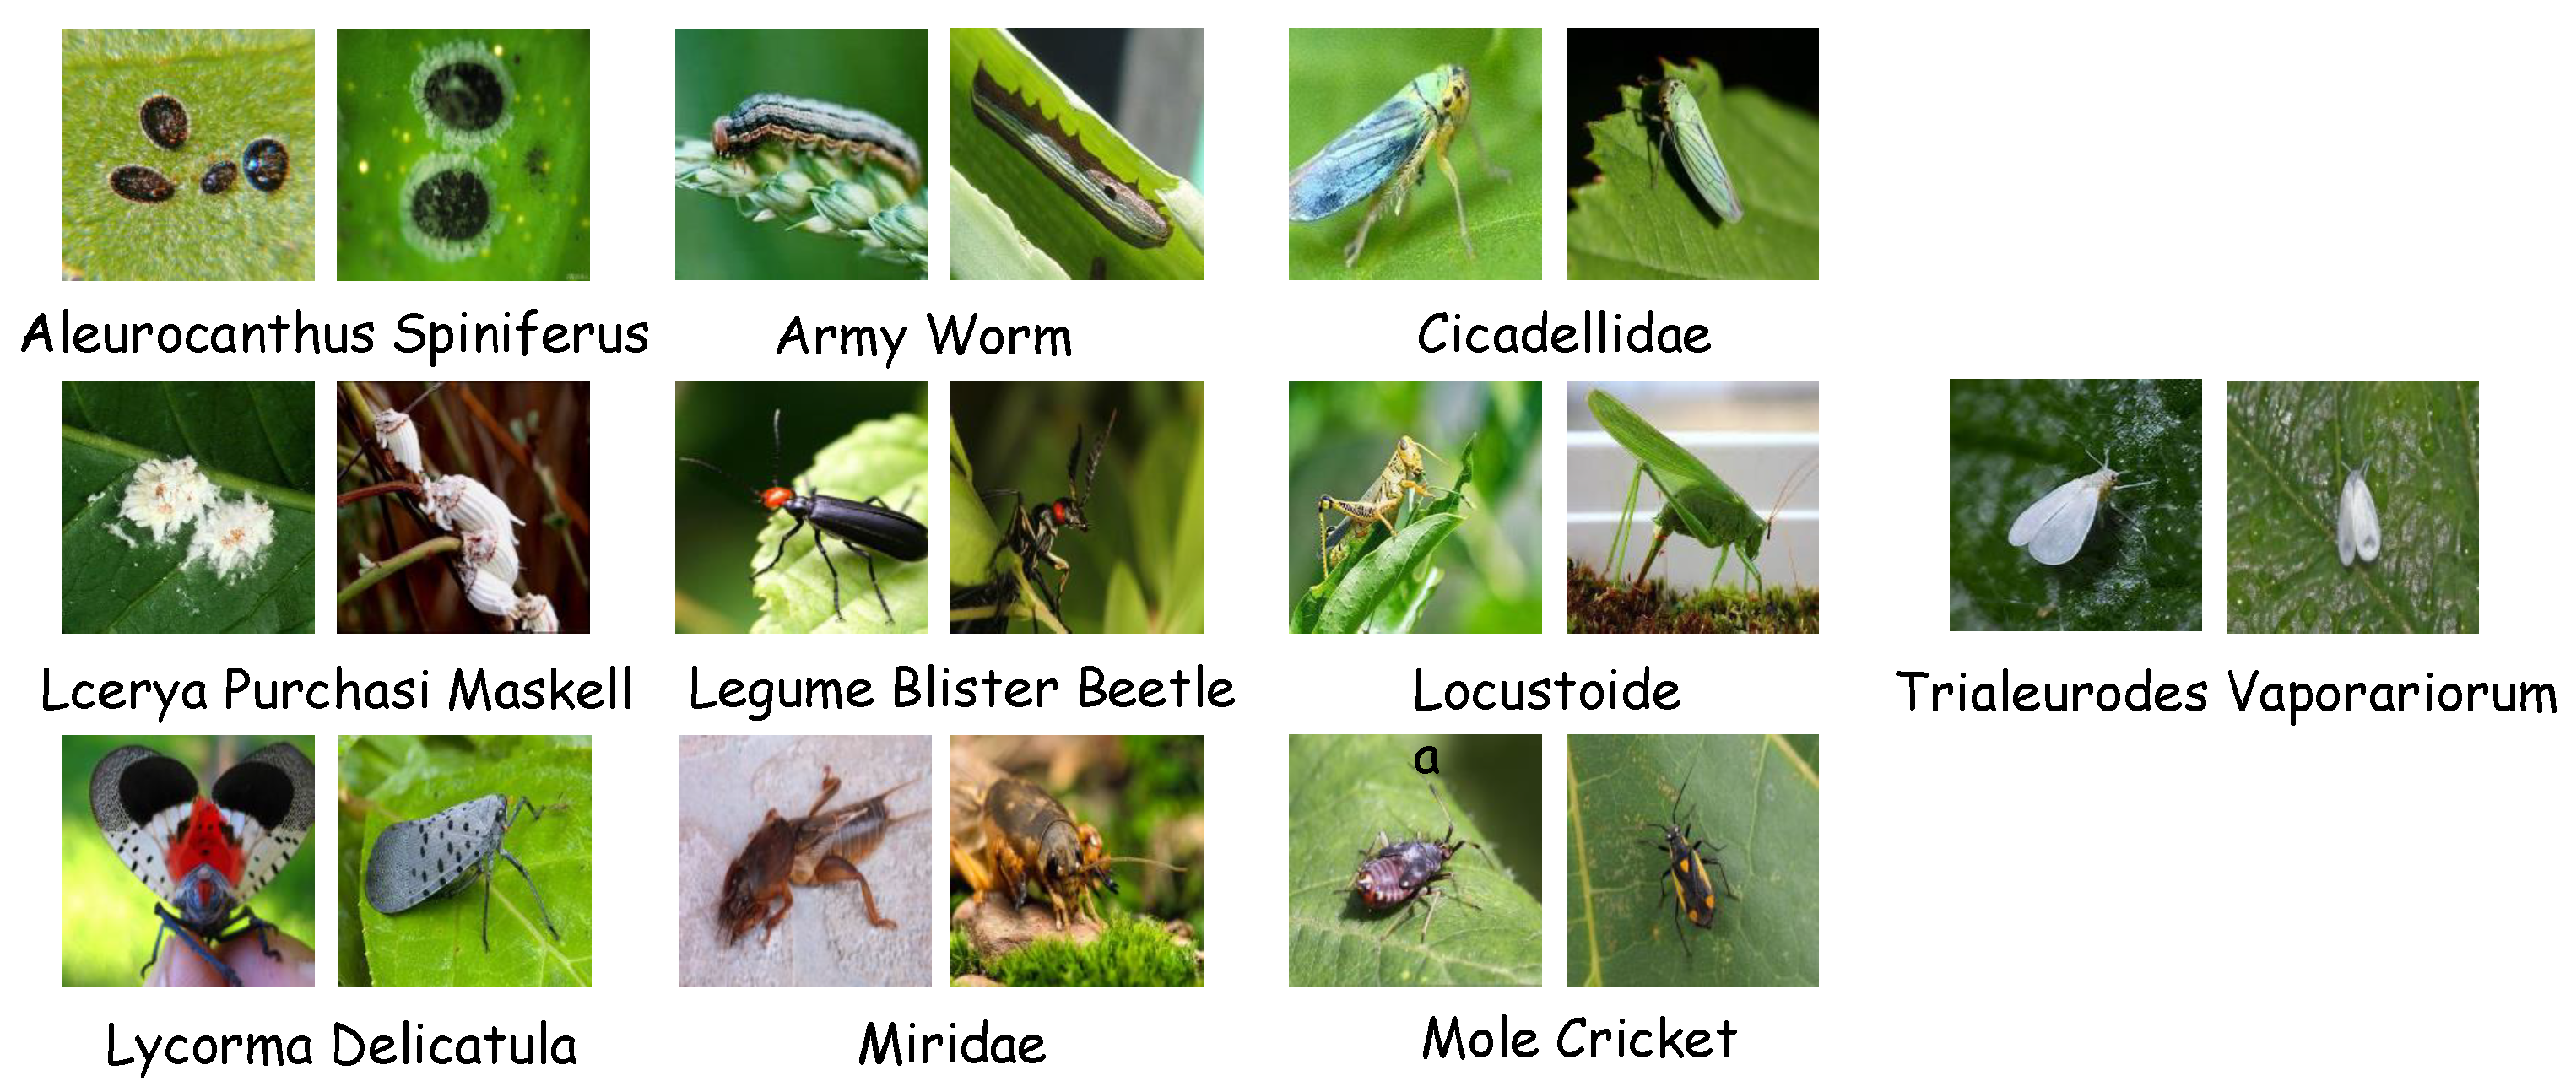
2.1. Materials
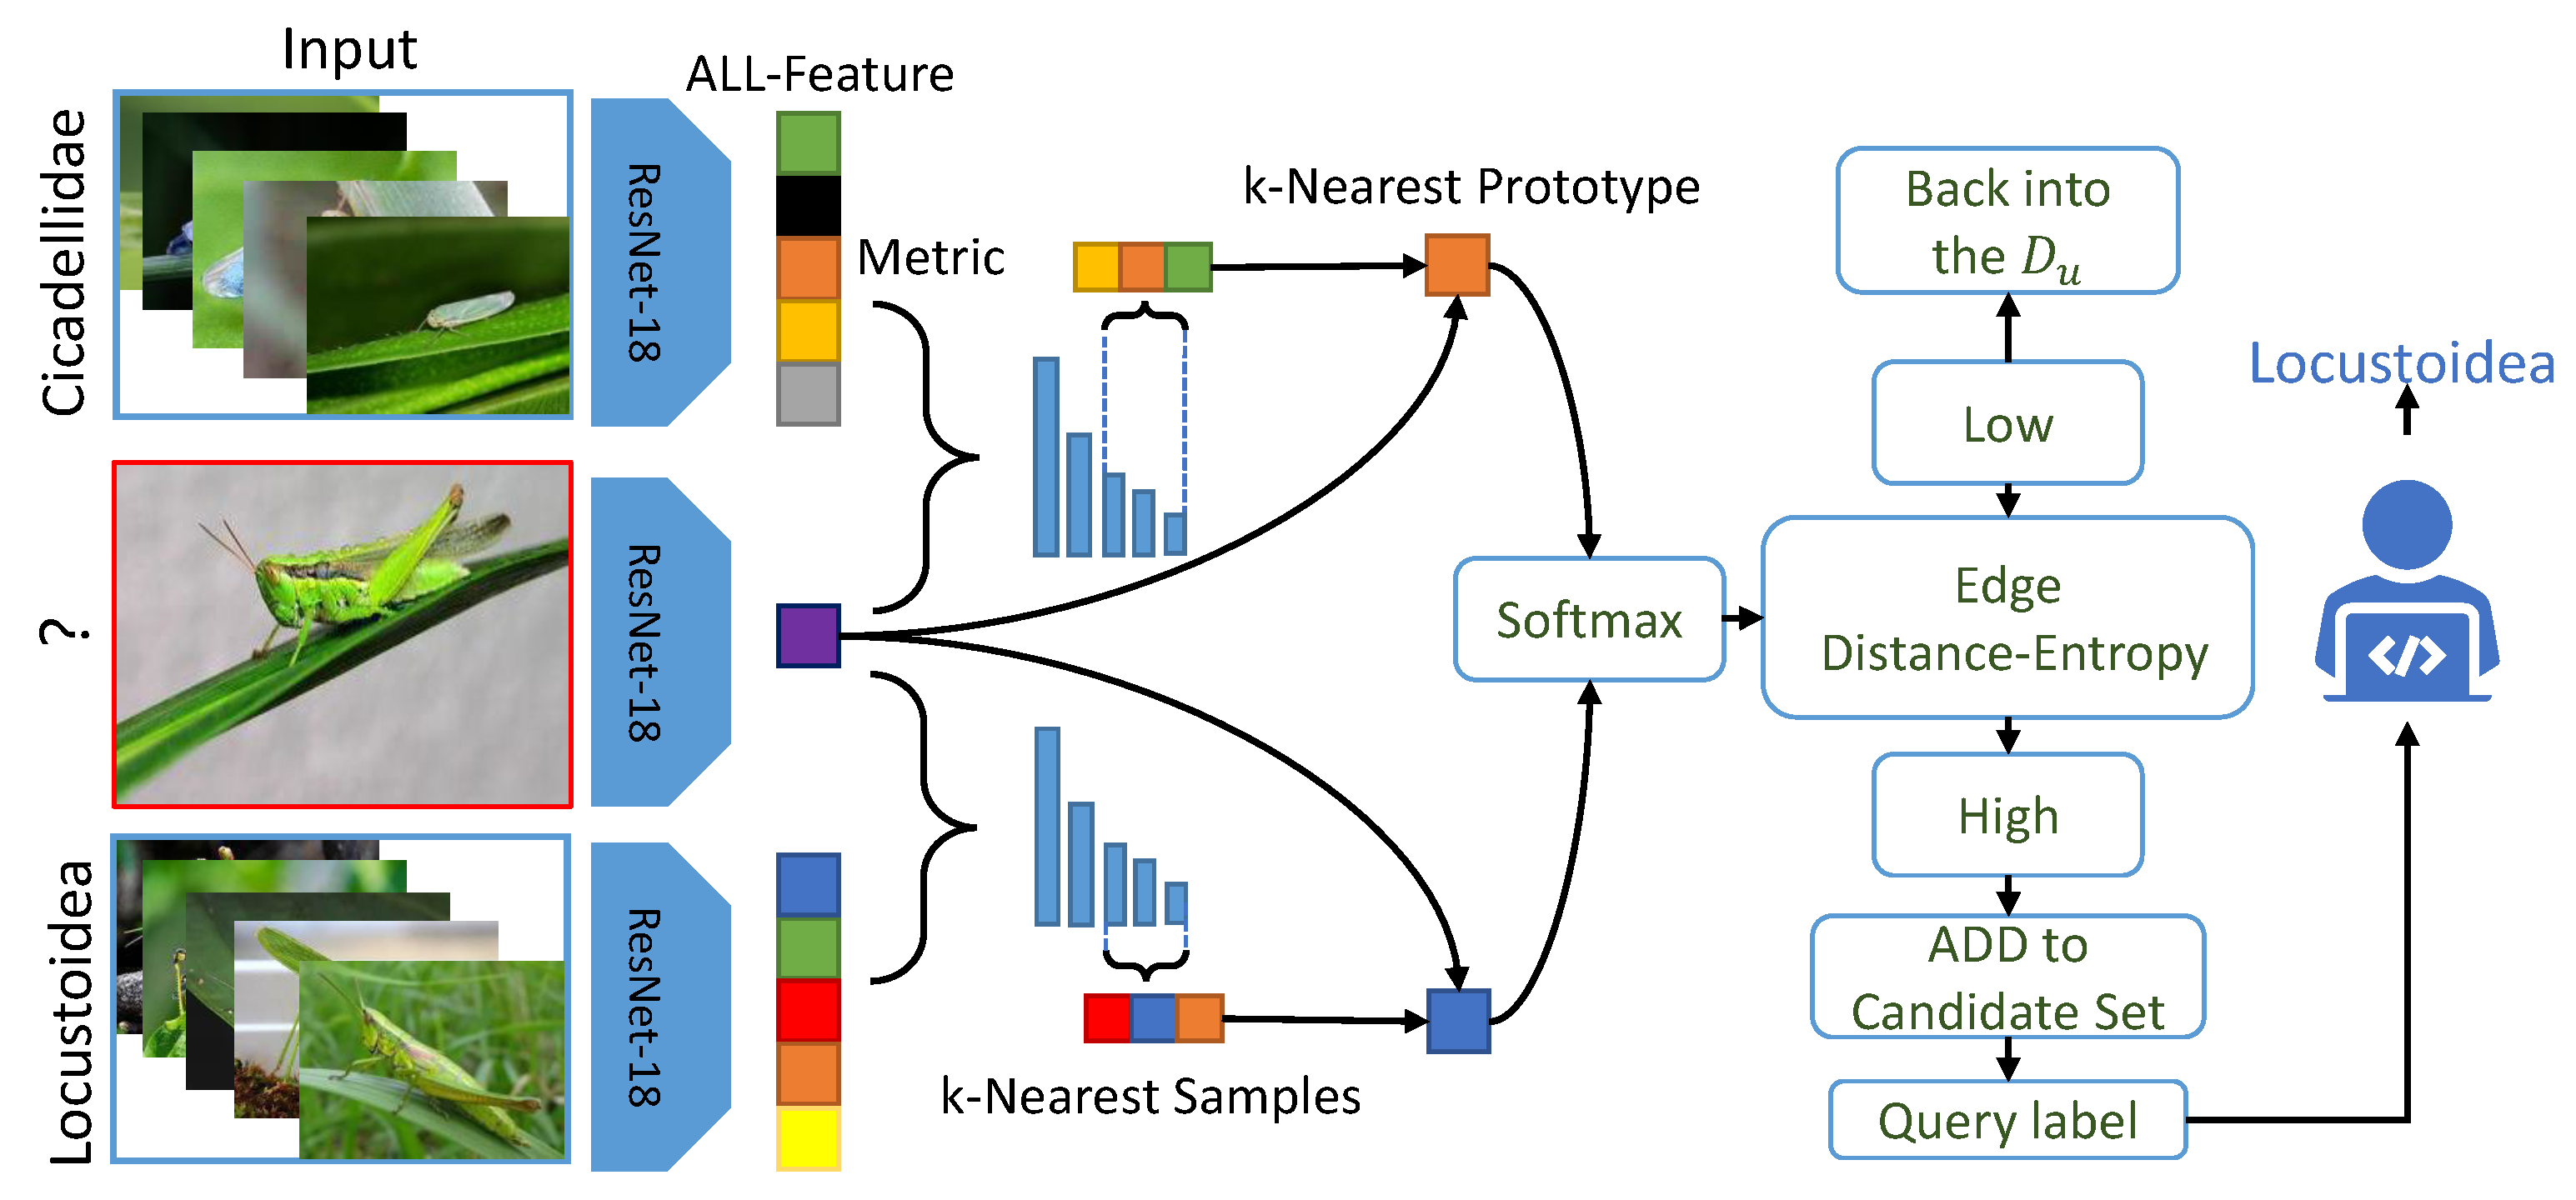
2.2. Framework
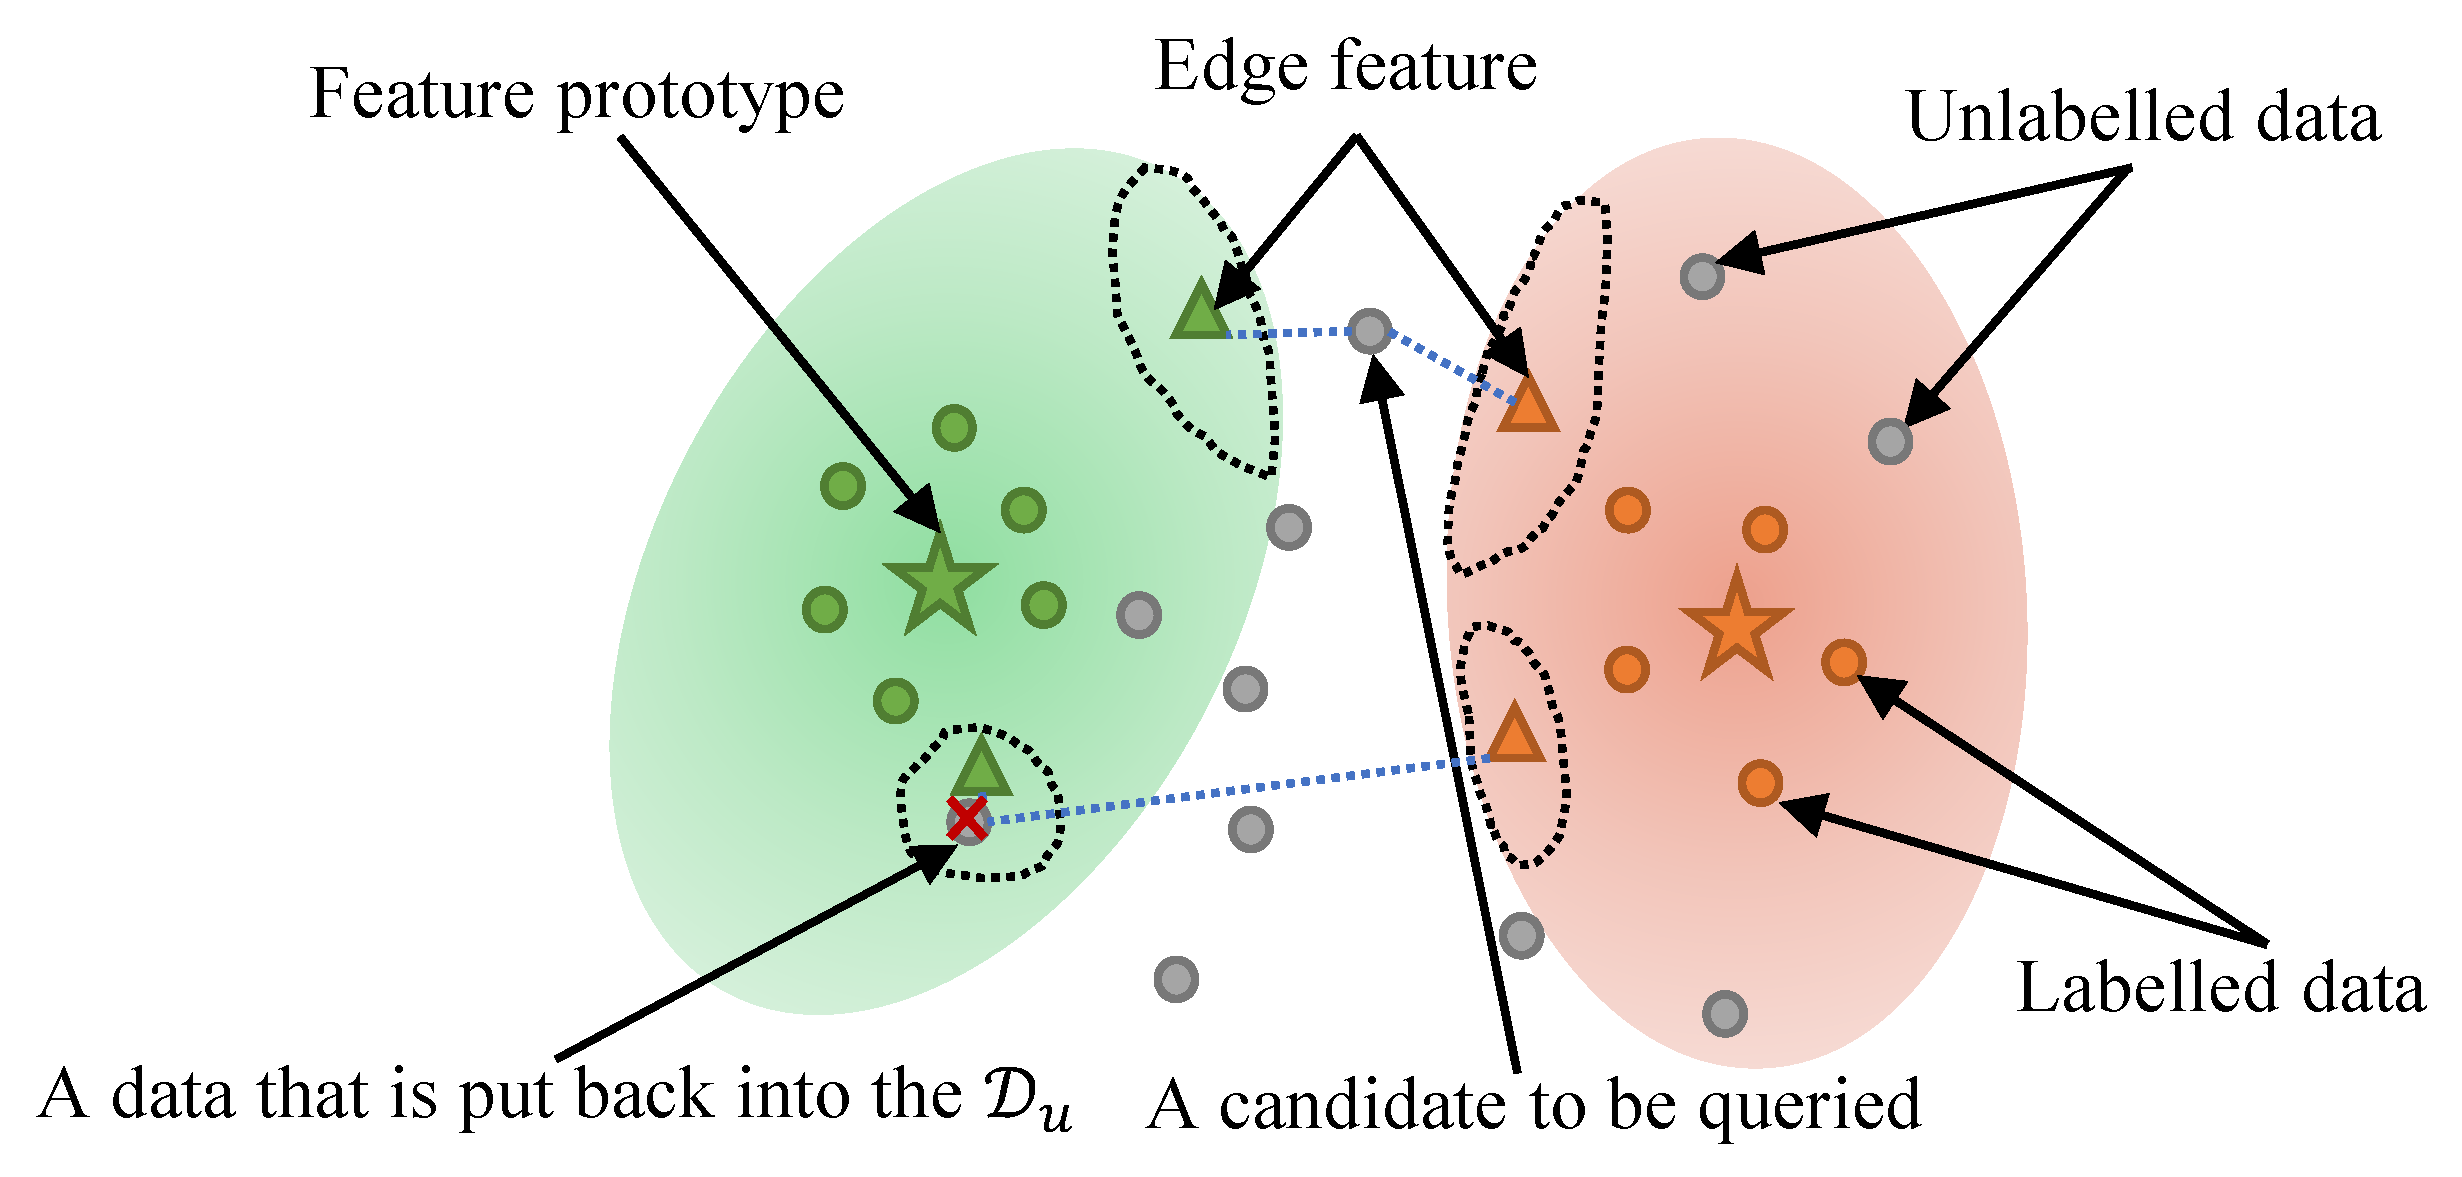
2.3. Edge Distance-Entropy
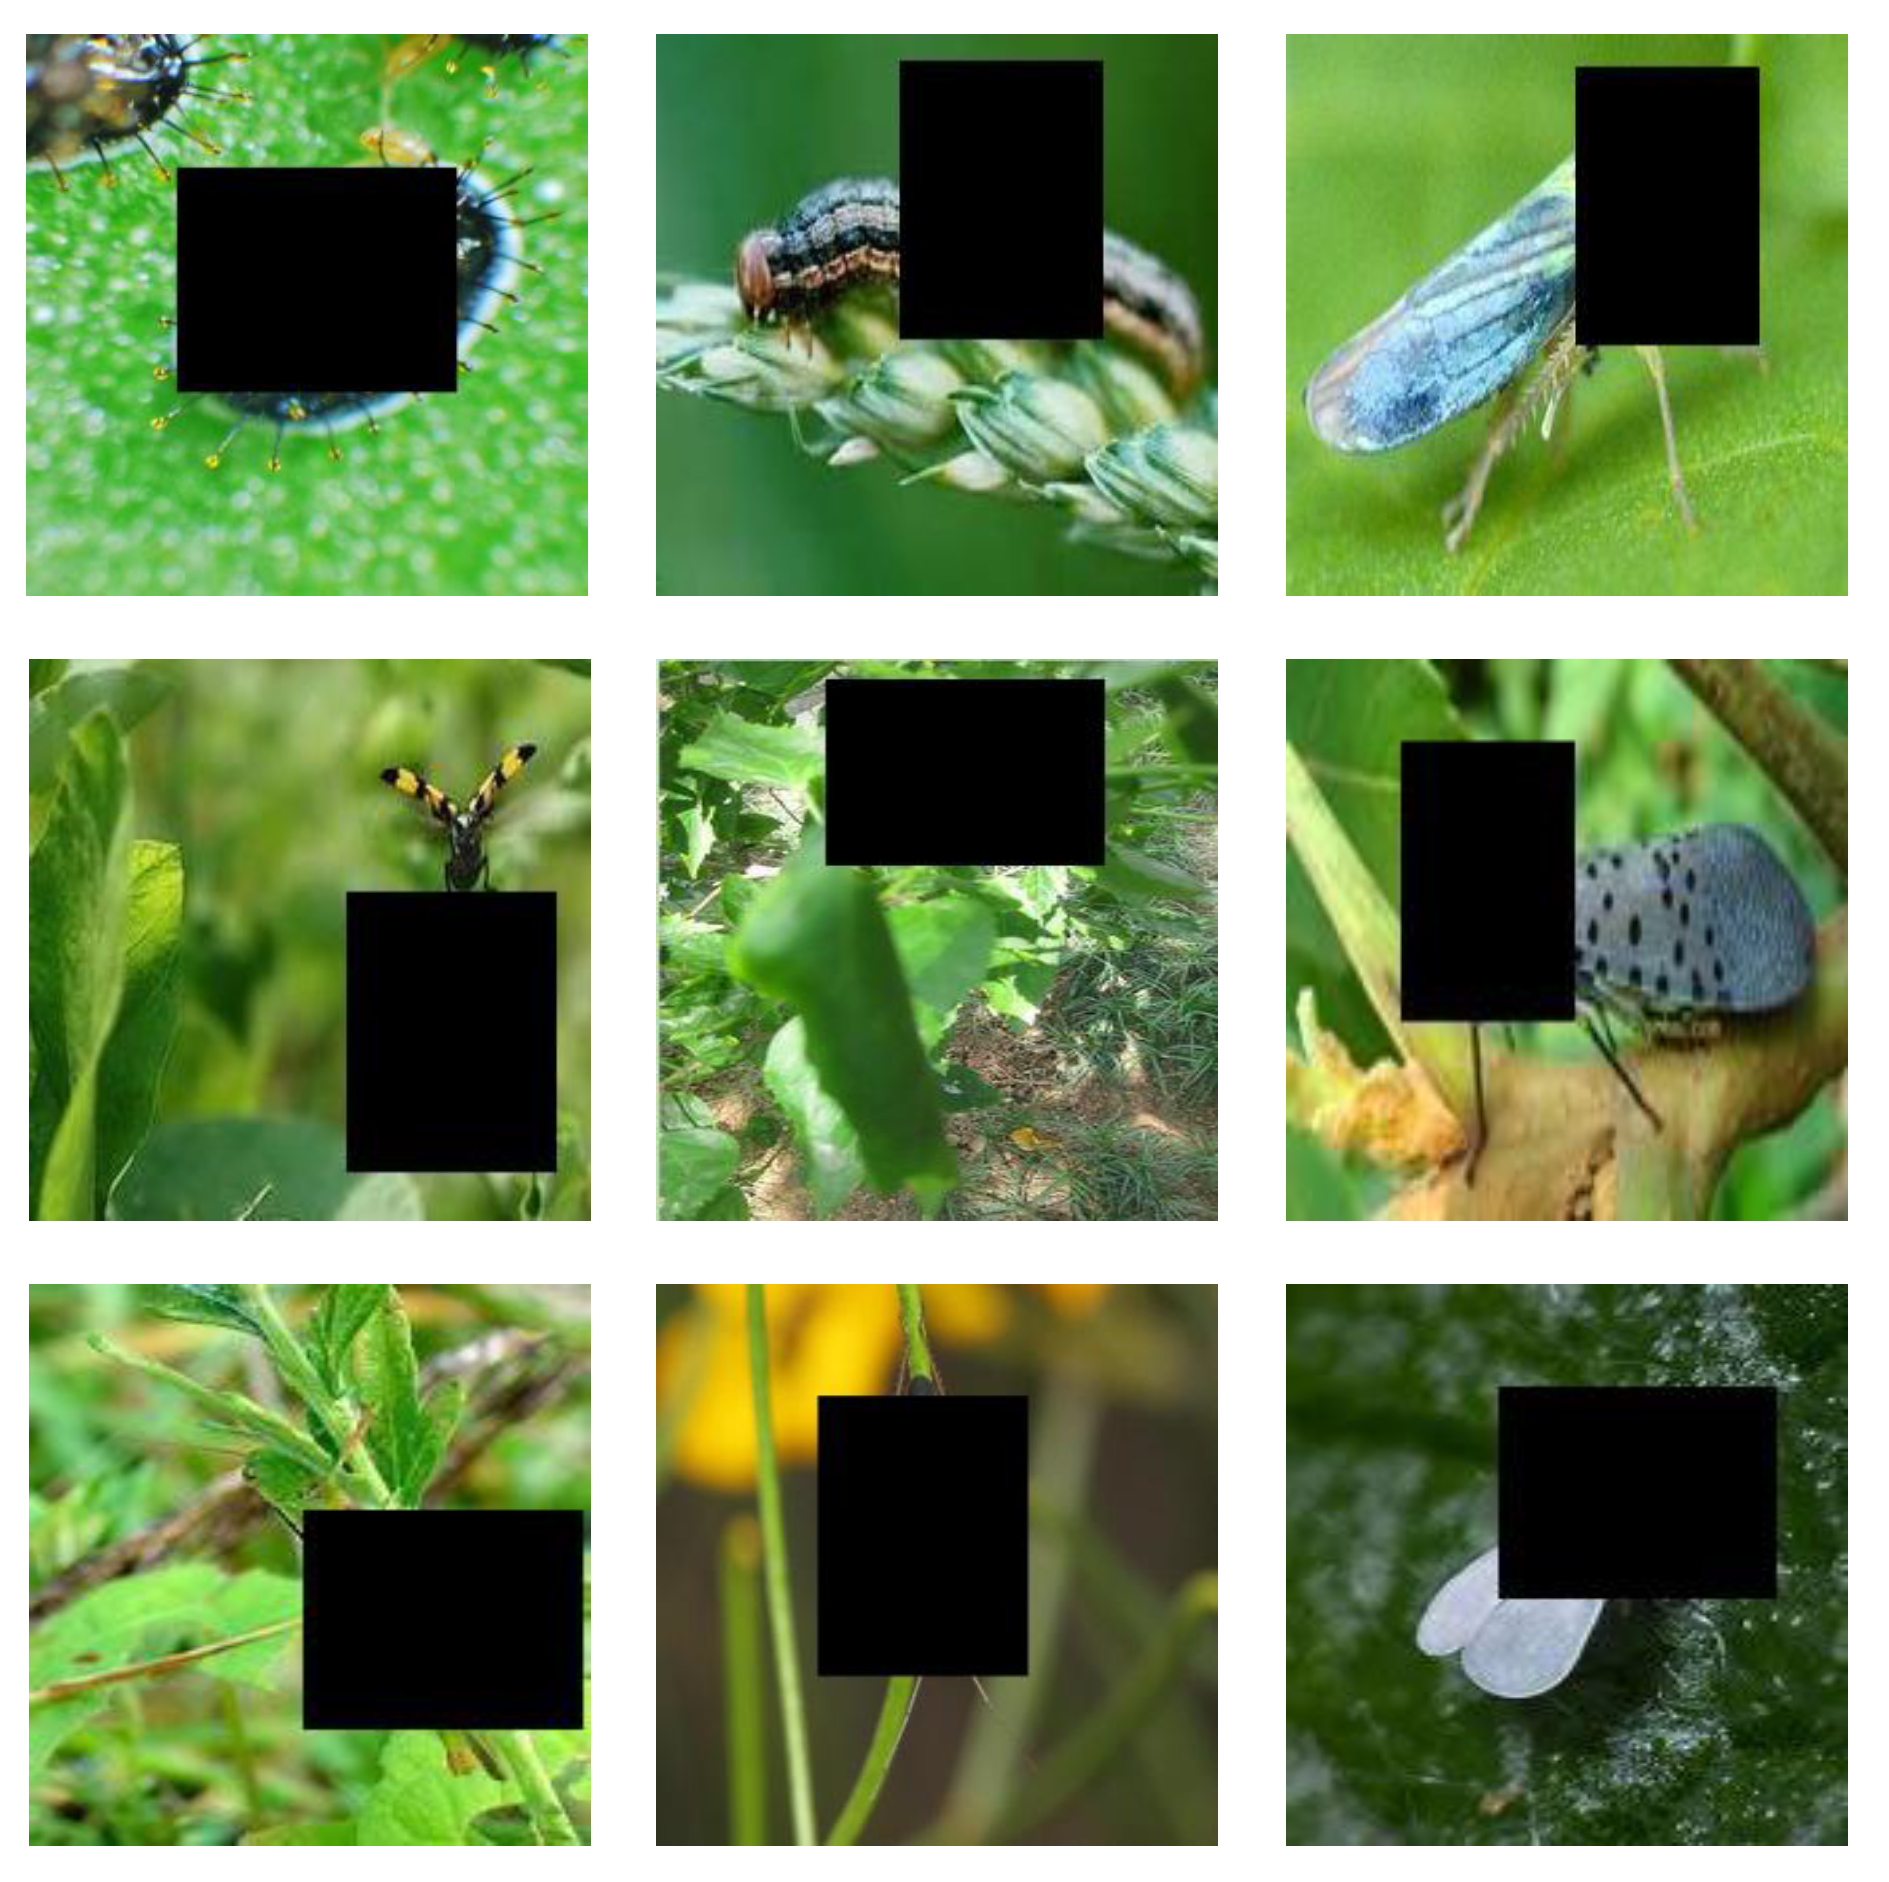
2.4. Anomaly Feature Detection Strategy
| Algorithm 1: Our Edge Distance-Entropy algorithm. |
 |
3. Results
3.1. Experiment Settings
3.2. Overall Results
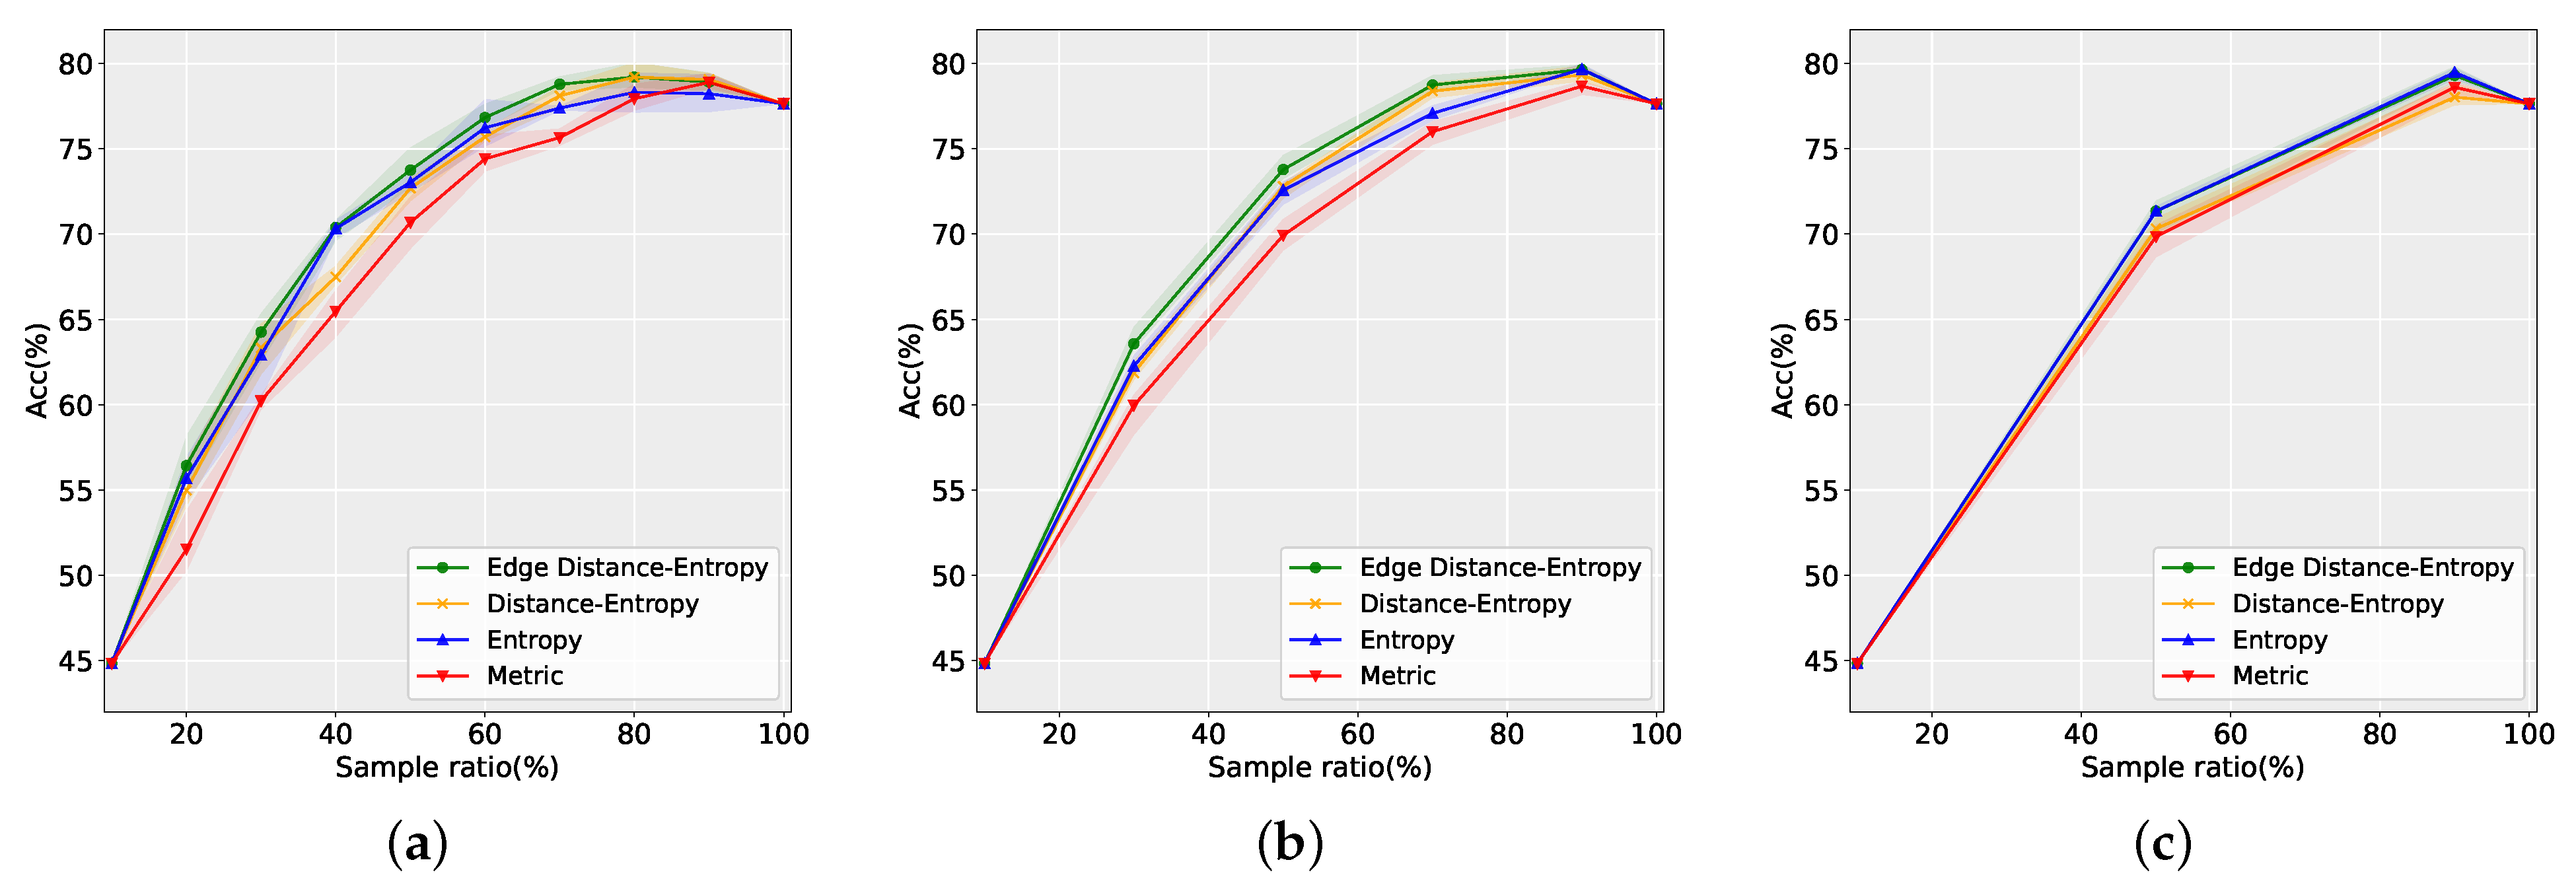
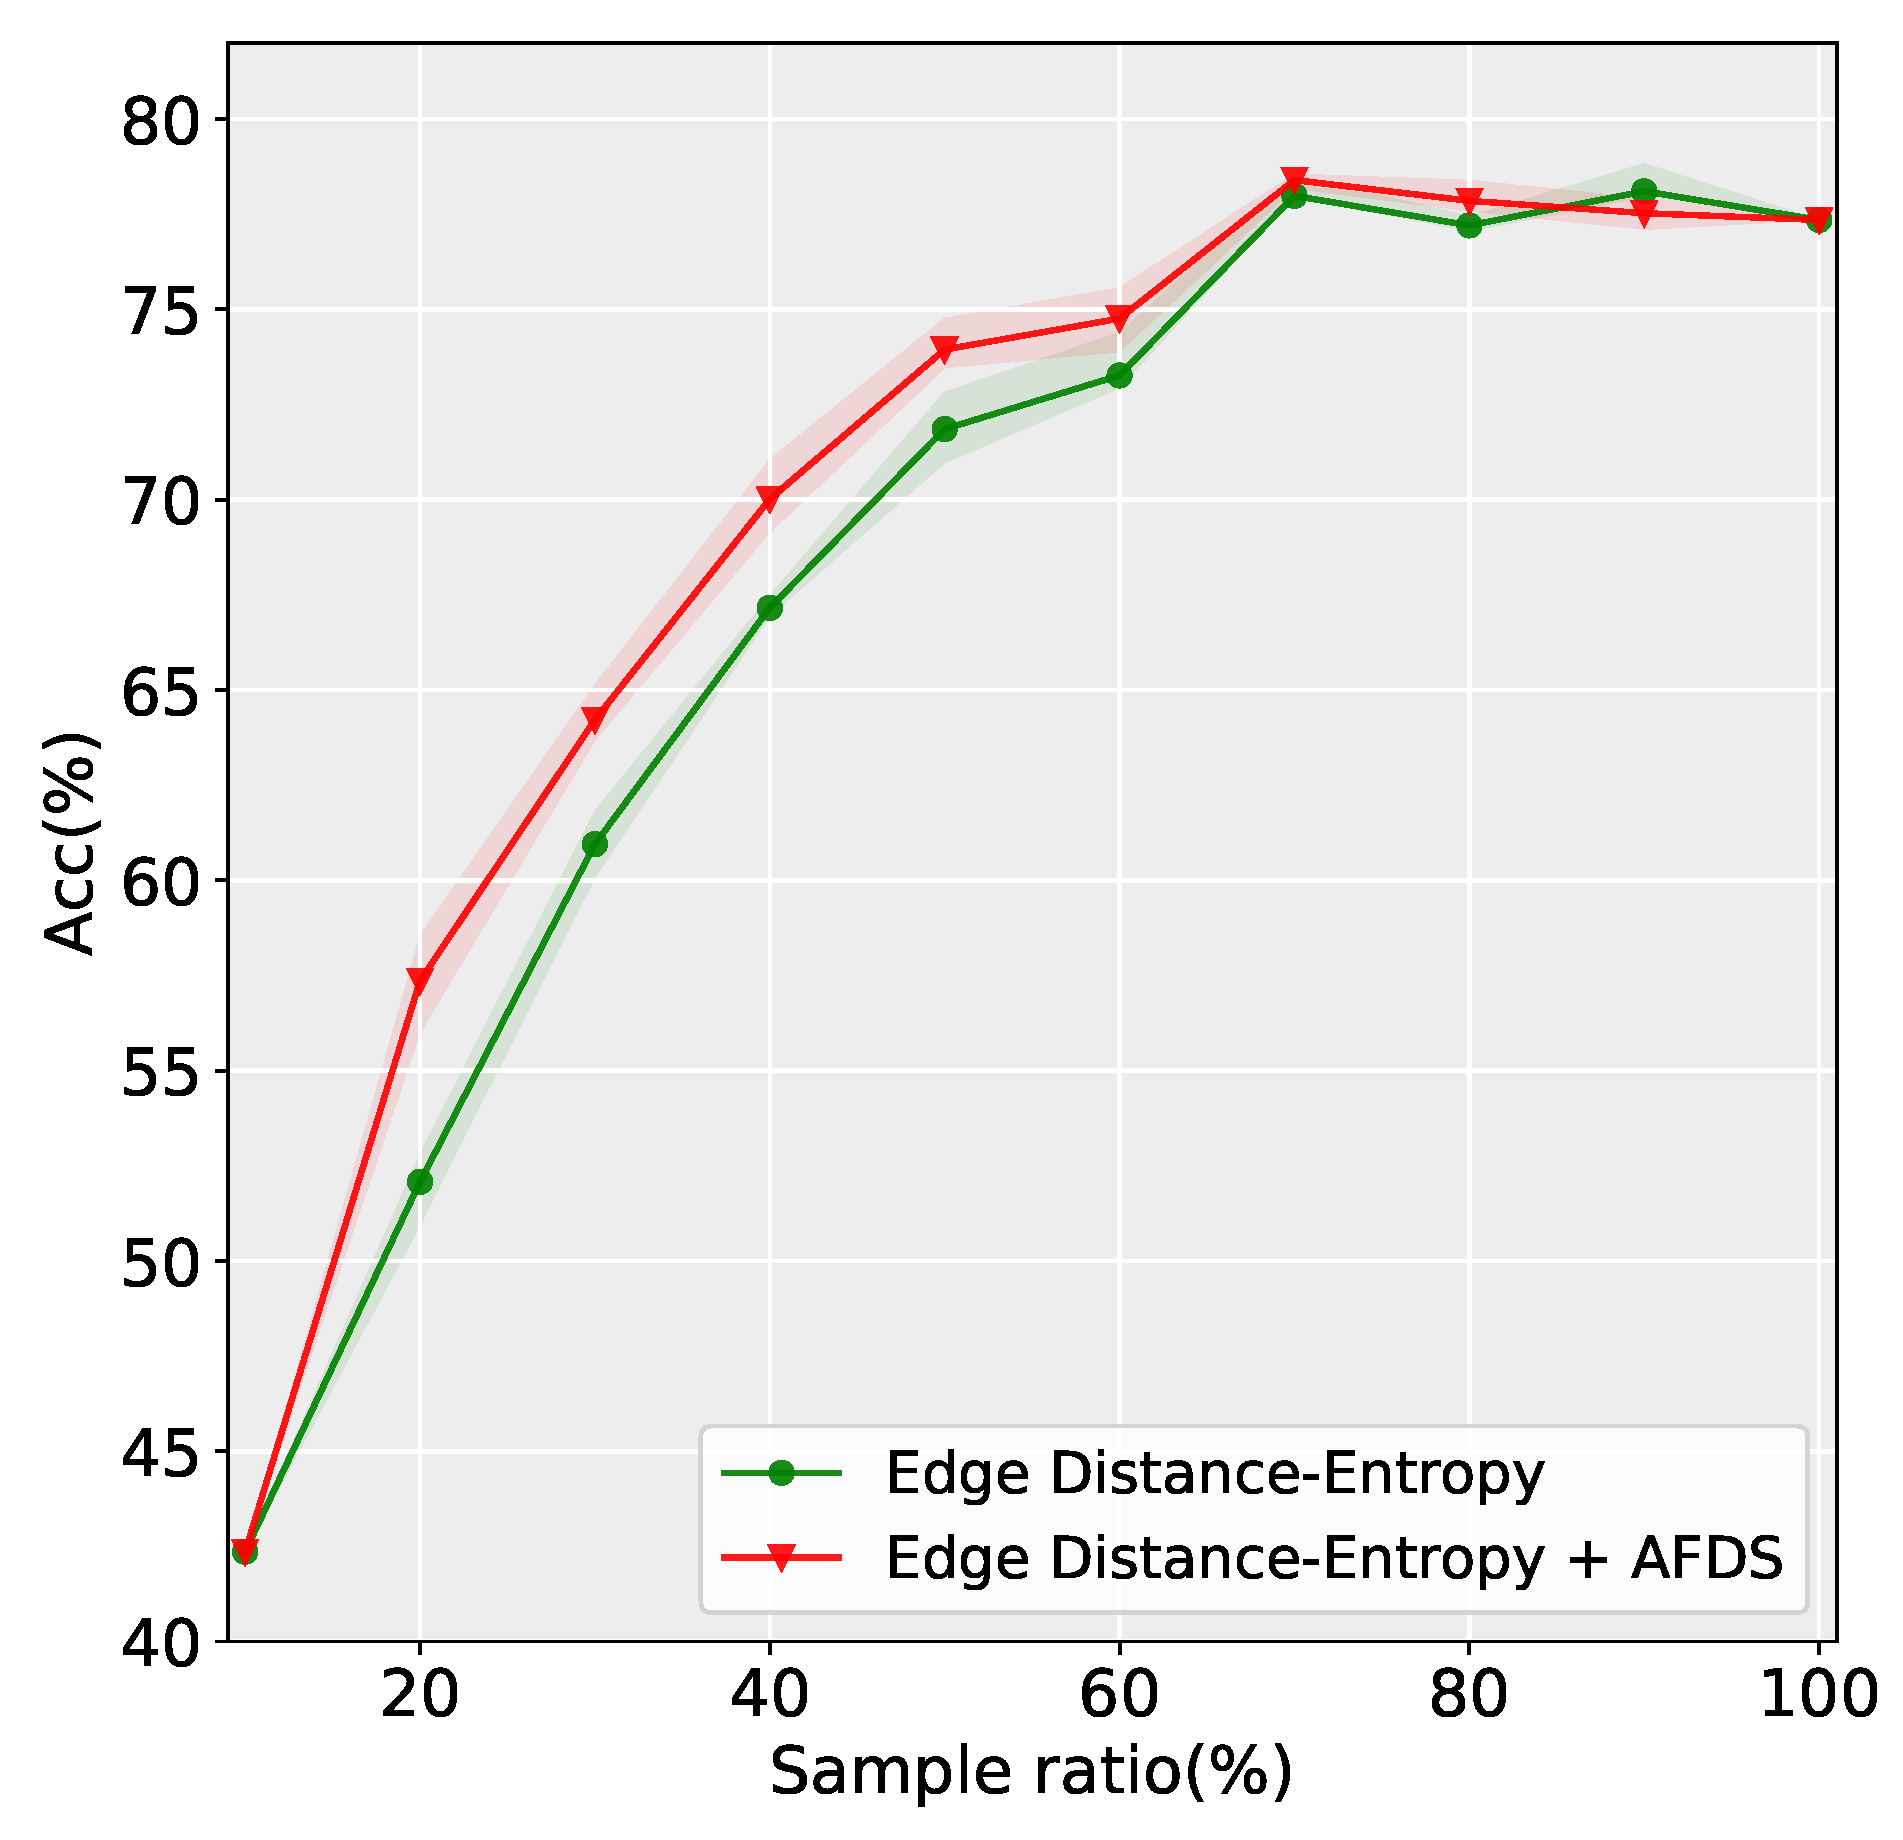
3.2.1. Comparison of Different Methods
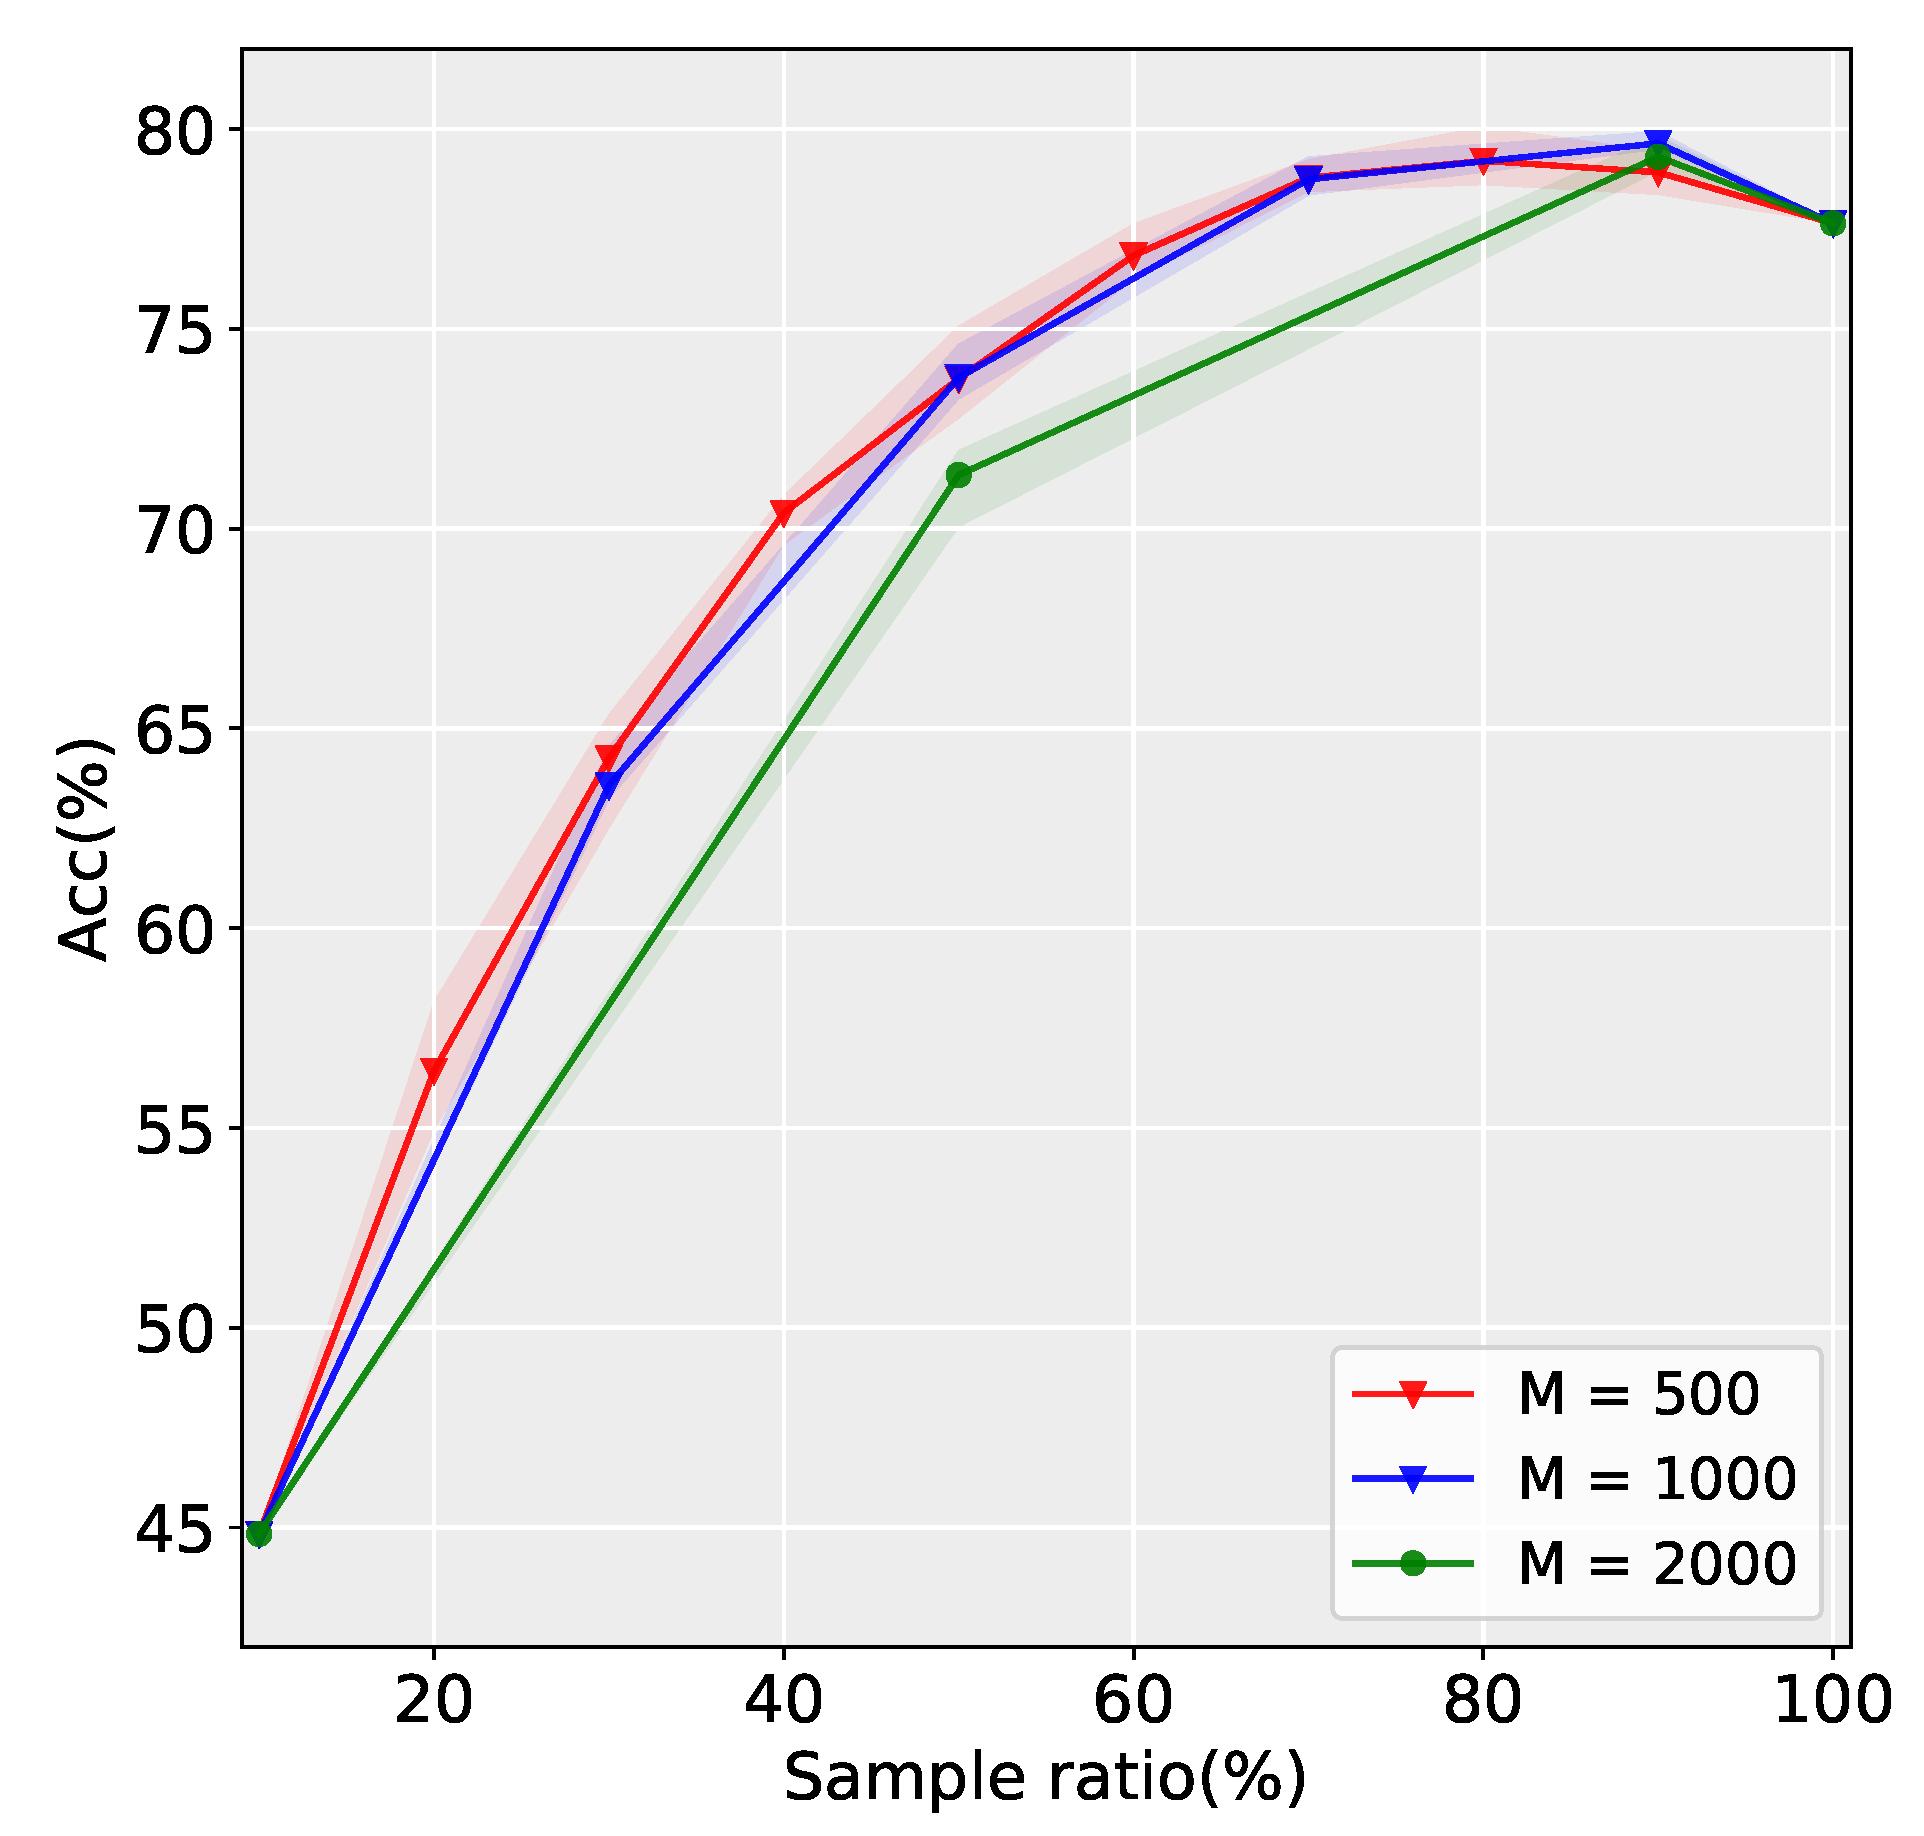
3.2.2. Influence of Parameter
4. Discussion
4.1. Discussion in the Case of Abnormal Data
4.2. Application of Data Evaluation
5. Conclusions
5.1. Conclusions
5.2. Future Work
Author Contributions
Funding
Institutional Review Board Statement
Informed Consent Statement
Data Availability Statement
Conflicts of Interest
References
- Ali, E.B.; Agyekum, E.B.; Adadi, P. Agriculture for sustainable development: A SWOT-AHP assessment of Ghana’s planting for food and jobs initiative. Sustainability 2021, 13, 628. [Google Scholar] [CrossRef]
- Faisan, J.P.; Luhan, M.; Rovilla, J.; Sibonga, R.C.; Mateo, J.P.; Ferriols, V.M.E.N.; Brakel, J.; Ward, G.M.; Ross, S.; Bass, D.; et al. Preliminary survey of pests and diseases of eucheumatoid seaweed farms in the Philippines. J. Appl. Phycol. 2021, 33, 2391–2405. [Google Scholar] [CrossRef]
- Alengebawy, A.; Abdelkhalek, S.T.; Qureshi, S.R.; Wang, M.Q. Heavy metals and pesticides toxicity in agricultural soil and plants: Ecological risks and human health implications. Toxics 2021, 9, 42. [Google Scholar] [CrossRef] [PubMed]
- Wang, C.; Wang, X.; Jin, Z.; Müller, C.; Pugh, T.A.; Chen, A.; Piao, S. Occurrence of crop pests and diseases has largely increased in China since 1970. Nat. Food 2022, 3, 57–65. [Google Scholar] [CrossRef]
- Gullino, M.L.; Albales, R.; Al-Jboory, I.; Angelotti, F.; Chakraborty, S.; Garrett, K.A.; Hurley, B.P.; Juroszek, P.; Makkouk, K.; Stephenson, T. Scientific review of the impact of climate change on plant pests: A global challenge to prevent and mitigate plant pest risks in agriculture, forestry and ecosystems. In Embrapa Semiárido-Livro técnico (INFOTECA-E); FAO: Rome, Italy, 2021. [Google Scholar]
- Yang, J.; Zhang, Z.; Gong, Y.; Ma, S.; Guo, X.; Yang, Y.; Xiao, S.; Wen, J.; Li, Y.; Gao, X.; et al. Do Deep Neural Networks Always Perform Better When Eating More Data? arXiv 2022, arXiv:2205.15187. [Google Scholar]
- Li, Y.; Yang, J. Few-shot cotton pest recognition and terminal realization. Comput. Electron. Agric. 2020, 169, 105240. [Google Scholar] [CrossRef]
- Li, Y.; Chao, X. Semi-supervised few-shot learning approach for plant diseases recognition. Plant Methods 2021, 17, 1–10. [Google Scholar] [CrossRef]
- Dai, Y.; Wu, Y.; Zhou, F.; Barnard, K. Attentional local contrast networks for infrared small target detection. IEEE Trans. Geosci. Remote Sens. 2021, 59, 9813–9824. [Google Scholar] [CrossRef]
- Li, Y.; Nie, J.; Chao, X. Do we really need deep CNN for plant diseases identification? Comput. Electron. Agric. 2020, 178, 105803. [Google Scholar] [CrossRef]
- Khan, R.U.; Zhang, X.; Kumar, R. Analysis of ResNet and GoogleNet models for malware detection. J. Comput. Virol. Hacking Tech. 2019, 15, 29–37. [Google Scholar] [CrossRef]
- Rajpal, S.; Lakhyani, N.; Singh, A.K.; Kohli, R.; Kumar, N. Using handpicked features in conjunction with ResNet-50 for improved detection of COVID-19 from chest X-ray images. Chaos Solitons Fractals 2021, 145, 110749. [Google Scholar] [CrossRef] [PubMed]
- Atila, Ü.; Uçar, M.; Akyol, K.; Uçar, E. Plant leaf disease classification using EfficientNet deep learning model. Ecol. Inform. 2021, 61, 101182. [Google Scholar] [CrossRef]
- Biswas, D.; Su, H.; Wang, C.; Blankenship, J.; Stevanovic, A. An automatic car counting system using OverFeat framework. Sensors 2017, 17, 1535. [Google Scholar] [CrossRef] [PubMed] [Green Version]
- Yan, B.; Fan, P.; Lei, X.; Liu, Z.; Yang, F. A real-time apple targets detection method for picking robot based on improved YOLOv5. Remote Sens. 2021, 13, 1619. [Google Scholar] [CrossRef]
- Zhai, S.; Shang, D.; Wang, S.; Dong, S. DF-SSD: An improved SSD object detection algorithm based on DenseNet and feature fusion. IEEE Access 2020, 8, 24344–24357. [Google Scholar] [CrossRef]
- Vecvanags, A.; Aktas, K.; Pavlovs, I.; Avots, E.; Filipovs, J.; Brauns, A.; Done, G.; Jakovels, D.; Anbarjafari, G. Ungulate Detection and Species Classification from Camera Trap Images Using RetinaNet and Faster R-CNN. Entropy 2022, 24, 353. [Google Scholar] [CrossRef] [PubMed]
- Yang, J.; Ni, J.; Li, Y.; Wen, J.; Chen, D. The Intelligent Path Planning System of Agricultural Robot via Reinforcement Learning. Sensors 2022, 22, 4316. [Google Scholar] [CrossRef]
- Li, Y.; Chao, X. Toward Sustainability: Trade-Off Between Data Quality and Quantity in Crop Pest Recognition. Front. Plant Sci. 2021, 12, 811241. [Google Scholar] [CrossRef]
- Li, Y.; Yang, J. Meta-learning baselines and database for few-shot classification in agriculture. Comput. Electron. Agric. 2021, 182, 106055. [Google Scholar] [CrossRef]
- Snell, J.; Swersky, K.; Zemel, R. Prototypical networks for few-shot learning. Adv. Neural Inf. Process. Syst. 2017, 30. Available online: https://proceedings.neurips.cc/paper/2017/file/cb8da6767461f2812ae4290eac7cbc42-Paper.pdf (accessed on 10 May 2022).
- Fatras, K.; Damodaran, B.B.; Lobry, S.; Flamary, R.; Tuia, D.; Courty, N. Wasserstein Adversarial Regularization for learning with label noise. IEEE Trans. Pattern Anal. Mach. Intell. 2021. [Google Scholar] [CrossRef] [PubMed]
- Allotey, J.; Butler, K.T.; Thiyagalingam, J. Entropy-based active learning of graph neural network surrogate models for materials properties. J. Chem. Phys. 2021, 155, 174116. [Google Scholar] [CrossRef] [PubMed]
- Li, Y.; Chao, X. Distance-Entropy: An effective indicator for selecting informative data. Front. Plant Sci. 2022, 1, 818895. [Google Scholar] [CrossRef] [PubMed]
- Li, Y.; Chao, X.; Ercisli, S. Disturbed-entropy: A simple data quality assessment approach. ICT Express 2022. [Google Scholar] [CrossRef]
- Sun, H.; Zheng, X.; Lu, X. A supervised segmentation network for hyperspectral image classification. IEEE Trans. Image Process. 2021, 30, 2810–2825. [Google Scholar] [CrossRef]
- Li, Y.; Yang, J.; Wen, J. Entropy-based redundancy analysis and information screening. Digit. Commun. Netw. 2021. [Google Scholar] [CrossRef]
- Shen, M.; Yang, J.; Sanjuán, M.A.F.; Zheng, Y.; Liu, H. Adaptive denoising for strong noisy images by using positive effects of noise. Eur. Phys. J. Plus 2021, 136, 698. [Google Scholar] [CrossRef]
- Zhou, Y.; Dong, F.; Liu, Y.; Ran, L. A deep learning framework to early identify emerging technologies in large-scale outlier patents: An empirical study of CNC machine tool. Scientometrics 2021, 126, 969–994. [Google Scholar] [CrossRef]
- Chen, X.; Zhou, G.; Chen, A.; Pu, L.; Chen, W. The fruit classification algorithm based on the multi-optimization convolutional neural network. Multimed. Tools Appl. 2021, 80, 11313–11330. [Google Scholar] [CrossRef]
- Yuan, X.; Shi, J.; Gu, L. A review of deep learning methods for semantic segmentation of remote sensing imagery. Expert Syst. Appl. 2021, 169, 114417. [Google Scholar] [CrossRef]


Publisher’s Note: MDPI stays neutral with regard to jurisdictional claims in published maps and institutional affiliations. |
© 2022 by the authors. Licensee MDPI, Basel, Switzerland. This article is an open access article distributed under the terms and conditions of the Creative Commons Attribution (CC BY) license (https://creativecommons.org/licenses/by/4.0/).
Share and Cite
Yang, J.; Ma, S.; Li, Y.; Zhang, Z. Efficient Data-Driven Crop Pest Identification Based on Edge Distance-Entropy for Sustainable Agriculture. Sustainability 2022, 14, 7825. https://doi.org/10.3390/su14137825
Yang J, Ma S, Li Y, Zhang Z. Efficient Data-Driven Crop Pest Identification Based on Edge Distance-Entropy for Sustainable Agriculture. Sustainability. 2022; 14(13):7825. https://doi.org/10.3390/su14137825
Chicago/Turabian StyleYang, Jiachen, Shukun Ma, Yang Li, and Zhuo Zhang. 2022. "Efficient Data-Driven Crop Pest Identification Based on Edge Distance-Entropy for Sustainable Agriculture" Sustainability 14, no. 13: 7825. https://doi.org/10.3390/su14137825