Article

Geographical Distribution Characteristics of Ethnic-Minority Villages in Fujian and Their Relationship with Topographic Factors

1
School of Architecture, Tianjin University, Tianjin 300072, China
2
College of Civil Engineering and Architecture, Zhejiang University, Hangzhou 310058, China
3
Building Information Technology Innovation Laboratory (BITI Lab), Solearth Architecture Research Center, Hong Kong 999077, China
*
Author to whom correspondence should be addressed.
Sustainability 2022, 14(13), 7727; https://doi.org/10.3390/su14137727
Submission received: 10 May 2022 / Revised: 14 June 2022 / Accepted: 15 June 2022 / Published: 24 June 2022

Abstract

:
The geographical distribution characteristics of villages characterised by ethnic minorities are determined by the selection of the site when the village was initially established. The location of inherited and well-preserved minority villages must be exceptionally compatible with the natural terrain, with a logical relationship. Nonetheless, the issue of village location, which is directly related to the development of the features of the geographical distribution, has received little attention from scholars. The average nearest proximity index, Voronoi, kernel density analysis, proximity analysis, and the Geographical Detector (GeoDetector) were used to analyse the geographic distribution characteristics of villages and their correlation with terrain, as well as the difference between the influence of each terrain factor. The findings indicated the following. (1) The geographical distribution of minority villages in Fujian Province is of the agglomeration type, with a significant “mononuclear” feature, and the topography has a facilitating effect on the clustering distribution of villages. (2) The geographical distribution of minority villages in each city of Fujian Province coexisted with the agglomeration type and the dispersion type, and the role of topography in promoting the agglomeration-type distribution of villages was not affected by the distribution density of villages. (3) The site selection of Fujian-minority villages is characterised by medium altitude, moderate slope, sun exposure, and no obvious hydrophilicity. Minority villages are mainly located in areas with an elevation of 202–647 m; a slope of 6–15°; a flat land aspect with a south slope, southeast slope, or southwest slope; and distance of 500–1500 m from 5–20 m wide rivers of level 2. (4) The site selection of Fujian minority villages is influenced by various topographic factors, such as elevation, slope, aspect, river buffer, river width, and river level, among which river width has the most substantial effect. (5) All topographic factors have a two-factor enhancing relationship with each other, aspect and slope have the most substantial effect and play a dominant role in site selection. The research findings illuminate the internal logic of the geographical distribution differentiation of villages characterised by ethnic minorities, which is critical for promoting the protection of modern ethnic-minority villages.

1. Introduction

Ethnic minority villages are natural villages with a disproportionately high proportion of residents of ethnic minorities, comprehensive production and living functions, and obvious ethnic culture and settlement characteristics [1]. They reflect the diversity of Chinese culture in terms of architectural style, village form, and customs, and they are also an important resource for the economic and social development of ethnic areas, with important historical, cultural, economic, and social values [2,3]. The geographical distribution characteristics of minority villages include historical culture and national wisdom, and the main expression is the adaptation of villages to the natural geographical environment, and the key to this expression is the location of villages; a favourable location can prevent the extinction of villages to a certain extent. The formation of the present geographical distribution of the inherited and well-preserved minority villages is inevitably the result of the coordination of site selection and topography.
For a long time, scholars have conducted a series of diversified academic studies on minority villages from different perspectives and have mainly focused on the following three aspects.

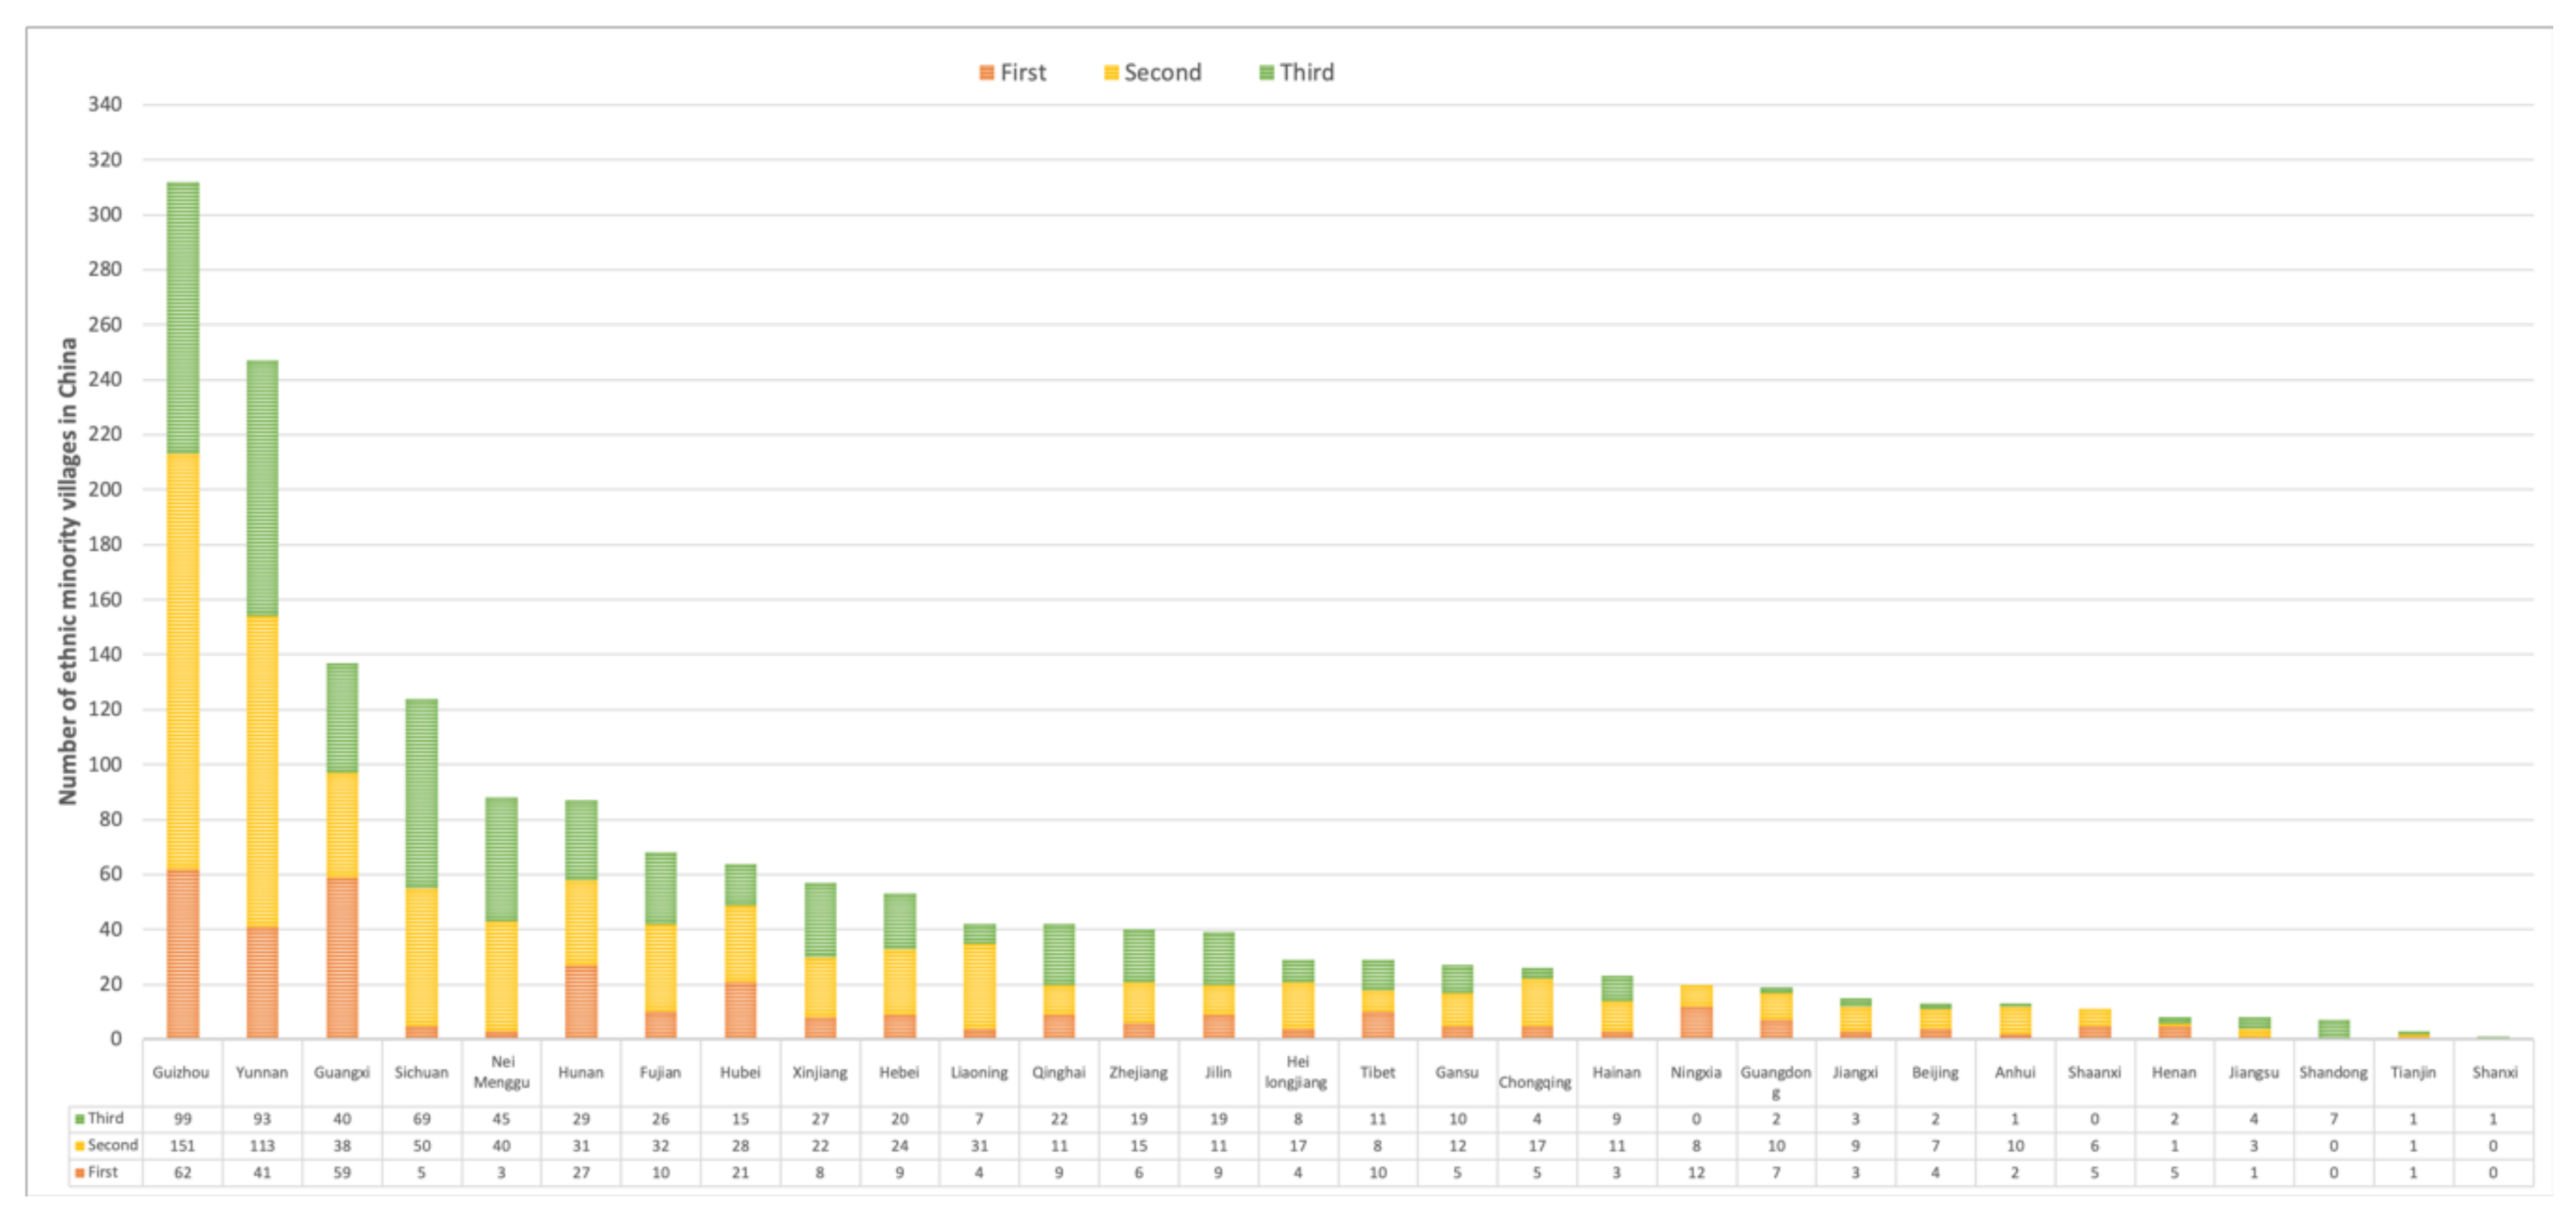
1.1. Geographical Dispersion

Chen discovered that medium- and high-altitude mountains with undulating terrain and diverse landforms, major rivers, and their upper reaches provide the foundation for the endogenous development of ethnic villages [4], and Dong discovered that the geographical distribution of villages in Shanxi Province is also related to post roads and the great wall border in the Ming and Qing dynasties [5]. Wei discovered that Miao villages have a significant influence on the distribution of features of ethnic villages in Guizhou and that the river basin and economics are significant influencing factors [6]. Wang discovered that village rituals’ order and authority had a direct effect on their geographical distribution and form [7]. Sun discovered that villages are spread along the rivers’ course [8], whereas Yan discovered that the settlement distribution is hydrophilic and investigated the position of villages dominated by the river [9]. Vienna discovered that surnames play a role in determining the dispersion of ethnic villages [10]. Marriage affects the geographical distribution structure of villages [11]. Other scholars studied the dynamic evolution based on research into the geographical distribution of villages. Zhouzhengxu found that the pressure of ethnic survival played a role in promoting the evolution of villages [12]. Tangminggui found that historical politics and social economy were the main driving forces for the evolution of villages and that ethnic cultural heritage and ancient transportation were the key guiding factors for the evolution of their spatial forms [13]. Yang Yan found that Miao culture and population distribution played a decisive role in the evolution of villages and that a backward economic development level and blocked traffic conditions play an important role in protection [14]. Most of the above studies are related to the terrain environment or take the terrain as one of the research backgrounds.

1.2. Economic Development

Gustafsson Bjorn discovered that the number of poor people in ethnic-minority villages is significantly higher than in other regions and believes that geographic location is the most important factor affecting the economic situation of ethnic-minority villages in Northwest China, particularly Southwest China [15]. Poverty alleviation practises in ethnic-minority villages can be classified into three categories: investment-driven poverty alleviation, reform-driven poverty alleviation, and political-driven poverty alleviation [16]. Single policy support cannot bring significant changes to villages [17], the practical road toward poverty alleviation in ethnic-minority villages should be promoted from a single subject to many subjects, from single-driven development to multiple-driven combination, and from focusing on absolute poverty to focusing on characteristic development [18]. Tourism can be used to promote development by establishing a path of integration and mutual promotion between the construction of ethnic-minority villages and the tourism industry [19,20,21]. However, three challenges to practical tourism should be avoided: spatial justice, excessive commercialization, and local dilution [22,23]. To assist economic development, we must establish a localised, distinctive, and manageable policy structure for ethnic-minority villages [24]; raise awareness of ecological capital; clarify property rights for ecological resources; and strengthen the ecological compensation mechanism [25]. Confronted with the obvious problems of “nature-society” dual-factor restriction, obvious lag in governance consciousness, obvious homogenization of national culture, lack of talent for cultural inheritance, and so on, we should cultivate village governance elites and develop a multi-agent governance pattern [26], fully exploit the advantages of the Internet era, and construct a three-dimensional national dissemination communication system for villages [27]. This is a potential direction for the governance of villages populated by ethnic minorities in China.

1.3. The Village Evaluation System

Tao identifies economics, population, transportation, terrain elevation, river buffer zone, and ecological variables as factors influencing the geographical distribution characteristics of notable historical and cultural cities and villages in the Yangtze River economic belt [28]. Liu examined the distribution characteristics of rural residential areas under the combined action of natural and geographical factors [29,30]. Ma examined the adaptability of traditional villages by incorporating environmental characteristics such as height, slope, aspect, and river buffer zone, as well as social aspects [31]. Natural components, as a critical component of research on distribution features or evaluation, lack a standardised quantity and type. Most research techniques are based on ArcGIS software. Xiao investigated the geographical distribution characteristics of various types of farmhouse entertainment using the nearest-neighbour index, the coefficient of variation, and other methods [32], and Liang used kernel density analysis, superposition analysis, and other methods to conduct a comprehensive analysis of the geographical distribution characteristics and historical evolution process of traditional Ganzhou Hakka villages in two dimensions, space and time [33]. Gao used spatial analysis methods such as standard deviation ellipse analysis to study the geographical distribution of sports venues in Beijing [34], while Wu used GIS spatial analysis and GeoDetector to analyse the distribution characteristics and influencing factors of famous towns and villages with Chinese characteristics [35]. Zhang examined the geographical distribution type of point targets using the Voronoi diagram’s measure [36], whereas the classification of kinds is largely based on Thomas Duyckaerts’ research suggesting a value method [37]. Song employed proximity analysis to assess the relationship between the study object and the elements within a specified distance, quantify the complex relationship between the elements, and communicate the results intuitively [38]. It has become a trend to use GIS in the study of spatial distribution characteristics of villages and villages, which is helpful to quantify the characteristics.
Existing studies on minority villages have laid a solid foundation for this study. However, most studies on the characteristics of minority villages take the provincial area as the research scale, and there are more studies on minority villages in Guizhou, Yunnan, and Hubei Province than other studies [39,40,41], but there are relatively few studies on minority villages in Fujian Province, especially studies that rely on data quantification. Secondly, the research on the geographical distribution characteristics of ethnic minorities from macroscopic and mesoscopic perspectives mostly investigates the economic development of villages or evaluates the adaptability of villages, so only two or three topographic factors are selected as natural factors in the evaluation to investigate the influence of topography on villages. Thirdly, the difference in the impact of various topographic factors on the geographical distribution of villages has not been paid attention to. Therefore, this paper takes Fujian minority villages as the research object, combines geography and mathematical analysis methods to study the relationship between the geographical distribution of minority villages and topography, and then explores the relationship between each factor and village distribution by decomposing topographic features and quantifies the weight of influence of each factor and its degree of interaction. The study can provide theoretical support and practical guidance for local cultural conservation, village history research, and village protection of minority villages in Fujian.

2. Research Scope and Data Sources

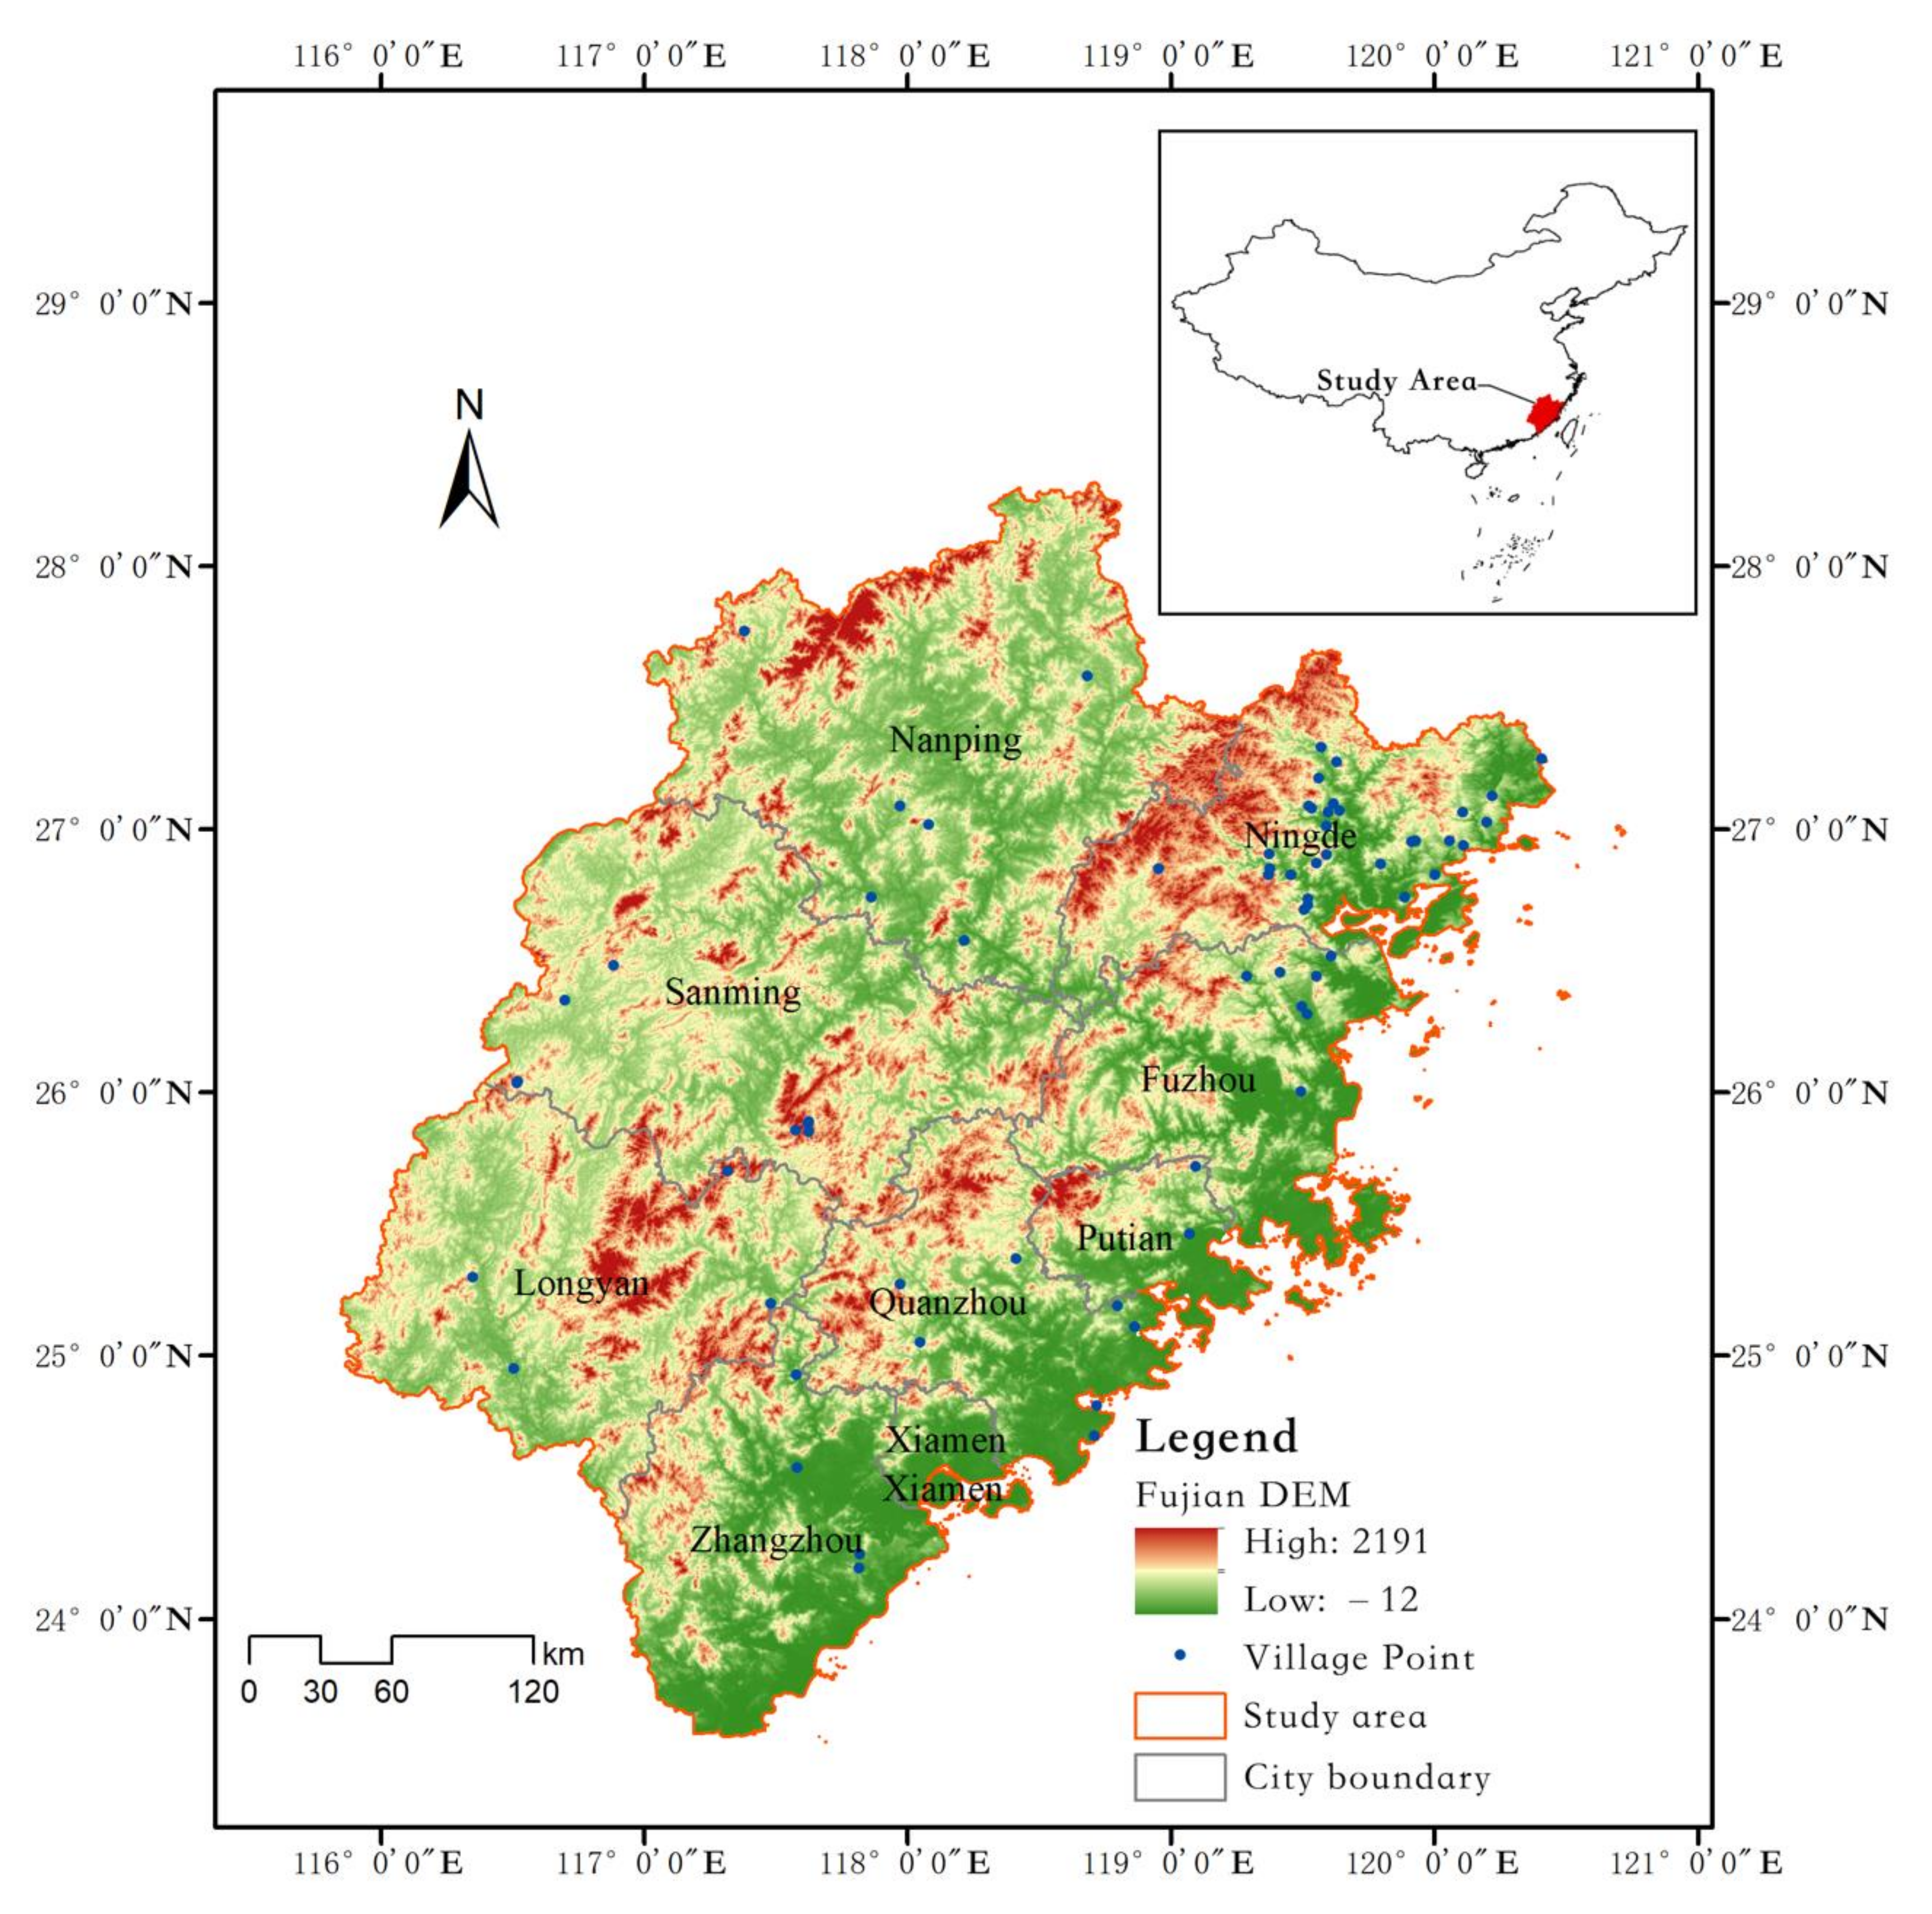
2.1. Overview of the Study Area

Fujian Province (115°50′ E~120°47′ E, 23°30′ N~28°19′ N) is located on the southeast coast of China and covers an area of about 124,000 square kilometres (Figure 1). The terrain is dominated by mountains and hills, which account for more than 80% of the total area [42]. The terrain is generally high in the northwest and low in the southeast, with two major mountain belts running diagonally across the province in the west and centre, with disconnected river valleys and basins between them and hills, tablelands, and coastal plains along the eastern coast. In terms of topography, the low mountains account for 44.1% of the province’s total area, which is the largest proportion, followed by the hills at 26.6%, low and middle mountains at 13.3%, and mountains at 1.6% [43]. Fujian has many rivers, with a river network density of 0.1 km/km2. All rivers in the province, except the Jiaoxi (Sai River), which originates in Zhejiang, originate in the territory and enter the sea in the province. A large proportion of the mountainous area and the complex river conditions form the basis for the location of the village.
The ethnic minority population of Fujian Province accounts for 2.16% of the province’s total population, and there are 19 ethnic townships (including 18 shē ethnic townships and 1 huí ethnic township) and one provincial-level ethnic economic development zone (shē ethnic Economic Development Zone). Historically, Fujian has been part of the national administrative territory since the Han Dynasty, but the main areas of state control were concentrated in the eastern coastal plain of Fujian, where there was more arable land and where multi-ethnic groups developed smoothly. From the Song Dynasty onwards, political factors led to a gradual increase in the number of immigrants to Fujian, which reached 280,885,251 by the 32nd year of the period (1162) of the Southern Song Dynasty, an increase of 765,819 compared to the period before the Song Dynasty’s southern migration, making it the second-largest population in China [44]. The increase in population led to a surge in inter-ethnic conflicts and clashes over scarce resources of arable land, and ethnic minorities in some areas began to look for a new place to live. After the Southern Song Dynasty was overthrown by the Yuan Dynasty, the minority groups in Fujian were besieged by the army because of the constant confrontation with the Yuan ruling class and were forced to migrate to the deeper parts of the mountains and hills. When the village was built, the basic criteria for site selection were “leaning against the mountain, facing the sun and near the water”, relying on the mountainous terrain, and reclaiming the mountains and longs as fields for dry farming and nomadic farming, thus forming the geographical distribution characteristics of the present village. The special human–territory relationship between the village and its habitat objectively demonstrates the influence of geographical factors on the geographical distribution of villages with minority characteristics [45].
At present, a total of 1652 minority villages have been selected as “Villages with Characteristics of Minorities in China” [46]. A large number of minority villages is distributed in all provinces and regions except Hong Kong, Macao, Taiwan, and Shanghai, and among the top ten provinces in terms of the number of minority villages (Figure 2), Fujian Province ranks first in terms of GDP per capita [47], so the conservation of minority villages in Fujian and the inheritance of their cultural characteristics are more urgent.

2.2. Data Sources and Processing

The research objects are a total of 68 villages with Chinese ethnic characteristics in the first, second, and third batches of Fujian Province (Figure 3). The figures in this research come from the published data of China’s State Ethnic Affairs Commission (as of January 2020) [46]. To illustrate, we gathered data on 68 villages with ethnic minorities in China through field study consultation with the Fujian Provincial Department of ethnic and religious affairs, and through browsing provincial government websites and historical documents. The shape of the land used by ethnic villages was mostly irregular geometric polygons, but it was a point element on the macro scale. Therefore, this study used the geographic coordinates of the centre of the geometric polygon of Fujian minority villages to study their geographical distribution. Using map location software to gather the longitude and latitude coordinates of the village, import them into ArcMap10.8 to create an ethnic village geospatial database. Fujian Province and city administrative border vector maps are derived from China’s fundamental geographic information database. The elevation data of Fujian Province (30 m digital elevation model) come from the Resource and Environmental Science Data Centre of the Chinese Academy of Sciences (https://www.resdc.cn/, accessed on 20 May 2022), from which the elevation, slope, aspect, and other features were extracted. River data came from the National Earth System Science Data Center (http://www.geodata.cn/, accessed on 20 May 2022) [48]. To avoid the impact of modern large-scale and high-frequency river conservancy project construction data on research results, river data obtained from the Chinese Academy of Sciences’ resource and environmental science data centre were pre-processed, and river conservancy data were obtained after deleting current river conservancy projects to be used as effective analysis data.

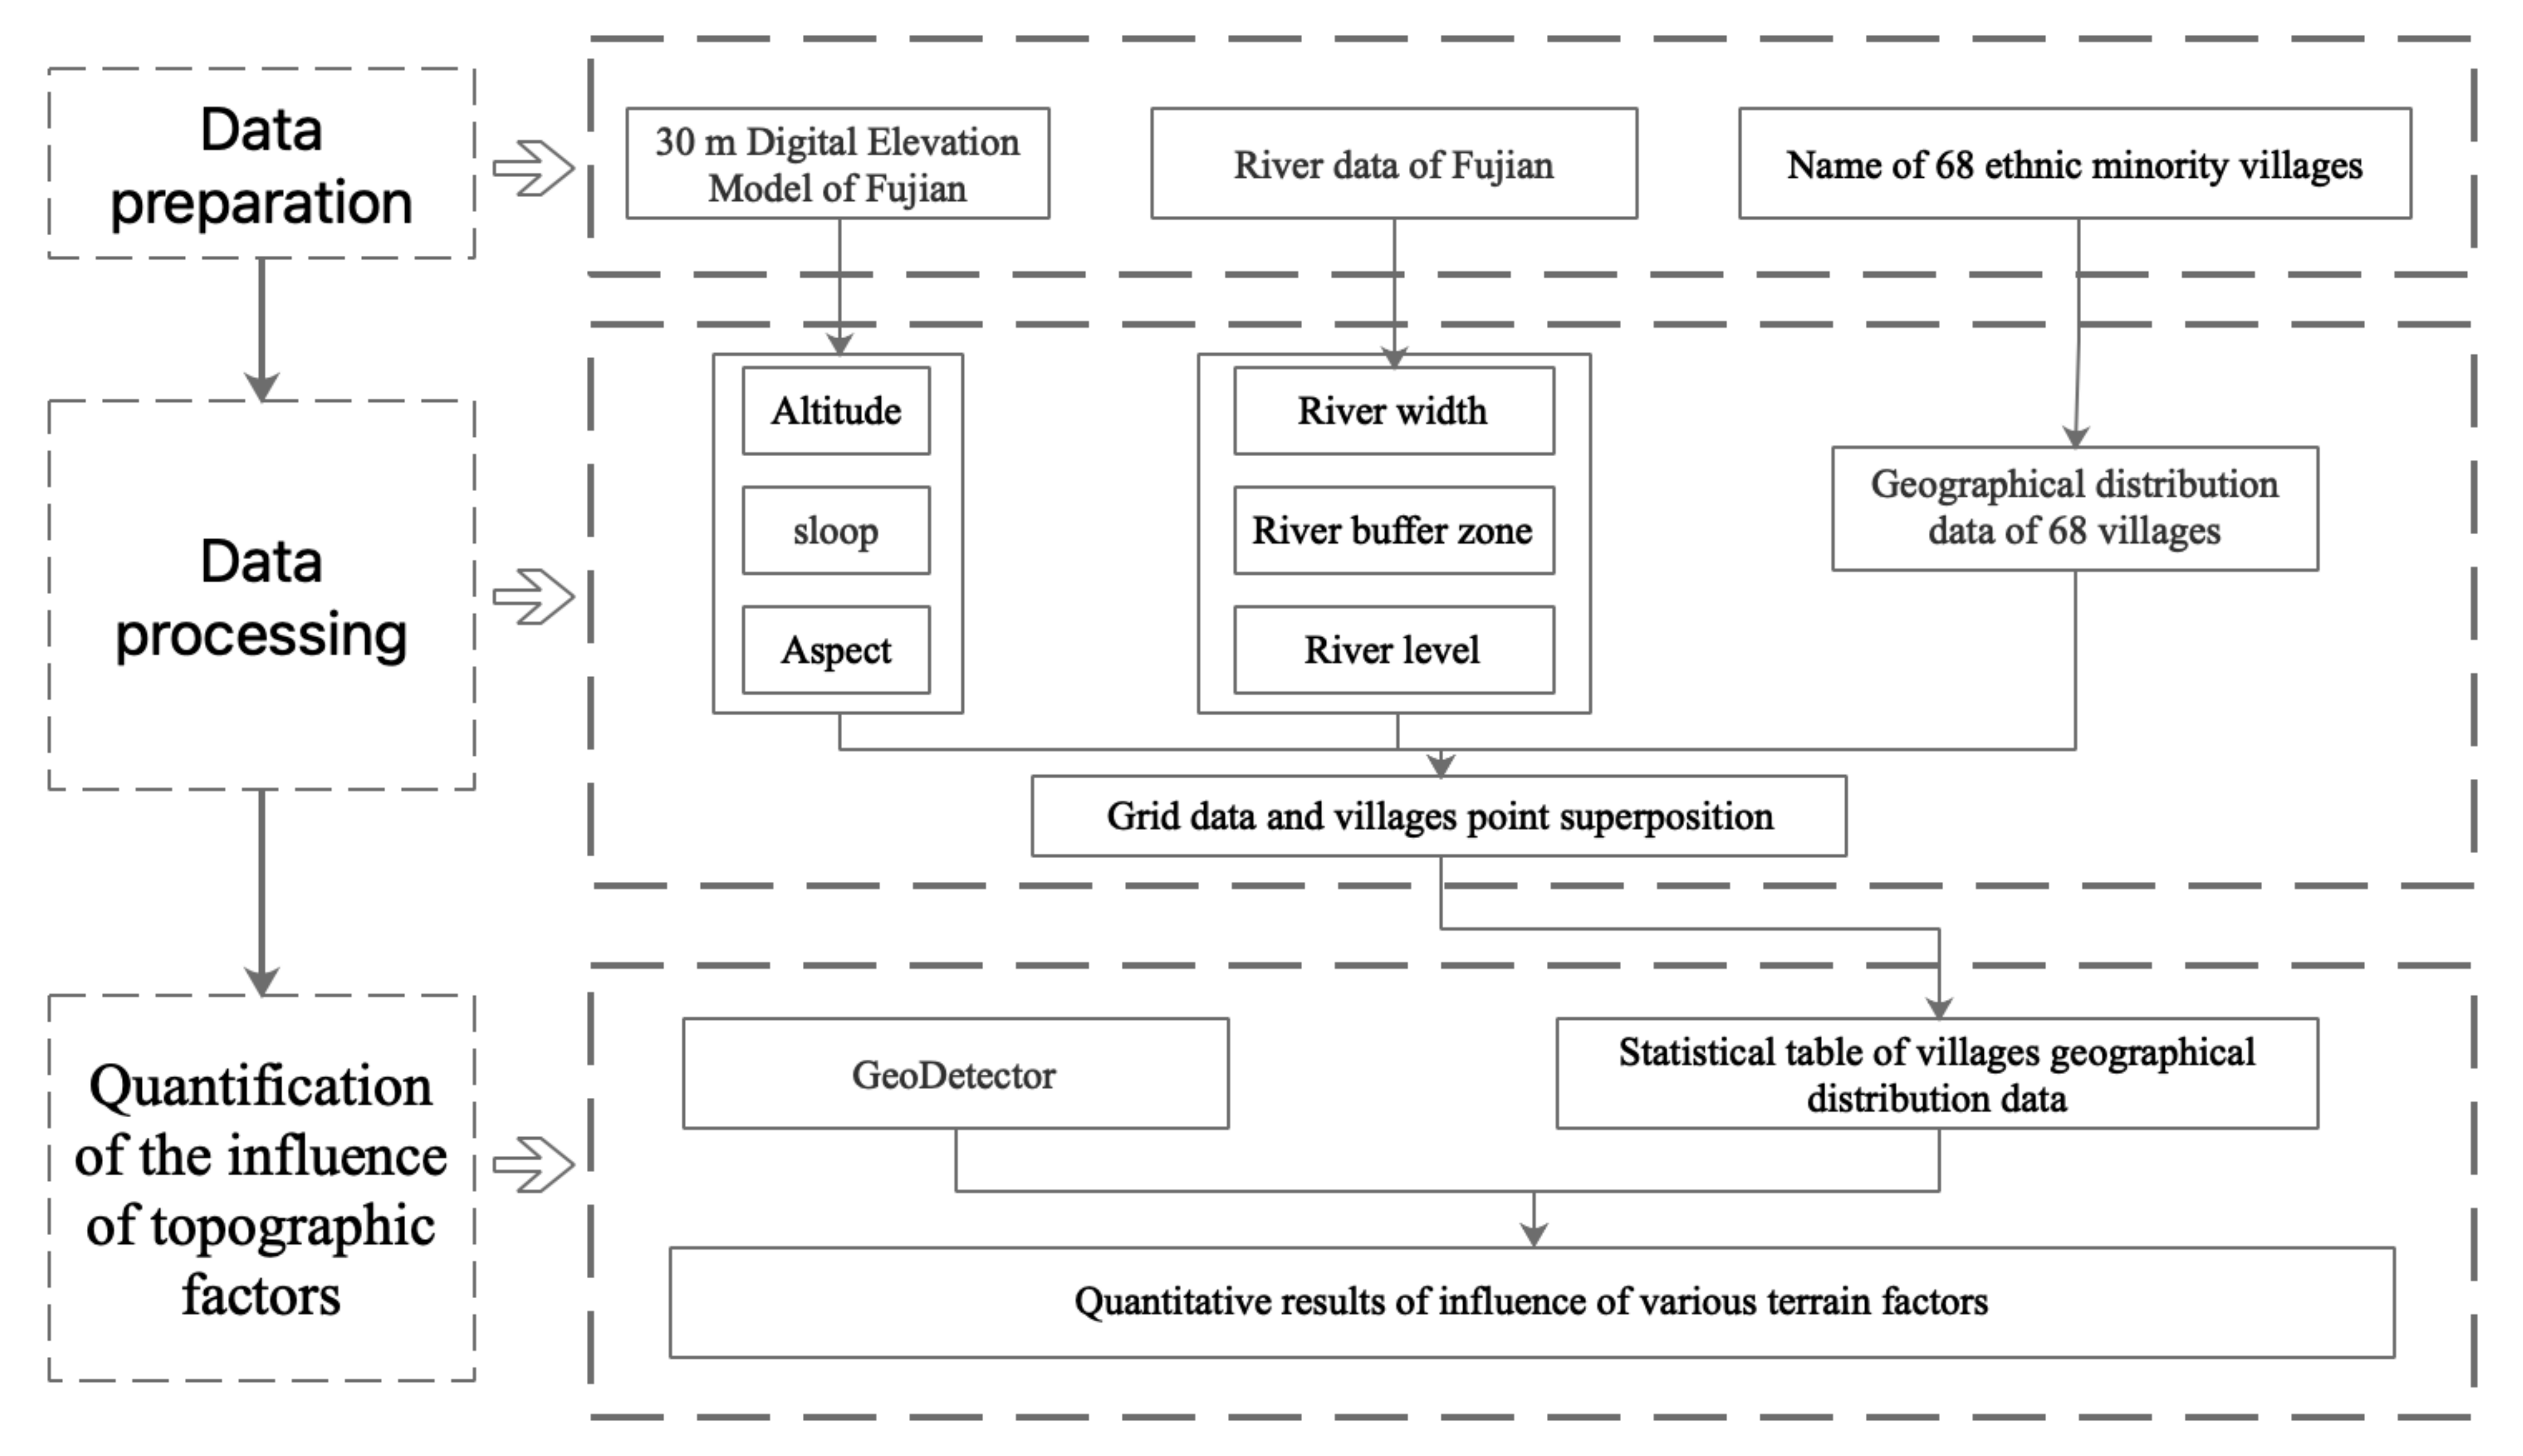
2.3. Research Framework

Taking 68 villages with Chinese minority characteristics in Fujian Province as the research object, this paper explores the geographical distribution characteristics of villages and their relationships with topographic factors and studies the differences between the influence of various topographic factors. Firstly, the 30 m dem data, river data, and ethnic-minority village data of Fujian Province were processed. Secondly, the geographic characteristics of village distribution were analysed using the average nearest-neighbour index, kernel density analysis, Voronoi diagram, and proximity analysis, and the raster map of each influence factor was overlaid with the geographic distribution points of villages. Thirdly, GeoDetector was used to reveal the relationship between the distribution of ethnic-minority villages and topographic factors in a quantitative way. The general framework of this study is shown in Figure 4.

3. Research Methodology

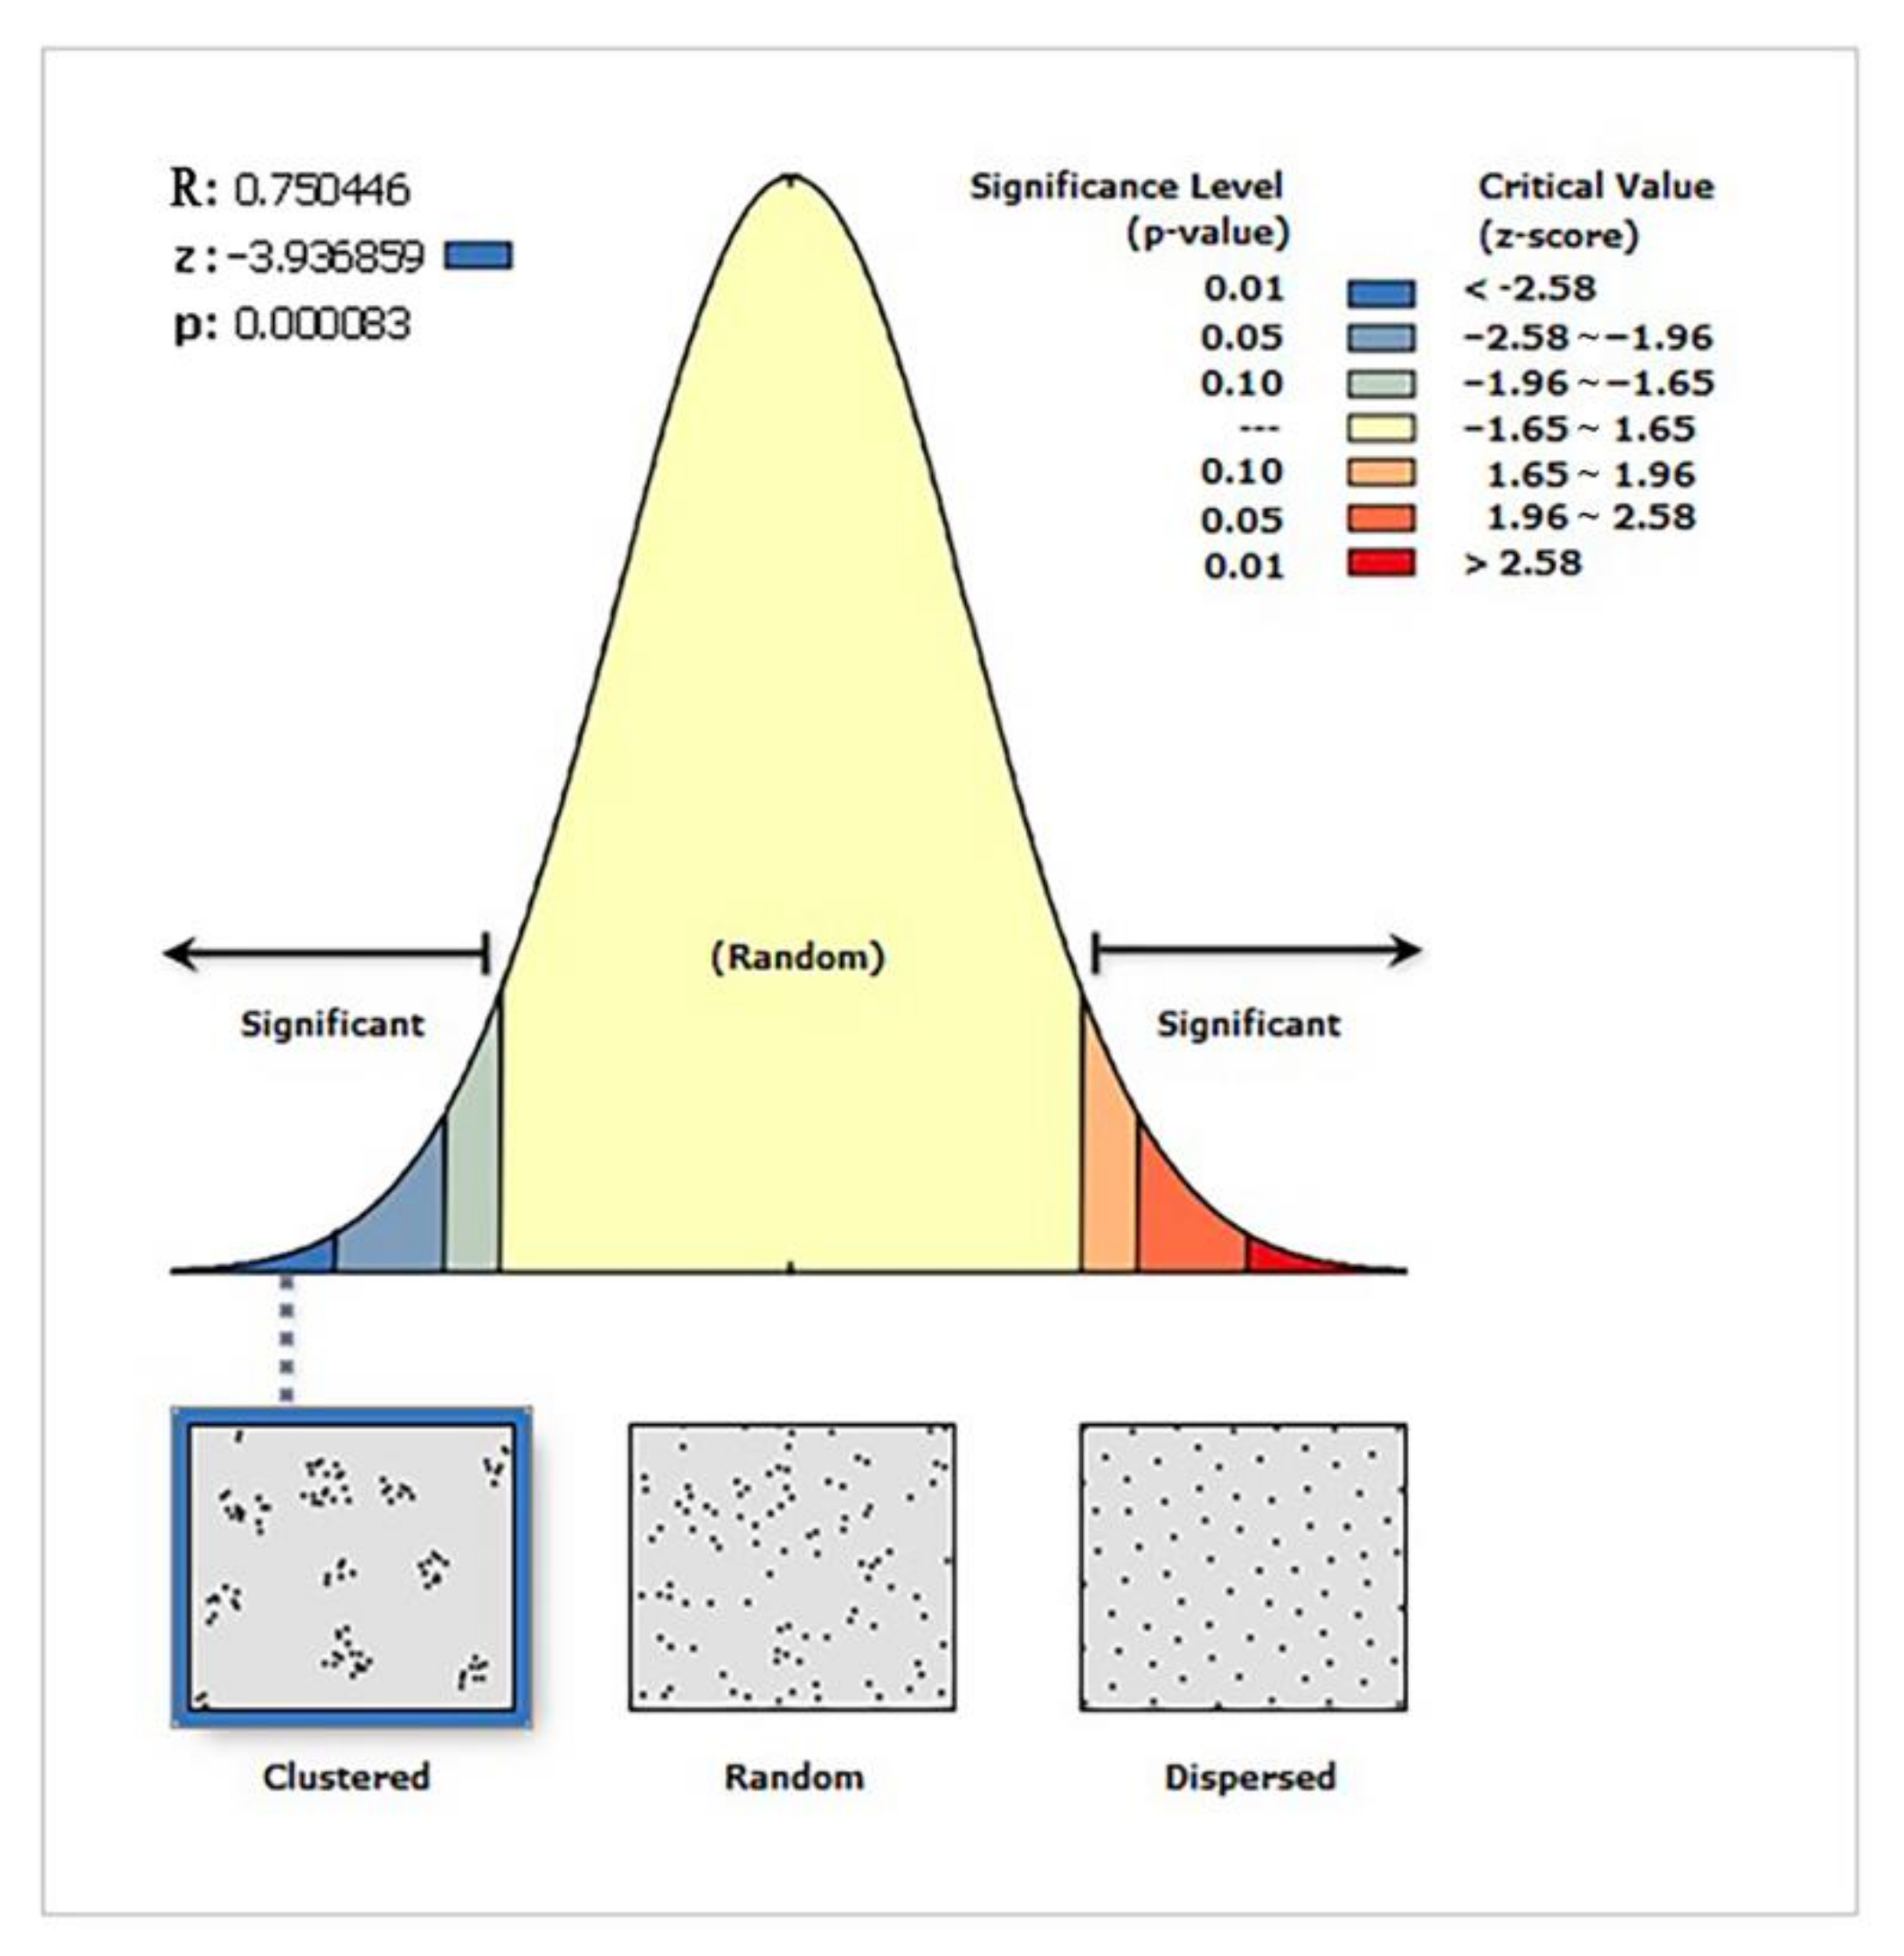
3.1. Average Nearest Neighbour Index

The average nearest neighbour index is a geographical metric used to describe the proximity of point objects in geographic space [29]. According to the proximity of point elements in space, the geographical distribution types of ethnic-minority villages in Fujian Province can be classified as uniform, random, or condensed. The nearest point index serves as the discrimination basis, and its formula is as follows:
R = r 1 r E = 2 D
r E = 1 2 n A
where R denotes the ratio between the actual and theoretical nearest distances, r 1 denotes the actual nearest distance, r E denotes the theoretical nearest distance, D denotes the point density, n denotes the total number of research objects, and A is the research area. When R = 1, it indicates that ethnic-minority villages are randomly scattered throughout space; when R > 1, ethnic-minority villages tend to be uniformly dispersed spatially; and when R < 1, ethnic-minority villages tend to cluster spatially.

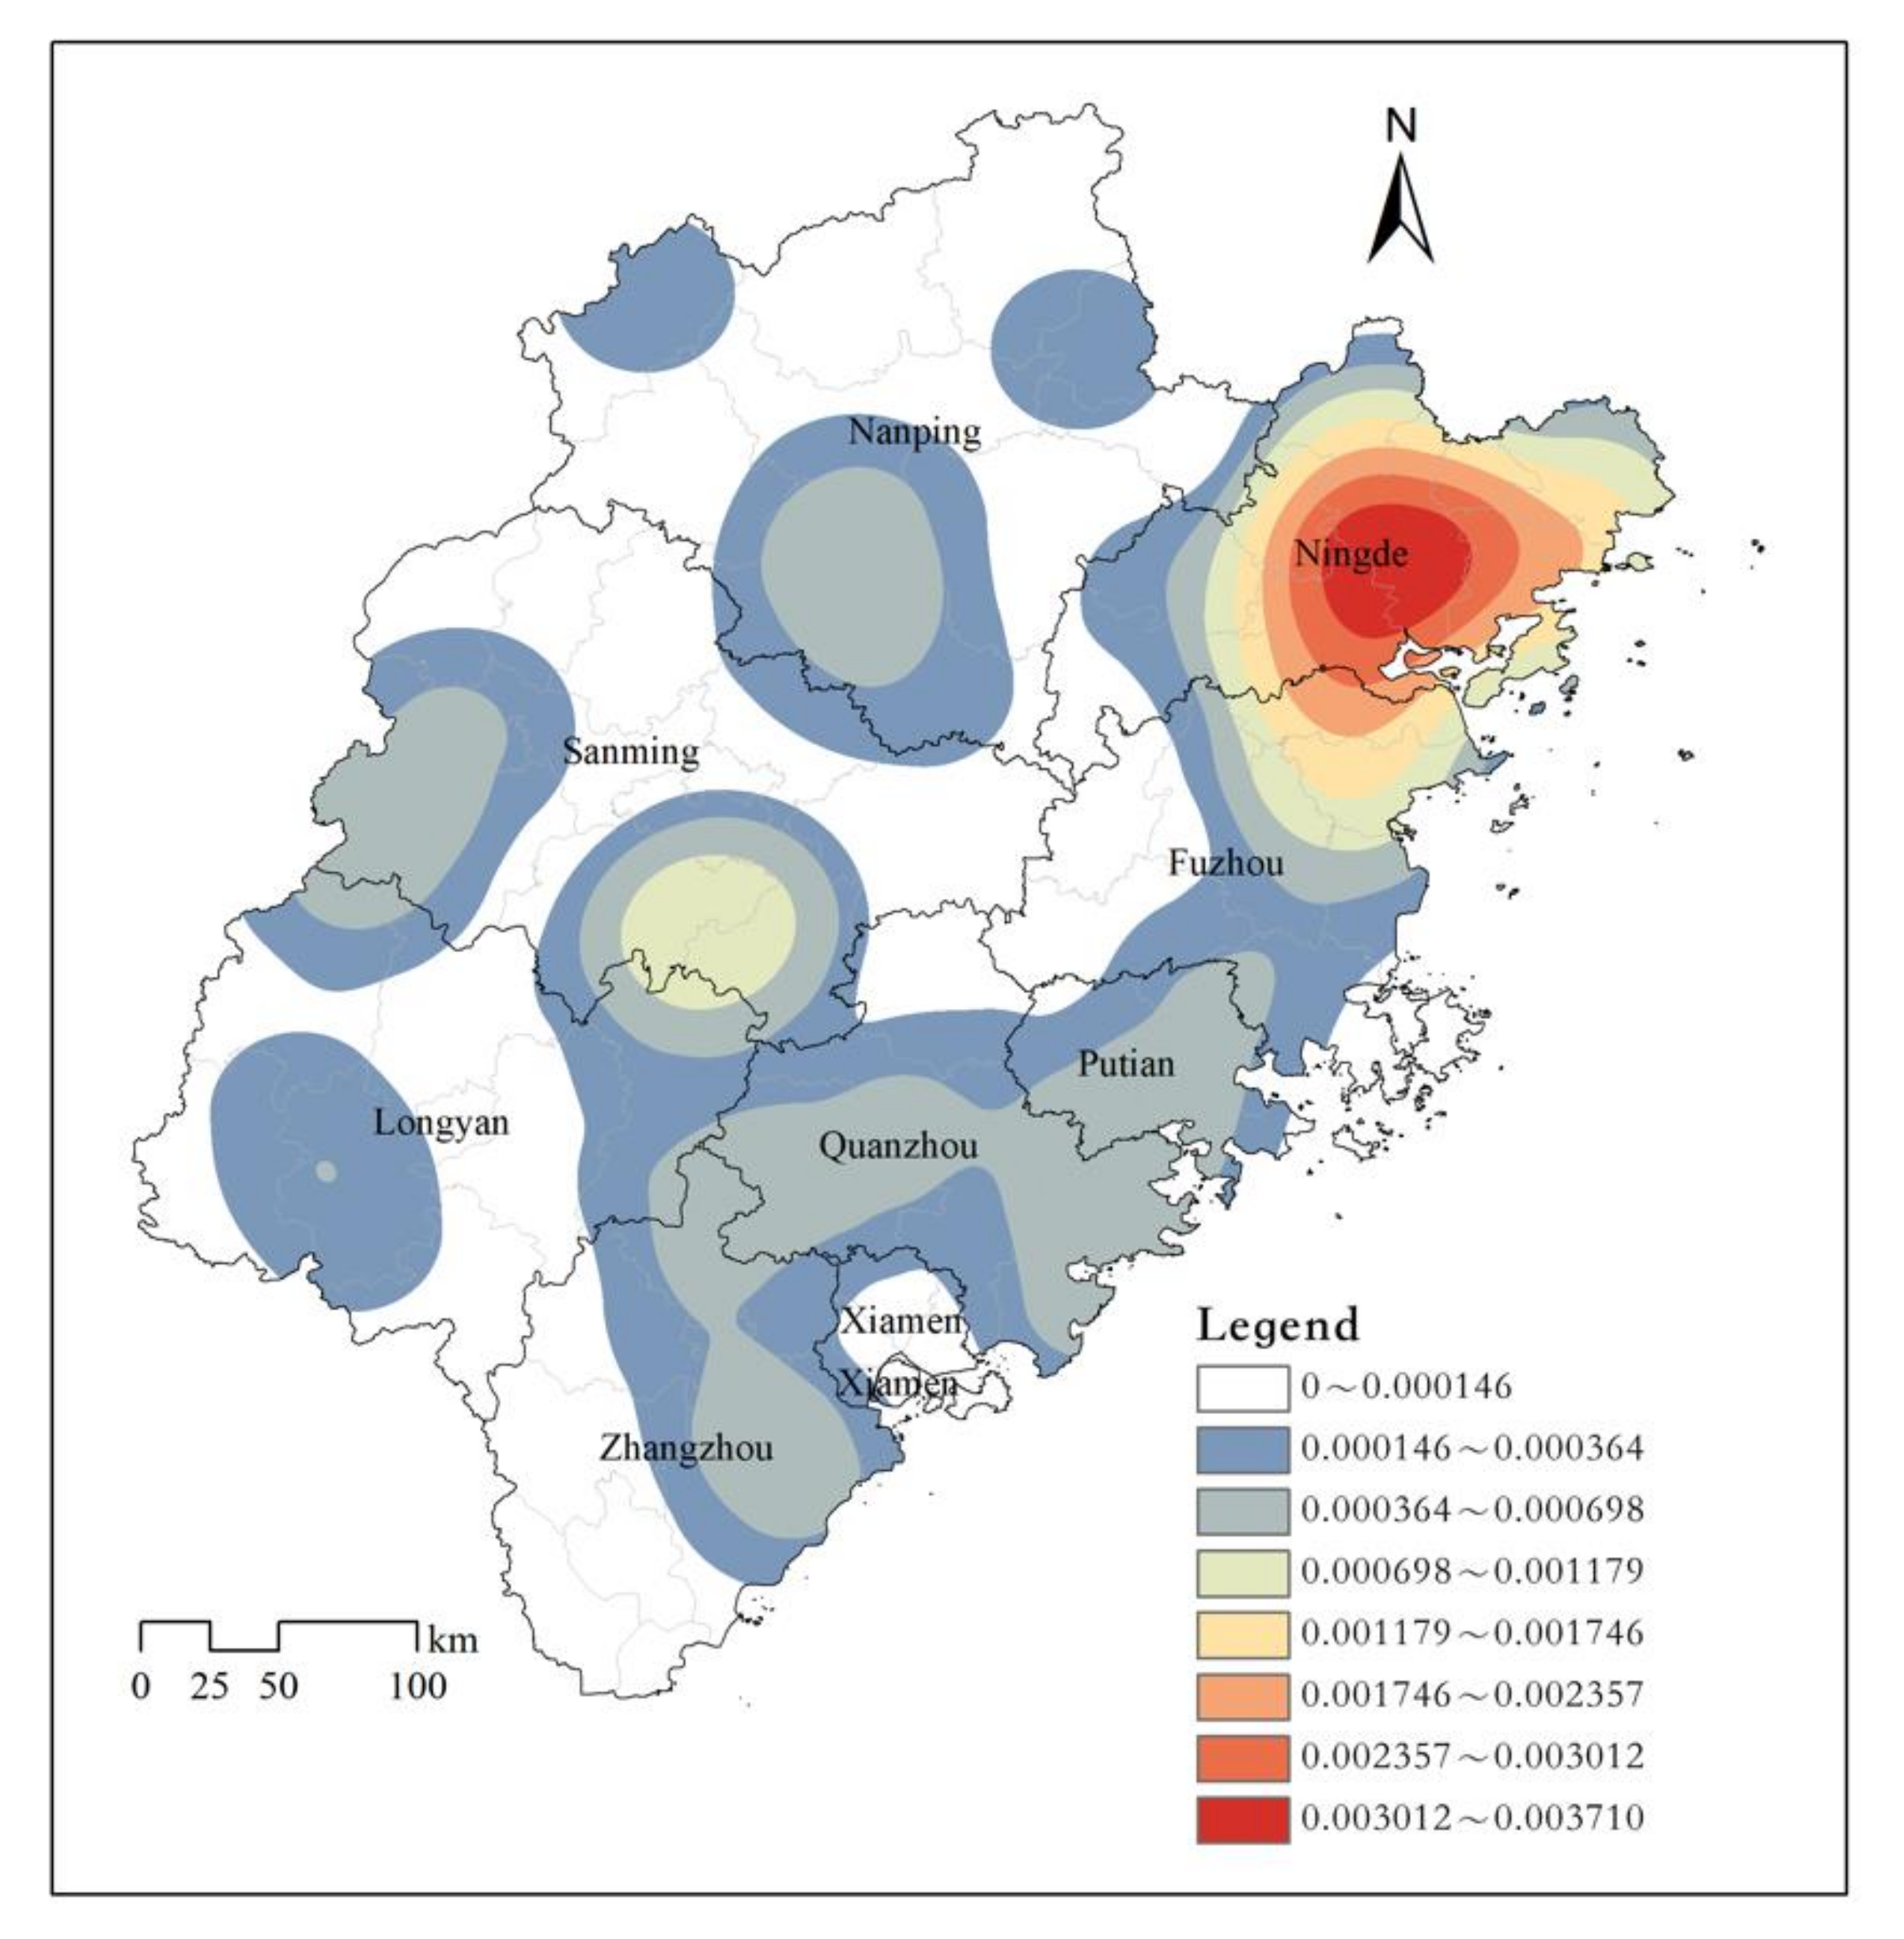
3.2. Kernel Density Analysis

Kernel density analysis is a nonparametric technique for estimating surface density. It estimates the density of spatial points using dynamic cells [49]. The spatial density distribution of ethnic-minority villages in Fujian Province is analysed using kernel density analysis. The kernel density estimate expression is as follows:
fh X = 1 n i = 1 n K h x x i = 1 n h i = 1 n k x x i h
where K () is the ethnic-minority village kernel density equation, X denotes the location of ethnic-minority villages, x i denotes the village with x as its centre, h denotes the search radius distance threshold (h > 0), and n denotes the total number of ethnic-minority villages within the threshold. Kernel density is directly proportional to ethnic-minority village density. The greater the kernel density, the more evenly distributed and concentrated the ethnic-minority villages are, and the stronger the geographical aggregation; the smaller the kernel density, the more sparsely distributed the ethnic-minority villages are and the weaker the spatial aggregation.

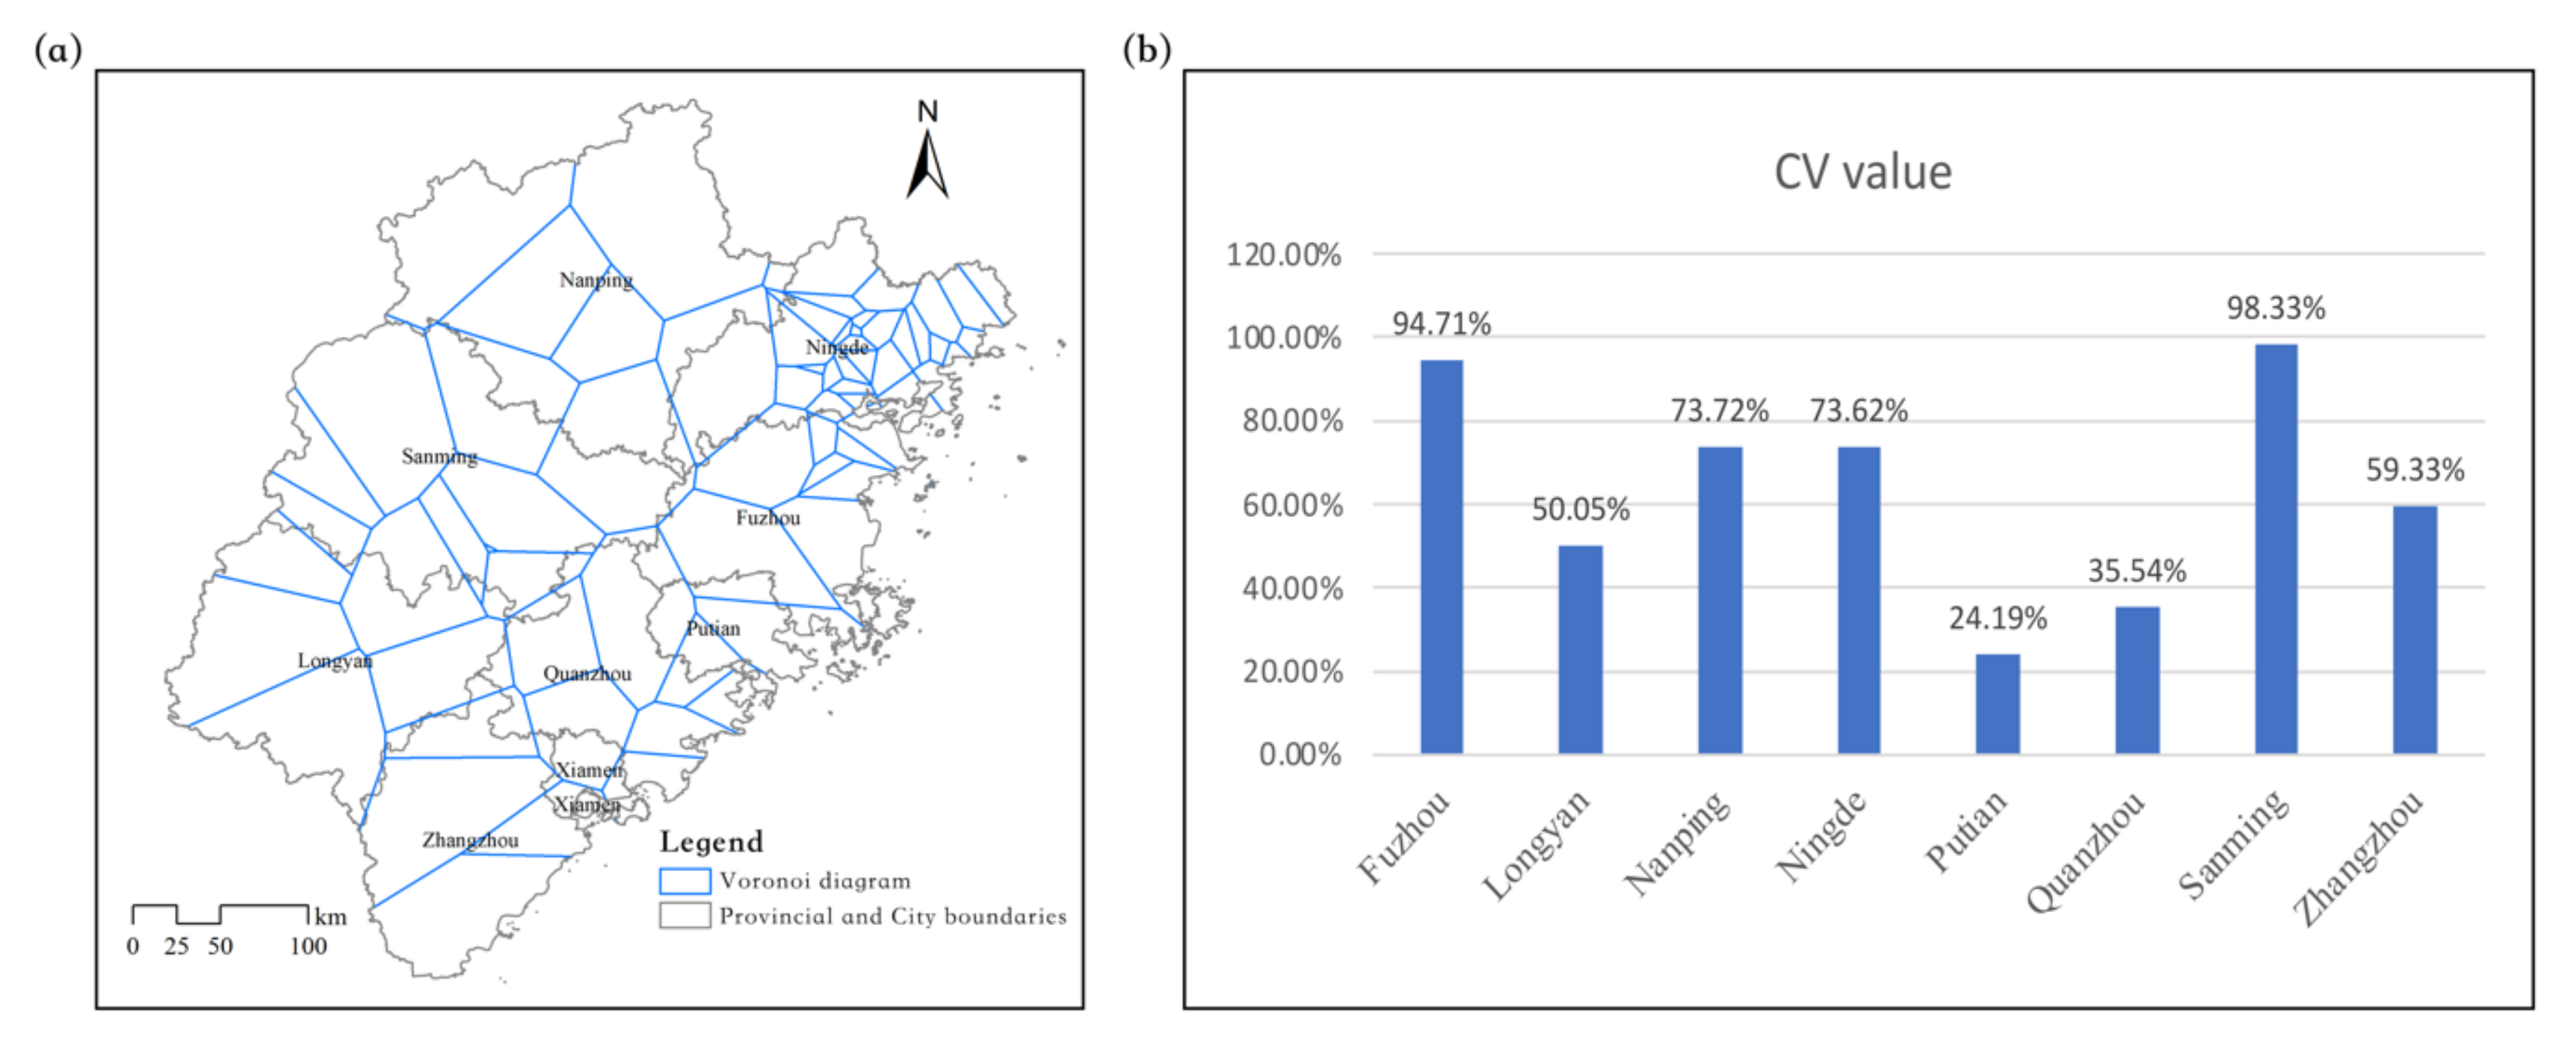
3.3. Voronoi Diagram

The Voronoi diagram is a continuous polygon made up of vertical bisectors that link two neighbouring point segments. The distance between any point in the polygon and the polygon’s control point is shorter than the distance between other polygon control points, and the polygon’s area varies according to the distribution of point elements [50]. Thus, in computational geometry, the Voronoi coefficient of variation (CV) value may be utilised to determine the distribution types of ethnic-minority villages in Fujian Province. The CV value of variation derived using the Voronoi diagram area is equal to the ratio of the Voronoi diagram area’s standard deviation to the average value, and its calculation formula is as follows:
CV = R S × 100 %
where R is the standard deviation of the Voronoi diagram area and S denotes the Voronoi diagram area’s average value. When ethnic-minority villages have a “uniform distribution”, the CV value is lower; when ethnic-minority villages have an “aggregate distribution”, the CV value is higher. Thomas Duyckaerts proposed using the CV value to determine the distribution type of point elements. When CV equals 57% (encompassing 33–64%), point elements are dispersed randomly; when the CV is more than 92% (including > 64%), the point elements are clustered; and when CV equals 29% (including 33%), the point elements are divided evenly.

3.4. Proximity Analysis

Proximity analysis is used to determine the proximity between multiple- or two-element classes, including several methods to determine proximity such as buffer zone analysis and distance calculation. The study used buffer zone analysis in the proximity analysis method to analyse river data in Fujian Province, generate a raster map, and then overlay it with the geographical distribution points of minority villages to investigate the relationship between minority villages and river factors.

3.5. GeoDetector

GeoDetector is a group of statistical methods used to detect spatial differentiation and reveal the driving force behind it. Its core idea assumes that if an independent variable has an important influence on a dependent variable, the geographical distribution of the independent variable and the dependent variable should be similar. Factor detectors are used to quantify the influence of factors, and interaction detectors are used to add the product term of two factors to a regression model to test its statistical significance [51]. GeoDetector is used in this study to analyse the factors affecting the spatial heterogeneity of ethnic-minority villages in Fujian Province, to identify the causes of spatial differentiation caused by topographic features, and to reveal the relationship between the distribution of ethnic-minority villages and topographic factors using statistical methods. For measuring purposes, the q value is employed. The algorithm is as follows:
q = 1 h = 1 L N h σ h 2 N σ 2 = 1 S S W S S T
where h = 1, 2, …, L denotes the classification or zoning of variable Y or detecting factor. σ 2 and σ h 2 denote the variance of the Y value for the entire region and layer h, respectively; N and N h denote the total number of units in the entire region and layer h, respectively; SST denotes the total sum of squares; SSW denotes the sum of squares; and q denotes the value range [0, 1]. The greater the q value, the stronger the effect of detecting variables on the geographical distribution of ethnic-minority villages; conversely, the smaller the q value, the weaker the effect.

4. Results

4.1. Geographical Distribution Characteristics of Ethnic-Minority Villages

4.1.1. Overall Geographical Distribution Characteristics

The average nearest neighbour tool, Arcmap 10.8 software, was used to analyse the geographical distribution of minority villages in Fujian Province, and the nearest neighbour index R ≈ 0.75 < 1 was obtained. The index results indicate that the geographical distribution of ethnic-minority villages in Fujian Province is condensed (Figure 5), and Z < 0, suggesting that the probability of this study result being generated randomly is less than 1%. This suggests that the mountainous and hilly topography of Fujian has contributed to the clustering distribution of villages.

4.1.2. Geographical Distribution Density

The kernel density analysis tool in Arcmap 10.8 software was used to analyse the geographical distribution of ethnic-minority villages in Fujian province. The results indicate that the features of “single-core independence” are statistically significant, and the geographical distribution characteristics demonstrate the coexistence of statistically significant agglomeration and considerable dispersion (Figure 6). With the geographical centre of Ningde City as the core, there is one core density area of Ningde City—Jiaocheng District—Fuan City—Xipu County. Under the driving radiation of the core density area, the sub-density area disperses and is primarily spread in Luoyuan County, Lianjiang County, and Jin’an District of Fuzhou; the east of Gutian County of Ningde City; and the southeast of Zhou’an County. In addition, a subtense area emerged along the boundary between Datian County of Sanming City and Yong’an City. Low-density areas include Guangze County, Songxi County, and Shunchang County of Nanping City; Shanghang County, Wuping County, and Changting County of Longyan City; Ninggao County of Sanming City; Hui’an County, Fengze District, and Luojiang District of Quanzhou; Chengxiang District of Putian City, Longhai City, and Zhangpu County of Zhangzhou; and others.
The formation of the core density area in the regional centre of Ningde is attributable to the large area of mountainous and hilly terrain in Ningde, which provides better conditions for the formation of ethnic-minority villages living and farming on mountainous and hilly terrain and avoiding important waterways in Fujian.

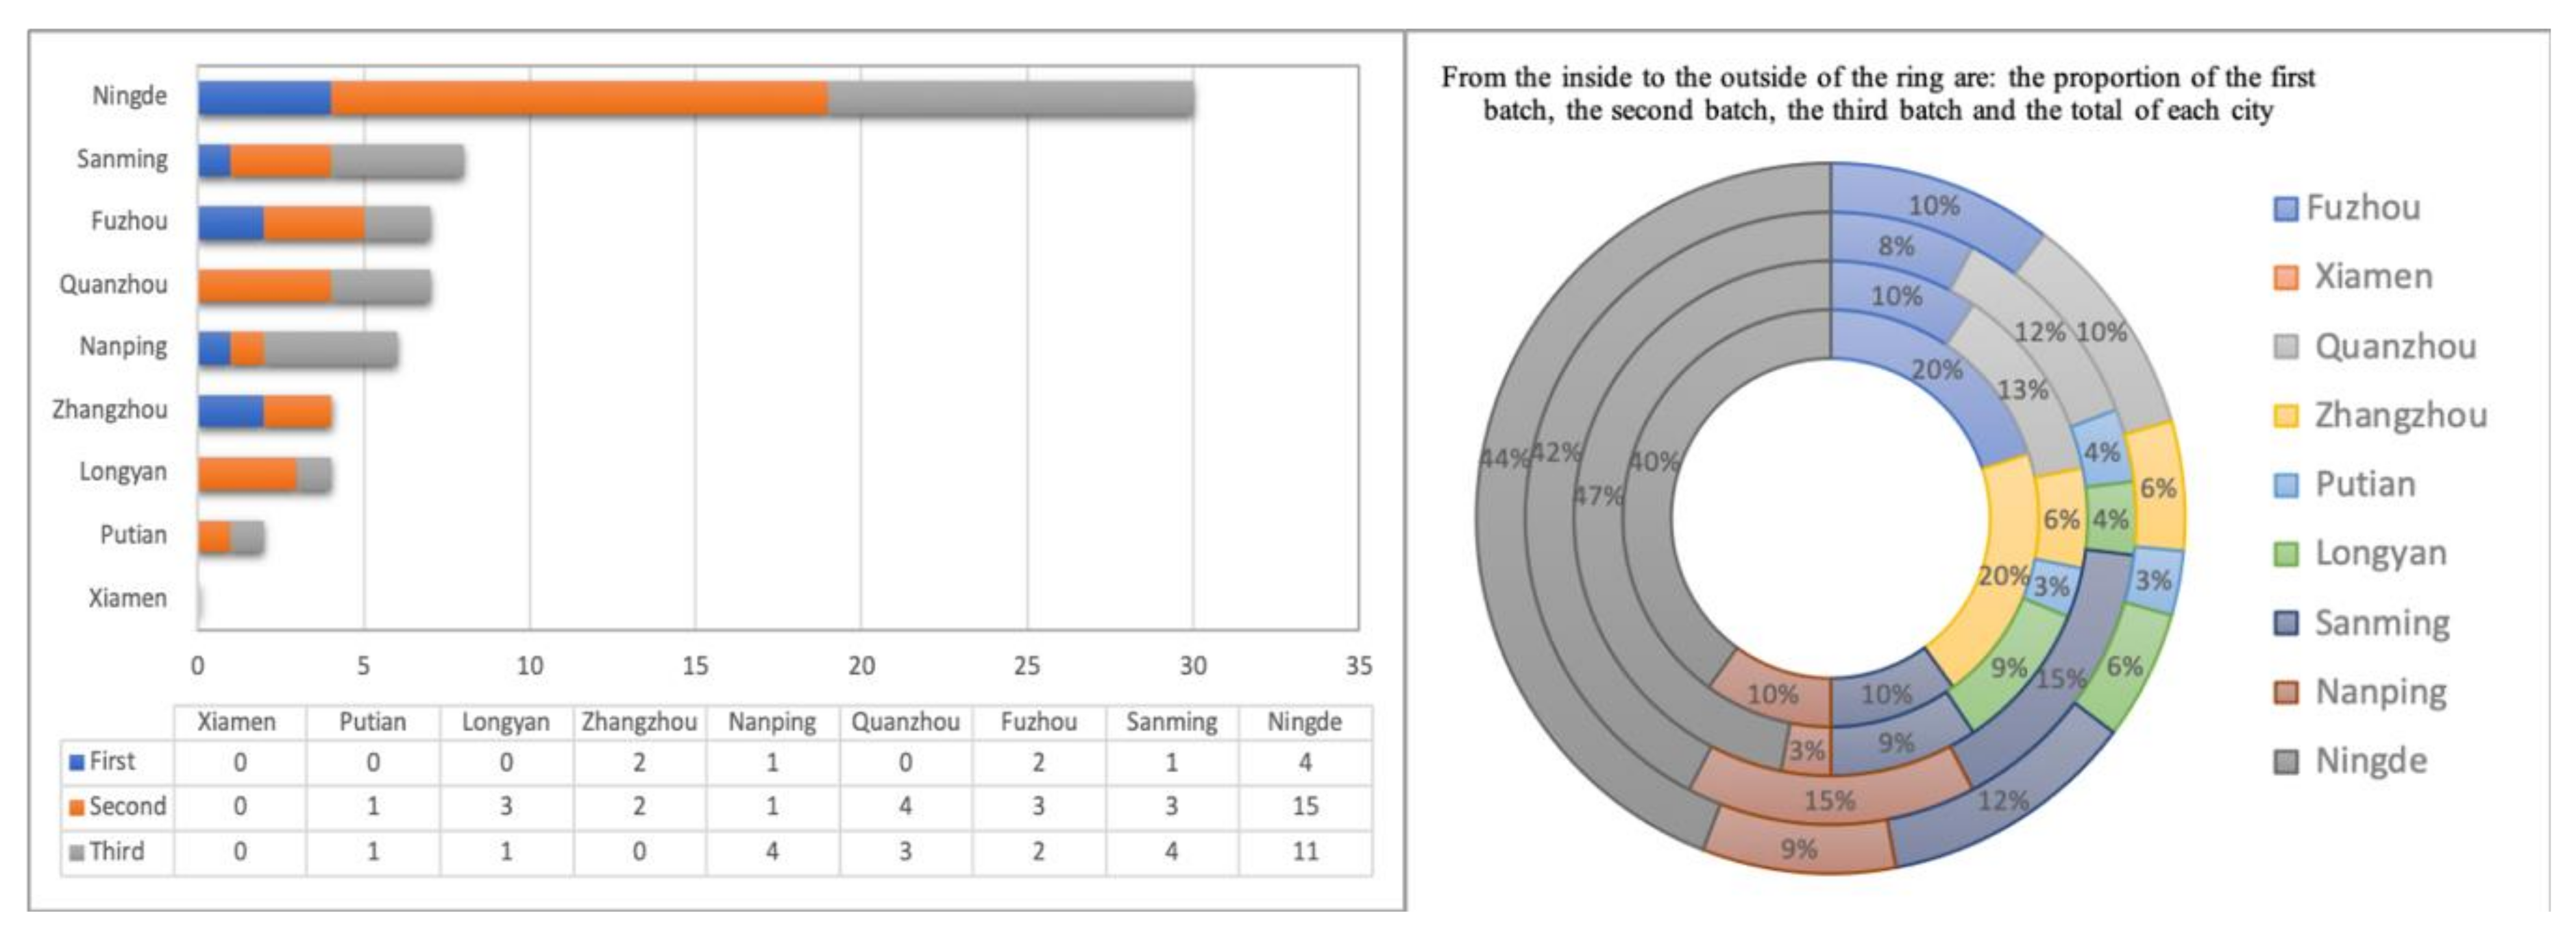
4.1.3. Regional Distribution Difference

To demonstrate the relationship between village distribution and topography in regions with varying population densities, the geographical distribution characteristics of ethnic-minority villages in various regions were investigated using the Voronoi method. According to the Voronoi diagram (Figure 7a), the patches in mountainous Ningde, Fujian, are more closely packed, and the patches in the minority villages in the remaining cities are evenly distributed and of similar size. Then, the CV value of localities inhabited by ethnic minorities in each city is calculated (Formula (4); Figure 7b). Sanming City has the highest CV value, at 98.33%, while Putian City has the lowest CV value, at 24.19%. According to Duyckaerts’ classification standard, Ningde City in the core density area, Sanming City in the sub-density area, Nanping City, and Fuzhou City in the low-density area all belong to the agglomeration distribution type. This indicates that regardless of whether the distribution density is high or low, it will produce the effect of agglomeration distribution under the constraint of terrain; in Putian, Zhangzhou, Quanzhou, and Longyan, consequently, there is a nonlinear relationship between distribution density and geographical distribution type, and the underlying cause of this relationship is the effect of topographic features on the location of early villages.

4.2. Relationship between the Geographical Distribution of Ethnic-Minority Villages and Topographic Factors

The geographical distribution points of minority villages in Fujian Province were superimposed with the raster maps of each topographic factor, the distribution of village distribution points under the conditions of individual topographic factors were counted, and the results helped to understand why the same distribution types formed between areas with different distribution densities and the recessive law between topographic factors and geographical distribution.

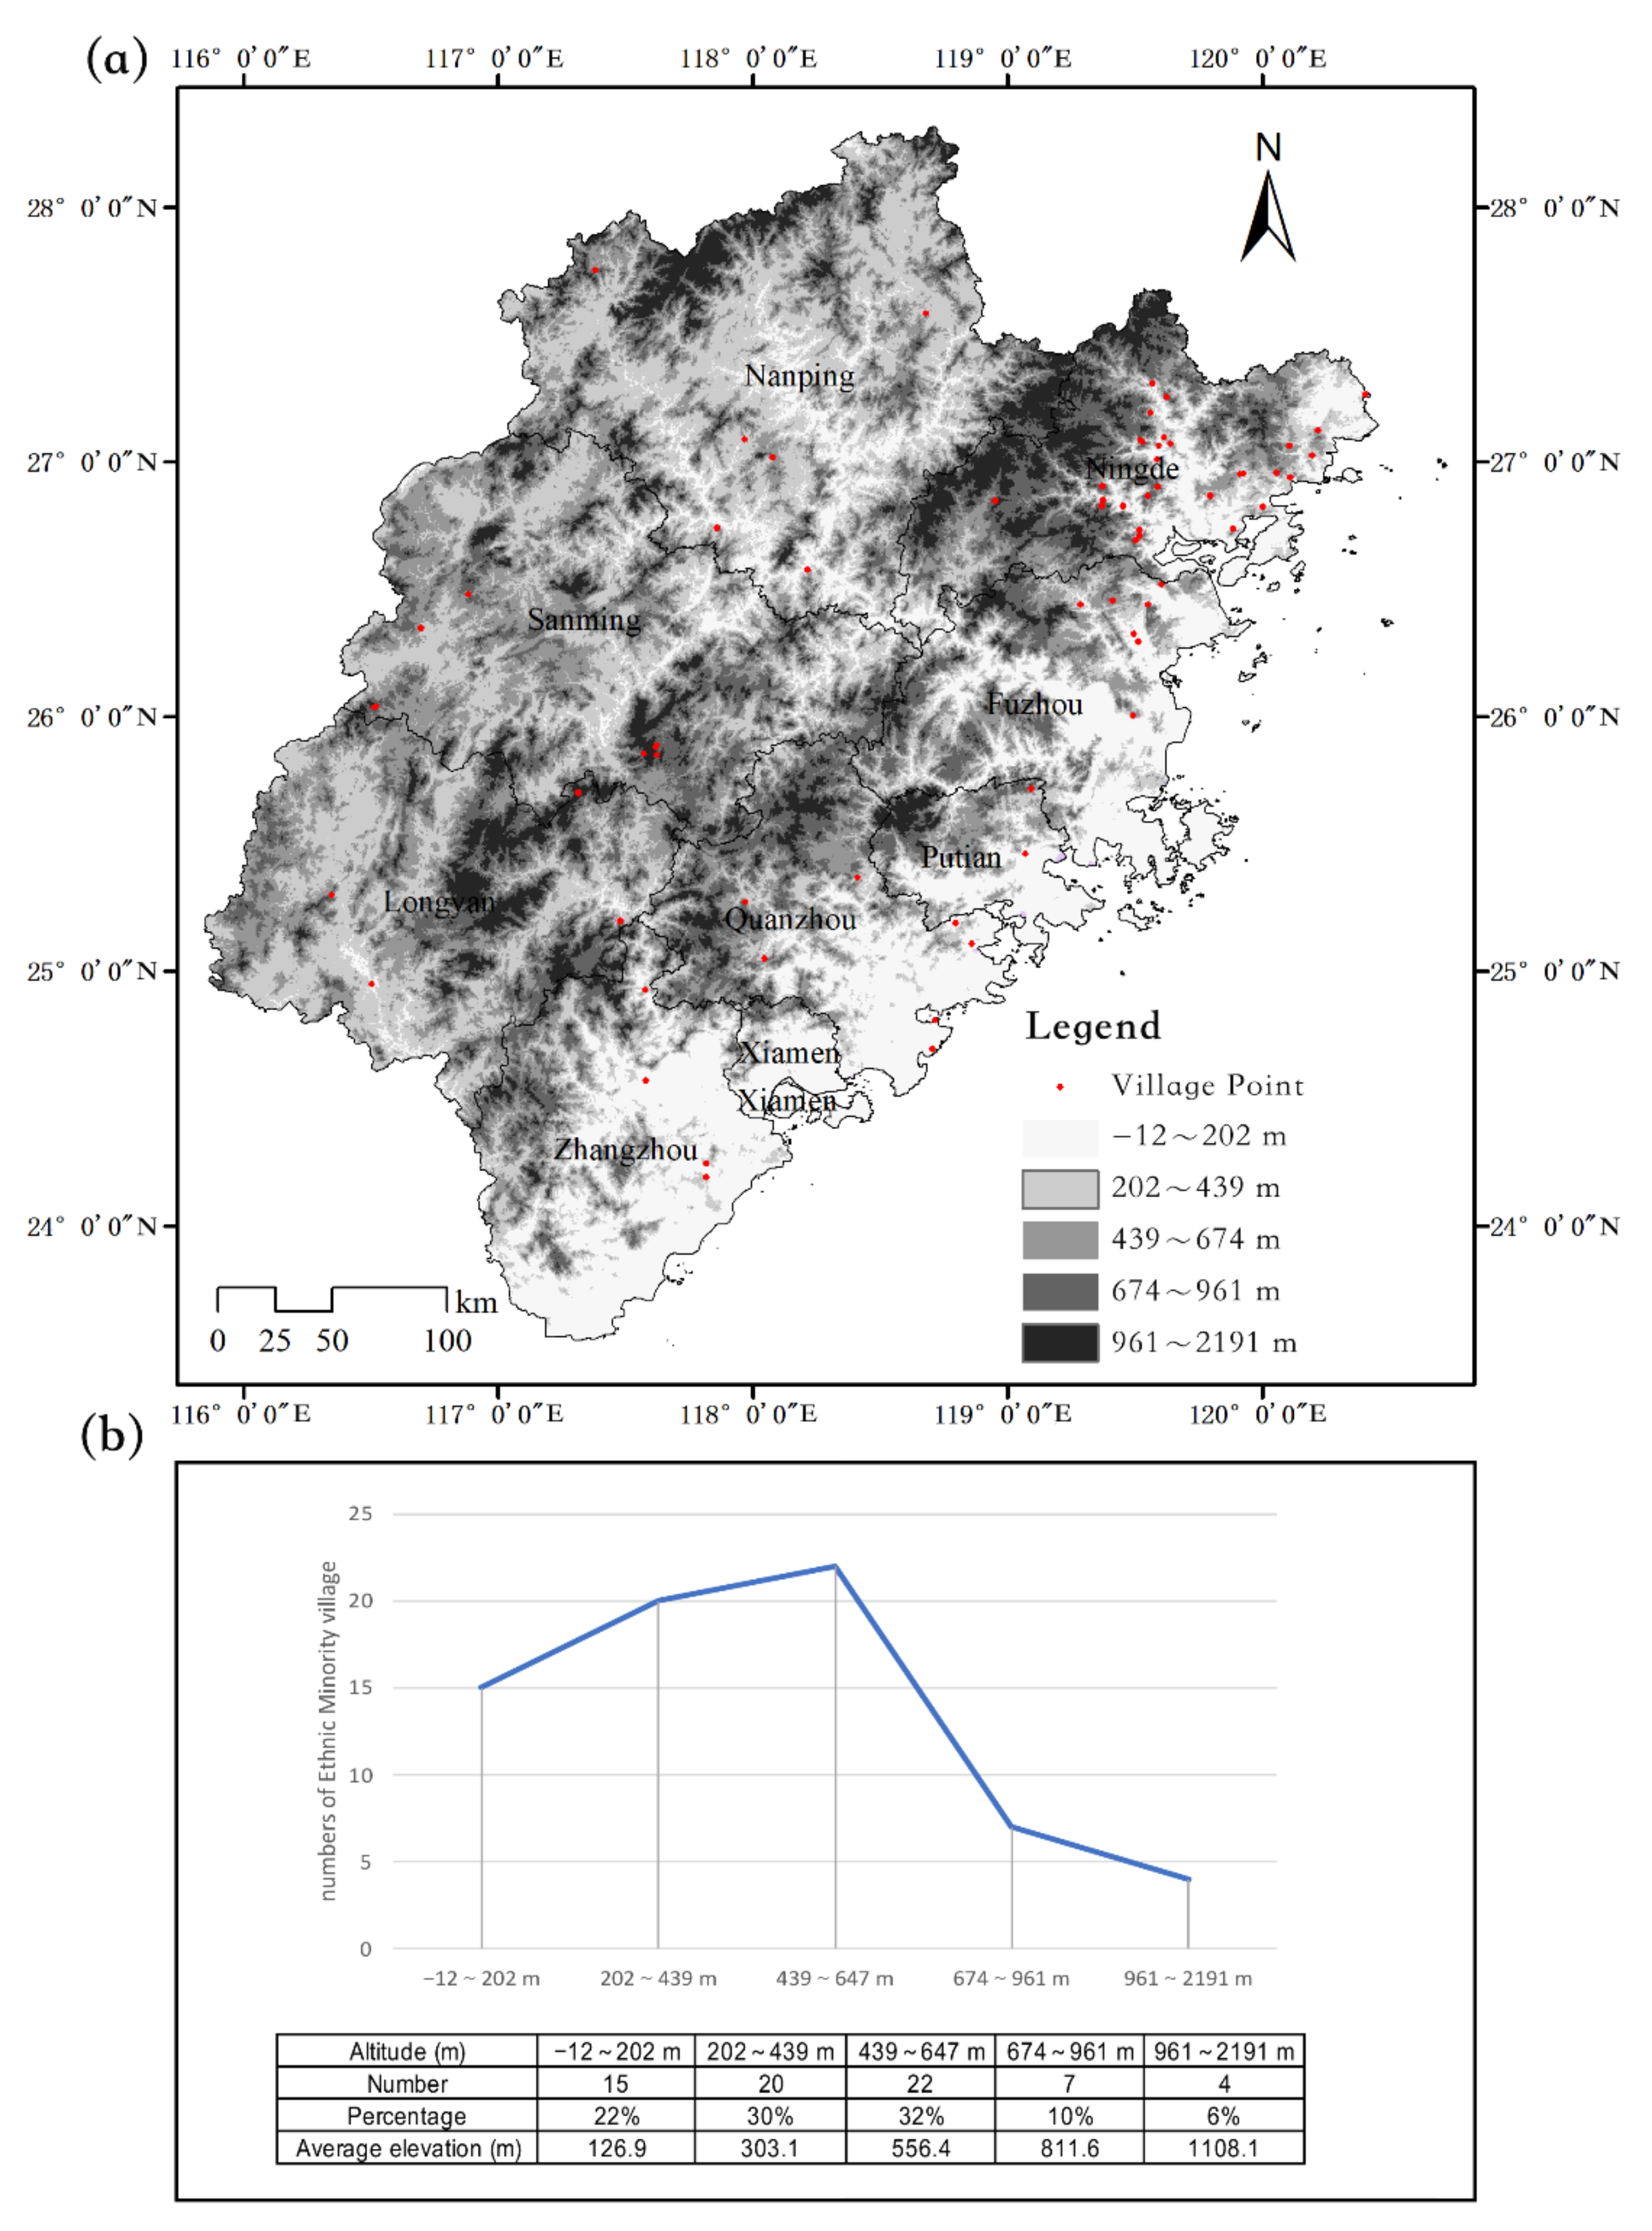
4.2.1. Relationship between Geographical Distribution and Altitude of Ethnic-Minority Villages

The elevation data for Fujian Province (30 m digital elevation model) were divided into five elevation intervals using the Natural Breaks method: −12~202 m, 202~439 m, 439~647 m, 647~961 m, and 961~2191 m. They were then superimposed with the geographical distribution points of ethnic-minority villages (Figure 8a). The distribution features of minority villages in Fujian Province show more distribution at low altitude and less distribution at high altitude, and the number of villages is negatively correlated with altitude. The distribution of minority villages is closely related to mountains and hills. The most densely distributed area is near Vulture Peak and Taimu Mountain in Ningde, with a roughly encircling pattern, while Tortoiseshell Mountain and the vicinity of Bopping Ridge show similar characteristics, and the rest are mainly distributed near Dayun Mountain and Wuyi Mountain.
According to the statistical division of the elevation data of ethnic-minority villages (Figure 8b), it was found that 62% of the villages were distributed in the 202~647 m elevation range. When the altitude exceeds 647 m, the number of villages decreases sharply; for example, 10% of the villages are distributed in the range of 647~961 m, and 6% of the villages are distributed in the range of 961~2191 m. In addition, 22% of the villages are in the range of elevation of −12~202 m, but their average altitude is 126.9 m. Therefore, the middle and lower part of mountains and hills is the optimal altitude for the location of minority villages in Fujian.

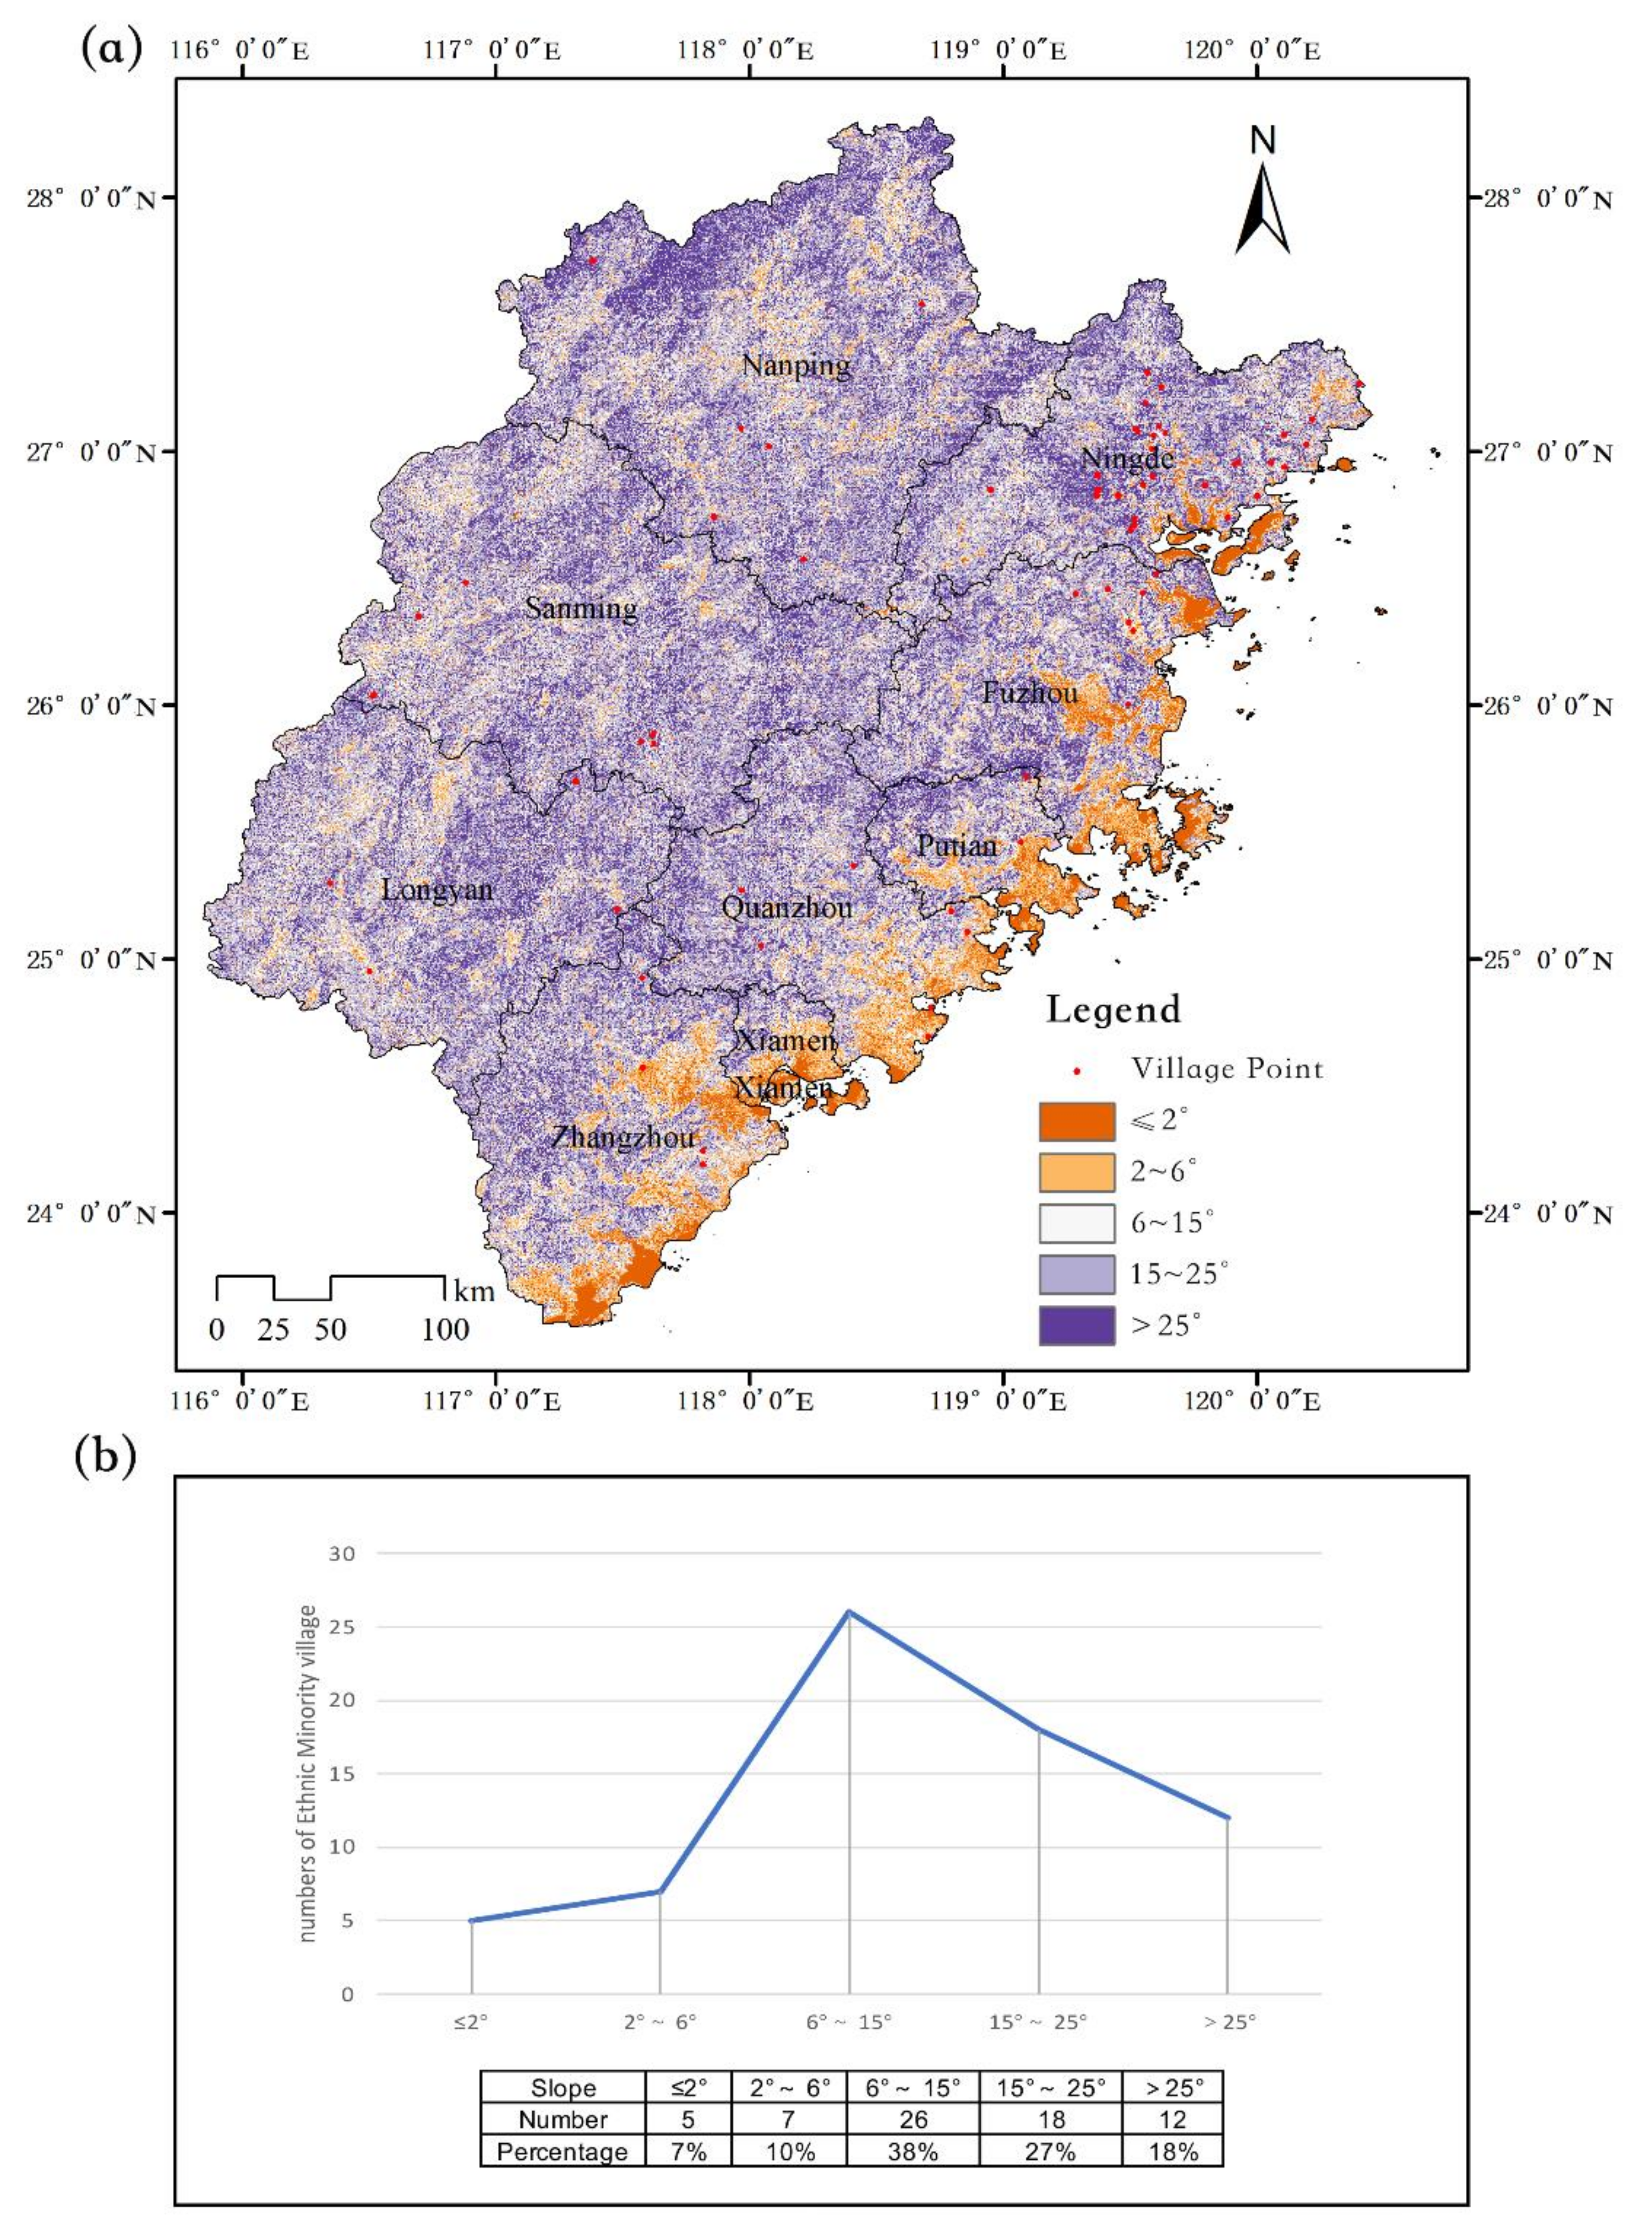
4.2.2. Relationship between Geographical Distribution and the Slope of Ethnic-Minority Villages

The 3D analysis tool in ArcMap10.8 software was used to extract the slope data of Fujian Province from the 30 m DEM and then superimpose it with the geographical distribution points of the minority villages. According to the slope grade requirement of cultivated land, the topography of Fujian is classified into five slope grades (including upper and excluding lower) ≤2°, 2°~6°, 6°~15°, 15°~25°, and >25°. From the superposition of geographical distribution of minority villages and slopes (Figure 9a), we can find the number of villages below the 15° slope zone, which is most suitable for agricultural production and residence, accounts for the largest number, 55%, of which 38% are distributed in the 6°~15° slope zone and 7% in the flat area (Figure 9b), indicating that the excellent farming and residence conditions brought about by good natural slope still play a leading role in the selection of village sites. However, 45% of the minority villages are still located in slope zones higher than 15°, which is not much different from the number of villages below 15°. This is because the shē ethnic, which has the largest number of minority villages, prefers to cultivate mountainous areas and grow tea, and the new farming method makes Fujian minority villages different from those in the plains in terms of the slope factor.

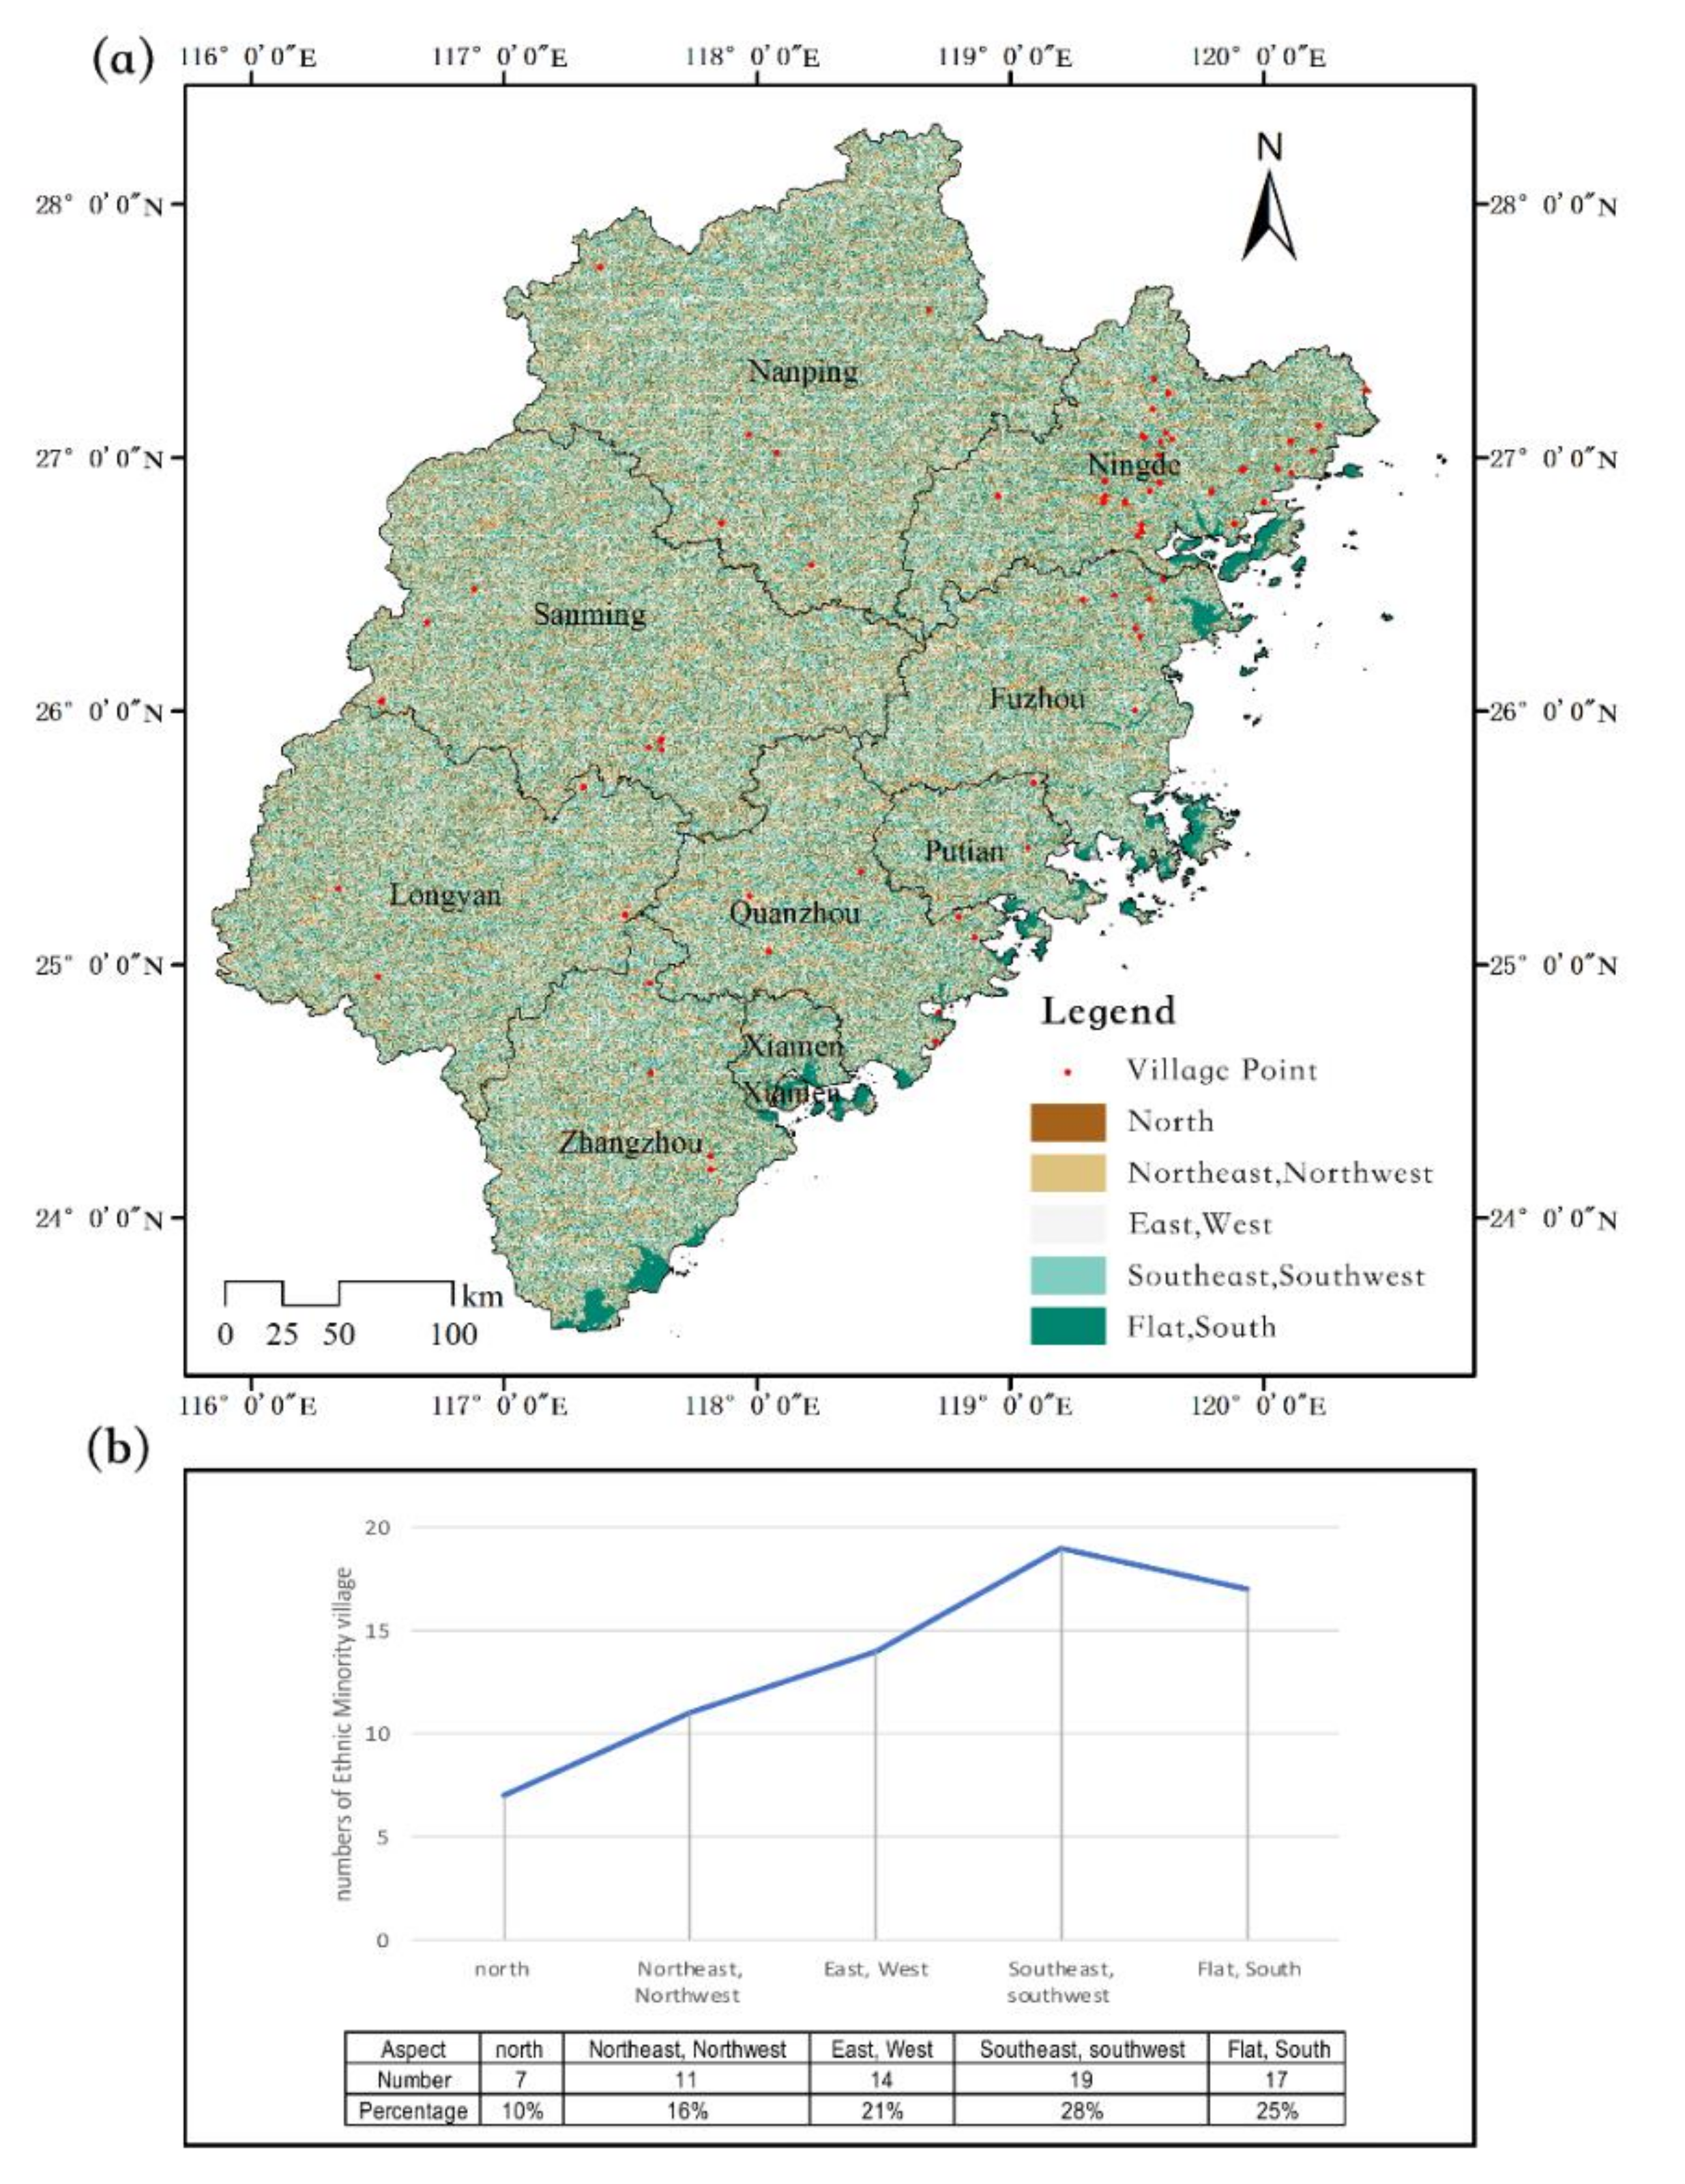
4.2.3. Relationship between Geographical Distribution and Aspect of Ethnic-Minority Villages

Both traditional Chinese settlement theory and Feng Shui favour dwelling in the south [52]. This is because this aspect has a direct effect on the number of hours of sunlight and the intensity of solar radiation, which has a significant effect on the distribution of villages. The 3D analysis tool in ArcMap10.8 software was used to extract the slope data of Fujian Province from 30 mDEM and then superimposed it with the geographical distribution points of minority villages. This includes the north aspect, northeast aspect, northwest aspect (22.5°~67.5°, 292.5°~337.5°), east aspect, west aspect (67.5°~112.5°, 247.5°~292.5°), southeast aspect, southwest aspect (112.5°~157.5°, 202.5°~247.5°), flat land, south aspect (−1°, 157.5°~202.5°), and north aspect (337.5°~360°, 0~25°) (Figure 8a).
From the analysis results (Figure 10a), the number of villages with slope distribution that receive direct southward light (southeast aspect—southwest aspect and flat—south aspect) is the largest, accounting for 53%. If we include the east and west aspects that receive indirect southward light, the number of villages receiving southward light will reach 74% (Figure 10b). This indicates that ethnic-minority villages are favourably distributed on aspects that can receive southward light, and the optimal aspect is the flatland-south aspect (−1°, 157.5°~202.5°).

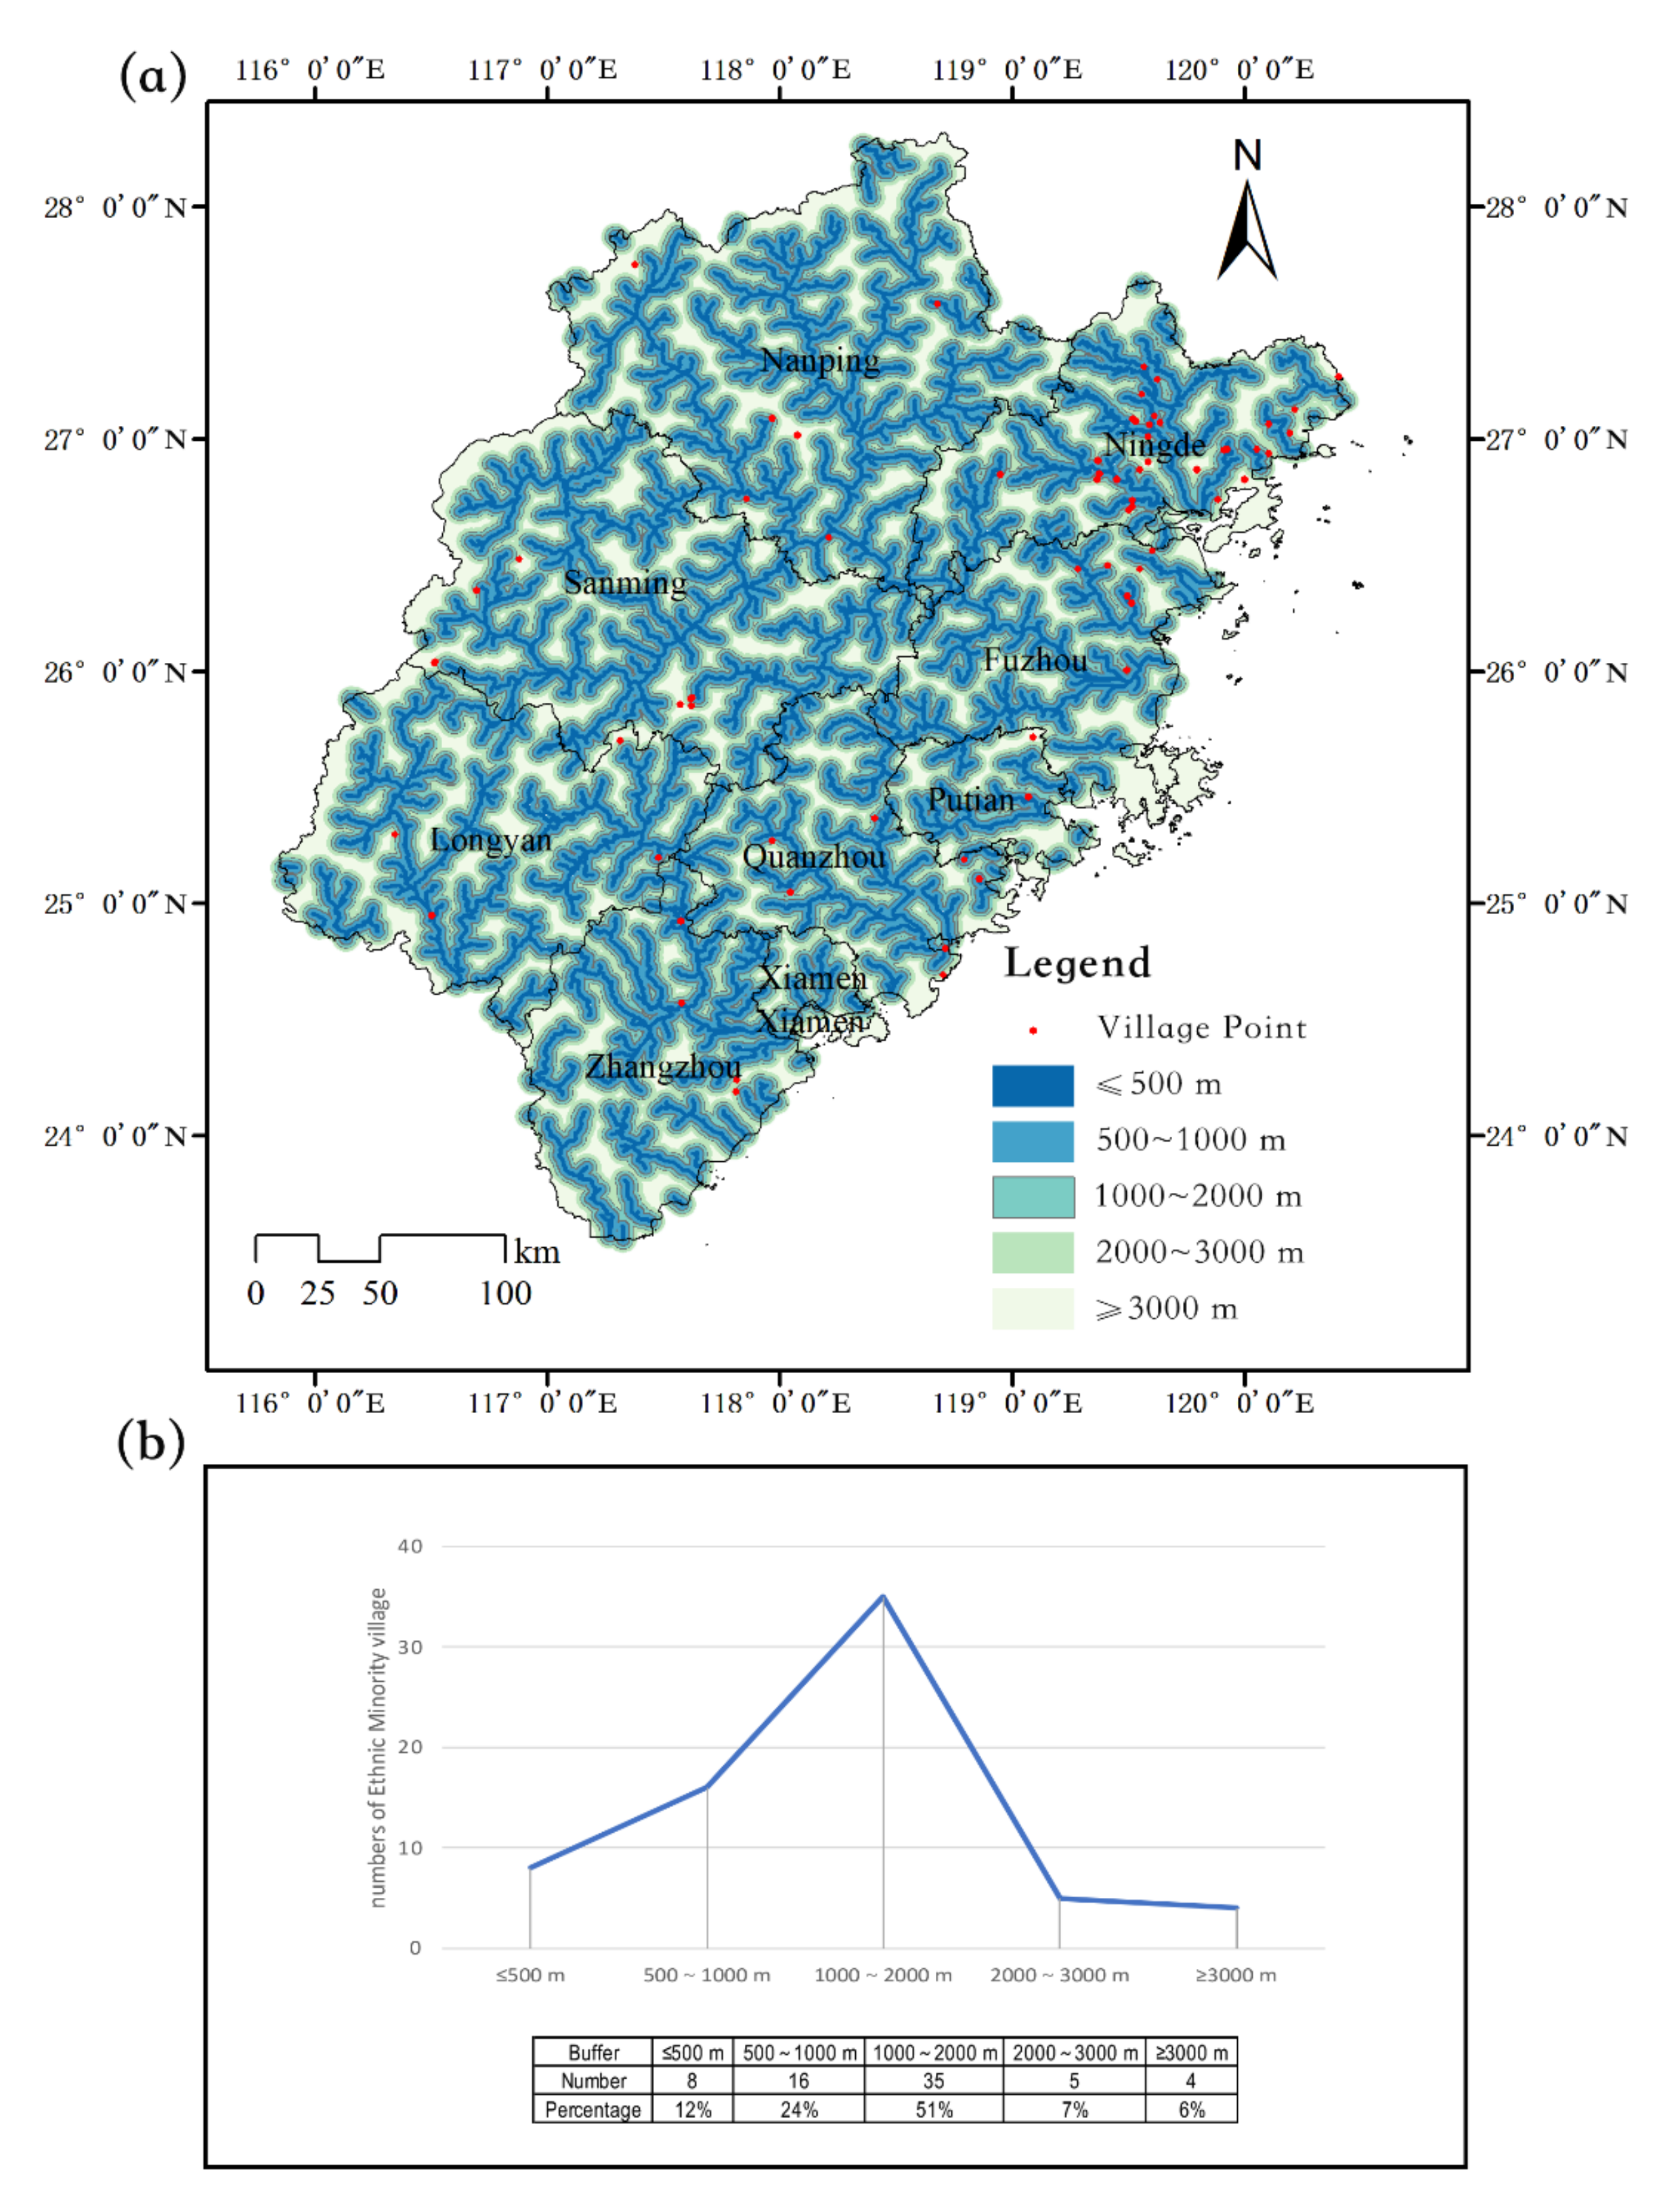
4.2.4. Relationship between the Geographical Distribution of Ethnic-Minority Villages and River Buffer Zone

The proximity analysis tool in ArcMap 10.8 software was used to analyse the river data in Fujian Province and then superimpose them with the geographical distribution points of minority villages. Fujian Province has a dense river network, but the relationship between ethnic-minority villages and rivers is neither as close to the river as waterfront villages nor as far away from the river as general mountain villages, but rather between the two types. Based on the river buffer zone classification interval used by scholars to analyse villages in Hunan Province and Shanxi Province, the distance between ethnic-minority villages and the river in Fujian Province is divided into less than 500 m, 500~1000 m, 1000~2000 m, 2000~3000 m, and 3000~5000 m (Figure 11a). According to the analysis results, as the distance from the river increases, the number of villages decreases, which is adversely connected with the buffer zone. However, through further data statistics, it can be found that the area is 1000~2000 m away from the river in the area with strong village distribution preference, accounting for 51% among 75% of the villages distributed in the range of 500~2000 m (Figure 11b), indicating that the site selection of ethnic-minority villages in Fujian does not show obvious hydrophilic characteristics due to the dense distribution of river network, and has obvious differences with other areas with dense river network.

4.2.5. Relationship between the Geographical Distribution of Ethnic-Minority Villages and River Width

The width of the river determines the richness of the function; when the width of the river is narrow, it can meet the basic needs of life and production. Only when the river reaches a certain width does it have a navigable function, a feature that is particularly prominent when comparing ancient villages and ancient towns: most ancient towns use river transportation in order to meet the trade and transportation functions, so the width of these rivers is relatively wide.
The proximity analysis tool in ArcMap 10.8 software was used to analyse the width data of rivers in Fujian Province and then overlay them with the geographical distribution points of minority villages. The width of the river is divided into 0~5 m, 5~10 m, 10~20 m, 20~50 m, and 50~100 m, with a river wider than 20 m identified as having good navigability. The data show (Table 1) that the number of villages with a width of the river from 10 m to 20 m is the largest, accounting for 50%, and the number of villages with a width of the river from 5 to 10 m accounts for 28%, and there are no villages in the range of the width of the river less than 5 m, indicating that the optimal width of the river for the location of the village is approximately 10 m, meaning that the vast majority of characteristic villages are mostly sited to meet the needs of irrigation and domestic water for agricultural production; if it is too narrow, it will be unable to meet the needs of daily life, and if it is too wide, the village may be exposed to natural disasters such as flash floods. Fifteen percent of the villages are located on navigable rivers with a width of more than 20 m, and seven percent of the villages are in alluvial flat areas of rivers or near the sea, which means that their protection and renewal are more likely to revolve around navigable rivers, such as stone fishing villages near the sea, where fishing and marine transportation are carried out.

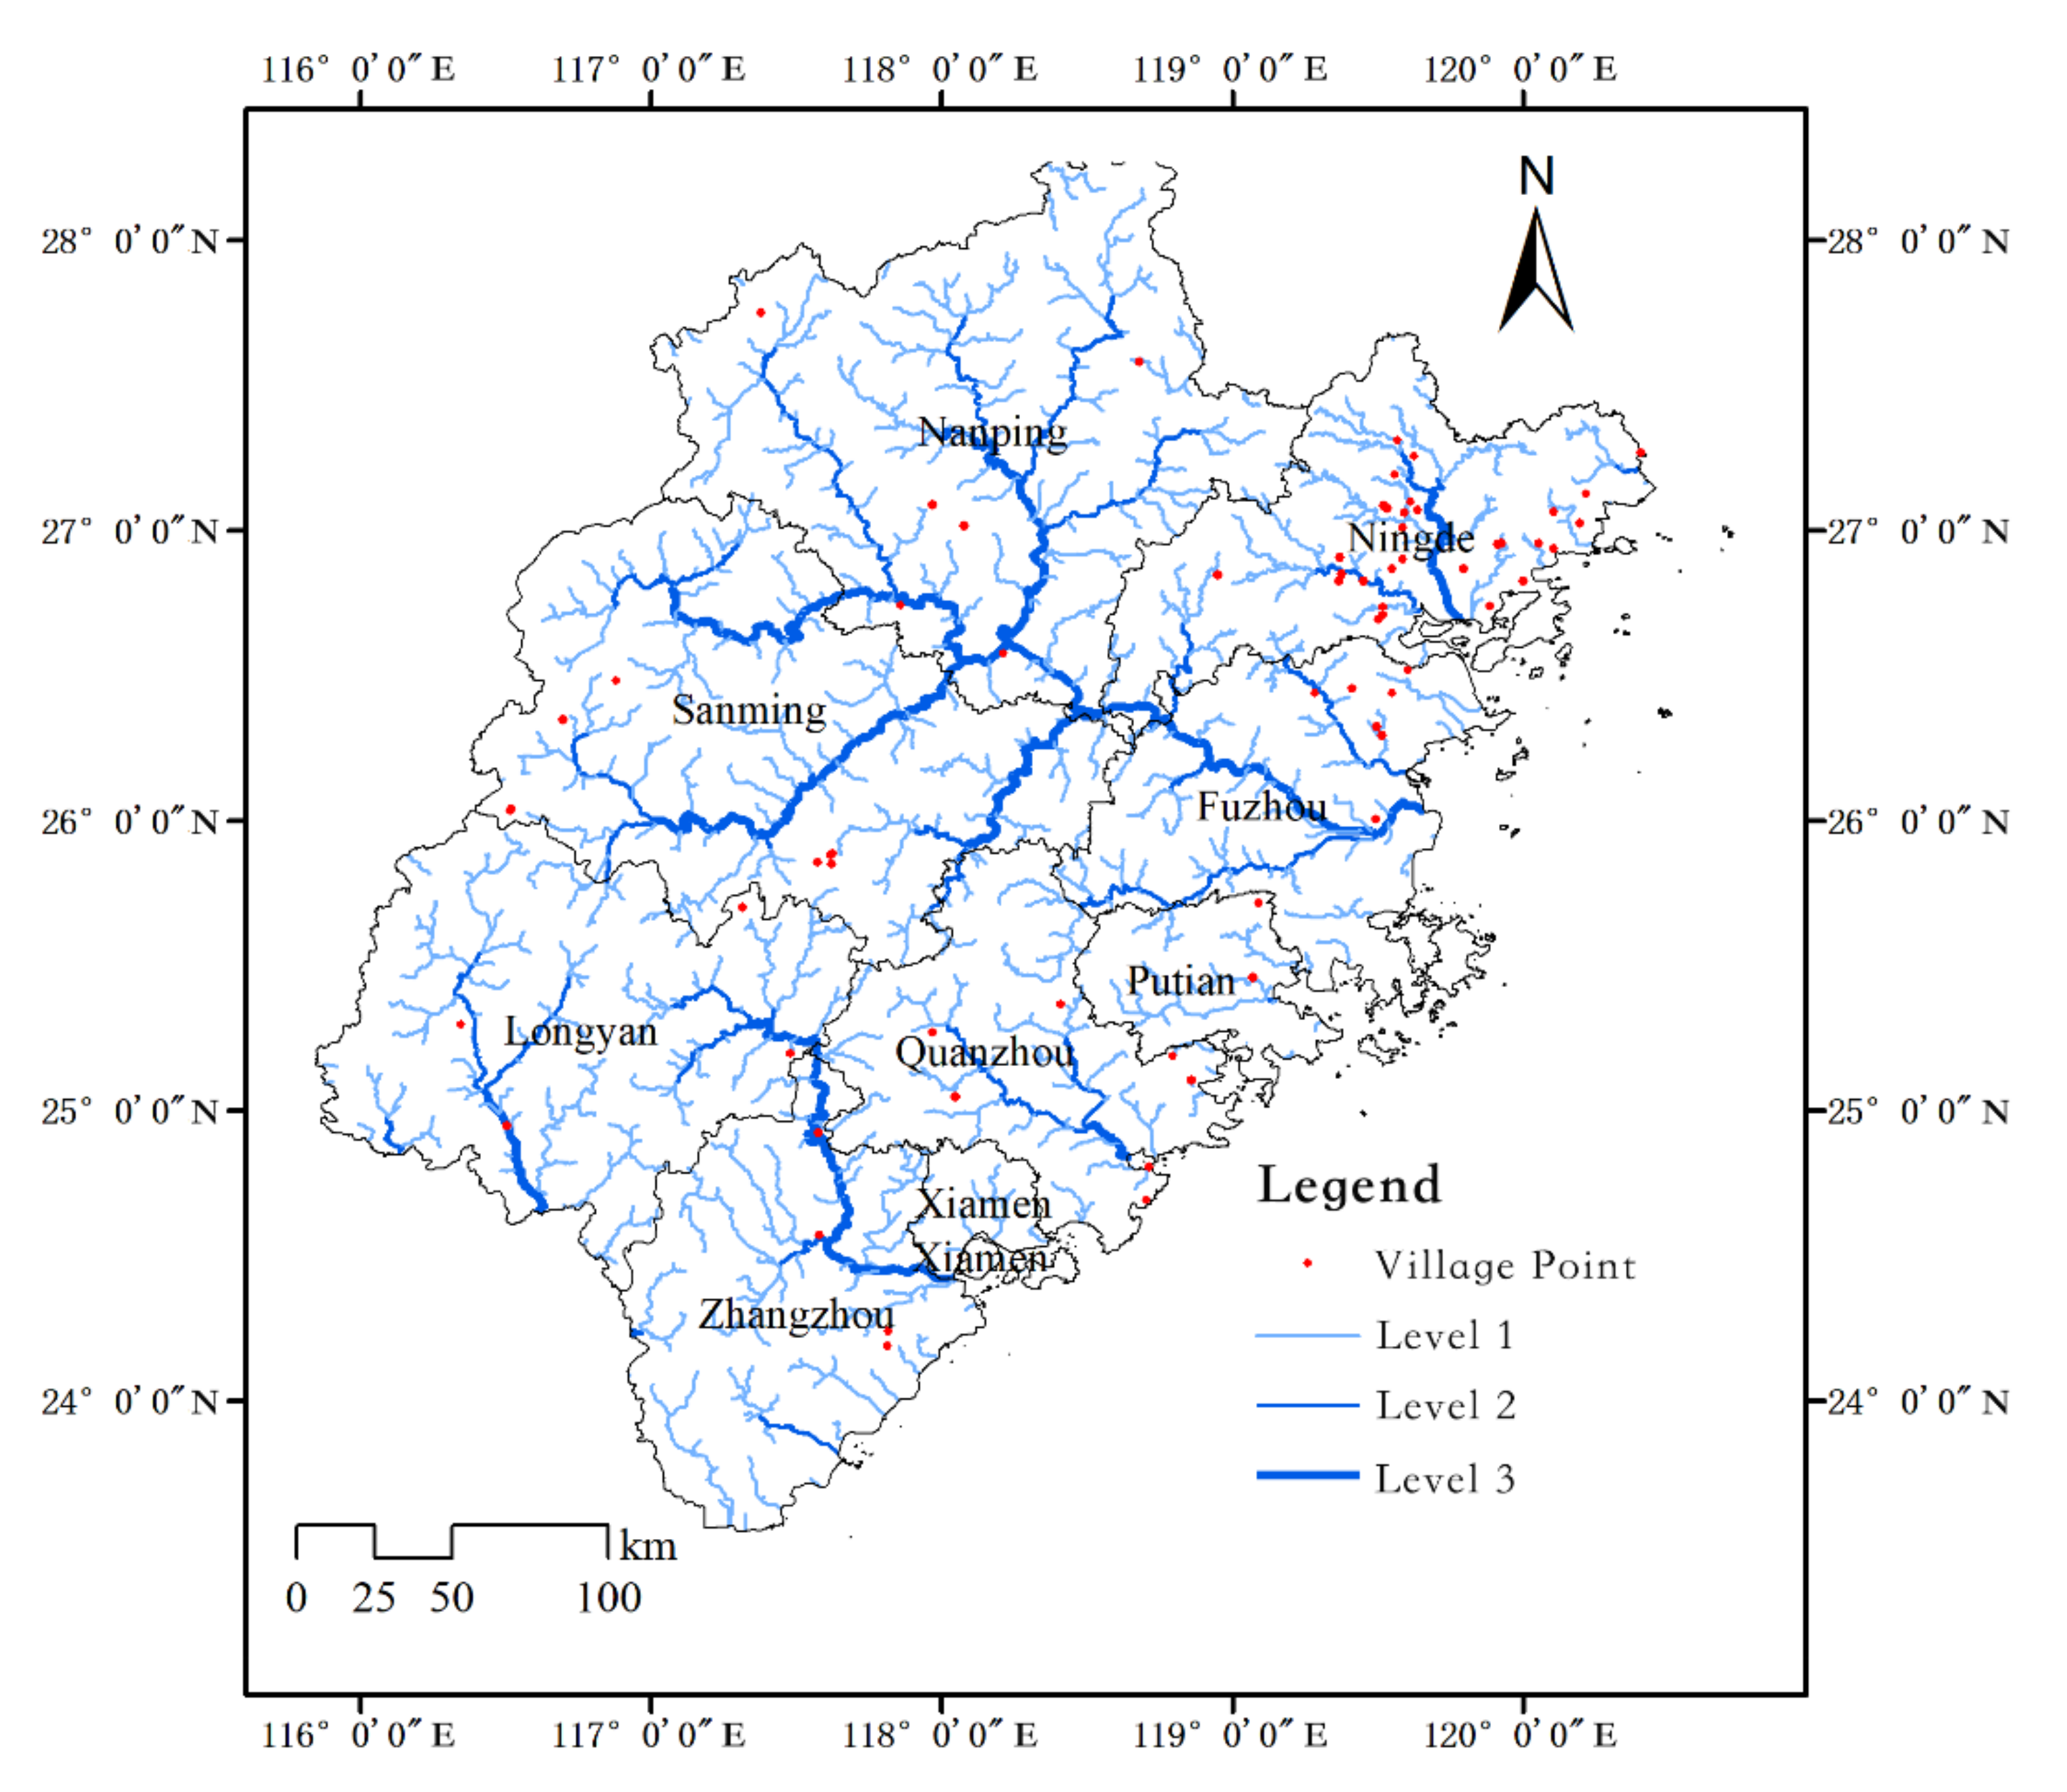
4.2.6. The Relationship between the Geographical Distribution of Ethnic-Minority Villages and River Level

Under the influence of gravity, rivers continually collect at the base of mountains, eventually transforming from a stream into a river. Most of the rivers in Fujian Province are formed within the region of Fujian Province, and therefore the distribution of villages in relation to the hierarchy of water systems is more important than in other provinces. This study determines that the river’s flow convergence level grows, and the mid-mountain cluster stream is classified as level 1, the mountain and valley stream as level 2, and the river as level 3. A level 1 river area is narrow, and steep, with predominantly steep slopes; level 2 river areas are common in river burst banks in river valleys, which are relatively narrow and slope-shaped; level 3 river areas are common on the convex bank of river floodplain and include the flat area after river impact that is flat but low.
The level data of rivers in Fujian Province were analysed using the proximity analysis tool in ArcMap 10.8 software and then overlaid with the geographical distribution points of minority villages. From the results (Figure 12), the number of villages adjacent to rivers of levels 1 and 2 was the highest, while the number of villages close to the river of level 3 was the smallest at six. This type of geographical distribution of villages differs from what we previously understood about village location. In the past, we believed that the area downstream would become a basin or alluvial plain, which is favourable to agricultural development because of its flat and open terrain, making it the optimal location for the village. However, the results of the examination of ethnic-minority villages in Fujian Province contradict our prior thinking. Due to the numerous mountains and hills in Fujian Province, the relative velocity of a level 3 river is higher, the volume of the river during the rainy season is substantial, and there is a risk of river surge. Most villages are located on hillsides or between mountains, close to river valleys, forming level 1 and level 2 rivers, which not only provide for the river’s needs but also aid in avoiding and preventing the invasion of foreign foes. War-torn and long-distance migrant ethnic minorities will find it to be a suitable domicile.

4.3. Quantification of the Influence of Topographic Factors

The degree of influence of topographic factors on the geographical distribution of ethnic-minority villages in Fujian Province was analysed using the GeoDetector’s factor detector function to quantify the influence of topographic factors on the heterogeneity of the spatial structure of villages (q-value), and using the interaction detector, statistical significance was tested. Based on a previous study, the kernel density of the geographical distribution of villages was selected as the dependent variable and the topographic factors as the independent variables, including elevation, slope, aspect, river buffer zone, river width, and river level (Appendix A).
According to the results of the factor detection (Table 2), it can be seen that the geographical distribution of villages with ethnic-minority characteristics in Fujian Province is significantly influenced by various topographic factors, in the following order: river width > aspect > river level > slope degree > elevation > river buffer zone. The influence of river width and aspect are the highest, at 0.171 and 0.132, respectively, significantly higher than other topographic factors, indicating that the distribution of villages is mainly influenced by river width and aspect. The influence values of river level, slope, elevation, and river buffer are all less than 0.1, 0.082, 0.061, 0.054, and 0.048, respectively, which are low-level drivers, with the influence of river buffer being the weakest.
According to the results of the factor interaction detection (Table 3), the factors are all two-factor-enhanced, and there is no non-linear enhancement, independence, or weakening relationship between the factors, and the influence of the topographic factors aspect and slope are significantly enhanced. The red values are the influence of the single factors (q-values), which are the lowest values in each column, and the black values are the influence of the factor interactions, indicating that the influence of both factor interactions is greater than the influence of every single factor. The interaction influence of aspect and the slope was 0.404, which is significantly higher than the influence of the single factor aspect at 0.132 and the slope at 0.061.

5. Discussion

5.1. Geographical Distribution Characteristics

The research on the features of the distribution of ethnic-minority villages in Fujian Province reveals that the geographical distribution of ethnic-minority villages in Fujian Province is characterised by “single-core independence.” Because Ningde has a large area of mountains and hills and a narrow river width, it not only meets the needs of ethnic minorities to avoid and prevent foreign invasion, but also provides basic living conditions, and it is simple to form the gathering and development of ethnic minorities in small areas. A mountainous and hilly topography can facilitate the clustering and dispersion of villages. This result is congruent with Sun [8]. According to her view, the characteristics of the natural geographical environment include circle expansion and zonal extension according to the terrain. This law is consistent with the features of Fujian minority villages developing an independent single core and extending to the exterior. However, the distribution of ethnic-minority villages in Fujian Province coexists with significant agglomeration and dispersion, and the same core area as Ningde has not been formed in other regions, which is different from the multi-core distribution characteristics of ethnic-minority villages in Guizhou [6]. However, it cannot be ignored that the distribution density of ethnic-minority villages in Guizhou is higher than that in Fujian, so the impact of density difference on the distribution of ethnic-minority villages in the two provinces cannot be ignored. Using the Voronoi method, the distribution of villages belonging to ethnic minorities in various regions is examined. There is an agglomeration distribution type in both dense and sparsely populated regions, demonstrating a nonlinear relationship between the density and the geographical distribution type. The terrain has a greater impact on village dispersion than population density.

5.2. Relationship between Topographic Features and Village Distribution

Based on an analysis of the distribution of villages and the superposition of various topographic factors, the distribution of ethnic-minority villages in Fujian Province is higher at low altitudes and lower at high altitudes, and the number is negatively correlated with altitude, which is consistent with the general distribution law of multi-mountainous characteristics, such as those of Guizhou and Yunnan [6,53]. By splitting the elevation data of ethnic-minority villages in Fujian, it is determined that ethnic-minority villages in Fujian are primarily dispersed between the height range of 202 and 647 m (the middle of mountains and hills). This is contrary to the common idea that villages are predominantly spread in rocky and hilly low-altitude regions that are easily accessible and beneficial to residents’ everyday lives. In addition, 45% of villages of ethnic minorities are still located on slopes steeper than 15 degrees, because the conditions on slopes are more conducive to tea cultivation, which differs from farming practices in flat areas. In contrast to the distribution of villages in the Central Plains [9], the village distribution does not exhibit a tendency toward the 15-degree slope zone ideal for agriculture. Nevertheless, the effect of aspect on village distribution is consistent with that observed in other regions [6,33,54]. Additionally, the optimal aspect is flat with a south slope (−1°, 157.5°~202.5°). In terms of the impact of rivers, the general understanding is that the location of villages needs to be distributed along a river to meet the needs of agricultural production, irrigation, and domestic water and to keep a certain distance from the river to prevent floods and other natural disasters. If we expand this universal understanding, we will discover that there are significant variances that will eventually lead to the development of villages with distinct characteristics. Seventy-two percent (185) of the 257 traditional villages in Hunan Province are waterfront villages with a completely natural river crossing through the village or village area with a river less than 20 m in width [33]. Most villages belonging to ethnic minorities in Fujian Province are located 500 to 2000 m from rivers, and their distribution patterns do not exhibit any noticeable hydrophilicity. Most ethnic-minority villages in Fujian are distributed around rivers of level 1 and level 2. They pick neither the impact flat formed by the downstream or convex bank of a level 3 river, as in the plain area nor proximity to a level 3 river, as in a significant river transportation city. This is since the hillside of mountains and hills, or the mountains and river valleys in Fujian Province, not only met the water needs of the residents, but also helped the Fujian minority to escape the siege of the ruling class. War-torn and long-distance migrant Fujian ethnic minorities find this to be an appropriate domicile.

5.3. Differentiation of Topographic Factors

By quantifying the superposition results of various topographic parameters and village distribution, it was shown that the width of the river has the strongest link with the geographical distribution of ethnic-minority villages in Fujian. This conclusion contradicts the frequently held belief that altitude, slope, aspect, and distance from the river are the most influential determinants of village geographical distribution. It was discovered that the distribution characteristics of villages in different regions are the result of the interaction of multiple topographic factors but that the differences between the distribution characteristics of villages in different regions are in fact due to the different forces exerted by different topographic factors. Even though Fujian Province has similar topographic conditions to Hunan and Jiangxi, with many mountains and hills and a dense river network, the distribution of ethnic-minority villages is dominated by aspect and slope, which differs from the distribution characteristics of villages with many waterfronts and rivers crossing them in Hunan and Jiangxi. The geographical distribution of Hakka villages in Ganzhou is mostly influenced by mountainous terrain and agricultural land. Most villages conform to the mountain and grow linearly. They are more dependent on the mountain than the river [33].

6. Conclusions and Future Work

This research examines the geographical distribution characteristics of ethnic-minority villages in Fujian Province, their relationship with topographic parameters, and the influence and interaction degree of each element, using ArcMap and GeoDetector. The conclusions are as follows:
(1) The geographical distribution of minority villages in Fujian Province is of the agglomeration type, with a significant “mononuclear” feature, and the topography has a facilitating effect on the clustering distribution of villages.
(2) According to the results of the analysis of the geographical distribution of minority villages in each city of Fujian Province, it was found that the geographical distribution of minority villages in each city coexisted with the agglomeration type and the dispersion type, that the role of topography in promoting the agglomeration type distribution of villages was not affected by the distribution density of villages, and that there was a non-linear relationship between the distribution density of villages and the geographical distribution type of villages. Ningde City in the core density zone, Sanming City in the sub-density zone, and Nanping City and Fuzhou City in the low-density zone all belong to the agglomeration distribution type (agglomeration). Among these, Ningde City has the most significant agglomeration effect; Longyan City, Quanzhou City, and Zhangzhou City belong to the random distribution type (dispersion), and the distribution density is relatively low; and Putian City belongs to the uniform distribution type (dispersion), and the village distribution density is low.
(3) The site selection of Fujian minority villages is characterised by medium altitude, moderate slope, sun exposure, and no obvious hydrophilicity. Minority villages are mainly located in the area with an elevation of 202–647 m, a slope of 6°–15°, an aspect of flat land—south slope or southeast slope—southwest slope, and a distance of 500–1500 m from a 5–20 m wide river of level 2.
(4) The site selection of Fujian minority villages is influenced by various topographic factors, such as elevation, slope, aspect, river buffer, river width, and river level, among which river width has the most substantial effect.
(5) Each topographic factor affects the distribution of villages. The factors all have a two-factor enhancing relationship with each other, and there is no non-linear enhancement, independence, or weakening relationship. Aspect and slope have the most substantial effect and play a dominant role in site selection.
Under the realistic context of rural reconstruction and transformation, the best location (topographic characteristics) also limits the contemporary development of ethnic-minority villages in Fujian Province, as the mountains and hills are typically rugged near the medium altitude and have poor traffic access. The topographic characteristics that were once beneficial to the preservation and inheritance of villages must be re-examined and utilised. Studying the relationship between Fujian ethnic-minority villages and terrain factors is conducive to mining the heritage value of Fujian ethnic-minority villages. For example, by deepening the relationship between the two, we can provide a field investigation path for the development history of the villages, provide ideas for the hot spot construction and brand marketing strategy for the revitalisation of ethnic villages, and avoid the renewal methods of Fujian ethnic-minority villages in other areas with similar terrain. Considering that the functional driving force of topographic features on the evolution of villages is gradually leaning towards the green basic value, the protection and development of ethnic-minority villages should be as follows. (1) It should focus on the protection and governance of topographic features and then focus on the village itself so that it can be a “main body” and “environment”, breaking the isolated protection mode of a single village. (2) Regional protection should be adopted in areas with high village core density. For example, the shape core density area should pay attention to the governance of regional topographic characteristics and build regional ethnic minority characteristic village groups by strengthening regional topographic characteristics. (3) In areas with low nuclear density, the content of transformation can be refined and regional homogeneity can be avoided by relying on geographical conditions, national culture, and other regional attributes. Based on the current research, future research on the relationship between the morphological representation, pattern, cultural connotation, and topographic factors of villages can be studied in more detail and in-depth to compensate for and expand the research direction and content of ethnic-minority villages.

Author Contributions

Conceptualization, X.X.; methodology, X.X.; software, X.X.; validation, X.X., Y.L.; formal analysis, X.X.; investigation, X.X.; resources, X.X.; data curation, X.X.; writing—original draft preparation, X.X.; writing—review and editing, X.X. and Y.Z.; visualization, X.X.; supervision, Y.Z., E.M.W. and A.N.Z.; contact author, Y.Z.; project administration, P.V.G.; funding acquisition, P.V.G. All authors have read and agreed to the published version of the manuscript.

Funding

This research was funded by the Joint training program of the China Scholarship Council (grant number 2020101).

Institutional Review Board Statement

Not applicable.

Informed Consent Statement

Not applicable.

Data Availability Statement

Not applicable.

Conflicts of Interest

The authors declare no conflict of interest. The funders had no role in the design of the study; in the collection, analyses, or interpretation of data; in the writing of the manuscript; or in the decision to publish the results.

Appendix A

Table A1. Statistical table of villages geographical distribution data.
No.NameNuclear DensityElevationSlopeAspectRiver Buffer ZoneRiver LevelRiver Width
1Qinjiang 0.000473332133
2Tianzhu 0.001347125314
3Houguan 0.001443135322
4Tingyangban 0.001969334314
5Fuhu 0.001323133122
6Bajing 0.001756353213
7Xuyang 0.001794355313
8Xiaoba 0.000612134213
9Guokeng 0.000485111335
10Shantan 0.000424353314
11Nanmei0.000326335313
12Zhongcuo 0.000613133313
13Shiyu 0.000596125235
14Shengfu 0.000442353222
15Dingtan 0.000503112513
16Guanshe 0.000443254333
17ChaPu 0.000372115122
18Chiling 0.000526222212
19Batou 0.000387455313
20Shuangfu 0.000471112313
21Xiangliao 0.000617544313
22Fengkang 0.000296242335
23Shuren 0.000296344322
24Shanyang0.000372232213
25Canghai 0.001048535212
26Qingshui 0.001056423212
27Xiasha 0.000542324313
28Dongban 0.001085542212
29Tinghai 0.001064543515
30Guanfang 0.000411355413
31Zhiping 0.000557451313
32Hubeijiao 0.000554435312
33Lingbingyang 0.000312232323
34Tianping 0.000436344322
35Wudayuan 0.000543345314
36Jiangdun 0.00052224313
37Jiangyuan 0.000245344313
38Zhaoshajia 0.000245252213
39Shangjinbei 0.00295253313
40Houdun 0.003564333313
41Xita 0.003128444313
42Bailukeng 0.001969133414
43Badou 0.002732442112
44Jiuxian 0.003163113223
45Jindouyang 0.003367243314
46Lianling 0.00332333314
47Houyang 0.001994253213
48Hutou 0.003201341313
49Chixi 0.001849345212
50Shuanghua 0.000611131435
51CaiBao 0.00142345414
52Ruiyun 0.001686234513
53Shangshui 0.002703242312
54Dongshan 0.001949234312
55Chagang 0.002126235314
56Badi 0.000391431313
57Lijiayang 0.001603235413
58Tingping 0.002855334313
59Beishan 0.003057234213
60Dongling 0.0028251223
61Xianyan 0.003172244312
62Kanxia 0.003095334513
63Lantian 0.003587135222
64Nanshan 0.002469231314
65Guoyang 0.003671344213
66Xiaping 0.002644234212
67Damuli 0.001974125213
68Yunmen 0.002817344222

References

  1. Guo, Z.F.; Sun, L. The planning development and management of tourism: The case of Dangjia, an ancient village in China. Tour. Manag. 2016, 56, 52–62. [Google Scholar] [CrossRef]
  2. The State Ethnic Affairs Commission Printed and Distributed the Outline of the Plan for the Protection and Development of Villages with Ethnic Minorities. Available online: http://www.gov.cn/gzdt/2012-12/10/content_2287117.htm (accessed on 18 May 2022).
  3. Xu, Y.Z.; Yao, X.Z. Study on the geographical distribution pattern of ethnic minority villages in China. Guizhou Ethn. Stud. 2020, 41, 51–58. [Google Scholar]
  4. Chen, G.L.; Luo, J.; Zeng, J.X.; Tian, Y.; Dong, Y. Study on spatial structure identification and influence mechanism of Chinese ethnic minority villages. Geogr. Sci. 2018, 38, 1422–1429. [Google Scholar]
  5. Dong, Y.P.; Liu, S.P. Study on geographical distribution characteristics of traditional villages in Shanxi Province Based on GIS. J. Taiyuan Univ. Technol. 2018, 49, 771–776. [Google Scholar]
  6. Wei, Z.; Zhang, F.T.; Zhang, Y. Analysis on temporal and geographical distribution characteristics and influencing factors of ethnic minority villages in Guizhou. Guizhou Ethn. Stud. 2021, 42, 113–121. [Google Scholar]
  7. Wang, Y.J. Order and Power in Hani village rituals. Ph.D. Thesis, Yunnan University National, Kunming, Yunnan, 2021. [Google Scholar]
  8. Sun, Y.; Wang, Y.S.; Xiao, D.W.; Zhang, Q.B. Study on geographical distribution and evolution of Meizhou Hakka traditional villages based on GIS. Econ. Geogr. 2016, 36, 193–200. [Google Scholar]
  9. Yan, L.J.; Shi, Y.S.; Lu, P.; Liu, C.L. Study on the relationship between prehistoric settlement site selection and river in Songshan area. Reg. Res. Dev. 2017, 36, 169–174. [Google Scholar]
  10. Vienna, A.; Garcia, J.P.; Mascie-Taylor, C.G.N.; Biondi, G. The ethnic minorities of Southern Italy and Sicily: Relationships through surnames. J. Biosoc. Sci. 2001, 33, 25–31. [Google Scholar] [CrossRef] [Green Version]
  11. Du, F.J.; Zhu, H. The evolution and mechanism of spatial structure of the marriage circle of ethnic groups in scattered places: A case study of Gelao minority in Pomao village, Guizhou province. Geogr. Res. 2013, 32, 881–890. [Google Scholar]
  12. Zhou, Z.X.; Feng, J.C. Settlement Construction of Ethnic Minority Under Survival Pressure in Mountainous Area of Guizhou Province: A Case Study of the Biandan Mountain Area. China City Plan. Rev. 2016, 25, 64–73. [Google Scholar]
  13. Tang, M.G.; Hu, J.; Xiao, L.; Chen, X.; Lv, L. Temporal and spatial evolution and influencing factors of ethnic minority villages in Guizhou. Resour. Environ. Arid. Areas 2022, 36, 177–183. [Google Scholar]
  14. Yang, Y.; Hu, J.; Liu, D.J.; Jia, Y.Y.; Jiang, L. Spatial structure identification and influence mechanism of Miao traditional villages in Guizhou Province. Econ. Geogr. 2021, 41, 232–240. [Google Scholar]
  15. Gustafsson, B.; Sai, D. Villages where China’s ethnic minorities live. China Econ. Rev. 2009, 20, 193–207. [Google Scholar] [CrossRef] [Green Version]
  16. Wang, Z.J. Research on poverty alleviation model of ethnic minority villages—Based on the investigation of 312 villages in Guizhou. Reform Strategy 2021, 37, 75–82. [Google Scholar]
  17. Ho, K.S.; Hien, N.T.M. Study on the significant influence of capacity building toward the livelihood assets of ethnic minority Villages in the northern part of Vietnam. J. Korean Soc. Rural. Plan. 2017, 23, 1–13. [Google Scholar] [CrossRef]
  18. Yang, C.E.; Zhao, J. Practical dilemma and Path Exploration of the revitalization of ethnic minority villages—Based on the investigation of ethnic areas in Southwest Hubei. J. Natl. 2020, 11, 17–28 + 152–154. [Google Scholar]
  19. Meng, J.; Huang, F.Q. Logic and practice of “intangible cultural heritage + tourism” targeted poverty alleviation in ethnic minority villages—A Study on Chengyang bazhai Dong Township, Sanjiang, Guangxi. Agric. Econ. 2021, 2, 92–94. [Google Scholar]
  20. Joan, H.D.; Goh, K.T.; Denyse, N.; Tan, S.R. Tourism in Ethnic Villages: Two Miao Villages in China. Int. J. Herit. Stud. 2009, 15, 529–539. [Google Scholar]
  21. Xu, W.W.; Li, Z.B. Study on the mutual promotion between the construction of ethnic minority villages and the integration of tourism industry. Guangxi Ethn. Stud. 2021, 4, 171–179. [Google Scholar]
  22. Sun, L.; Deng, A.M.; Zhang, H.C. Dilemma and relief of tourism activation in Ethnic Traditional Villages—A case study of Leishan County, Southeast Guizhou. Guizhou Ethn. Stud. 2019, 40, 53–58. [Google Scholar]
  23. Li, Y.J.; Turner, S.; Cui, H.Y. Confrontations and concessions: An everyday politics of tourism in three ethnic minority villages, Guizhou Province, China. J. Tour. Cult. Change 2016, 14, 45–61. [Google Scholar] [CrossRef]
  24. Cao, D.M. Recommend a masterpiece necessary for the protection of characteristic villages—A review of “Research on improving the protection policy of ethnic minority villages”—Based on the investigation of Enshi Tujia and Miao Autonomous Prefecture, Hubei Province. J. Cent. South Univ. Natl. (Humanit. Soc. Sci. Ed.) 2022, 42, 189. [Google Scholar]
  25. Li, J.; Su, D.; Li, Z.B. Ecological capital and the construction of ethnic minority villages: Action mechanism and policy choice. Guizhou Ethn. Stud. 2018, 39, 145–148. [Google Scholar]
  26. Li, D. Reflection and action: The governance philosophy of domestic ethnic minority villages in recent ten years. J. Orig. Ecol. Natl. Cult. 2020, 12, 68–76. [Google Scholar]
  27. Tian, Y.M.; Xie, Q.S. Research on the cultural transmission path of ethnic minority villages in the Internet Era—Take three ethnic minority villages in Guizhou Province as an example. Guizhou Ethn. Stud. 2020, 41, 68–74. [Google Scholar]
  28. Tao, J.Y.; Dong, P.; Zhou, N.X.; Lu, Y.Q.; Gong, X.; Ma, X.B. Study on Geographical Distribution Characteristics and Influencing Factors of Famous Historical and Cultural Towns and Villages in the Yangtze River Economic Belt. Geogr. Geogr. Inf. Sci. 2022, 3, 66–73. [Google Scholar]
  29. Liu, L.W.; Duan, Y.H.; Li, L.L. Geographical distribution characteristics and suitability evaluation of rural residential areas in Shanxi Province. Agric. Resour. Reg. China 2022, 43, 100–109. [Google Scholar]
  30. Guo, P.; Zhang, F.; Wang, H.; Qin, F. Suitability Evaluation and Layout Optimization of the Geographical distribution of Rural Residential Areas. Sustainability 2020, 12, 2409. [Google Scholar] [CrossRef] [Green Version]
  31. Ma, Y.; Wang, J.P.; Li, S.W. Site selection and land suitability evaluation of traditional villages based on GIS—A case study of Ning’ai village, Pingding County, Shanxi Province. City Build. 2020, 17, 23–27. [Google Scholar]
  32. Xiao, Z.Q.; Pilates, M.H.T.; An, C.G. Study on geographical distribution characteristics and influencing factors of Xinjiang farmhouse based on POI data. J. Southwest Univ. (Nat. Sci. Ed.) 2022, 44, 144–154. [Google Scholar]
  33. Liang, B.Q.; Xiao, D.W.; Tao, J. Temporal and spatial pattern and evolution of the distribution of Hakka traditional villages in Ganzhou. Econ. Geogr. 2018, 38, 196–203. [Google Scholar]
  34. Gao, H.Y. Mining geographical distribution characteristics of Beijing sports venues based on POI big data. Mapp. Spat. Geogr. Inf. 2022, 45, 134–136+140. [Google Scholar]
  35. Wu, R.L.; Zou, Y.W.; Li, H.Y. Geographical distribution characteristics and influencing factors of famous towns and villages with Chinese characteristics. Resour. Environ. Arid. Areas 2022, 36, 155–163. [Google Scholar]
  36. Zhang, H.; Wang, X.S.; Yu, R.L. A method to measure the geographical distribution characteristics of point targets based on Voronoi diagram. J. Cent. China Norm. Univ. (Nat. Sci. Ed.) 2005, 3, 422–426. [Google Scholar]
  37. Charles, D.; Gilles, G. Voronoi tessellation to study the numerical density and the geographical distribution of neurons. J. Chem. Neuroanat. 2000, 20, 83–92. [Google Scholar]
  38. Song, Y.; Chen, Y.P. Research on the K-neighbor algorithm in cluster analysis. Electron. Prod. 2013, 19, 4243+35. [Google Scholar]
  39. Wang, Z.F.; Liu, Q.F. Spatial heterogeneity characteristics and influencing factors of Chinese ethnic minority villages. Econ. Geogr. 2019, 39, 150–158. [Google Scholar]
  40. Zheng, G.H.; Jiang, D.F.; Luan, Y.F. GIS-based spatial differentiation of ethnic minority villages in Guizhou Province, China. J. Mt. Sci. 2022, 19, 987–1000. [Google Scholar] [CrossRef]
  41. Zhao, M.F.; Wang, D.G. Spatial differentiation pattern of interregional migration in ethnic minority areas of Yunnan Province, China. J. Mt. Sci. 2021, 18, 3041–3057. [Google Scholar] [CrossRef]
  42. China Government Network: Fujian. Available online: http://www.gov.cn/guoqing/2016–11/21/content_5135519.htm (accessed on 15 January 2021).
  43. He, Q.; Chen, N. Morphological classification of mountainous areas in Fujian Province Based on combined frequency domain information. Remote Sens. Inf. 2016, 31, 136–141. [Google Scholar]
  44. Zheng, X.M.; Wei, H.Z. On the development of Fujian Mountainous Area Economy in Song Dynasty. Agric. Archaeol. 1986, 1, 62–72. [Google Scholar]
  45. Petrie, C.; Thomas, K. The topographic and environmental context of the earliest village sites in western South Asia. Antiquity 2012, 86, 1055–1067. [Google Scholar] [CrossRef]
  46. The State Ethnic Affairs Commission Announced the Third Batch of Proposed Naming Lists of Villages with Chinese Minority Characteristics. Available online: http://whhly.guizhou.gov.cn/xwzx/szdt/201912/t20191226_37335311.html (accessed on 12 December 2021).
  47. National Bureau of Statistics. China’s Annual Statistical Bulletin for 2021. Available online: http://www.stats.gov.cn./tjsj/zxfb/202202/t20220227_1827960.html (accessed on 12 January 2021).
  48. Resource and Environment Science and Data Centre. Available online: https://www.resdc.cn/data.aspx?DATAID=333 (accessed on 20 May 2022).
  49. Wu, Y.Z.; Wu, C.F.; Bei, H.L. Geographical distribution characteristics and mechanism of urban office buildings in Hangzhou during the transition period. J. Geogr. 2010, 65, 973–982. [Google Scholar]
  50. Roberts, S.A.; Hall, G.B.; Boots, B. Street Centerline Generation with an Approximated Area Voronoi Diagram. In Developments in Spatial Data Handling; Springer: Berlin/Heidelberg, Germany, 2005. [Google Scholar]
  51. Wang, J.F.; Li, X.H.; Christakos, G.; Liao, Y.L.; Zhang, T.; Gu, X.; Zheng, X.Y. Geographical detectors-based health risk assessment and its application in the neural tube defects study of the Heshun region, China. Int. J. Geogr. Inf. Sci. 2010, 24, 107–127. [Google Scholar] [CrossRef]
  52. Li, X.M.; Li, W.Y.; Kendra, S.S.; Albert, C.S. Hidden from the wind and enjoying the river: The traditional cosmology of Fengshui and the shaping of Dong villages in Southwestern China. Landsc. Res. 2019, 44, 614–627. [Google Scholar] [CrossRef]
  53. Long, B.; Zhao, Y. Study on the geographical distribution and influencing factors of national traditional villages in Yunnan Province. Small Town Constr. 2022, 40, 29–39. [Google Scholar]
  54. Xu, F.; Deng, Y.; Xu, N.; Song, L.M. Study on the difference of spatial combination of traditional waterfront villages in Hunan. Huazhong Archit. 2020, 38, 104–111. [Google Scholar]
Figure 1. Location and topography of Fujian, China.
Sustainability 14 07727 g001
Figure 2. Statistical diagram of the number of ethnic-minority villages in China’s provinces.
Sustainability 14 07727 g002
Figure 3. Statistical diagram of the number of ethnic-minority villages in cities of Fujian Province.
Sustainability 14 07727 g003
Figure 4. Study framework diagram.
Sustainability 14 07727 g004
Figure 5. Average nearest neighbour index diagram of ethnic-minority villages.
Sustainability 14 07727 g005
Figure 6. Kernel density map of the geographical distribution of ethnic-minority villages.
Sustainability 14 07727 g006
Figure 7. (a) Voronoi diagram of ethnic-minority villages; (b) CV value of ethnic-minority villages in each city.
Sustainability 14 07727 g007
Figure 8. Geographical distribution and elevation correlation map of ethnic-minority villages: (a) Superposition of village geographical distribution points and elevation; (b) Elevation statistics of village geographical distribution points.
Sustainability 14 07727 g008
Figure 9. Geographical distribution and slope correlation map of ethnic-minority villages: (a) Superposition of village geographical distribution points and slopes; (b) Slope Statistics of village geographical distribution points.
Sustainability 14 07727 g009
Figure 10. Geographical distribution and aspect correlation map of ethnic-minority villages: (a) Geographical distribution point and aspect superposition of villages; (b) Aspect statistics of village geographical distribution points.
Sustainability 14 07727 g010
Figure 11. Geographical distribution and river buffer zone correlation map of ethnic-minority villages: (a) Geographical distribution point and river buffer zone superposition of villages; (b) River buffer zone statistics of village geographical distribution points.
Sustainability 14 07727 g011
Figure 12. Correlation map between geographical distribution and river level of ethnic-minority villages.
Sustainability 14 07727 g012
Table 1. Statistical data table of geographical distribution and river width of ethnic-minority villages.
River Width (m)0~55~1010~2020~5050~100
Number01934105
Percentage028%50%15%7%
Table 2. Detection and analysis table of driving factors for the geographical distribution of ethnic-minority villages.
Topographic FactorAltitudeSlopeAspectRiver Buffer ZoneRiver WidthRiver Level
q value0.0540.0610.1320.0480.1710.082
Table 3. Exploration analysis table of the interaction of driving factors in the geographical distribution of ethnic-minority villages.
Topographic FactorAltitudeSlopeAspectRiver Buffer ZoneRiver WidthRiver Level
Altitude0.0540.2040.3950.3200.2990.184
Slope0.2040.0610.4040.2300.3330.190
Aspect0.3950.4040.1320.3350.3530.290
River buffer zone0.3200.2300.3350.0480.3960.255
River width0.2990.3330.3530.3960.1710.194
River level0.1840.1900.2900.2550.1940.082
Publisher’s Note: MDPI stays neutral with regard to jurisdictional claims in published maps and institutional affiliations.

