Article

Evaluation of Land-Use Layout of the Rail Station Area Based on the Difference in Noise Sensitivity to Rail Transit, Taking a Suburb of Tokyo as an Example

School of Architecture, Huaqiao University, Xiamen 361021, China
*
Author to whom correspondence should be addressed.
Sustainability 2022, 14(13), 7553; https://doi.org/10.3390/su14137553
Submission received: 23 April 2022 / Revised: 30 May 2022 / Accepted: 17 June 2022 / Published: 21 June 2022
(This article belongs to the Topic Architectures, Materials and Urban Design)

Abstract

:
Rail transit has been deemed a sustainable means of transportation, but its agglomeration effect and the noise therefrom create conflict. Generally, such conflict can be solved by designing the architecture and facilities of rail transit using noise-reduction methods. However, relevant studies have pointed out the limitations of such methods from the perspective of enforceability and social justice. Specifically, extensive monitoring of noise is difficult, and the cost of noise reduction is mostly borne by the surrounding residents. Thus, another question has been raised: Can we apply a land-use layout that takes into account the difference in sensitivity to rail noise of different types of land so as to weaken the negative impact of rail noise? In this paper, we adopted various methods of the characteristic price method, progressive multivariate regression analysis method and noise simulation method, and adopted the suburban rail transit system in Japan as the research object to analyze the impact of rail noise on the price of residential land within 200 m of the rail line. Additionally, we investigated the impact of the accessibility to the station site on the price of commercial and residential land within 800 m of the rail line. We also established the evaluation model on this basis. Lastly, we conducted a further discussion on the evaluation model by studying the re-development project of Tokyo’s Futako Tamagawa Station. The major conclusions in this paper are the following: rail noise is negatively related to the price of residential land within 200 m of the rail line; the price of commercial land within 800 m of the station site is negatively related to the station’s accessibility; and the price of residential land is unrelated to the station’s accessibility. According to the results of the analysis of Tokyo’s Futako Tamagawa Station, designing and arranging commercial land that is insensitive to rail noise in the area surrounding the rail line and using commercial buildings as a shield for the residential land behind them will be beneficial for weakening the negative impact of noise and maximizing the use of the commercial value generated by the station’s accessibility.

1. Introduction

In the 21st century, urban rail transit has been widely promoted as a green transportation method in many cities, especially in large cities with dense populations and limited land resources, including those in Asian countries such as Shanghai, Chengdu, Chongqing, Bangkok, Thailand, and Kuala Lumpur, Malaysia.
However, overground or elevated urban rail transit, due to its vibration or friction during operation, may generate noise in its surrounding environment [1,2], which has a negative impact on the entire population regardless of age. Such negative impacts include reducing the quality of sleep, causing cardiovascular disease, etc. [3,4,5]. Simultaneously, noises generated by different modes of traffic, including rail transit, may also reduce the price of land and real estate in the surrounding area [6,7]. Reducing the negative impact of noise will not only protect the health of urban residents, but also help to maintain the attractiveness of rail transit and the sustainable development of society and economy.
Many means have already been used for reducing the noise of rail transit. These means can be divided into three categories: the control of the sound source, the control of sound transmission, and the control of the sound-receiving terminal. The first two means include the practices of reducing the vibration of the rail transit vehicle [8], reducing the friction between the vehicle and the rail [9,10], providing an acoustic panel on both sides of the rail line or even covering the whole rail line [11], and using the surrounding vegetation cover to absorb noise [12]. All of these practices can effectively relieve noise, but most of the costs of these measures are, in the end, assumed by residents. Moreover, another method of relieving noise is constructing underground rail transit, but this method involves higher costs than the overground or elevated methods of transit [13,14]. According to certain available studies, constructing rail transit underground is not beneficial to the sustainable development of a city and does not maximize the use of the land value [15]. Additionally, the laying mode of rail transit is not only dependent on a single factor; thus, this topic is outside the scope of our discussion in this paper. In addition to the noise-reduction methods applied for the sound-receiving terminal, such as providing acoustic or sound-insulating installations, some countries or regional governments reduce the noise impact of rail by controlling the urban or suburb construction plan, namely by preventing the construction of real estate properties along the rail line and keeping real estate properties far away from the rail line.
However, the method of conducting urban development by keeping buildings away from the rail line, especially the station site, is in contradiction to the proposal of new urban planners. They propose to conduct a public transit-oriented development mode (TOD) and conduct compact urban development in the area surrounding the station site or along the rail line [16,17]. The benefits of this are already widely recognized: economic land use [18], reducing the number of private cars [19], maximizing economic benefits [20], and working towards the realization of the sustainable development of human settlement. Therefore, there is conflict between the benefits brought about by clustering urban development and construction near rail transit stations or along rail lines and the hazards caused by rail transit noise on the surrounding environment.
Such a conflict can be solved using certain methods, but for traditional noise-reduction methods, such as reducing noise via architectural design or by increasing noise-reduction facilities, the costs are mostly assumed by residents. This is because this kind of information about environmental pollution cannot be rapidly and precisely collected and analyzed [21], and so it is hard to provide legal remedies to all populations suffering from the impact of noise based on this information [22].
One feasible method is to arrange the urban layout according to the difference in sensitivity to noise of different types of land, i.e., arranging the industrial and commercial land that is insensitive to noise around the rail transit line, and arranging the residential land, medical health care centers and other facilities requiring quiet environments in an area far away from the rail transit line. The underlying principle of this is that one’s judgment about noise that is less loud is subjective, and this judgement depends on whether such noises make people fidgety; different activities [23,24], different visual environments [25] and other sounds [26] may all affect the actual degree of a certain noise’s negative effect. This method will also bring another benefit, that is, the concentration of commercial and office buildings around rail stations is usually conducive to land appreciation. In regard to the economic benefits of rail transit stations, studies have concluded that they are highly related to the station’s accessibility [19,27], as well as buildings with different functions that suffer from different impacts and the extent of the rail transit station. According to the studies of Cervero [28] (2001) and Weinstein et al. [29] (1999), being within close distance to rail stations had a higher impact on commercial properties than residential properties. Ghebreegziabiher Debrezion (2007) [20] found that the price of commercial properties was 12% higher than the price of residential properties within a distance of 1/4 mile (approximately 400 m) from a rail transit station.
In this research, we estimated and calculated the negative impact of rail noise on land with different functions and the added value brought by the clustering effect, then attempted to construct an evaluation method. By evaluating multiple land-use layout schemes for a specific parcel around a rail station, we aimed to select a scheme capable of achieving rail transit with a minimal negative impact that would not require incurring higher costs of land for relieving the noise impact.
The structure of this paper is as follows. Section 2 briefly introduces the research scope, experimental process, and research methods including the hedonic price method and noise simulation. Section 3, Section 4 and Section 5 contain the data, evaluation models and results obtained. The last section discusses our findings and links them to other results in the literature.

2. Methods and Materials
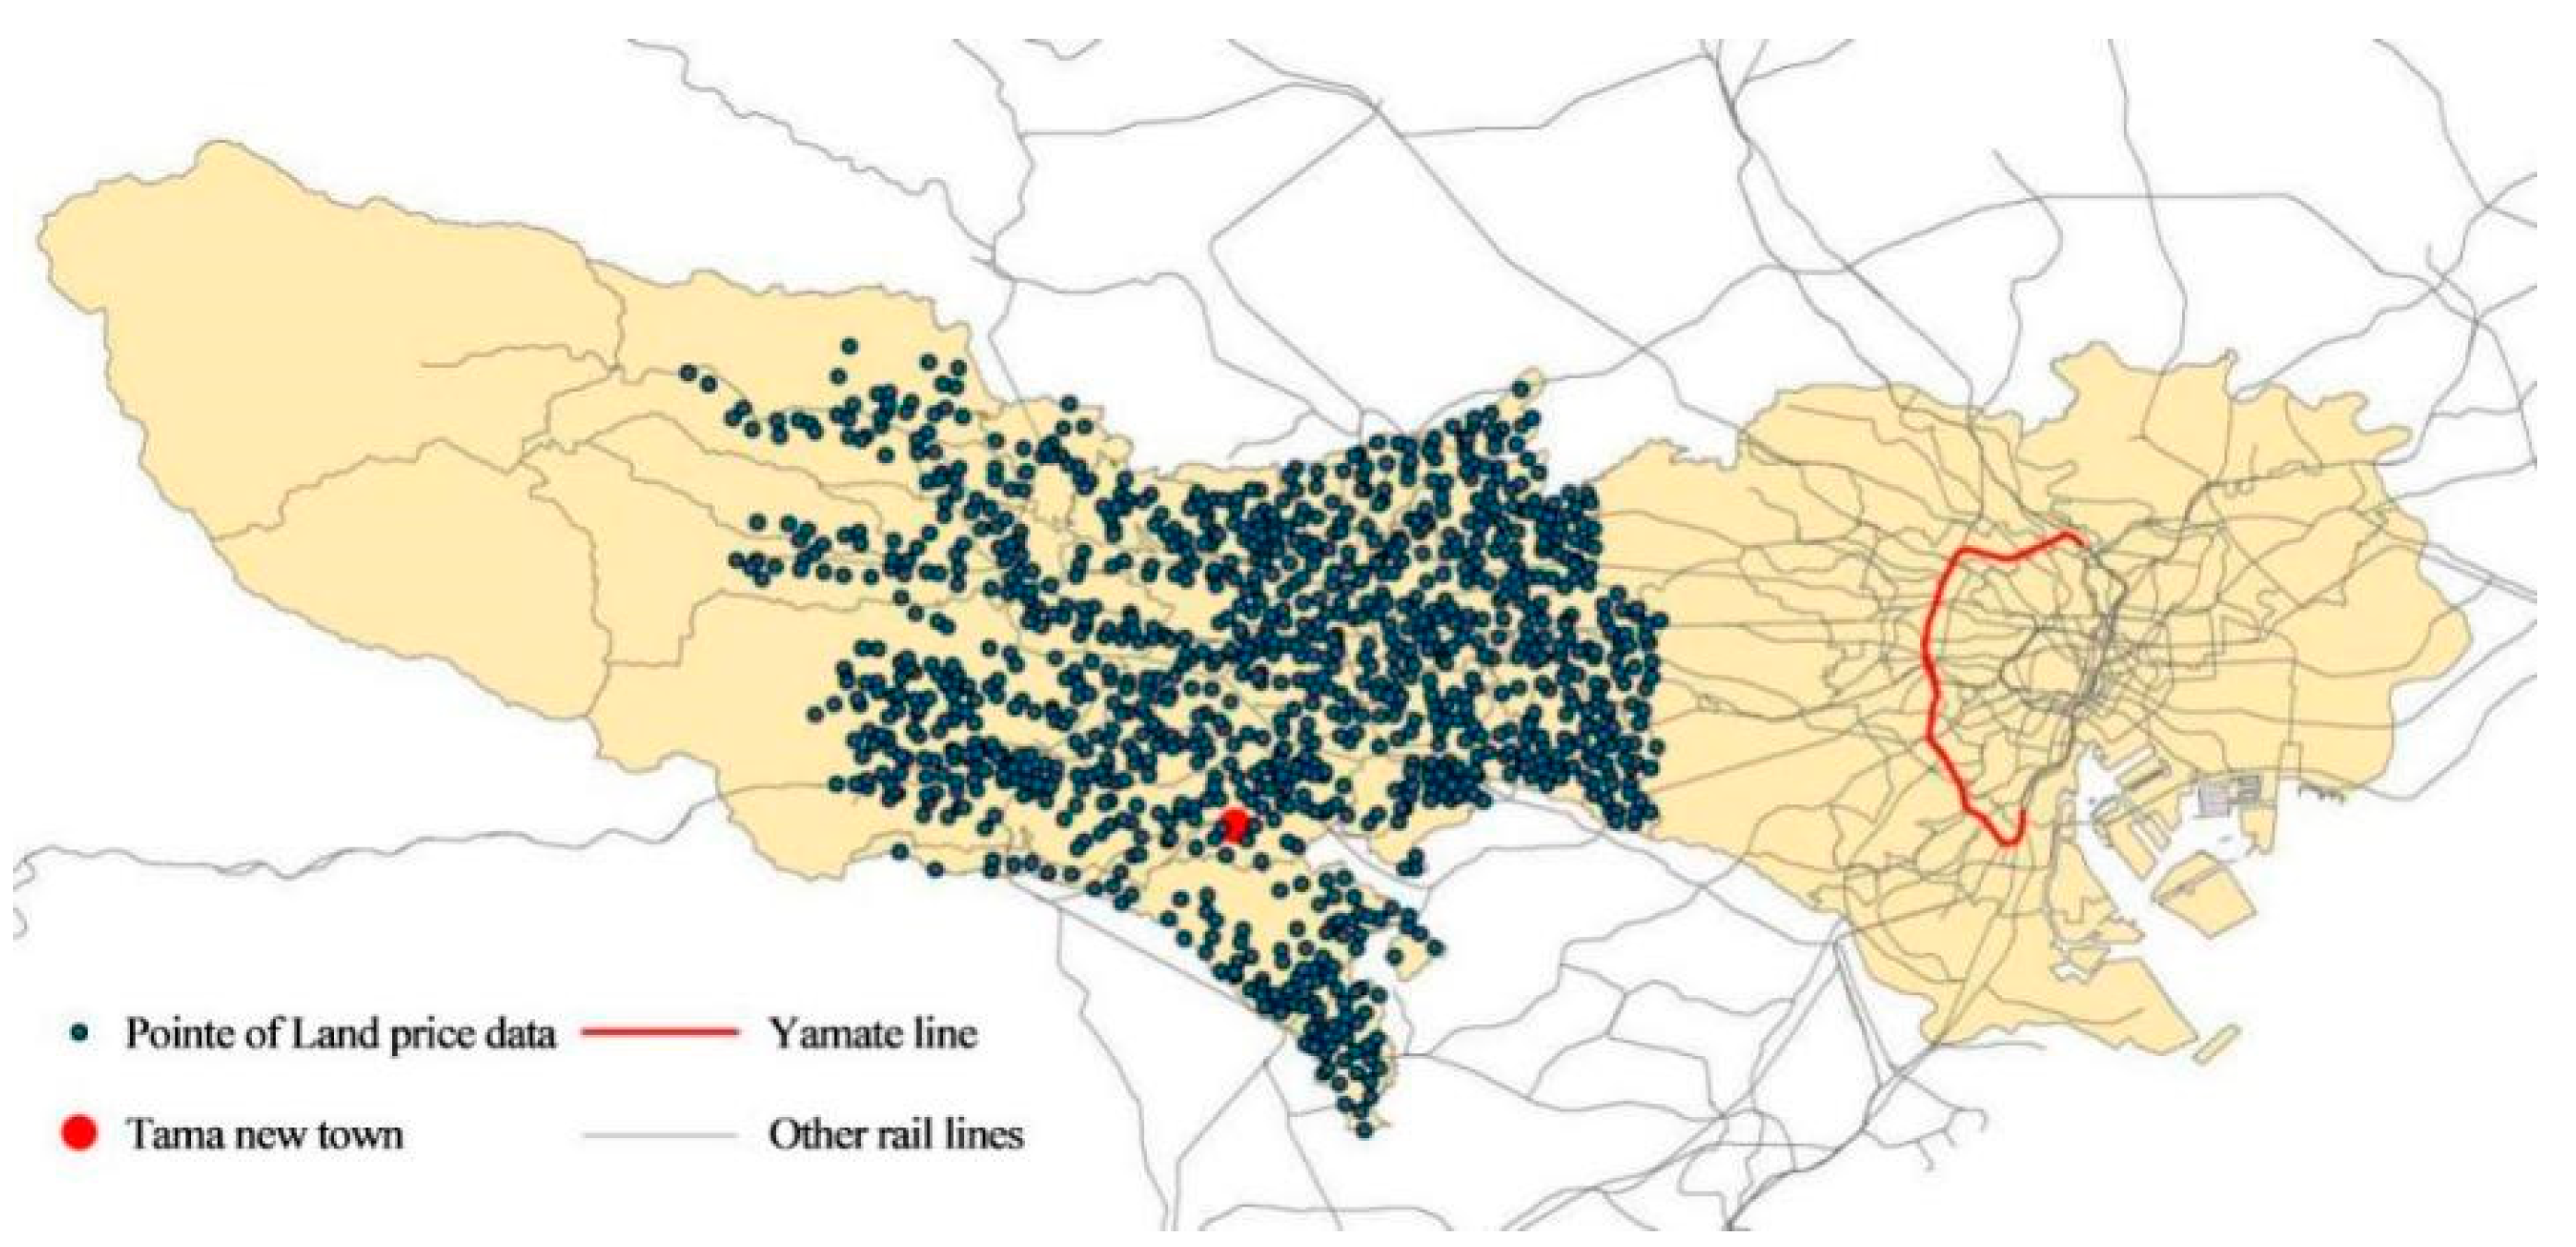
2.1. Research Scope

From the initial development stage of private railways, Japan carried out an integrated construction initiative between the state and cities, and thereby achieved public transit-oriented development (TOD). This included the construction of junction stations with composite functions, the integrated station–city development of rail transit stations around residence communities, and the simultaneous development of the areas along the rail line [30]. In regard to rail transit noise, Japan raised different acoustic environment requirements for lands used for different functions but did not formulate a policy to push back the buildings along the rail transit line. Table 1 shows the many residential lands or the lands with residential functions that are arranged along the rail transit line or around its station sites. These comprised the research objects in this paper.
In the current research, we mainly selected the rail lines in the suburbs of Tokyo for analysis (Figure 1). Most of the rail transit lines laid in the suburbs of Tokyo are of the above-ground style or the elevated style. They meet the requirements of this study, and the above-ground style is preferred in our study. For the relevant rail lines, refer to Table 2.
The impact of two factors on land price, namely accessibility to the rail transit station and the environmental impact, decreased with the increase in the distance. However, one important difference in these two impacts is that the impact of accessibility mainly focuses on the surrounding area of the rail transit station, but the noise impact mainly focuses on the area along the rail transit line.
Regarding the external benefits as a result of the accessibility to the station site, Ghebreegziabiher Debrezion et al. (2007) recognized that the external benefits caused by a close distance to the rail transit station are only present within a distance of no more than 2 miles (3.22 km, unless there were other special conditions,), and the impact within the range of 1/4 mile (400 m approximately) would be especially apparent when adopting the meta-analysis method [20]. Such a range is basically consistent with the comfortable walking range as described by Calthorpe, the proposer of public transit-oriented development (TOD) [16]. Most of the station–city integrated development around the rail transit stations in Japan is concentrated within a walking distance of 750~800 m. In the area near the rail transit stations, commercial development or office functions are carried out, whereas in the area far away from the rail transit station, other functions are carried out [30].
For the rail noise, if it is transmitted without being blocked, it may affect the area within 200 m on both sides of the rail line. In our current research, we performed the actual measurement on the loudness of the noise source of the rail line using the following method: in an area that is a straight-line distance of 5 m to every rail line, and when a train passes by and no other apparent sound occurs in the area (such as automobiles, human voices, etc.), we measured the sounds several times using decibel meters and then calculated their average value. Next, we used the formula below to compute the size of the noise at the sound source (in the formula, the “hurtling” vehicle is deemed as the short-time infinite-line sound source in the infinite acoustic field).
U M = U noise + 10 lg 1 / 2 π d
Here, U M is the measured noise value (db); U noise is the noise source value to be computed (db); and d is the straight-line distance from the measuring point to the noise source (i.e., rail line), which has a value of 5 m in this instance.
For the results, see Table 2.
What is worth noting is that the value to be measured here is not the authentic sound of the source noise, since most of the rail lines had adopted measures such as reducing noise by acoustic enclosures or panels at the sound source. This means that the value measured is the computed value with the existing noise-reduction measures considered. Similarly, based on the data obtained from the previous formula and our investigations (i.e., the data of the sound source at the rail line), we can conclude that in situations where there is no surrounding building as the barrier, most areas 200 m away from the rail line had a noise level lower than 55 db (which was approximately attenuated by 31 db).
Therefore, the impacts of the rail noise and accessibility should be explored separately. In this paper, the areas within the range of 200 m on both sides of the rail line were adopted as the research objects for investigating the impact of the rail noise, and the areas within the range of 800 m in the influencing radius of the station were adopted as the research objects for investigating the impact of accessibility.

2.2. Research Method

(1)
Hedonic Price Method and Multiple Regression Analysis
The hedonic price method is widely used in the study of willingness to pay (WTP) in building environment [32,33] and the evaluation of house prices or land prices [34,35]. It was established by Sherwin Rosen based on his hedonic price index theory [36]. The theory holds that commodities are composed of many different characteristics, and their differences constitute the differences in commodity prices.
The general model of this theory is:
LnP = a i U i + e
In this formula, P is the commodity price; a i is the coefficient of the relationship between commodity characteristics and the price; U i is the characteristic factor of each commodity; and e is the random error variable.
This formula is the same as the statistical analysis method of multiple regression analysis. It refers to the statistical analysis method in which one variable is regarded as a dependent variable and one or more other variables are regarded as independent variables. The quantitative relationship of linear or nonlinear mathematical models among multiple variables is established, and the sample data are used for analysis. The general process of multiple regression analysis includes prerequisite analysis, regression model selection, and the verification of statistical results after obtaining the results.
From the perspective of statistics, the study in this paper belongs to the multiple linear regression analysis of the fixed effect model. The multiple linear regression analysis requires that the totality of the dependent variable meets the normal distribution on every level of combination with the independent variable. In this paper, we drew the histogram according to the independent variable and then observed whether it met the normal distribution.
The characteristic regression function model has three types [10,37,38]: in Table 3, Pi is the price of the “i” land parcel, and it reflects the value of the asset (unit: Yen/m2); Uki is the value of the k attribute of the “i” land parcel; ε i is the random error term; and a 0 , a k is the coefficient to be estimated. The model that is selected will directly affect the calculation result. Firstly, it is necessary to make a selection based on whether the independent variable can be taken as the logarithm; such content already existed in the last process in which the precondition was analyzed. Secondly, it is necessary to make a judgement by conducting every regression estimate according to the data obtained from the investigation. Through the calculation, the model adopted in this paper is the semi-logarithmic model, which will be described in detail later.
Finally, the statistical results need to undergo further F-tests and t-tests to judge whether the regression model is significant. The F-test is a test in which the statistical value obeys the F-distribution under the null hypothesis. It is usually used to analyze a statistical model with more than one parameter to judge whether all or a part of the parameters in the model are suitable for estimating the matrix. The process of the t-test is to test the significance of the difference between the mean of two samples.
In terms of real estate prices, the existing studies using the above methods provide a basis for the data selection in this study. Relevant studies usually divide the value-carrying characteristics of real estate into three types, namely physical characteristics (such as area, floor, age, and the degree of oldness and newness), accessibility (location, surrounding facilities, etc.) and environment (noise, landscape, etc.), and some studies on the impact of noise also use these variables [6,7]. However, most of the existing house price data are second-hand house price data, and these price data have the potential problem that they actually contain the cost of existing house noise-reduction measures. Although most studies have reached the conclusion that noise will have a negative impact on residential house prices, they have not avoided this possible error. In addition, the sample size of house prices is too large, and some characteristic variables related to house prices are difficult to obtain. Combined with the purpose of this study, compared with house prices, land price is selected as a more appropriate dependent variable.
This paper mainly adopts the method of stepwise multiple regression analysis. Its basic idea is to introduce variables into the model one by one. After each explanatory variable is introduced, an F-test is carried out, and a t-test is carried out for the selected explanatory variables one by one. When the originally introduced explanatory variables become no longer significant due to the introduction of later explanatory variables, they are deleted. This is to ensure that only significant variables are included in the regression equation before each new variable is introduced. This process is repeated to ensure that the final set of explanatory variables is optimal. The analysis and experiment were carried out using SPSS 26.0(Statistical Product Service Solutions, a series of software products launched by IBM for statistical analysis, data mining, predictive analysis and decision support tasks).
(2)
Acoustic environment simulation
After generating the evaluation model, we selected Futako Tamagawa Station in a suburb of Tokyo as a specific example. On the basis of keeping the floor area ratio, building density, building height, functional ratio and other indicators unchanged, different schemes were generated through the change of the land layout, and the differences in land value caused by accessibility and noise were compared. In this process, we needed to simulate the track’s noise environment.
In order to truly reflect the noise reflection, shielding and other differences formed by different schemes, we used SEDU software to simulate the propagation of track noise in outdoor space, and we took the maximum noise value received by the buildings located in the plot as the noise value of the plot. SEDU is an environmental noise analysis software for professional buildings, which is built on the AutoCAD platform. Based on three-dimensional modeling, SEDU carries out environmental noise calculation and simulation through the setting of noise sources, obstacles, surrounding buildings and other content.

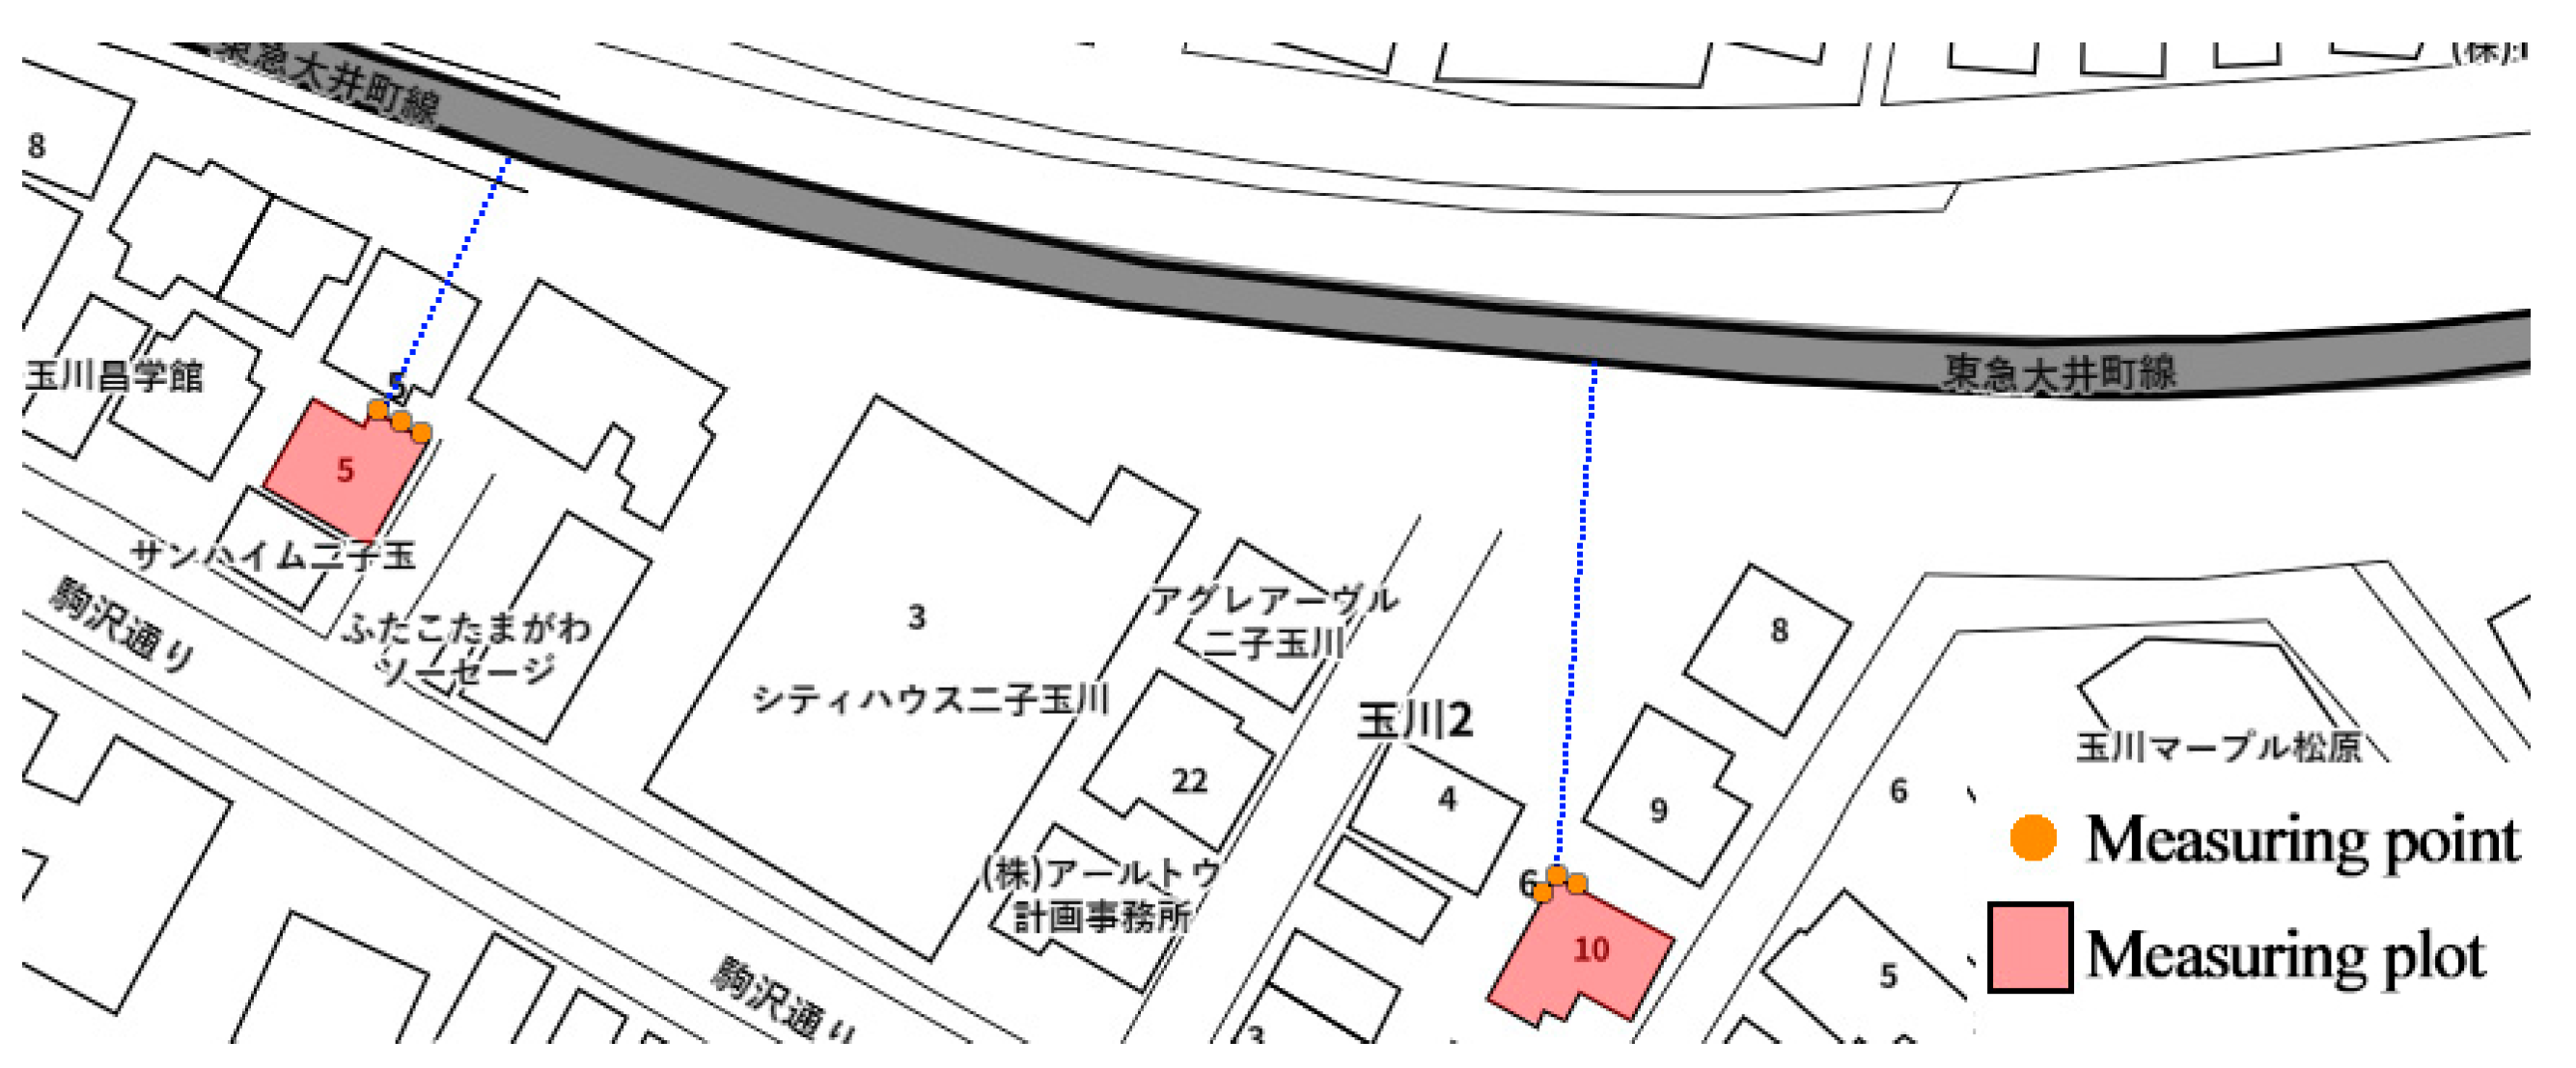
2.3. Data Acquisition

Although the functions of residential land price and commercial land price are different, they have many common influencing factors, and sometimes affect each other.
Location factors have a significant impact on both residential and commercial land price. For example, it is most intuitively reflected in the distance between the plot and the urban center and adjacent sub centers [39,40,41]. Some studies have pointed out that this phenomenon is related to employment distribution [42] and the level of supporting facilities [43].
There are also rich discussions on the impact of rail transit on location change. It is generally believed that it can improve the residential land price along the rail line [44,45]. This impact is summarized as the changes it brings to urban space-time accessibility [46], Which means, the location factor is essentially a “space-time” location, and rapid transit improves the centrality of space-time location along the line through the compression of travel time.
In addition, the influencing factors of residential land price are also potentially related to demographic, economic and government behavior factors [47], these factors include population density and quality level, cultural, educational and service facilities, as well as relevant laws and policies. At the same time, some studies have shown that different urban pollutants will also damage the land price [48].
This study collects and calculates the data related to noise and station accessibility and lists other influencing factors as much as possible. Limited by the difficulty of data acquisition and based on the existing research described above and the availability of data, we initially adopted the characteristic variables as shown in Table 4. Among them, the 2019 land price data, building density, plot ratio, walking distance from the rail station, passenger flow at the station, geographical coordinates, etc. of the suburb areas of Tokyo are obtained from the official website of Japan’s Ministry of Land, Infrastructure, Transport and Tourism (Figure 2). By importing the above data into the ArcGIS platform and unifying the coordinate system, we can further calculate the distance from the central urban area, the distance from the track line, the distance from the primary school, the distance from the junior middle school, the commerce-supporting facilities and other data. These data will be further screened in each specific part of the study.
In Table 4, Uwalking and Ustation are alternative variables for characterizing the station’s accessibility. Later, one of them will be selected through correlation analysis to represent station accessibility for further regression analysis.
In the field measurement of the noise loudness data of the land price data points, it is necessary to avoid the difference caused by the measurement height and reduce the interference of other environmental noise as much as possible. At the same time, due to the restriction wherein it is impossible to go deep into the interior of all plots for measurement due to the ownership of the plot, the measurement method is used to select three ground measurement points closest or closer to the straight line of the track line at the plot boundary of each land-price data point. Each measurement point measures the noise value of rail vehicles at a constant speed five times, then takes its average value, and finally selects the maximum value of the three measurement points as the noise loudness data (Figure 3).
The variable Unoise is the level of noise loudness, and its rule is as follows: starting from 45 dB, the noise level will increase one level if the noise increases 5 dB every time. In other words, if L ≤ 45 dB, then Unoise = 0; if 45 dB < L ≤ 50 dB, then Unoise = 1; if 50 dB < L ≤ 55 dB, then Unoise = 2……, and so on.

3. Analysis Process

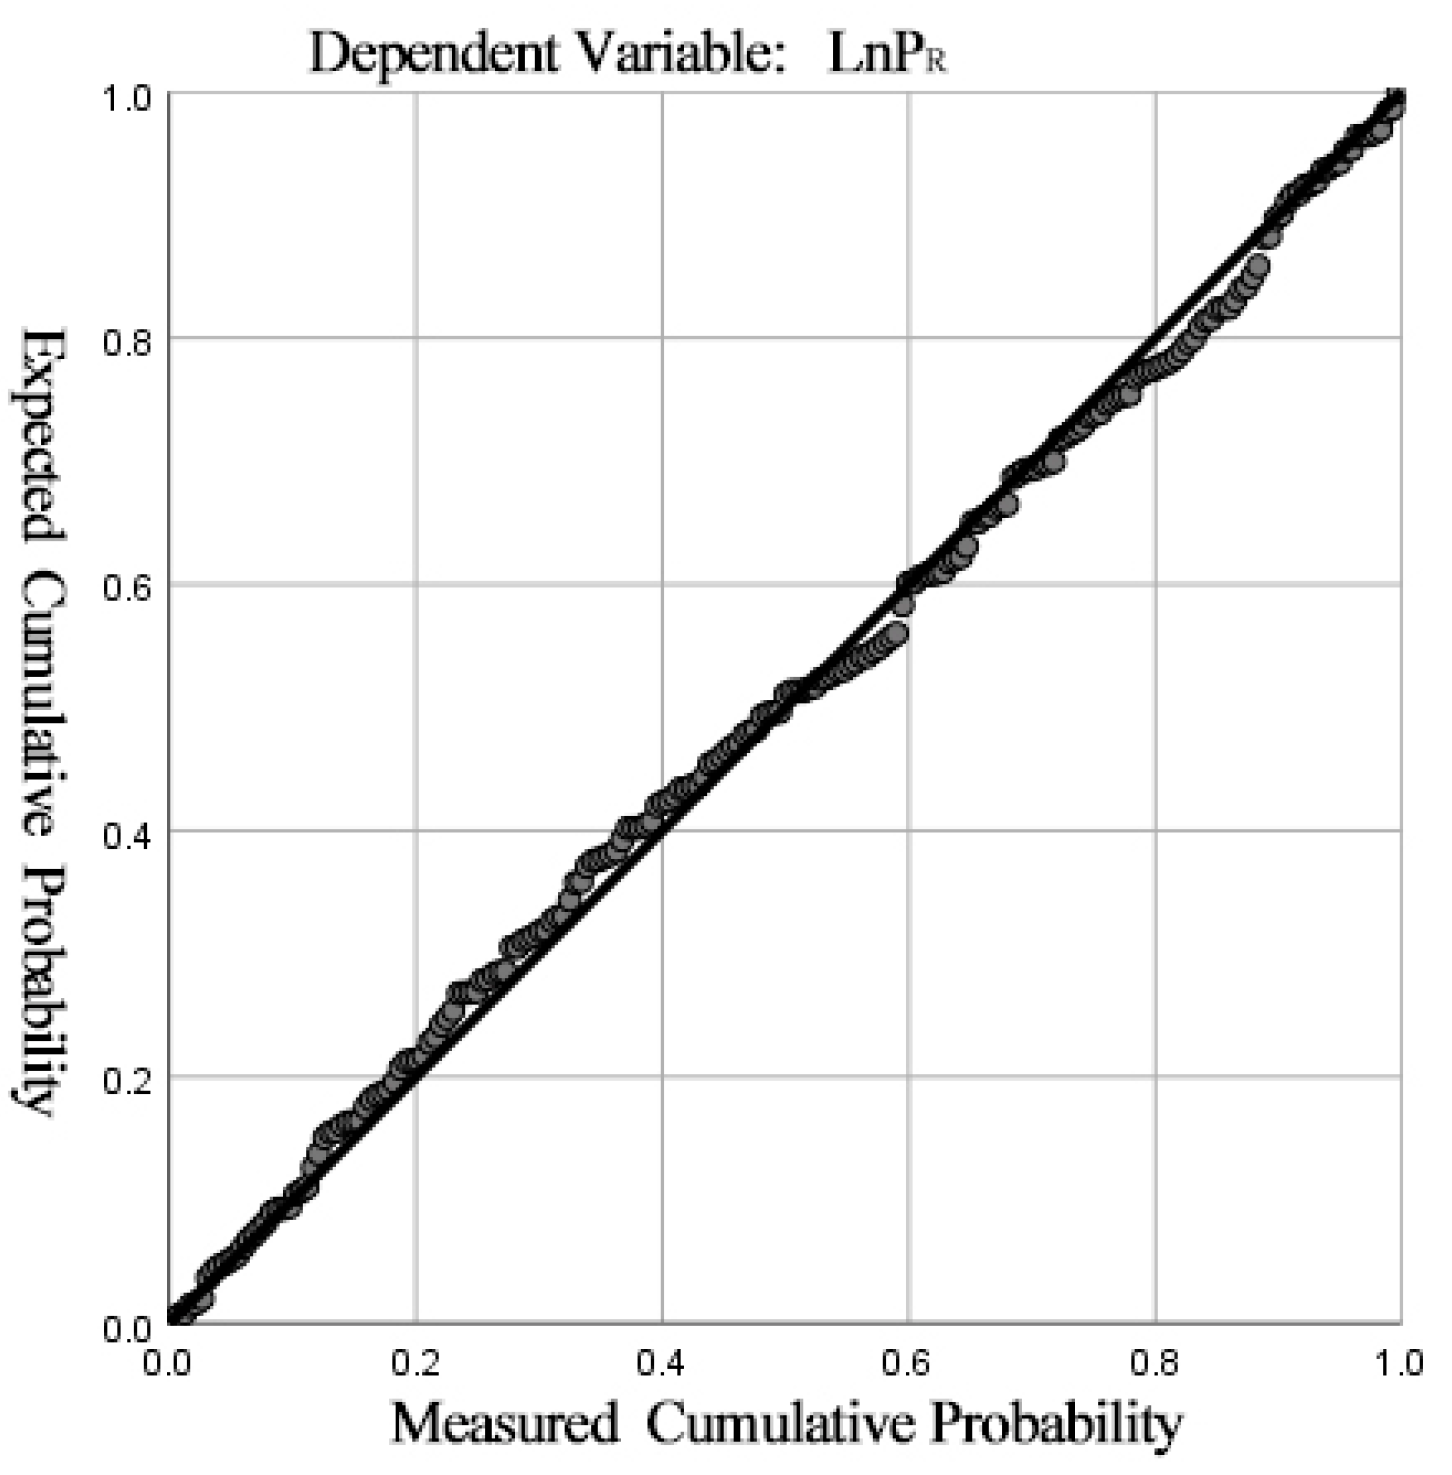
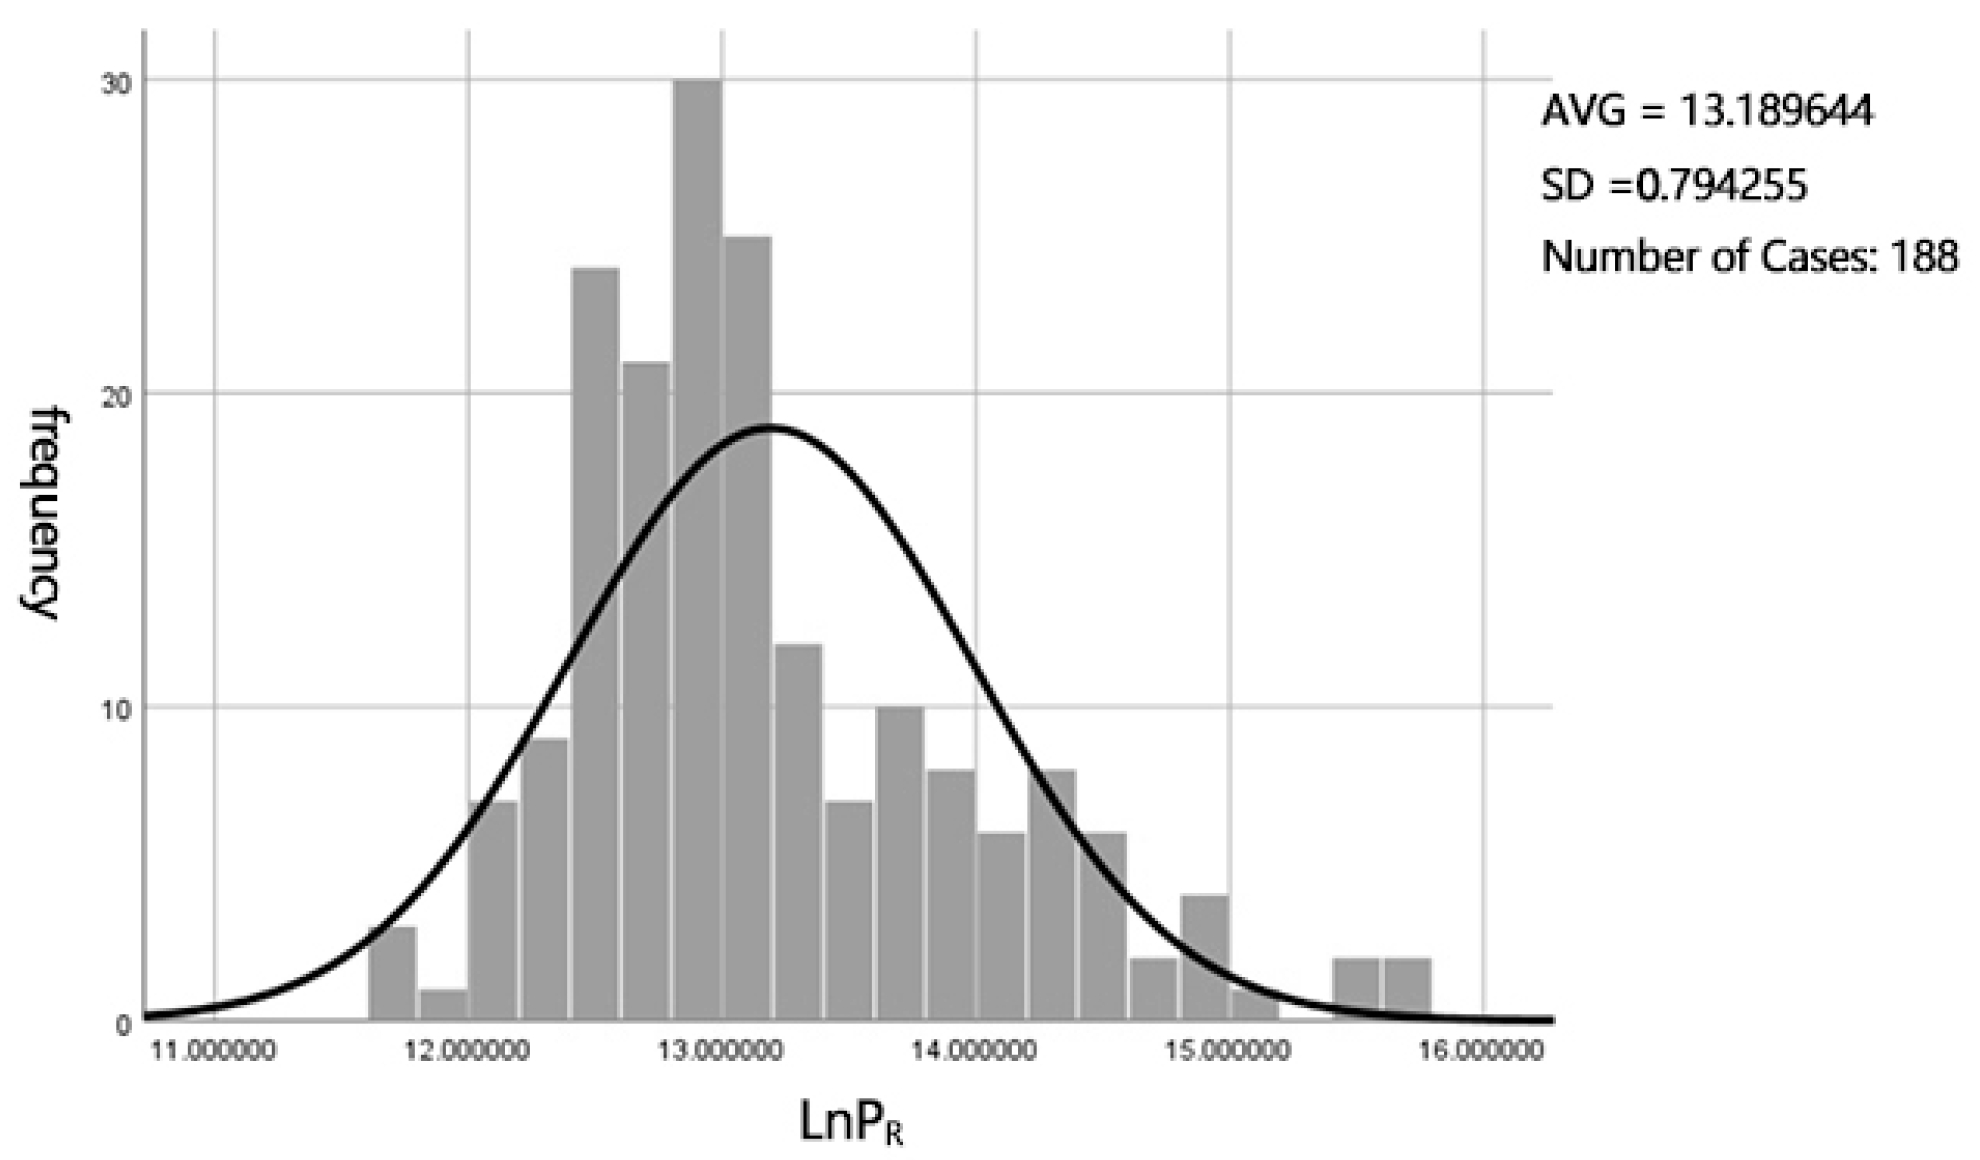
3.1. Regression Analysis of the Influence of Noise on Land Prices

In this part of the study, we conduct a regression analysis on the land price and its influencing factors within 200 m on both sides of the suburban rail transit line in Tokyo. In the data screening, we found that the number of commercial plots in this range is very small, which is due to the fact that ① there are few data counted by plots at the 200 m scale and ② the data are based on the sample survey data of the Japanese government.
Through ArcGIS, we selected 199 parcel data points with land price data 200 m away from the periphery of the track line, and the variables involved include geographical position data, supporting service data, land-use data and noise data in Table 4. By forming the histogram of the variable “lnPR” by taking the logarithm of the residential land price “PR”, it can be seen that the variable “lnPR” meets the requirements of normal distribution and meets the conditions of using stepwise regression analysis (Figure 4).
Firstly, the Pearson correlation coefficient calculated in SPSS software was further screened for characteristic variables, and the results are as shown in Table 5: within 200 m from the track line, the distance between the plot and Yamanote line is the most relevant among all location factors and has no significant correlation with variables such as the distance between the plot and the track line, and the distance from the primary school and the junior middle school. In addition, there is a high correlation between the independent variable of the plot ratio and building density, and the independent variable of noise and the distance from the track. Therefore, the five variables UPS, UJHS, Urail, UFAR, and Ustation are screened out.
Then, we carried out a stepwise regression analysis on the remaining variables. The results of the stepwise regression analysis retained Unoise, Ustation, Uwalking, UYamanote and Ucommerce as the final variables, and we obtained their coefficients (Table 6). Figure 5 shows that the standardized residual of this regression analysis conforms to the normal distribution.
In summary, the formula for the effect of rail noise on the price of residential housing within 200 m of the rail line can be obtained:
ln P R = 12.916 + a k U k 0.038   U noise + e
where Uk refers to other characteristic variables other than track noise, and ak is its coefficient.

3.2. Regression Analysis of the Influence of Station Accessibility on Land Price

An impact analysis of station accessibility on land price was carried out within the 800 m influence radius of the railway stations. The specific methods and steps are basically the same as the former, and respective regression analyses of the commercial land price and residential land price were carried out.

3.2.1. Commercial Plot

Compared with the commercial plots in the downtown area and residential plots in the suburbs, the commercial plots in the suburbs of Tokyo not only have fewer data, but their distribution is also highly coupled with the distribution of rail stations, which corresponds to the actual situation of the more mature TOD development in Japan (Figure 6). Using ArcGIS, 204 pieces of data on commercial plots located 800 m away from the periphery of the railway station are screened. The selected variables mainly include geographic position data, land-use data, population data, station data and noise data. By making the histogram of the variable “lnPB” in SPSS (Figure 7), it can be seen that the commercial land price is roughly normally distributed, so the characteristic variable model in a semi-logarithmic form can be used for further analysis.
Pearson correlation analysis results are shown in Table 7. The price of commercial land within the 800 m radius of the suburban rail transit station in Tokyo is highly correlated with the passenger flow and plot ratio of the station. There is a very weak negative correlation between track noise and commercial land price, which proves that track noise has little negative impact on commercial land price. The correlation between the commercial land price and the walking distance between the plot and the station is not significant, but greater with the straight-line distance. The reason will be discussed below. Here, the straight-line distance between the plot and the station will be selected as the characteristic index of the station’s accessibility.
After screening out the three variables Unoise, U2015 and Uwalking, the screened factors were subjected to stepwise regression analysis, and the analysis results are shown in Table 8 and Table 9. Through the detection of the regression results in Figure 8, it is considered that the standardized residual basically conforms to the normal distribution.
To sum up, within the influence range of an 800 m radius of the rail station, the formula for the impact of the distance from the rail station on commercial land prices is as follows:
ln P B = 13.365 + a k U k 0.001 U station + e

3.2.2. Residential Plot

As mentioned above, many studies have argued that the impact of characteristic accessibility variables on residential land prices is far less obvious than that of commercial land located near rail stations. We selected the residential plot data within the influence range of 800 m of the suburban rail transit station in Tokyo (PR800) for verification to confirm whether the impact of accessibility on residential land prices needs to be taken into account in the construction of the model. The Pearson correlation analysis between various factors and land prices shows that, within the 800 m radius of suburban rail transit stations, both the walking distance between the plot and the station and the straight-line distance between the plot and the station have little correlation with the residential land prices (Table 10).

3.3. Evaluation of the Land-Use Layout Scheme Based on the Noise Impact

The purpose of our current research is to establish a concise evaluation model and select the preferred land-use schemes of the same land parcel. However, when planning and designing a determined land parcel, its various indicators, namely plot ratio, building density, building height, and function ratio, are usually limited by a master plan, so there is no huge difference in the different schemes of these characteristic variables. On this precondition, the difference in the land price under different schemes of the core area within an 800 m radius of the rail transit station is mainly manifested as the sum of the difference in the land price caused by the difference in the commercial area and accessibility and the difference in the land price caused by the difference in the noise impact of the residential areas.
In the re-development process of Tokyo, Japan, the strategy of integrating the station city was adopted, and many stations with rich surrounding functions and formats were formed, among which residential, commercial and office are the main components. This article uses Futako Tamagawa Station in the suburbs of Tokyo as a case study. By changing the land layout plan and keeping other characteristic variables unchanged, different plans can be generated, and the changes of land prices in different plans due to changes in noise environment and site accessibility are estimated and compared.
The main reasons for choosing Futako Tamagawa Station as an example are: (1) Futako Tamagawa Station in Setagaya City, Tokyo, Japan is the main station of the electric Tokyo Den-en-toshi Line and Oimachi Line. Heavy traffic and faster running speed mean it There is a large noise impact (Table 2); (2) Most of the site re-development cases in Japan are dominated by commercial and office functions. In contrast, the residential function in this case has a high proportion, and the site is within 800 m around the site. An independent plot composed of three high-rise residential buildings (Table 11) is formed in the plot, which provides a valuable sample for research; (3) The track line turns near the plot, which makes the received noise range of the plot larger, which also means Changes in spatial layout may have a more pronounced impact on plots (Figure 9).

3.3.1. Case Introduction

In the 1980s, Japan’s focus on incremental construction dominated by development gradually turned into a focus on stock renewal dominated by re-development, and the re-development business in the eastern region of Futako Tamagawa in the Tokyo Den-en-toshi Line was proposed in this context. The range of the re-development project approximately covers an area of 18.4 hectares, and it stretches out toward the southeast from the east of Futako Tamagawa Station and reaches to the park of Tamagawa. Such a re-development program in the area via urban design optimized the land functions (setting the commercial area in the front and the residential houses in the back), and connected parks with commerce, residential houses, and office buildings by the space corridor, creating a ribbon street to maximize the flow of passengers [49].
Basically, the re-development range is in the core area 500 m away from the station (Figure 9), and its main contents include: Block 1, comprising a station, its neighboring three shopping malls, and an office building; Block 2, comprising a super high-rise office building and one high-rise hotel; and Block 3, comprising three high-rise apartments. Futakotamagawa Park was built outside Block 3. Moreover, an overpass called a “ribbon street” goes across the inside of the land parcel, connecting three blocks and the park (Figure 9).
The intensity of the development is reduced as the ring increases (Figure 10); that is, the commercial buildings are the highest, and the residential buildings are the lowest. However, this is reversed according to the development capacity (Table 11). The commercial area is nearest to the station, which was developed by using passenger flow to the maximum extent. Following this are the commercial offices, which are not very sensitive to the impact of noise. The residential area is in the outermost area, which is shielded by the commercial and office buildings nearest to the elevated line, where the rail noise can be almost eliminated.

3.3.2. Multiple Scheme Generation and Comparison

In this paper, three different layout schemes were proposed based on the original development plan, and four schemes including the original scheme were made using the sound-environment simulation analysis, and then we valued the straight-line distance from the central point of every land parcel in different schemes to the rail transit station. These three schemes maintain the same functional proportion and main building form as the current situation, so as to minimize the interference of factors other than land use on the results (Figure 11).
Based on the aforementioned model, the land price loss caused by the increasing distance from every commercial area to the rail transit station can be calculated, including the land price loss of every residential area caused by the noise impact.
Therefore,
Δ P sum = S i Δ P Ri + S j Δ P Bj
ΔPSUM means the total land price losses caused by the impact of noise and the distance to the rail transit station. ΔPRi means the area of the ith residential plot. Sj is the area of the j-th commercial plot. ΔPBj is the value of the loss in land price caused by the distance from the station of the j-th commercial plot.
The final calculation result is shown in Table 12.

4. Results and Discussion

In the analysis on noise impact, Formula (1) reflects that the extent of rail noise is negatively correlated to the land price within 200 m of the rail transit line. In the analysis on the impact on accessibility, Formula (2) reflects that the land price of commercial land within 800 m of the rail transit station is negatively correlated to the distance to the rail transit station; that is, the closer the area is to the rail transit station, the higher the land price is. However, Table 10 reflects that the difference caused by the impact of station accessibility on the land price of the residential area within the area is not huge.
In the scheme deduction, noise simulation and evaluation analysis of Tokyo’s Futako Tamagawa Station, by comparing various schemes, we can see that in the original scheme, the relative loss in land prices was the lowest; considering the impact of noise on residences and the impact of distance to the rail transit station on the commercial area, the land-use layout pattern of the built scheme is optimal. The relative losses in the land price in Scheme 3 were at their maximum, which was in accordance with expectations. In the scheme, the commercial area was not arranged according to the station, so the commercial value was not sufficiently used. Moreover, the residential area was approaching the rail line, so the noise impact was not weakened by the rational layout. Such results verified the rationality of the original scheme, i.e., using the commercial land that is insensitive to noise as the shield of the residential area can reduce the noise-reduction costs required by the residential area while sufficiently using the external benefits brought about by the station’s accessibility. What is necessary to note is that the evaluation model adopted in this paper was established on the basis of the data of the suburbs of Tokyo; therefore, the method should be used in other cities on the basis of collecting and analyzing local data, instead of using the data in this paper directly. Simultaneously, the land layout scheme needs to consider diversified factors, so the evaluation results obtained in this paper can not replace the final results obtained from the comprehensive evaluation of the scheme.
Many contents in the aforementioned analysis are worthy of our discussion.
In regard to the impact of accessibility on land price, we found the straight-line distance to the station site, compared with the walking distance to the station site, was more appropriate for representing the station’s accessibility. It does not deny the consensus of new urbanists and economists [19,50], namely that the commercial value around the station site is highly correlated to walking accessibility. In our study, the data of walking distance from the targeted land parcel to the rail transit station were obtained directly from the official website of the Ministry of Land, Infrastructure, Transport and Tourism in Japan. These data represented the walking distance from the aboveground road to the rail transit station. However, in the suburbs of Japan, most of the areas around the station site, namely the ones with higher commercial value, had adopted the combined facilities to put the commercial land and the station in direct contact. Table 13 sorted out the station–city integrated combination modes of certain stations along the rail transit line in the suburbs of Tokyo. According to these forms, we divided the combination mode into three types, i.e., the line type, branch type and face type, aiming to provide a clear demonstration. From this, we find that some middle stations with relatively lower commercial value still adopted the combined mode of overpasses and underpasses, or a station-oriented commercial complex, which made the actual walking distance from the commercial land to the station site closer than the straight-line distance from the commercial land to the station site. In the current research, Tokyo’s Futako Tamagawa Station was built with a ribbon crossing, i.e., an overpass connecting three street blocks with Tokyo’s Futakotamagawa Park, which shortens the walking distance from the local land to the station site.
What needs to be added is that there are still some deficiencies in this study. In the analysis on Tokyo’s Futako Tamagawa Station, we found that the architectural design of Tokyo’s Futako Tamagawa Station, in addition to its land-use layout, had also adopted a functionally vertical distribution. However, the current research did not consider this distribution; the acoustic environment of high-rise residential buildings around the station site is different from that on the ground layer, so vertical correction is required when simulating noise [51]. Additionally, for any noise-reduction method, its potential synergies and tradeoffs with the other impacts are diverse and complex. For example, the noise-reduction method proposed in this paper may affect people’s psychological feelings about the space environment by affecting the architectural layout, which still needs a lot of practice and data to prove. Thus, these are important directions for further research.

5. Conclusions

Many previous studies on the reduction of rail transit noise focused on the design of facilities or the surrounding architecture. Although reducing the negative impact of noise by optimizing the land-use layout has been carried out in many practices, it still lacks profound consideration by quantitative research. For the needs of urban development in densely populated areas of Asia, in our current research, we analyzed the impact of accessibility, noise and other characteristic variables on land price; we thereby established an evaluation model and conducted an example verification on the land parcels around Tokyo’s Futako Tamagawa Station.
The results therefrom verified the rationality of such a strategy, that is, the setting of the commercial land or other lands that are insensitive to noise but more impacted by accessibility around the rail transit station could reduce, or even eliminate, the disadvantageous impacts of noise on residential buildings and can achieve more economic benefits at the same time.

Author Contributions

Z.Z., writing—original draft, completed the field research and wrote the paper. M.Y., leader of the original research group, contributed to the Methodology and supervised the paper, provided key data. Y.L., writing—reviewing and editing. All authors have read and agreed to the published version of the manuscript.

Funding

This study was funded by National Nature Science Foundation of China (No: 51478198).

Institutional Review Board Statement

Not applicable.

Data Availability Statement

Publicly available datasets were analyzed in this study. This data can be found here: [https://nlftp.mlit.go.jp/ksj/index.html]. And the methods and results of noise data acquisition have been given in the article.

Acknowledgments

This study was supported by Key Laboratory of ecological construction of Xiamen, China and Fujian Key Laboratory of ecological human settlements along the southeast coast of China.

Conflicts of Interest

The authors declare no conflict of interest.

References

  1. Chen, Z. The Impact of Urban Rail Transit on Ecological Environment. China Railw. Sci. 2001, 22, 126–132. [Google Scholar]
  2. Yin, H. Study on U-Shaped Beam Structure Noise and Shielding Effect of Beam Body on Wheel-Rail Noise. Master’s Thesis, Southwest Jiaotong University, Chengdu, China, 2014. [Google Scholar]
  3. Erickson, L.C.; Newman, R.S. Influences of Background Noise on Infants and Children. Curr. Dir. Psychol. Sci. 2017, 26, 451–457. [Google Scholar] [CrossRef] [PubMed]
  4. Dratva, J.; Phuleria, H.C.; Foraster, M.; Gaspoz, J.-M.; Keidel, D.; Künzli, N.; Liu, L.-J.S.; Pons, M.; Zemp, E.; Gerbase, M.W.; et al. Transportation Noise and Blood Pressure in a Population-Based Sample of Adults. Environ. Health Perspect. 2012, 120, 50–55. [Google Scholar] [CrossRef]
  5. Petri, D.; Licitra, G.; Vigotti, M.A.; Fredianelli, L. Effects of Exposure to Road, Railway, Airport and Recreational Noise on Blood Pressure and Hypertension. Int. J. Environ. Res. Public Health 2021, 18, 9145. [Google Scholar] [CrossRef] [PubMed]
  6. Ahlfeldt, G.M.; Nitsch, V.; Wendland, N. Ease vs. Noise: Long-Run Changes in the Value of Transport (Dis)Amenities. J. Environ. Econ. Manag. 2019, 98, 102268. [Google Scholar] [CrossRef] [Green Version]
  7. Andersson, D.E. Hypothesis Testing in Hedonic Price Estimation—On the Selection of Independent Variables. Ann. Reg. Sci. 2000, 34, 293–304. [Google Scholar] [CrossRef]
  8. Kitahara, A.; Ishikawa, S.; Shimizu, A. The latest trends in tire vibration and noise reduction technology. Tribologist 2020, 65, 153–158. [Google Scholar] [CrossRef]
  9. Saito, M.; Shiraishi, N.; Wakabayashi, Y.; Kurita, K.; Fujimoto, T.; Ichikawa, Y. Development of Low Noise Brake Discs for Shinkansen. Proc. Environ. Eng. Compr. Symp. 2019, 29, J109. [Google Scholar] [CrossRef]
  10. Hongqiang, L.; Xiaoping, W. Research on Urban Rail Transit Noise and Its Control. Noise Vib. Control 2007, 27, 78–82. [Google Scholar]
  11. Baohong, S. Noise and Vibration Control Countermeasures of Urban Rail Transit. Environ. Sci. Manag. 2005, 30, 7–9. [Google Scholar]
  12. Jiani, L. Research on the Noise Reduction Function of Garden Plants; Zhejiang University: Hangzhou, China, 2007. [Google Scholar]
  13. Fei, C.; Bizhuang, C. Research on the Connotation and Analysis Points of Transportation Cost. Transp. Transp. Ed. 2011, 27, 147–149. [Google Scholar]
  14. Flyvbjerg, B.; Bruzelius, N.; van Wee, B. Comparison of Capital Costs per Route-Kilometre in Urban Rail. arXiv 2013, arXiv:13036569. [Google Scholar]
  15. Wei, Z.; Xiafei, Y. Statistical Analysis of Urban Rail Transit Route Laying Mode—Research Report 6 Based on Data Analysis of China Urban Rail Transit Association. Urban Rail Transit Res. 2019, 22, 1–6. [Google Scholar]
  16. Calthorpe, P. The Future American Metropolis; China Construction Industry Press: Beijing, China, 2009; ISBN 978-7-112-10935-7. [Google Scholar]
  17. Taylor, E. The New Urbanism Charter; Electronic Industry Press: Beijing, China, 2016; ISBN 978-7-121-28247-8. [Google Scholar]
  18. Calthorpe. Urbanism in the Time of Climate Change; China Construction Industry Press: Beijing, China, 2012; ISBN 978-7-112-14532-4. [Google Scholar]
  19. Cervero, R.; Kockelman, K. Travel Demand and the 3Ds: Density, Diversity, and Design. Transp. Res. Part Transp. Environ. 1997, 2, 199–219. [Google Scholar] [CrossRef]
  20. Debrezion, G.; Pels, E.; Rietveld, P. The Impact of Railway Stations on Residential and Commercial Property Value: A Meta-Analysis. J. Real Estate Financ. Econ. 2007, 35, 161–180. [Google Scholar] [CrossRef] [Green Version]
  21. Yamamoto, T. A Case Study of Cost Effectivenes Analysis of Environmental Information. Stud. Reg. Sci. 1985, 16, 53–69. [Google Scholar] [CrossRef]
  22. Ming, Y. On the Legal Prevention and Remedy of Noise Pollution; University of International Business and Economics: Beijing, China, 2005. [Google Scholar]
  23. Yuqin, S. Research on the Influence of the Perception of Space Near People in Living Streets on the Evaluation of Road Traffic Noise; Dalian University of Technology: Dalian, China, 2021. [Google Scholar]
  24. Desidério, P.; Romão, B.; Oliveira, P. Municipal Strategy for Noise Reduction in Nightlife Establishments—Case Study Lisbon. In INTER-NOISE and NOISE-CON Congress and Conference Proceedings; Institute of Noise Control Engineering: West Lafayette, IN, USA, 2019; Volume 259, pp. 2524–2531. [Google Scholar]
  25. Wenjing, N. Research on the Influence of Visual Factors on the Subjective Annoyance of Environmental Noise; Tianjin University: Tianjin, China, 2014. [Google Scholar]
  26. Han, C. Research on the Influence of Music on Human Comfort and Work Efficiency in Noise Environment; Qingdao University of Technology: Qingdao, China, 2018. [Google Scholar]
  27. Qiannan, W.; Xiafei, Y. The Relationship between Urban Rail Transit Accessibility Improvement and Housing Price Appreciation. J. Tongji Univ. Sci. Ed. 2016, 44, 899–906. [Google Scholar]
  28. Cervero, R.; Duncan, M. Rail Transit’s Value Added: Effect of Proximity to Light and Commuter Rail Transit on Commercial Land Values in Santa Clara County California; National Association of Realtor Urban Land Institute: Washington, DC, USA, 2001; Volume 1805, pp. 8–15. [Google Scholar]
  29. Weinstein, B.L.; Clower, T.L. The Initial Economic Impacts of the Dart Lrt System; UNT Center for Economic Development and Research: Denton, TX, USA, 1999. [Google Scholar]
  30. Nikken Design Research Association for Integrated Station-City Development. Integrated Station-City Development: A New Generation of Public Transport-Oriented Urban Construction: Integrated Station-City Development: The Next Advances of TOD; China Architecture and Construction Press: Beijing, China, 2014; ISBN 978-7-112-16286-4. [Google Scholar]
  31. Ministry of the Environment of Japan Environmental Standards for Noise. Available online: http://www.env.go.jp/hourei/07/ (accessed on 20 April 2022).
  32. Chan, E.; Yiu, C.Y.; Baldwin, A.; Lee, G. Value of buildings with design features for healthy living: A contingent valuation approach. Facilities 2009, 27, 229–249. [Google Scholar] [CrossRef]
  33. Chan, E.; Lam, K.S.; Wong, W.S. Evaluation on indoor environment quality of dense urban residential buildings. J. Facil. Manag. 2008, 6, 245–265. [Google Scholar] [CrossRef]
  34. Fujita, M. Urban Economic Theory; Cambridge University Press: Cambridge, UK, 1989. [Google Scholar]
  35. Bowes, D.R.; Ihlanfeldt, K.R. Identifying the Impacts of Rail Transit Stations on Residential Property Values. J. Urban Econ. 2001, 50, 1–25. [Google Scholar] [CrossRef]
  36. Rosen, S. Hedonic Prices and Implicit Markets: Product Differentiation in Pure Competition. J. Political Econ. 1974, 82, 34–55. [Google Scholar] [CrossRef]
  37. Chen, H.; Rufolo, A.; Dueker, K.J. Measuring the Impact of Light Rail Systems on Single-Family Home Values: A Hedonic Approach with Geographic Information System Application. Transp. Res. Rec. 1998, 1617, 38–43. [Google Scholar] [CrossRef]
  38. Cervero, R.; Duncan, M. Transit’s Value-Added Effects: Light and Commuter Rail Services and Commercial Land Values. Transp. Res. Rec. 2002, 1805, 8–15. [Google Scholar] [CrossRef]
  39. Kain, J.F.; Quigley, J.M. Measuring the value of housing quality. J. Am. Stat. Assoc. 1970, 65, 532–548. [Google Scholar] [CrossRef]
  40. Buck, A.J.; Deutsch, J.; Hakim, S.; Spiegel, U.; Weinblatt, J. A von Thünen model of crime, casinos and property values in New Jersey. Urban Stud. 1991, 28, 673–686. [Google Scholar] [CrossRef]
  41. Kim, J.; Zhang, M. Determining transit’s impact on Seoul commercial land values: An application of spatial econometrics. Int. Real Estate Rev. 2005, 8, 1–26. [Google Scholar] [CrossRef]
  42. Yang, T.; Jin, Y.; Yan, L.; Pei, P. Aspirations and realities of polycentric development: Insights from multi-source data into the emerging urban form of Shanghai. Environ. Plan. B Urban Anal. City Sci. 2019, 46, 1264–1280. [Google Scholar] [CrossRef]
  43. Wang, C.; Zhong, S. The Influence of Location Factors on Commercial Land Prices—Taking Yantai City as an Example. J. Ludong Univ. (Philos. Soc. Sci. Ed.) 2009, 26, 25–28. [Google Scholar]
  44. Damm, D.; Lerman, S.R.; Lerner-Lam, E.; Young, J. Response of urban real estate values in anticipation of the Washington Metro. J. Transp. Econ. Policy 1980, 1980, 315–336. [Google Scholar]
  45. Gatzlaff, D.H.; Smith, M.T. The impact of the Miami Metrorail on the value of residences near station locations. Land Econ. 1993, 1993, 54–66. [Google Scholar] [CrossRef]
  46. Hu, J.; Zhong, G. Research on urban space-time accessibility under subway travel mode. Planner 2012, 28, 29–33. [Google Scholar]
  47. Xiao, G.; Yamaguchi, M. Quantitative Analysis of Factors Affecting Urban Residential Land Prices in my country. Qiu Suo 2008, 28–29. [Google Scholar] [CrossRef]
  48. Anderson, R.J., Jr.; Crocker, T.D. Air pollution and residential property values. Urban Stud. 1971, 8, 171–180. [Google Scholar] [CrossRef]
  49. Tokyo JIhang Electric Railway Co., Ltd.; Tokyo JIhang Design Co., Ltd. Tokyu Futako Tamagawa Comprehensive Development. Archit. Tech. 2015, 11, 36–39. [Google Scholar]
  50. Liang, S. Rban Pedestrianization: Research on Urban Design Strategy; Southeast University Press: Nanjing, China, 2012; ISBN 978-7-5641-3406-8. [Google Scholar]
  51. Wu, X.; Zhou, X.; Gu, X.; Liu, L. Research on the revision of urban rail transit environmental noise prediction parameters. Environ. Impact Assess. 2019, 41, 59–62. [Google Scholar] [CrossRef]
Figure 1. Suburbs of Tokyo, Japan.
Sustainability 14 07553 g001
Figure 2. Data Distribution of Land Prices in the Suburbs of Tokyo.
Sustainability 14 07553 g002
Figure 3. Schematic diagram for the selection of the measuring point of the noise loudness data at the land price data point. The blue line represents the nearest distance between the measured parcel and the track line, and gray thick lines means track lines.
Sustainability 14 07553 g003
Figure 4. Distribution trend of the variable “lnPR”.
Sustainability 14 07553 g004
Figure 5. Normal P-P of the standardized residual of the regression result of “lnPR”.
Sustainability 14 07553 g005
Figure 6. Distribution of commercial land parcels and rail transit stations in the suburbs.
Sustainability 14 07553 g006
Figure 7. Distribution trend of the variable “lnPB”.
Sustainability 14 07553 g007
Figure 8. Normal P-P of the standardized residual of the regression result of “lnPB”.
Sustainability 14 07553 g008
Figure 9. General plan of the urban re-development of Futako Tamagawa Station.
Sustainability 14 07553 g009
Figure 10. Diagram for the intensity of development.
Sustainability 14 07553 g010
Figure 11. Different schemes and noise simulation. “” means the location of station; ①,②,③,④ means the serial number of blocks in schemes; Yellow indicates residential plots, while others are commercial office plots.
Sustainability 14 07553 g011
Table 1. Acoustic environment classification and requirements in Japan [31].
Type of AreasStandard Value
GradeDescriptionDifferenceDaytimeNight
AAArea in which medical facilities and social welfare facilities were provided 50 db40 db
ADedicated areas for residenceBase value55 db45 db
Roads facing two or more carriageways60 db55 db
BAreas mainly for residenceBase value55 db45 db
Roads facing two or more carriageways65 db60 db
CMainly for commerce or industry
Area in which a few residential buildings were constructed
Base value60 db50 db
Facing roads with carriageways65 db60 db
Special notes:Regardless of the above table, the road approaching major traffic should observe the standard value.70 db65 db
Simultaneously, if a certain residential building is located at one side that is prone to noise, when their windows are closed, the noise transmitted indoors must meet the standard value.45 db40 db
Table 2. Noise value of the sound sources of Tokyo rail lines.
NameNoise VolumeNameNoise VolumeNameNoise Volume
Chūō Line98Ikebukuro Line88Nambu Line79
Sagamihara Line96Haijima Line85Tomono Line78
Keiō Line95Hachikō Line83Tama Lake Line78
Den-en-toshi Line95Yokohama line81Itsukaichi Line78
Odawara line95Musashino Main line81Ōme Line77
Tama Line93Inokashira Line80Seibuen Line73
Toei Shinjuku Line92Tamagawa line79Racecourse Line65
Table 3. Three common characteristic variables.
Model NameFunction Expression
Linear form P i = a 0 + k = 1 m a k U ki + ε i
Semi-logarithmic form lnP i = a 0 + k = 1 m a k U ki + ε i
Log-linear form lnP i = a 0 + k = 1 m a k ln U ki + ε i
Table 4. Characteristic variables involved and their definitions.
Characteristic VariableDescription
Geographical position dataUYamanoteShortest straight-line distance to the planar graph of the Yamanote Line
UwalkingWalking distance to the nearest station
UUstationStraight-line distance to the nearest rail line
UrailStraight-line distance to the nearest rail line
Supporting service dataUPSStraight-line distance to the planar graph of the nearest primary school
UJHSStraight-line distance to the planar graph of the nearest junior high school
UcommercePercentage of the commercial land area within a 1 km range
Population dataU2015Population density of the local area in 2015 as published by the Ministry of Land, Infrastructure, Transport and Tourism, Japan
U2020Population density of the local area in 2020 as published by the Ministry of Land, Infrastructure, Transport and Tourism, Japan
Ugrowth Average population density growth rate of the local area between 2015 and 2020
Land-use data UFARPlot ratio: ratio between residential community’s above-ground total building area and land parcel’s area
UBDBuilding density: percentage of the total sum of the basal area of the buildings in a certain range and the total area of the occupied land parcel’s area
Station dataUPFData of passenger flow in the station
Noise dateUnoiseNoise level obtained from the measured noise value
Table 5. Correlation and significance of the characteristic variable of the price of the land parcels within 200 m of the rail.
lnPRUnoiseUstationUwalkingUBDUFARUYamanoteUrailUPSUJHSUcommerce
Pearson correlationlnPR1.000−0.310−0.195−0.2830.2100.165−0.7830.095−0.097−0.0140.431
Unoise 1.000−0.094−0.0700.029−0.0130.267−0.652−0.066−0.170−0.149
Ustation 1.0000.591−0.132−0.0980.059−0.0370.0980.129−0.113
Uwalking 1.000−0.160−0.1640.0580.0240.0980.111−0.133
UBD 1.0000.9310.093−0.038−0.114−0.1510.323
UFAR 1.0000.091−0.014−0.067−0.1110.293
UYamanote 1.000−0.065−0.143−0.199−0.116
Urail 1.000−0.013−0.004−0.005
UPS 1.0000.747−0.230
UJHS 1.000−0.156
Ucommerce 1.000
SignificancelnPR 0.0000.0030.0000.0010.0100.0000.0910.0880.4210.000
Unoise 0.0920.1640.3440.4300.0000.0000.1760.0080.018
Ustation 0.0000.0310.0840.2030.3000.0850.0350.056
Uwalking 0.0120.0100.2080.3670.0830.0590.030
UBD 0.0000.0960.2980.0540.0170.000
UFAR 0.1020.4220.1720.0590.000
UYamanote 0.1790.0220.0020.051
Urail 0.4270.4800.472
UPS 0.0000.001
UJHS 0.014
Table 6. Multiple linear regression coefficient and its t-test result.
Unstandardized Coefficient-BStandard ErrorStandardized Coefficient-BetatSignificance
(constant)12.9160.091 142.2760.000
Unoise−0.0380.014−0.094−2.7860.006
Uwalking0.0000.000−0.186−5.6450.000
UBD0.0080.0020.1704.9040.000
UYamanote−3.658 × 10−50.000−0.734−21.6710.000
Ucommerce5.838 × 10−70.0000.2527.2250.000
Table 7. Correlation and significance of the characteristic variable of the price of commercial land within 800 m of the rail.
lnPBUFARUwalkingUstationUYamanoteUPFU2015U2020UgrowthUnoise
Pearson correlationlnPB1.0000.6640.030−0.166−0.4690.7350.1340.1460.273−0.072
UFAR 1.0000.125−0.213−0.0180.5580.0970.0940.064−0.017
Uwalking 1.0000.0380.1290.041−0.073−0.074−0.0880.065
Ustation 1.0000.0180.1880.1380.136−0.017−0.375
UYamanote 1.000−0.238−0.403−0.421−0.4940.080
UPF 1.0000.0910.0960.165−0.090
U2015 1.0000.9990.398−0.200
U2020 1.0000.432−0.202
Ugrowth 1.000−0.183
Unoise 1.000
SignificancelnPB 0.0000.3360.0090.0000.0000.0290.0190.0000.154
UFAR 0.0380.0010.4000.0000.0850.0910.1820.406
Uwalking 0.2940.0330.2800.1510.1460.1060.180
Ustation 0.3990.0040.0250.0260.4040.000
UYamanote 0.0000.0000.0000.0000.129
UPF 0.0990.0860.0090.100
U2015 0.0000.0000.002
U2020 0.0000.002
Ugrowth 0.004
Table 8. Screening out the variables by stepwise regression analysis.
Variables before regression analysis UFAR, Ustation, UYamanote, UPF, U2020, Ugrowth
Variables after regression analysisUFAR, Ustation, UYamanote, UPF
Table 9. Multiple linear regression coefficient and its t-test result.
Unstandardized Coefficient-BStandard ErrorStandardized Coefficient-BetatSignificance95.0% Confidence
Interval of B
Lower LimitUpper Limit
(constant)12.8020.127 100.4380.00012.55113.054
UPF1.095 E−050.0000.49611.0580.0000.0000.000
Ustation−0.0010.000−0.180−4.9050.000−0.0010.000
UYamanote−3.100 E−050.000−0.342−9.8930.0000.0000.000
UFAR0.0020.0000.3437.8380.0000.0020.003
Table 10. Correlation analysis on the land prices in the residential area within an 800 m radius of the rail transit station and all factors.
LnPR800UwalkingUBDUFARUstationUPSUJHSUrailUYamanoteUcommerce
Pearson correlationLnPR8001.000−0.0540.1980.165−0.085−0.0140.056−0.080−0.8040.424
Uwalking 1.000−0.127−0.1300.769−0.0350.0400.2100.0340.112
UBD 1.0000.915−0.083−0.010−0.118−0.0740.0720.366
UFAR 1.000−0.086−0.041−0.111−0.0640.0710.357
Ustation 1.000−0.0380.0120.3100.0380.093
UPS 1.0000.646−0.088−0.147−0.152
UJHS 1.000−0.023−0.238−0.139
Urail 1.0000.061−0.088
UYamanote 1.000−0.096
Ucommerce 1.000
SignificanceLnPR800 0.1820.0000.0030.0750.4070.1730.0870.0000.000
Uwalking 0.0150.0140.0000.2750.2480.0000.2820.029
UBD 0.0000.0790.4330.0220.1040.1120.000
UFAR 0.0730.2430.0300.1400.1160.000
Ustation 0.2610.4190.0000.2620.057
UPS 0.0000.0670.0060.005
UJHS 0.3470.0000.009
Urail 0.1490.068
UYamanote 0.052
Table 11. Percentage of the main functions in the development plan (%).
Residence OfficeCommercial Service
503317
Table 12. Scheme evaluation results.
Scheme Commercial AreaResidential Area Δ P sum (100 Million Yen)
Land Occupied
Number
Ustation S Bj
(m2)
Δ P Bj
(Yen/m2)
Land Occupied
Number
Unoise S Ri
(m2)
Δ P Ri
(Yen/m2)
Original scheme18031,200−104,018031,4000−167.5
33053,700−176,268
55915,200−265,426
Scheme 118031,200−104,018126,200−15,155−204.3
34527,500−182,579
52246,600−252,522
Scheme 218031,200−104,018227,500−29,746−203.0
31826,200−170,664
52246,600−252,522
Scheme 333053,700−176,268431,200−57,317−230.2
52246,600−252,522
Table 13. Station–city integration mode of some stations in the suburbs of Tokyo. In the picture given in the table, crimson means the station, orange means the business, and brown means the office.
NamePlane FigureTypeLine NameConnection Facilities
Mizonokuchi Sustainability 14 07553 i001Transfer StationDen-en-toshi LineSquare + Footbridge
Tama Square Sustainability 14 07553 i002Midway StationDen-en-toshi LineComplex + Footbridge
Aobadai Sustainability 14 07553 i003Midway StationDen-en-toshi LineComplex + Square + Footbridge
Nagatsuta Sustainability 14 07553 i004Transfer StationDen-en-toshi LineSquare + Footbridge
Central forest Sustainability 14 07553 i005Transfer StationDen-en-toshi LineComplex + Footbridge + Underground passage
Kokuryo Sustainability 14 07553 i006Midway StationKeiō LineComplex + Street
Fuchu Sustainability 14 07553 i007Midway StationKeiō LineComplex + Square + Underground passage
Bubaigawara Sustainability 14 07553 i008Transfer StationKeiō LineSquare + Footbridge
Seiseki Sakuragaoka Sustainability 14 07553 i009Transfer StationKeiō LineComplex + Footbridge
Takahata Fudo Sustainability 14 07553 i010Transfer StationKeiō LineComplex + Square + Street
Kyohachioji Sustainability 14 07553 i011Transfer StationKeiō LineComplex + Square + Underground passage
Kichijoji Sustainability 14 07553 i012Midway StationInokashira LineSquare + Street
Keio Horinouchi Sustainability 14 07553 i013Midway StationSagamihara LineComplex
Minami Osawa Sustainability 14 07553 i014Transfer StationSagamihara LineComplex + Square
Kyodo Sustainability 14 07553 i015Midway StationOdawara lineComplex
Front of Seijo Gakuen Sustainability 14 07553 i016Midway StationOdawara lineComplex
Shinyuri Hill Sustainability 14 07553 i017Transfer StationOdawara lineSquare + Street + Footbridge
Tsurukawa Sustainability 14 07553 i018Midway StationOdawara lineSquare + Street
Machida Sustainability 14 07553 i019Transfer StationOdawara lineComplex + Square + Street + Footbridge
Sagamiono Sustainability 14 07553 i020Transfer StationOdawara lineComplex + Square + Street + Footbridge
Odaen Sustainability 14 07553 i021Transfer StationOdawara lineComplex + Square + Footbridge + Underground passage
Publisher’s Note: MDPI stays neutral with regard to jurisdictional claims in published maps and institutional affiliations.

