Review

Spatiotemporal Variability of Human Disturbance Impacts on Ecosystem Services in Mining Areas

1
School of Architecture and Art, Central South University, Changsha 410083, China
2
School of Mathematics and Statistics, HNP-LAMA, Central South University, Changsha 410083, China
3
School of Architecture, South China University of Technology, Guangzhou 510641, China
*
Author to whom correspondence should be addressed.
Sustainability 2022, 14(13), 7547; https://doi.org/10.3390/su14137547
Submission received: 25 April 2022 / Revised: 16 June 2022 / Accepted: 19 June 2022 / Published: 21 June 2022

Abstract

:
Human activities pose significant impacts on ecosystem services (ESs) in mining areas, which will continually increase over time and space. However, the mechanism of ES change on spatiotemporal scales post-disturbance remains unclear, especially in the context of global climate change. Here, we conducted a global literature review on the impact of two of the most frequent disturbance factors (mining and restoration) on 27 different ESs, intending to synthesize the impacts of human disturbance on ESs in mining areas via a meta-analysis, and analyze the spatiotemporal variability of ESs after disturbance. We screened 3204 disturbance studies published on the Web of Science between 1950 and 2020 and reviewed 340 in detail. The results of independence test showed that human disturbance had a significant impact on ESs in the mining areas (p < 0.001). The impacts (positive and/or negative) caused by mining and restoration differed considerably among ESs (even on the same ESs). Additionally, spatiotemporal scales of human disturbance were significantly related to spatiotemporal scales of ES change (p < 0.001). We found that the positive and negative impacts of disturbances on ESs may be interconversion under specific spatiotemporal conditions. This seems to be associated with spatiotemporal variability, such as the temporal lag, spatial spillover, and cumulative spatiotemporal effects. Climate changes can lead to further spatiotemporal variability, which highlights the importance of understanding the changes in ESs post-disturbance on spatiotemporal scales. Our research presents recommendations for coping with the twofold pressure of climate change and spatiotemporal variability, to understand how ESs respond to human disturbance at spatiotemporal scales in the future, and manage disturbances to promote sustainable development in mining areas.

1. Introduction

Human activities affect ecosystem services (ESs) worldwide [1,2,3]. Particularly in the mining area, anthropogenic activity such as mining and restoration is one of the most direct and important drivers of ES change [4,5]. Large-scale mining activities are widely distributed globally, mainly in the Andes mountain range, East Asia, Australia, South Africa, and Eastern Europe [6,7,8,9]. A majority of these active mines (63%) are located in high ES provisioning zones, covering 69% of the global terrestrial land surface [10,11]. Land disturbed by mining is continuously increasing owing to growing global demand for energy [12]. Many studies over the last few decades have suggested that restoration activities can improve degraded lands after mining. To date, almost 60 countries have announced political commitments to bring more than 170 million hectares of degraded land to restoration [13]. Large-scale restoration activities at the surface are needed in the foreseeable future, to implement countries’ existing restoration pledges, which cover more than one billion hectares [14]. The ESs in mining areas are likely to change more dramatically, with the extension in time and space of disturbances in the coming decades [15]. This will further be accentuated as a result of the climate change (e.g., drought, temperature, and precipitation), which can expand the disturbance impacts through altering the ESs change rate [16,17]. The disturbance impacts (i.e., the condition, size, severity, and frequency of disturbance over extended spatial and temporal scales) can be reflected by the changes in ESs at spatiotemporal scales, as the actual contribution of mining and restoration to ES change is subject to change over time and space [18,19,20]. Therefore, analysis of the spatiotemporal changes in ESs post-disturbance can enhance our knowledge of how ESs respond to human disturbances at spatiotemporal scales, which is crucial for sustainable mine management of mining areas in the context of global climate change [7].
To better address climate change and adequately inform mine management decisions, there is a need for a comprehensive understanding of the impacts of disturbance on ESs [21]. There is an increasing body of research dealing with human disturbance impacts on ESs, as their importance is more widely recognized [22]. Numerous snapshot (i.e., ESs presented by static maps) studies have demonstrated that human disturbance has negative or positive impacts on ESs. On the one hand, mining activities have significant negative impacts on the surrounding ecosystems through either direct effects (e.g., loss of vegetation [23], soil degradation [1,24], and water quality pollution [25,26,27]) or indirect effects (e.g., social conflicts [12,28,29]). However, mining sites also have substantial ecological, geological, and cultural value [23,30,31,32,33,34]. On the other hand, the specific restoration method (e.g., Surface Mining Control and Reclamation Act of 1977 [35] and fast colonizing species [36]) alleviates soil destabilization and water-quality impairment to cause herbaceous communities to proliferate rapidly and widely in mines, while resulting in a poor growing environment for native trees that greatly hinder forest regeneration [37]. However, these studies focused on snapshots that provided limited information on ESs, and dynamic changes in ESs have seldom been examined [38]. Thus, there is a need for better exploration of the entire process of ES change after mining and restoration, to understand the significantly different disturbance effects on ESs [21,39]. Several studies have explored changes in ESs at various spatiotemporal scales post-disturbance. For example, mining has significantly negative impacts on ESs in a short time, while many historic mining districts have been preserved as cultural heritage sites (e.g., the Cornwall and West Devon Mining Landscape World Heritage Sites) [31,40]. Furthermore, during the process of mine restoration, the diversity of the forest was lower in the initial stages of active restoration but increased to reference levels within 10–20 years [41]. Hence, neglecting the spatiotemporal variability of ESs may yield misleading results [42,43,44].
It is difficult to effectively manage ESs because of the unpredictability of ES changes at spatiotemporal scales. This can be attributed to the substantial inertia (delay in the response of a system to a disturbance) that exists in ecological systems. The impacts of disturbance on ESs are slow to become apparent [45], and may be expressed primarily at some distance from where the ESs were disturbed [46]. For example, regional ES values decreased with the expansion of mining areas and irreversibly altered over time [23,47]. Moreover, there are significant interactions at spatiotemporal scales of ES change as a result of the interactive effects between location- and time-specific factors [38]. As reported by Magris et al. [48], the collapse of tailing dams exported a large amount of pollutants to the ocean over time, and the cumulative effects of temporal lag and spatial spillover likely affected key sensitive ecosystems. These effects are referred to as the spatiotemporal variability (i.e., temporal lag effect, spatial spillover effect, and cumulative spatiotemporal effect) of disturbance impacts on the ESs. This is one of the main challenges in revealing the underlying mechanisms of post-disturbance ES changes in mining areas [49]. Therefore, understanding the specific effects of spatiotemporal changes in ESs post-disturbance is key to facing future challenges.
As a result, we described and quantified the various impacts of human disturbances in a literature review of disturbances in mining areas globally. In particular, the impacts of human disturbances on ESs on temporal and spatial scales were analyzed. We examined the effects of two of the most important disturbance drivers (i.e., mining and restoration) in mining areas on 27 ESs from eight ecosystems distinguished by the Millennium Ecosystem Assessment. A clear analysis of all four categories (provisioning, supporting, regulating, and cultural services) enables a more comprehensive and specific assessment of impacts [46,50]. Moreover, correlations between disturbances and ESs on the temporal and spatial scales were measured. The objectives of this study were (1) to synthesize the impacts of human disturbances on ESs in mining areas via quantitative meta-analysis, and (2) to further explore the various effects of the response of ESs in mining areas to human disturbance changes on spatiotemporal scales. Based on these analyses, we provide suggestions for the sustainable management of mining areas in the context of climate change.

2. Materials and Methods

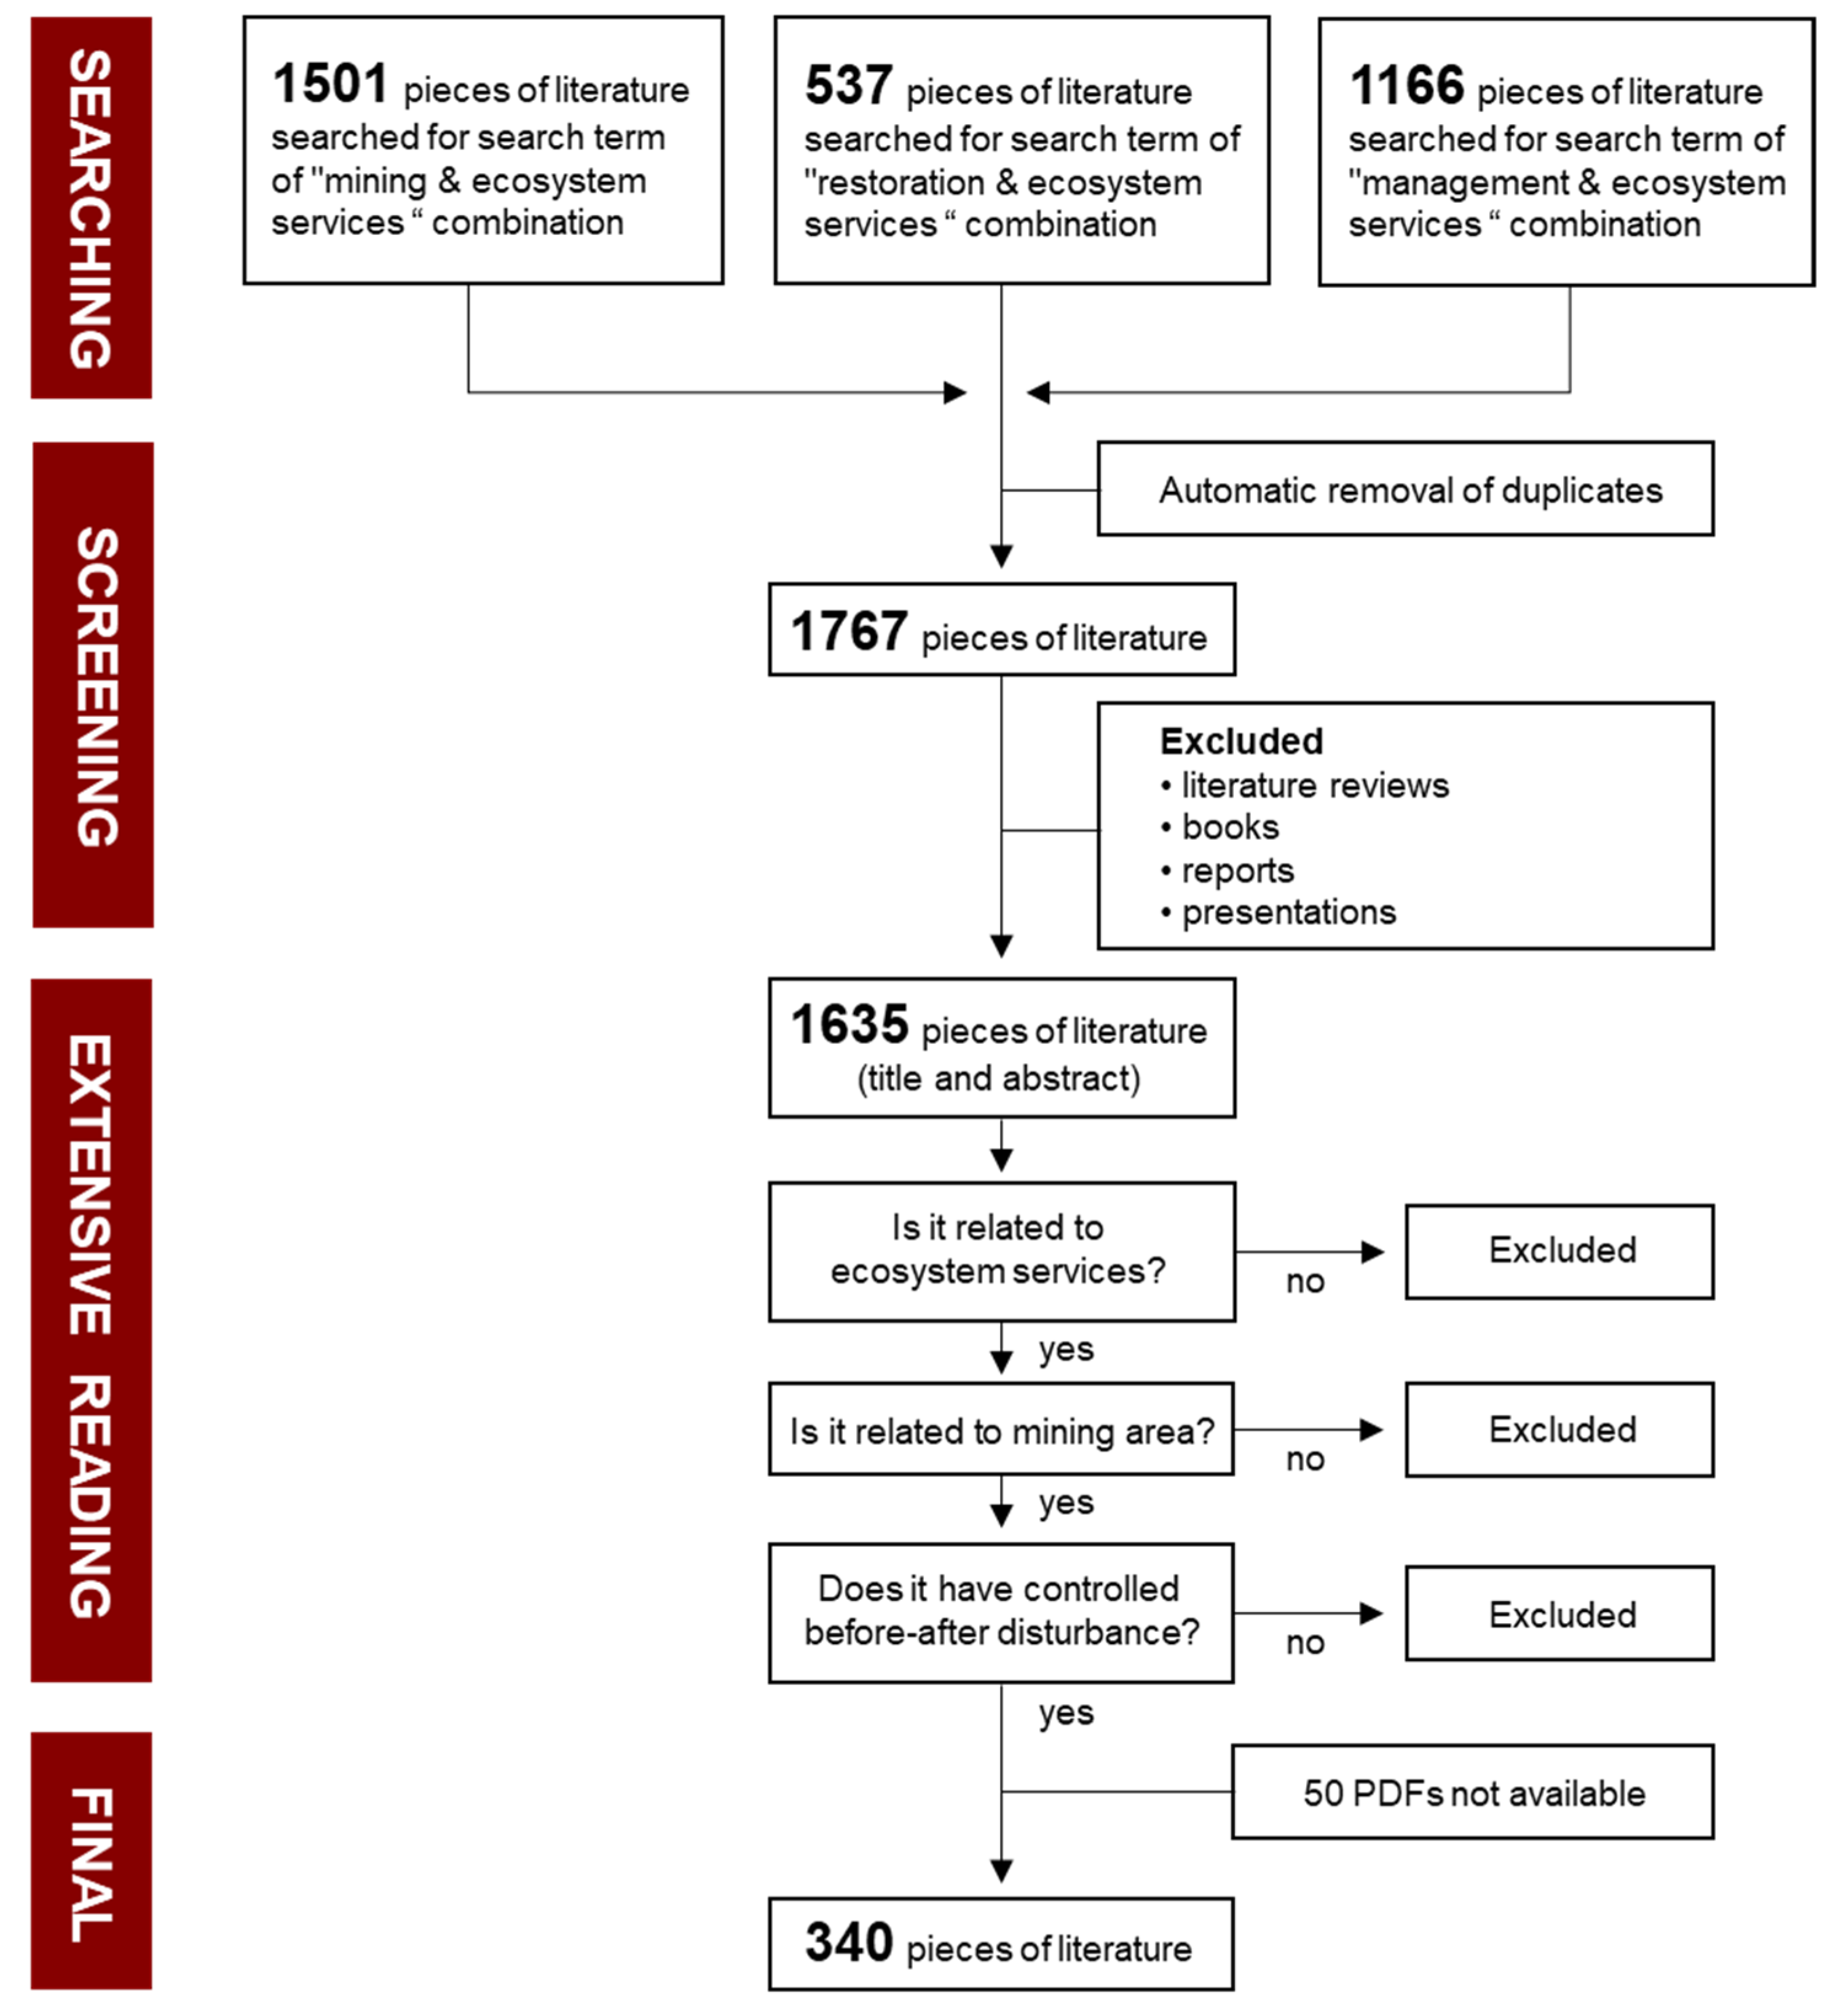
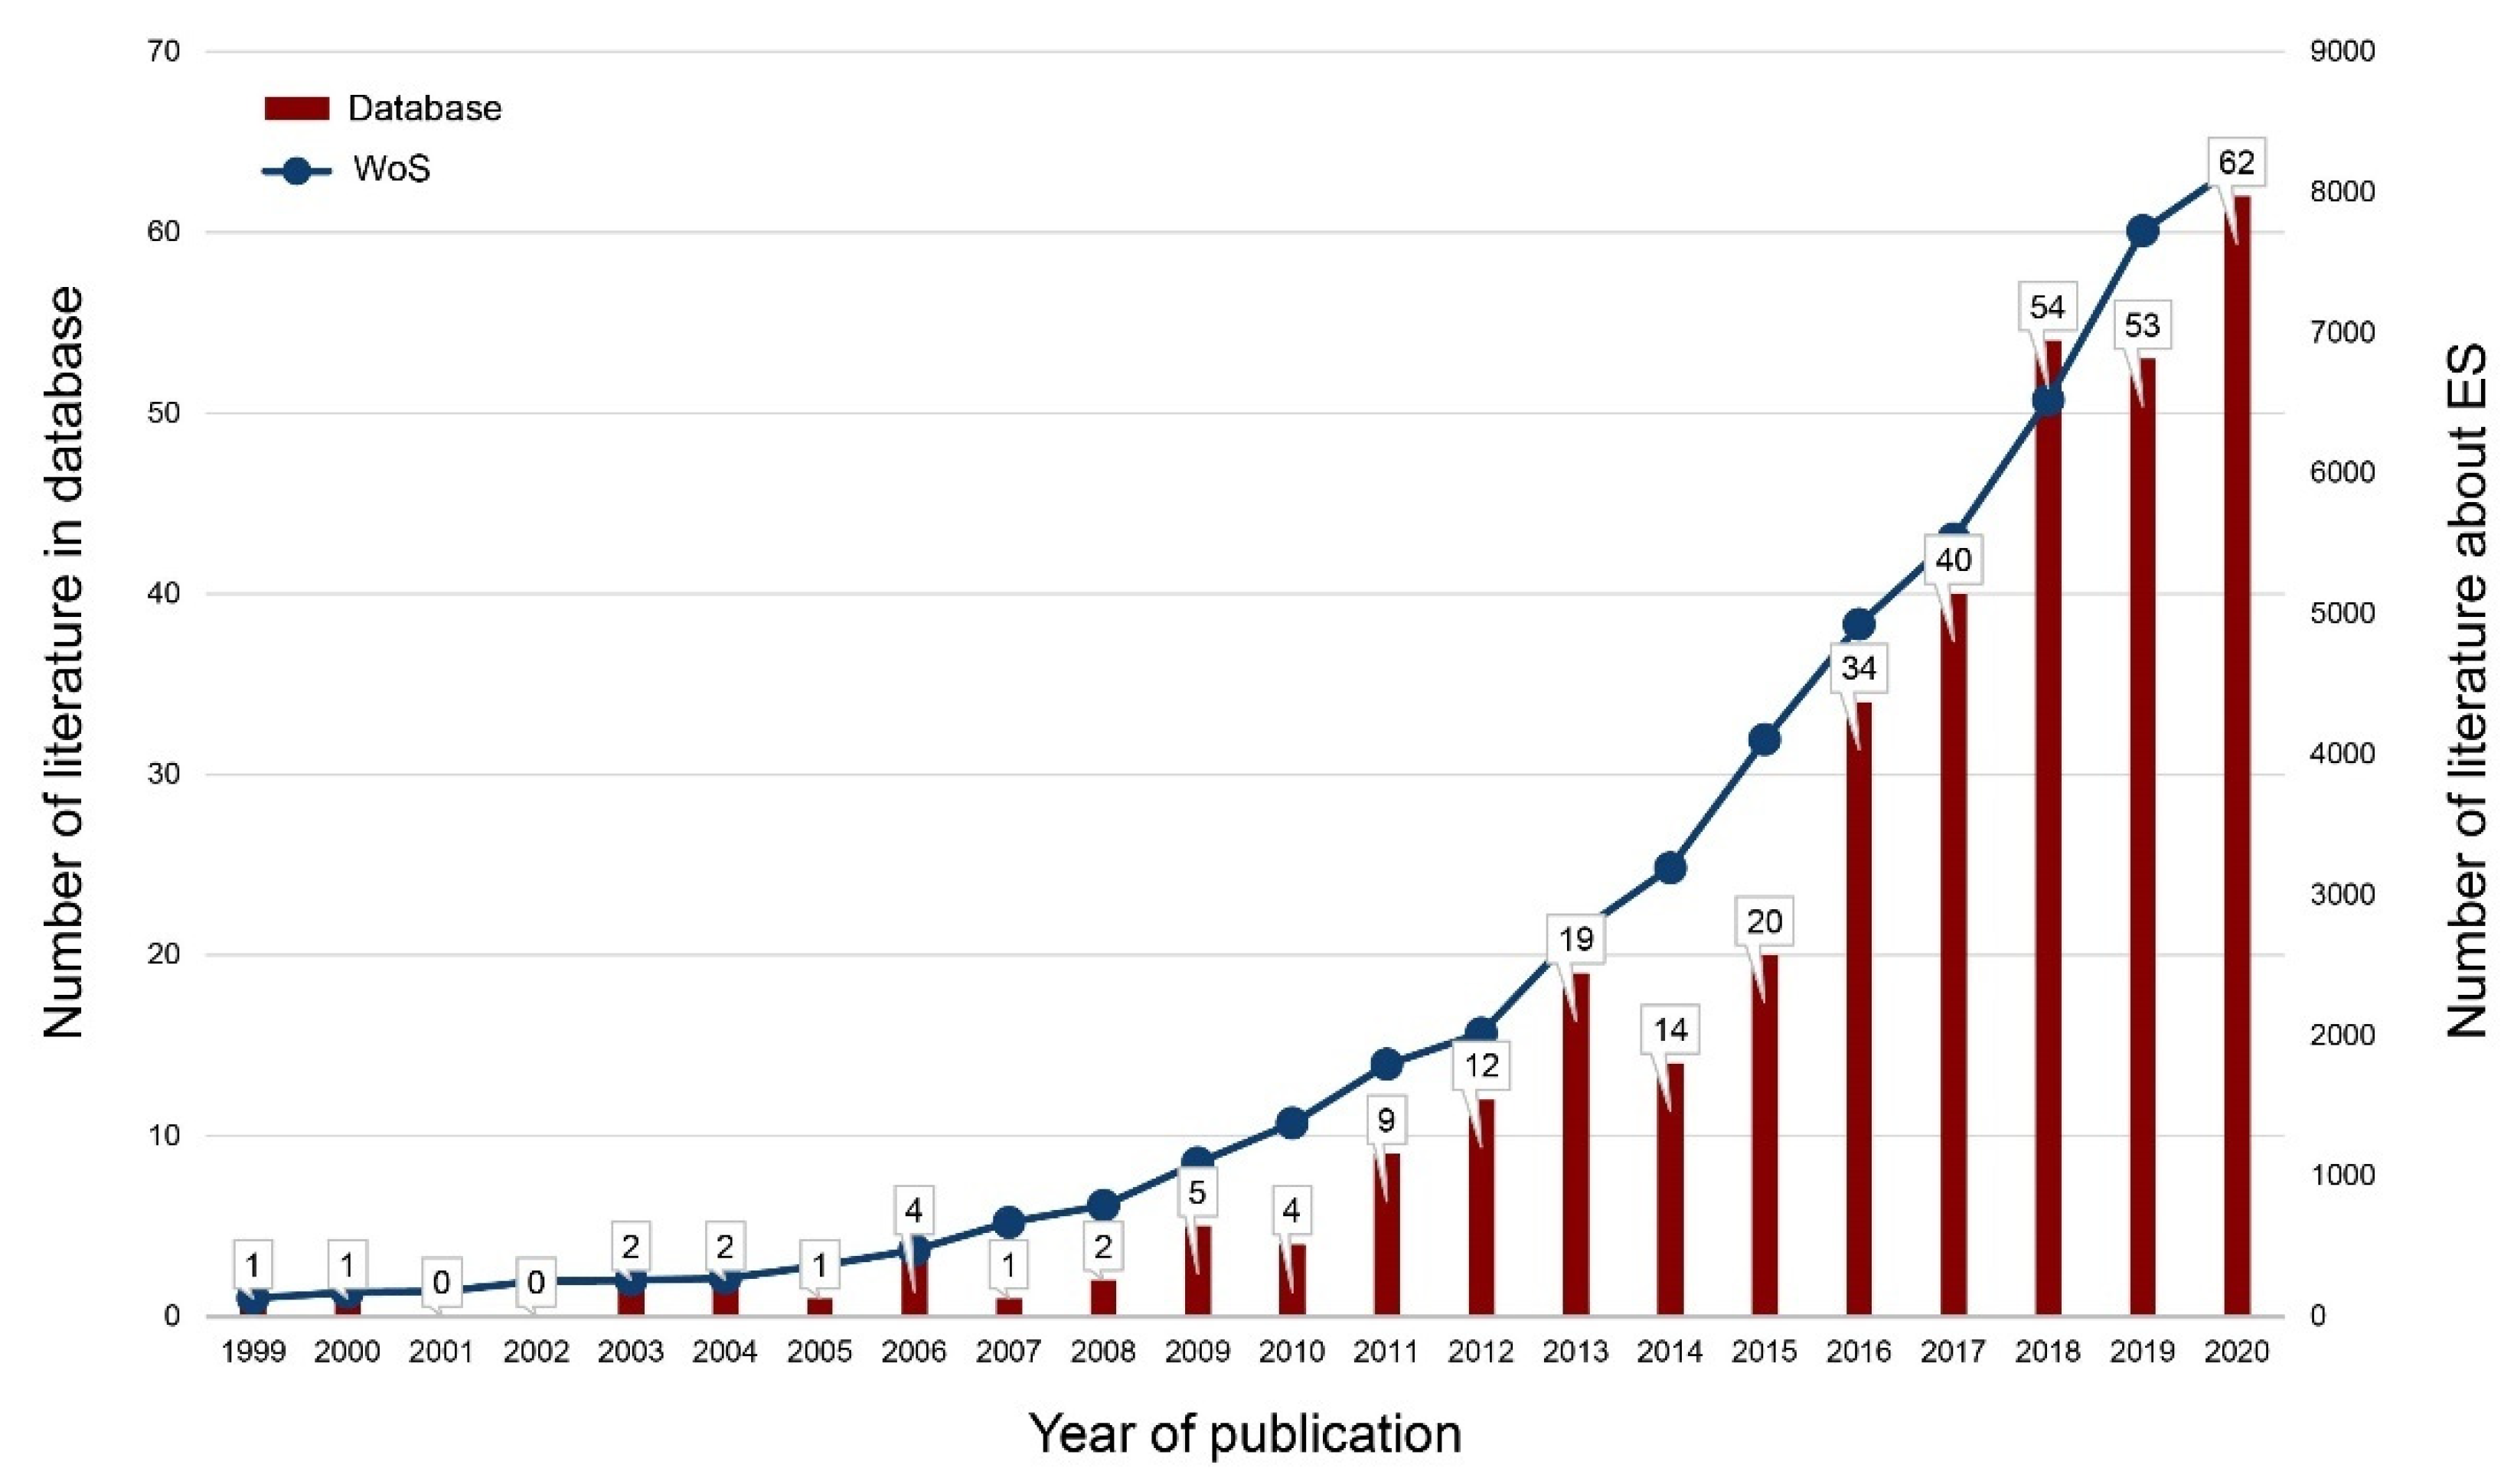
2.1. Systematic Review

We searched for studies on disturbance by mining, restoration, and management, and their impacts on ESs as defined by the Millennium Ecosystem Assessment [46], focusing on ES change on spatiotemporal scales. The top three anthropogenic drivers, based on the VOSviewer version 1.6.13, were selected by research keywords ranked according to the importance and relevance degrees from documents searched for (“ecosystem services”) AND (“mine” OR “mining”) in December 2020, then the disturbance drivers were determined (Figure 1). However, ESs are affected by both direct and indirect drivers, and indirect drivers (e.g., management) can trigger or strengthen direct drivers (e.g., mining and restoration) [51]. We classified the research obtained by searching for “management” in mining and restoration categories according to their focus, which improved the authenticity and accuracy of the research results. As different ecosystem types are connected and share common threats and drivers of change, it is often necessary to include multiple ecosystem types [51]. Eight ecosystems (i.e., forest, cultivated, dryland, coastal, marine, urban, inland water, island, and mountain) on a worldwide level are included in our research [46]. Groundwater is an important component of inland water ecosystems included in inland water ecosystems, as an important ecosystem component.
In this study, the Web of Science (WoS) was chosen for the analysis of human disturbance impacts on ESs, and the cutoff date for the inclusion of publications was 9 December 2020. Only one electronic database was selected to avoid double-counting scientific publications [52]. As ESs have been extensively studied, and the uses of the term are not standardized, there exist obvious differences in the expression of ESs in scientific publications of various countries [53,54]. By using relevant research [55], the final search used the combination of keywords shown in Table 1. A total of 3204 papers were screened; we screened the studies based on their titles and abstracts [42]. From this overall body of research, literature reviews, books, reports, and presentations (i.e., grey literature) were excluded to avoid repeated viewpoint records [52,55]. Beyond that, we excluded research without disturbances or full text. Studies that used explicit ES concepts or specific ES types were included. From the 3204 studies initially screened, 340 were selected for further analysis (Figure 2).
Individual studies frequently examined more than one ES (i.e., multiple different services or the same service in different locations) [42]. Thus, we allowed multiple entries per study—for instance, if a study examined more than one disturbance factor or ESs. For each study, we collected information on geographical location, ecosystem types, disturbance factors, ES categories, spatial and temporal scales, and assessment methodologies (Supporting Information S1 and S2). For the research with spatiotemporal information, we recorded the spatiotemporal scales of disturbances and ESs, spatiotemporal changes, and spatiotemporal overlap (Supporting Information S3). We characterized studies over four time scales (i.e., short term: <5 years, mid-term: 6–25 years, long term: 26–100 years, very long term: >100 years) [42]. The spatial scale (i.e., stand: <0.1 km², patch: 0.1–1 km², landscape: 1.01–1000 km², region: >1000 km²) of the case study was determined following the criteria provided by Dominik Thom and Rupert Seidl according to the size of the study area [56]. If studies included research methods (e.g., experimental data, field samples, or observations) affecting the time and space scale, they were focused on in the quantitative analysis.

2.2. Meta-Analysis

The 340 studies contained a total of 736 individual cases that contain 312 with spatiotemporal information (see Supporting Information S1 and S2 for the full sample list). We analyzed our literature-derived database of disturbance impacts in two steps. First, we assessed the impacts of disturbance on the ESs in mining areas. To test whether a significant disturbance effect can be established from the literature, we used the chi-square independence test to observe the distribution of impacts over the response categories. In addition, we tested for differences in disturbance impacts among geographical location, ecosystem types, ES categories, and spatiotemporal scales. The degrees of correlation between the dependent and independent variables were measured using the coefficient of contingency to gain further insights into the relationship between disturbance factors and effect types. Post-hoc analyses were completed for chi-square tests using adjusted standardized residuals to determine greatest differences [57,58]. We examined standardized residuals and adjusted standardized residuals relative to a cut-off point of >3 standard deviations to represent the strength comparisons between groups and the direction of the correlation.
Second, to explore the response of ESs in mining areas to human disturbance changes on spatiotemporal scales, correlations between disturbances and ESs were measured at temporal and spatial scales. The relationship between temporal and spatial scales is complicated, and significant space–time interactions exist [38]. The temporal and spatial scales were computed separately to ensure that the results were more accurate. The strength and direction of the correlation between disturbances and ESs in terms of temporal or spatial scales were measured using the chi-square independence test, Kendall’s rank correlation coefficient, and adjusted standardized residuals. All tests were conducted using the IBM SPSS Statistics software (version 25.0, Armonk, NY, USA).

3. Results

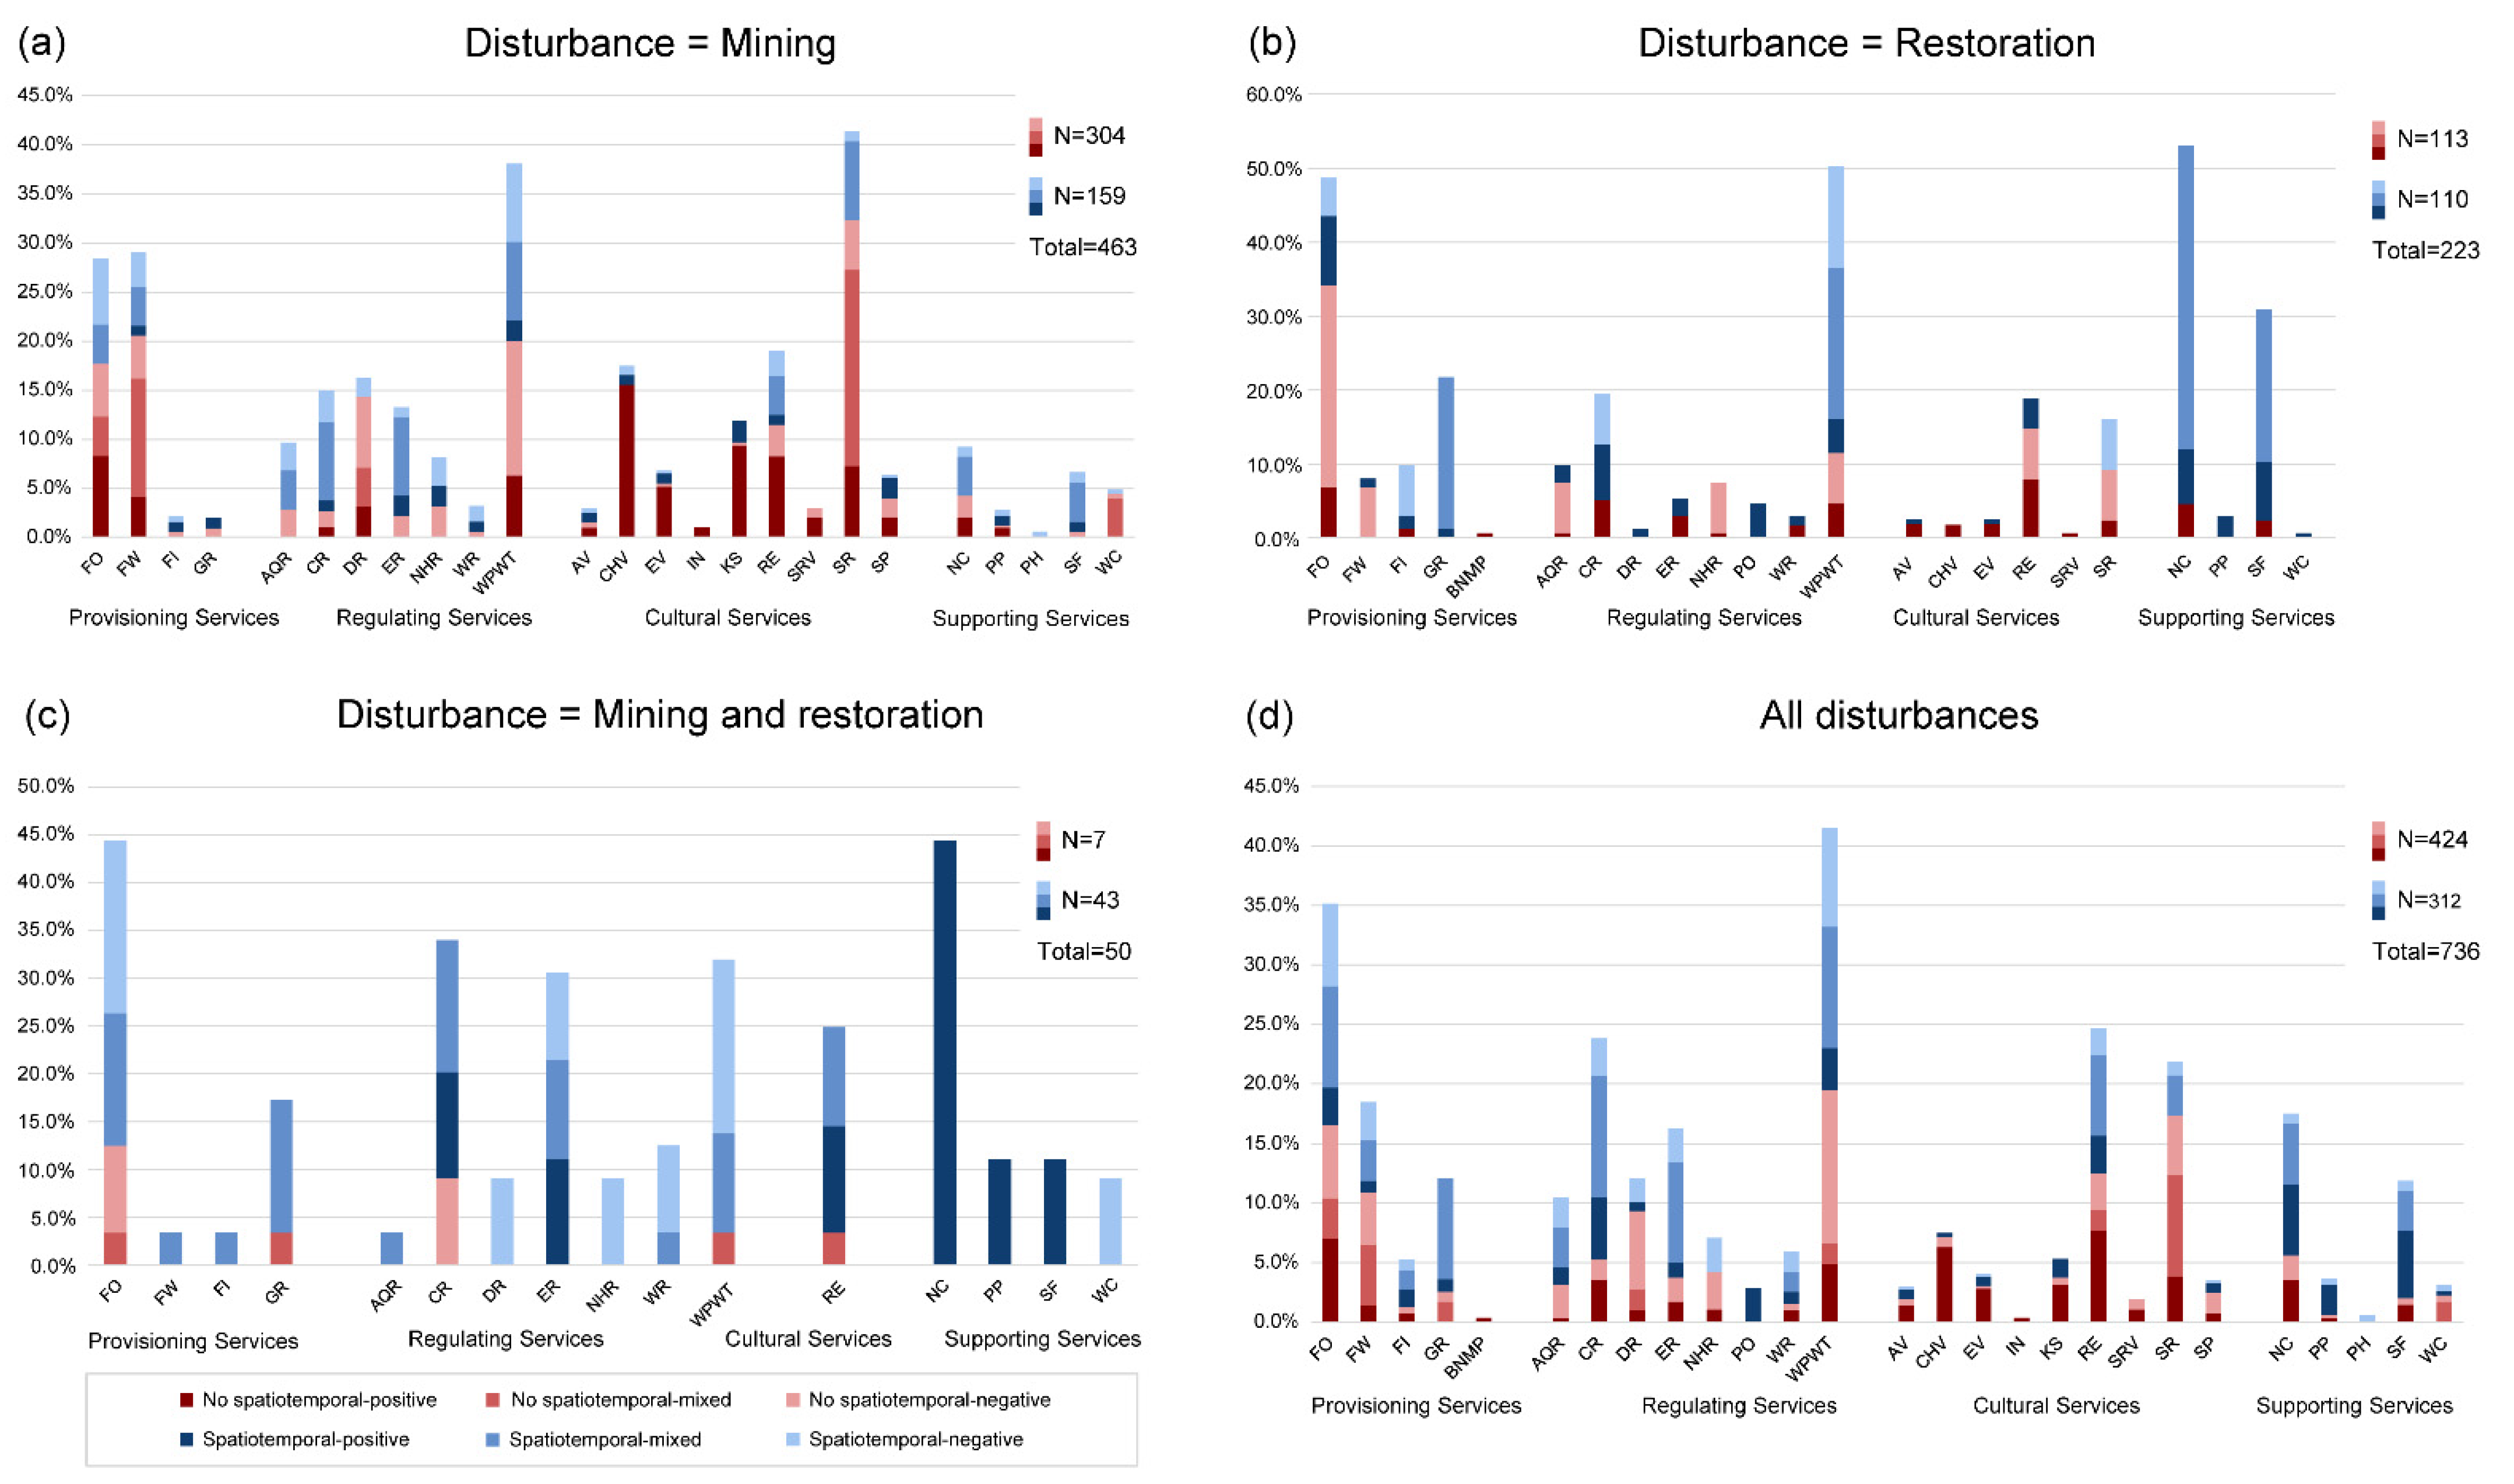
3.1. Human Disturbance Impacts on ESs in Mining Areas

The number of journal articles focusing on ESs has increased substantially over the last decade [53]. Research on the effect of human disturbances on ESs in mining areas began in 1999 and has increased between 2010 and 2020 C.E. (before 2010, studies were sparse and irregular) in our database. The number of publications in 2020 increased 15.5 times in comparison to the 2010 level (Figure 3). Most studies were conducted in Asia (28.1%), Europe (20.4%), North America (15.2%), and South America (15.1%) (Figure 4). In mining areas worldwide, the majority of disturbances occur in forest ecosystems (26.1%), cultivated ecosystems (15.4%), and dryland ecosystems (13.9%). Overall, mining (62.9%) was the most common human disturbance in mining areas, followed by restoration (30.3%), with only 6.8% of the samples showing mixed effects. However, the negative (49.3%) and positive effects (41.6%) on ESs were nearly equally distributed. ESs affected by human disturbances involved all categories (i.e., regulating services (41.3%), cultural services (23%), provisioning services (22.4%), and supporting services (13.3%), which indicates that relatively little attention has been paid to cultural services [59] (Figure 5).
At the ES category level, the regulating services seemed to receive the biggest influence from all disturbances and presented significant negative, positive, and mixed (i.e., both negative and positive) effects. The largest negative and positive effects of mining are on regulating services and cultural services, respectively. Moreover, more negative impacts of restoration were found for provisioning services, whereas more positive impacts were found for regulating services. For individual ESs, the most severely disturbed ESs were water purification and waste treatment (14.7%), food (11.7%), and recreation and ecotourism (7.6%). The largest negative effects of mining are water purification and waste treatment, food, and disease regulation, relative to the other ESs (Figure 5). This is because the heavy metals and other mining wastes may degrade water quality through runoff and groundwater infiltration, causing a serious impact on inland water ecosystems [60,61,62]. The largest positive effects of restoration are nutrient cycling, soil formation, and climate regulation, which may be closely related to the restoration approach and technique.
Overall, human disturbance had significant effects on ESs (p  <  0.001). As Table 2 shows, a negative (positive) impact is positively associated with mining (restoration). Mixed disturbance is also explained by a positive relationship with mixed impact. As expected, our results demonstrated that the ES responses to mining and restoration were significantly different.

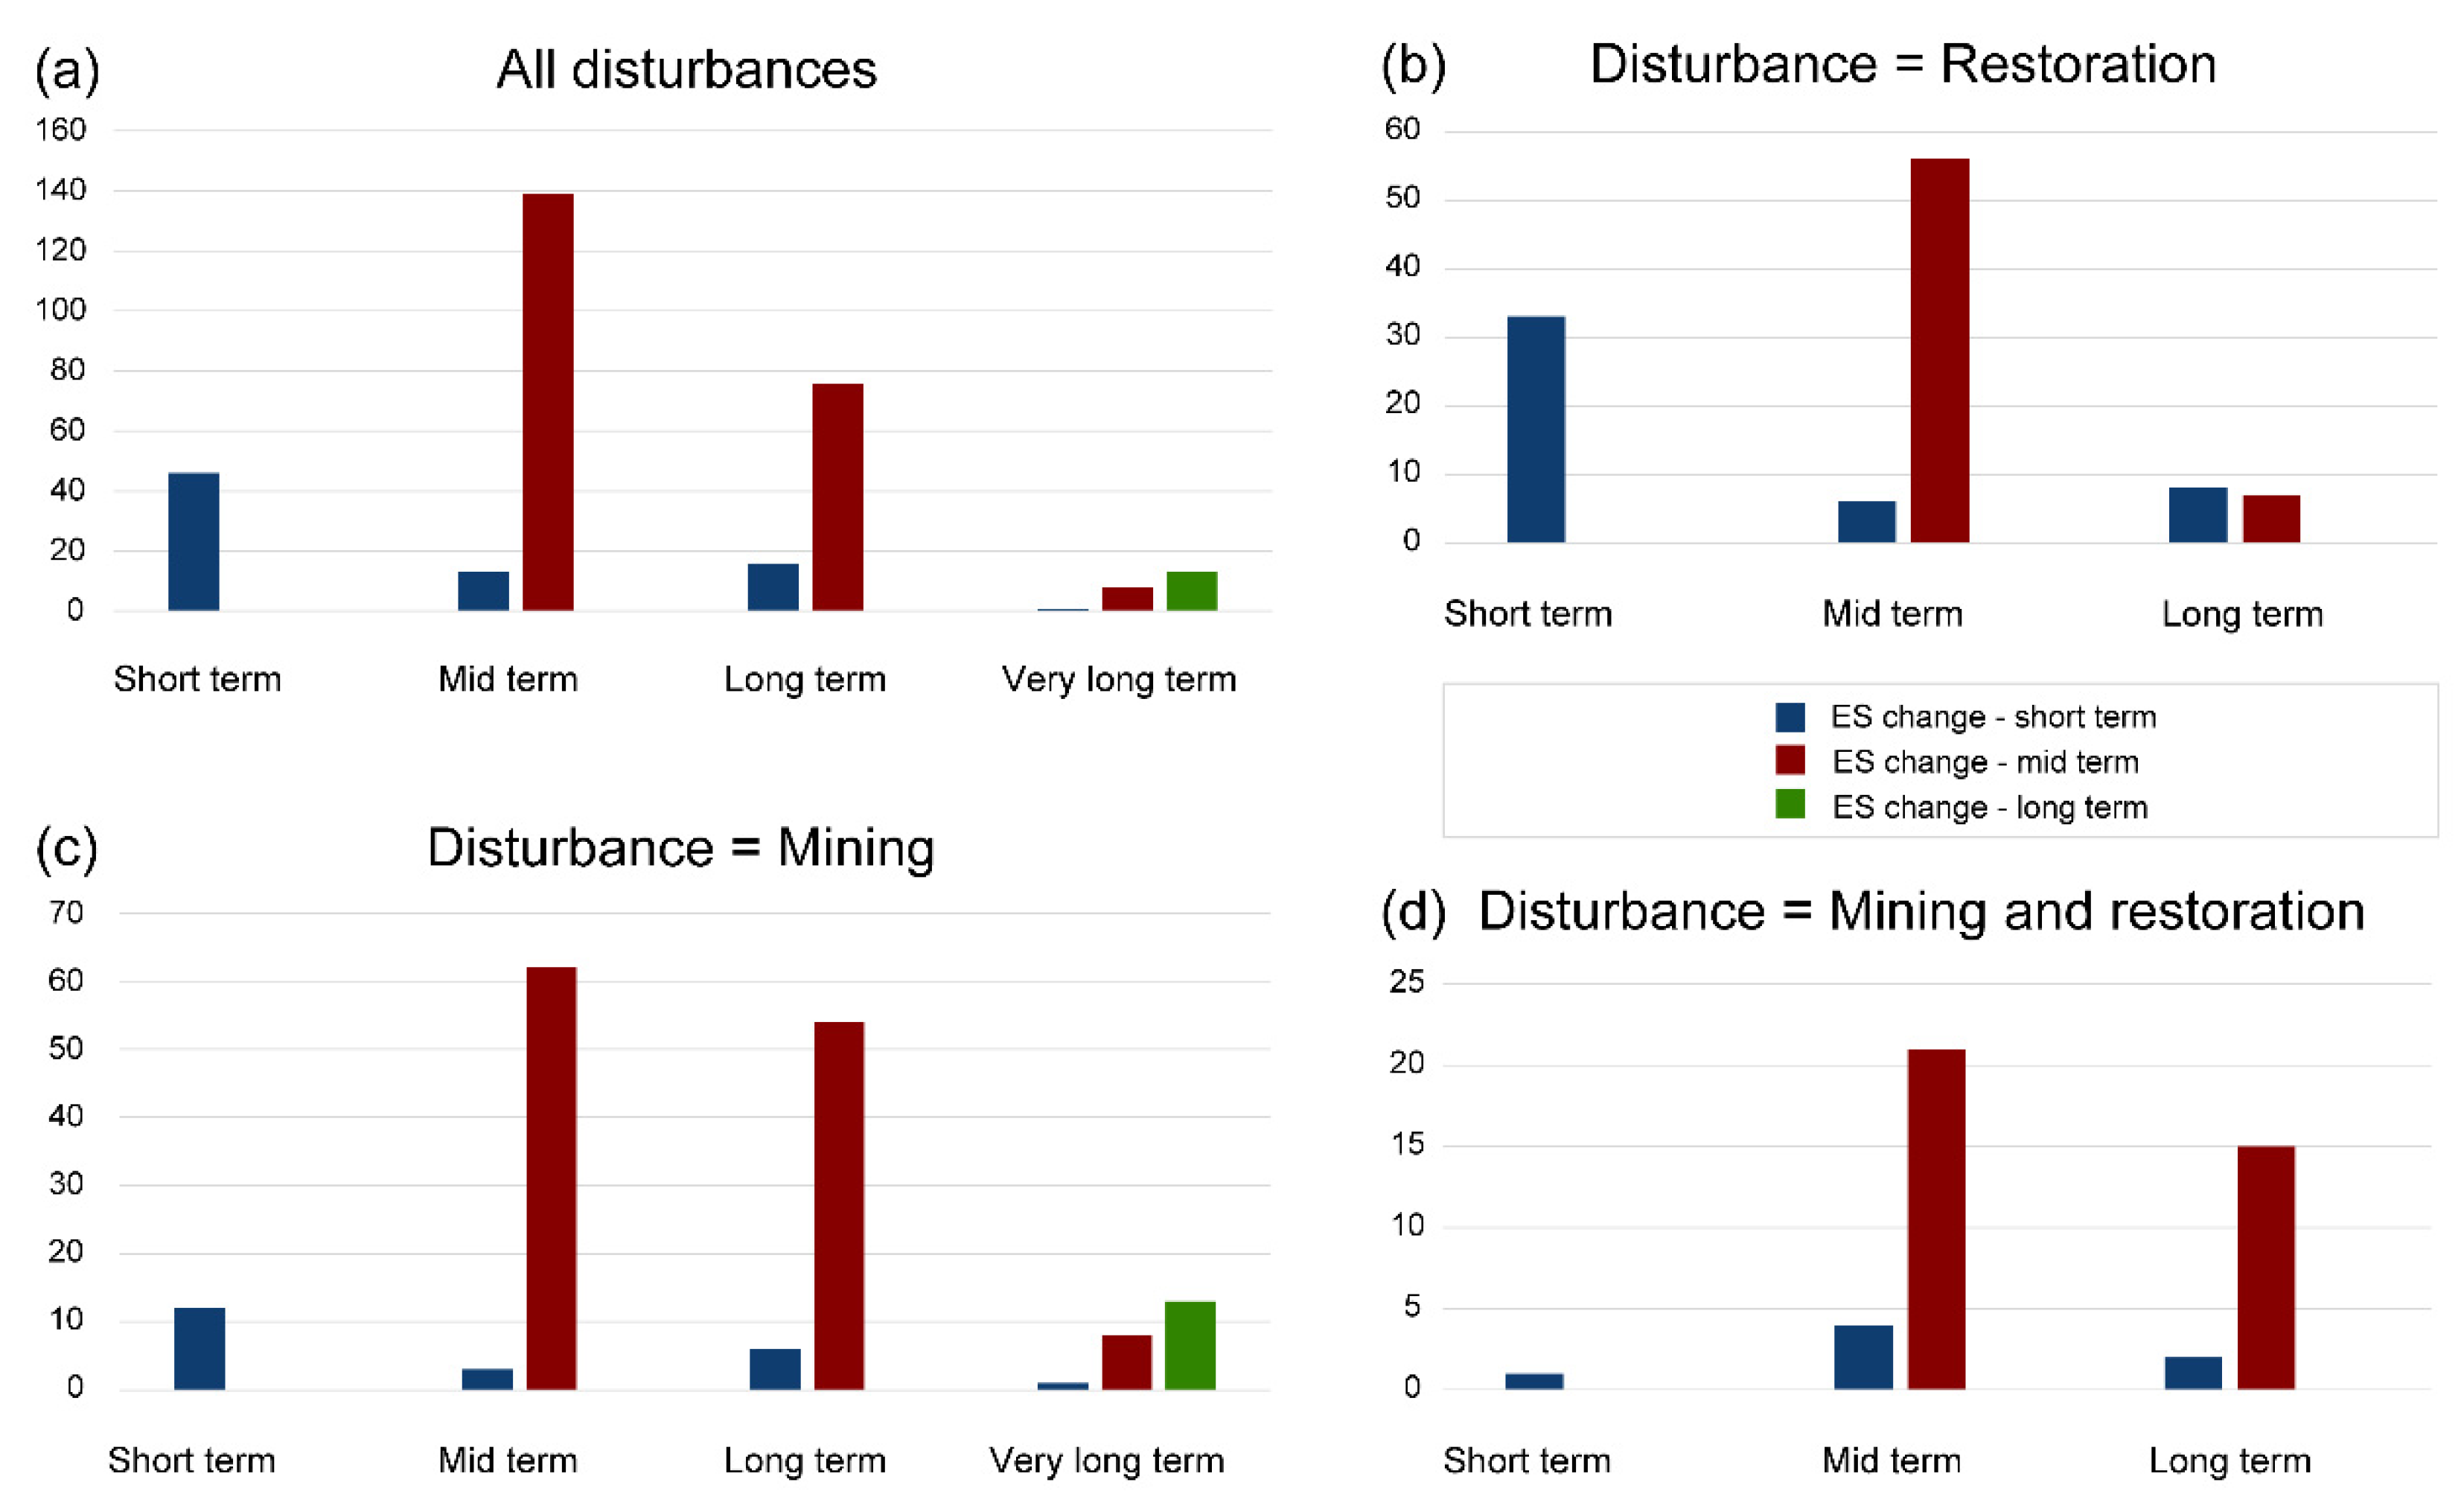
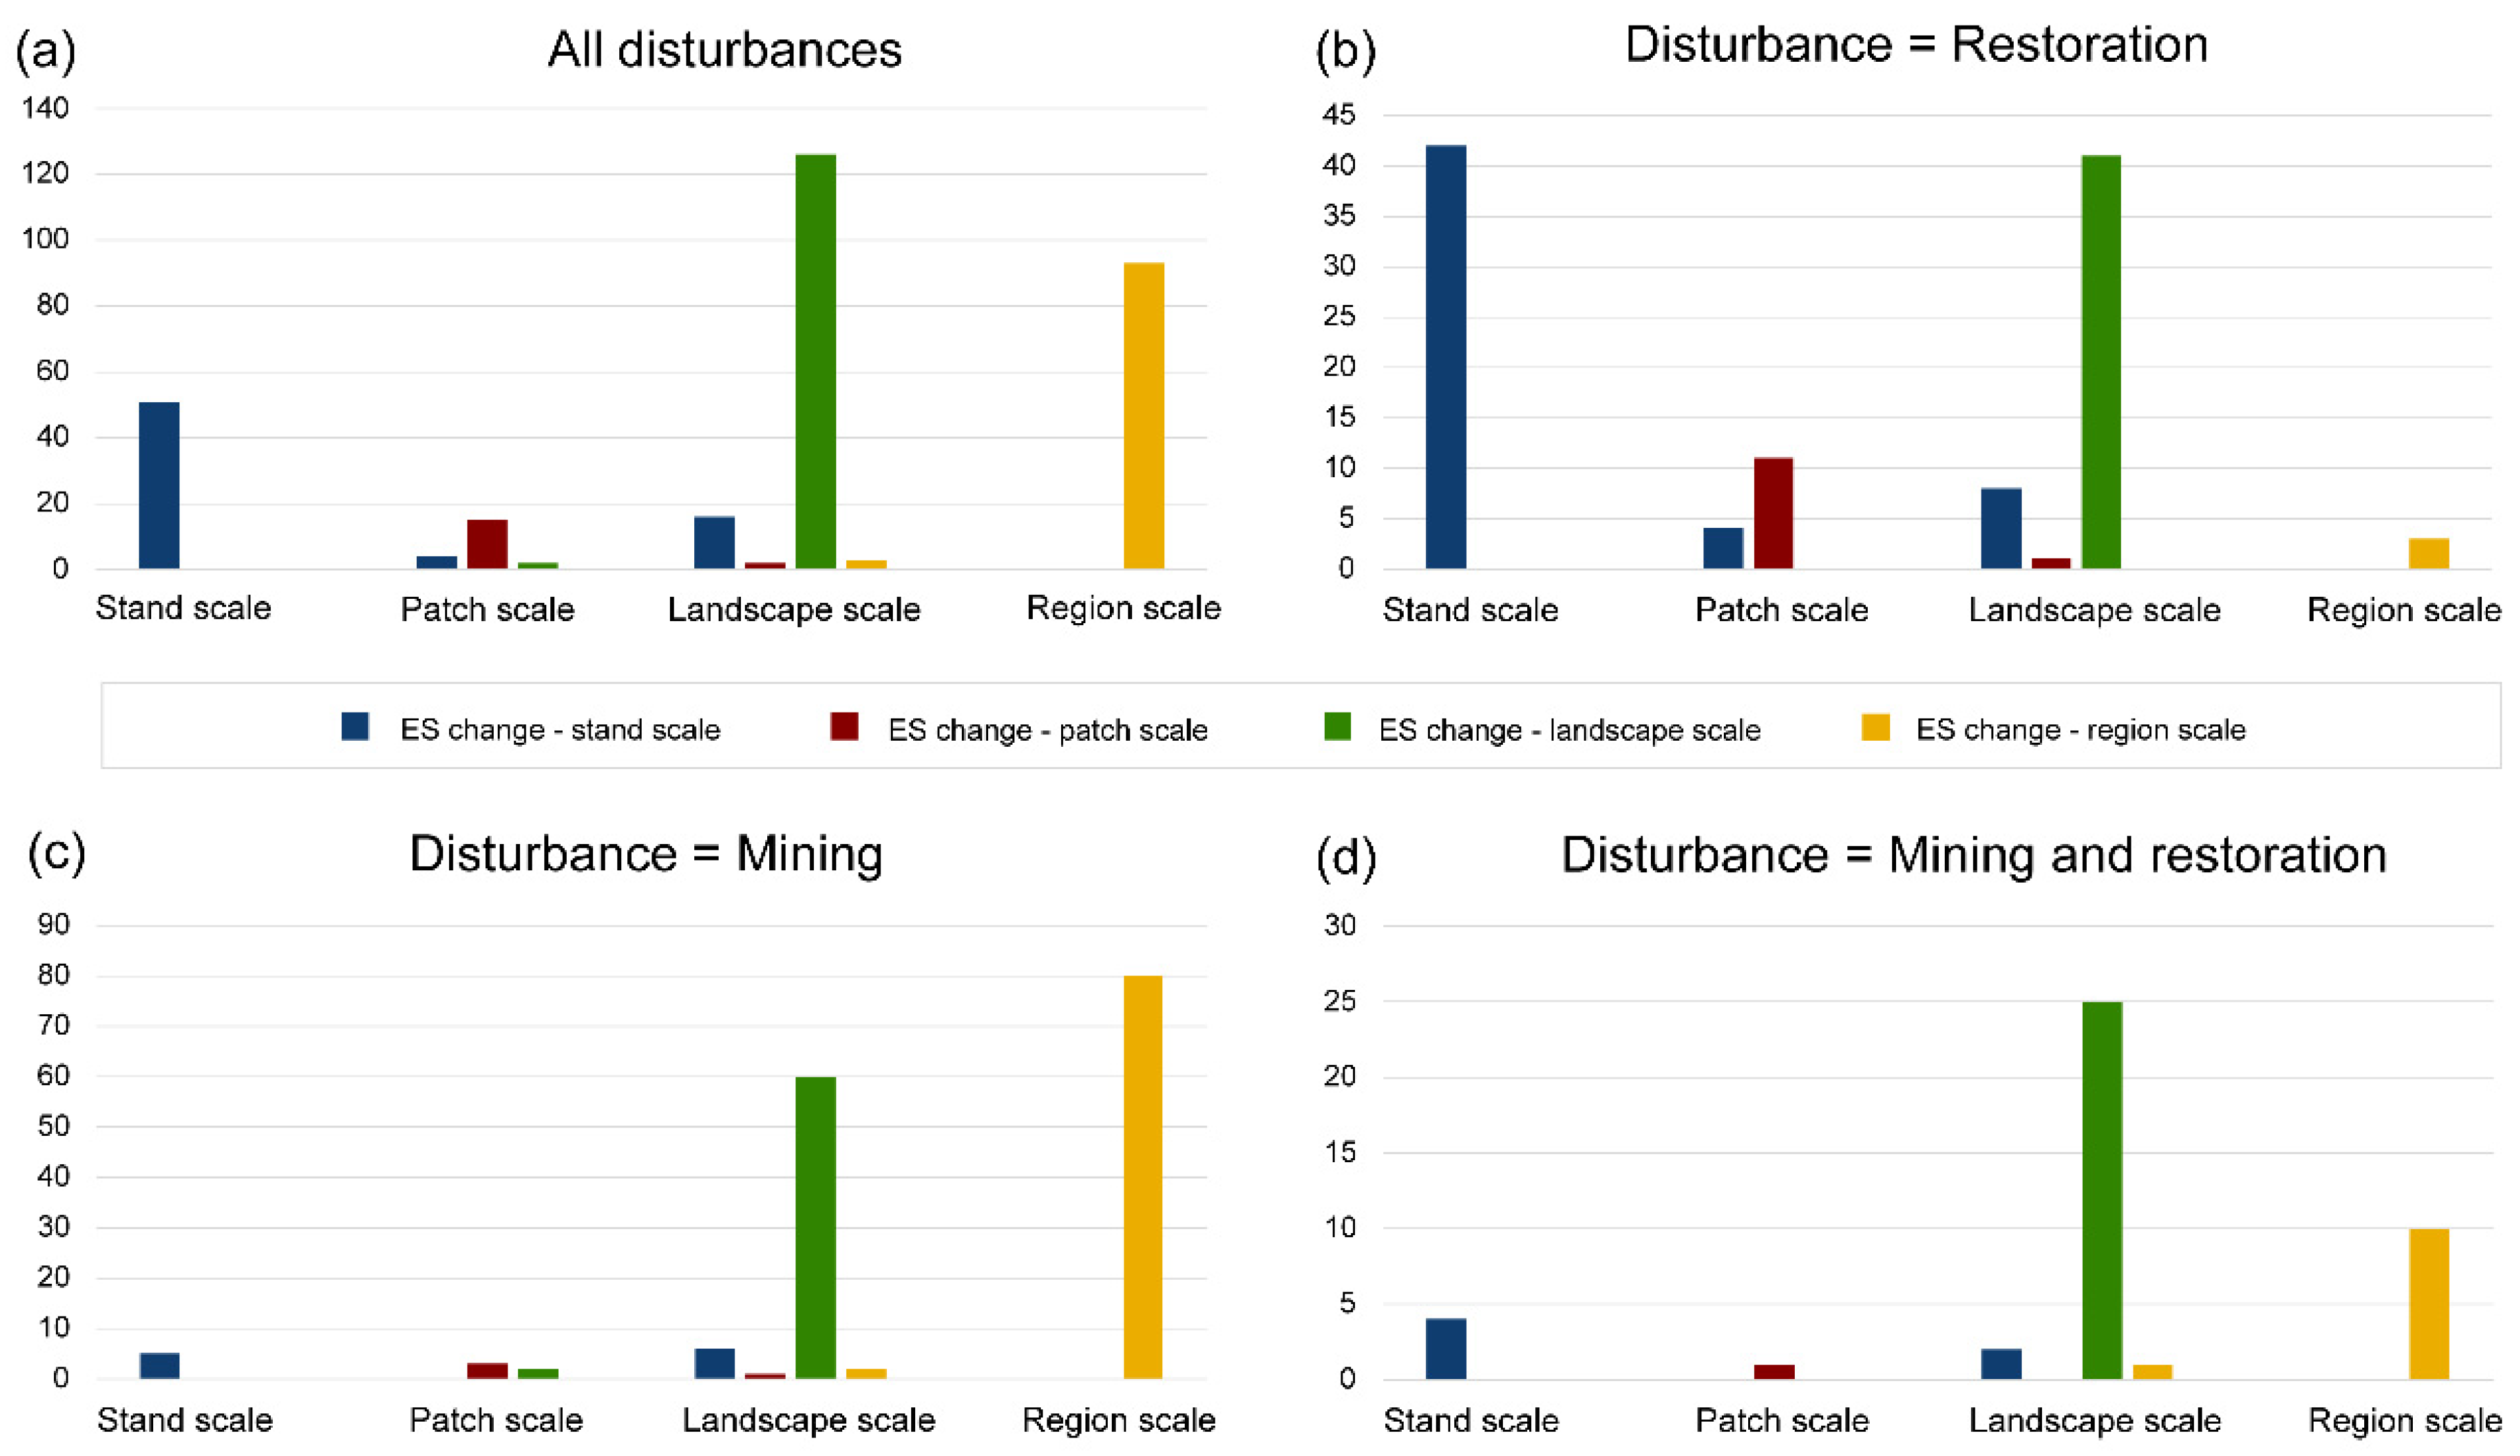
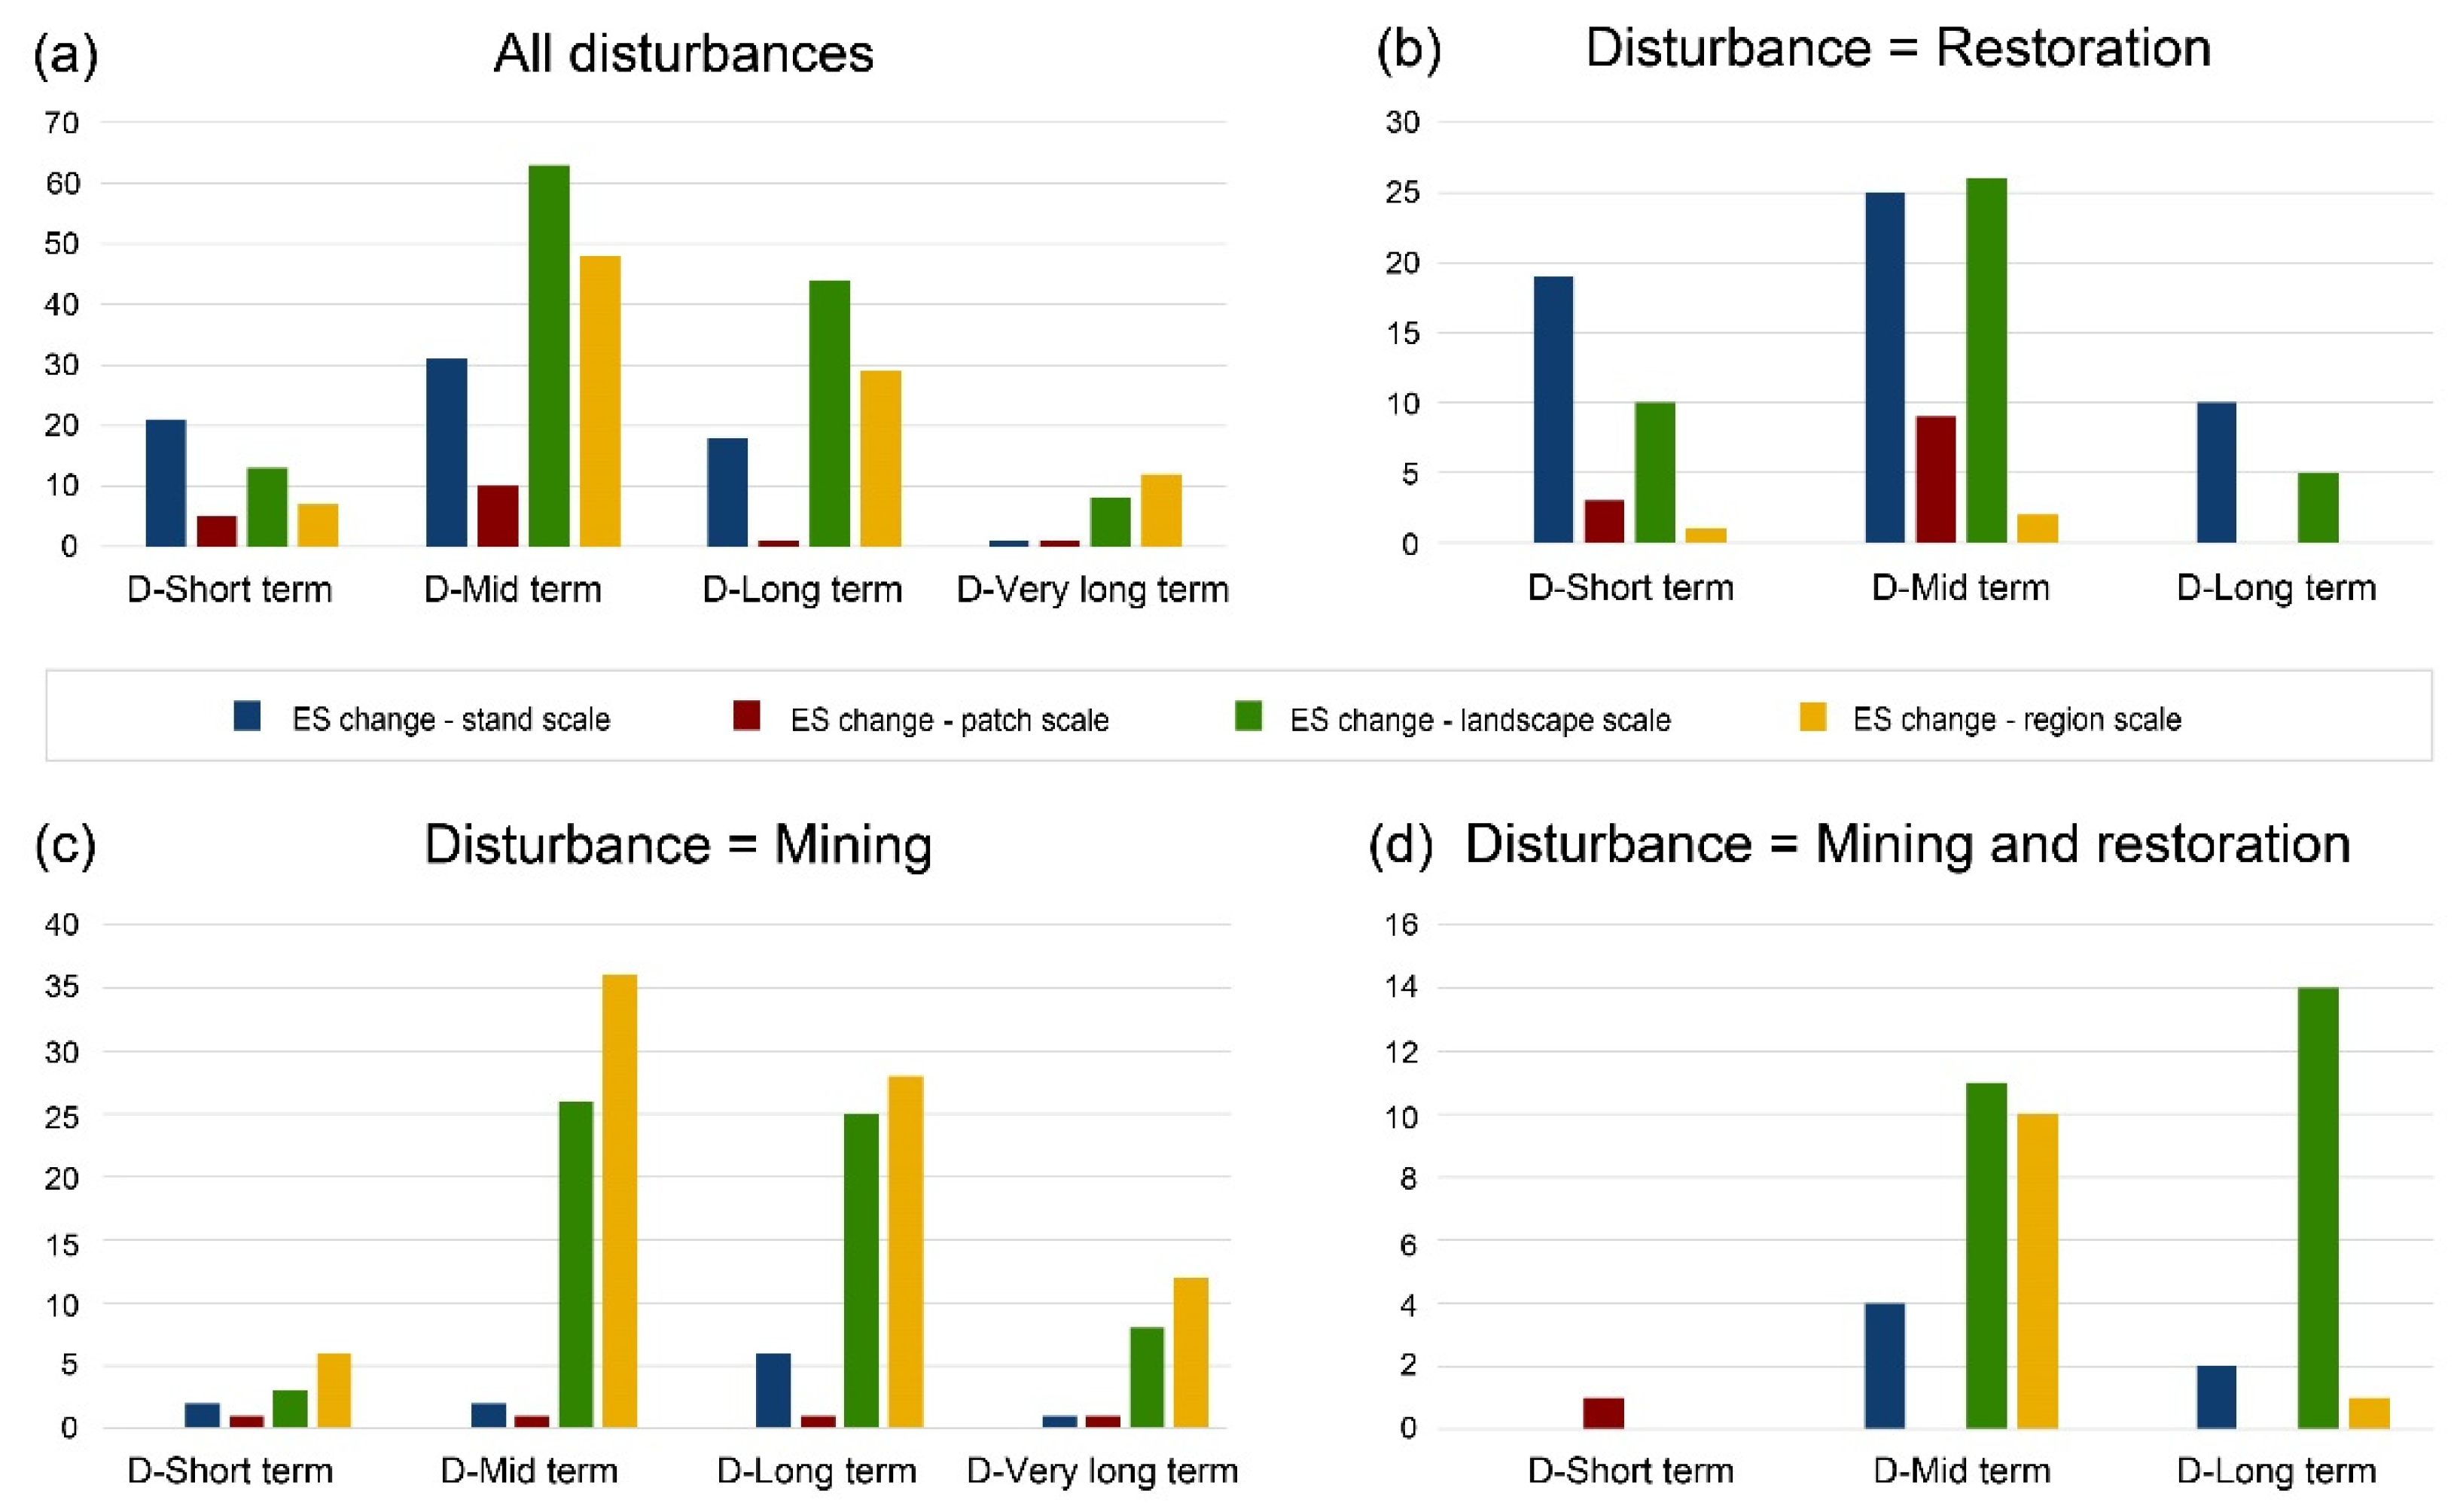
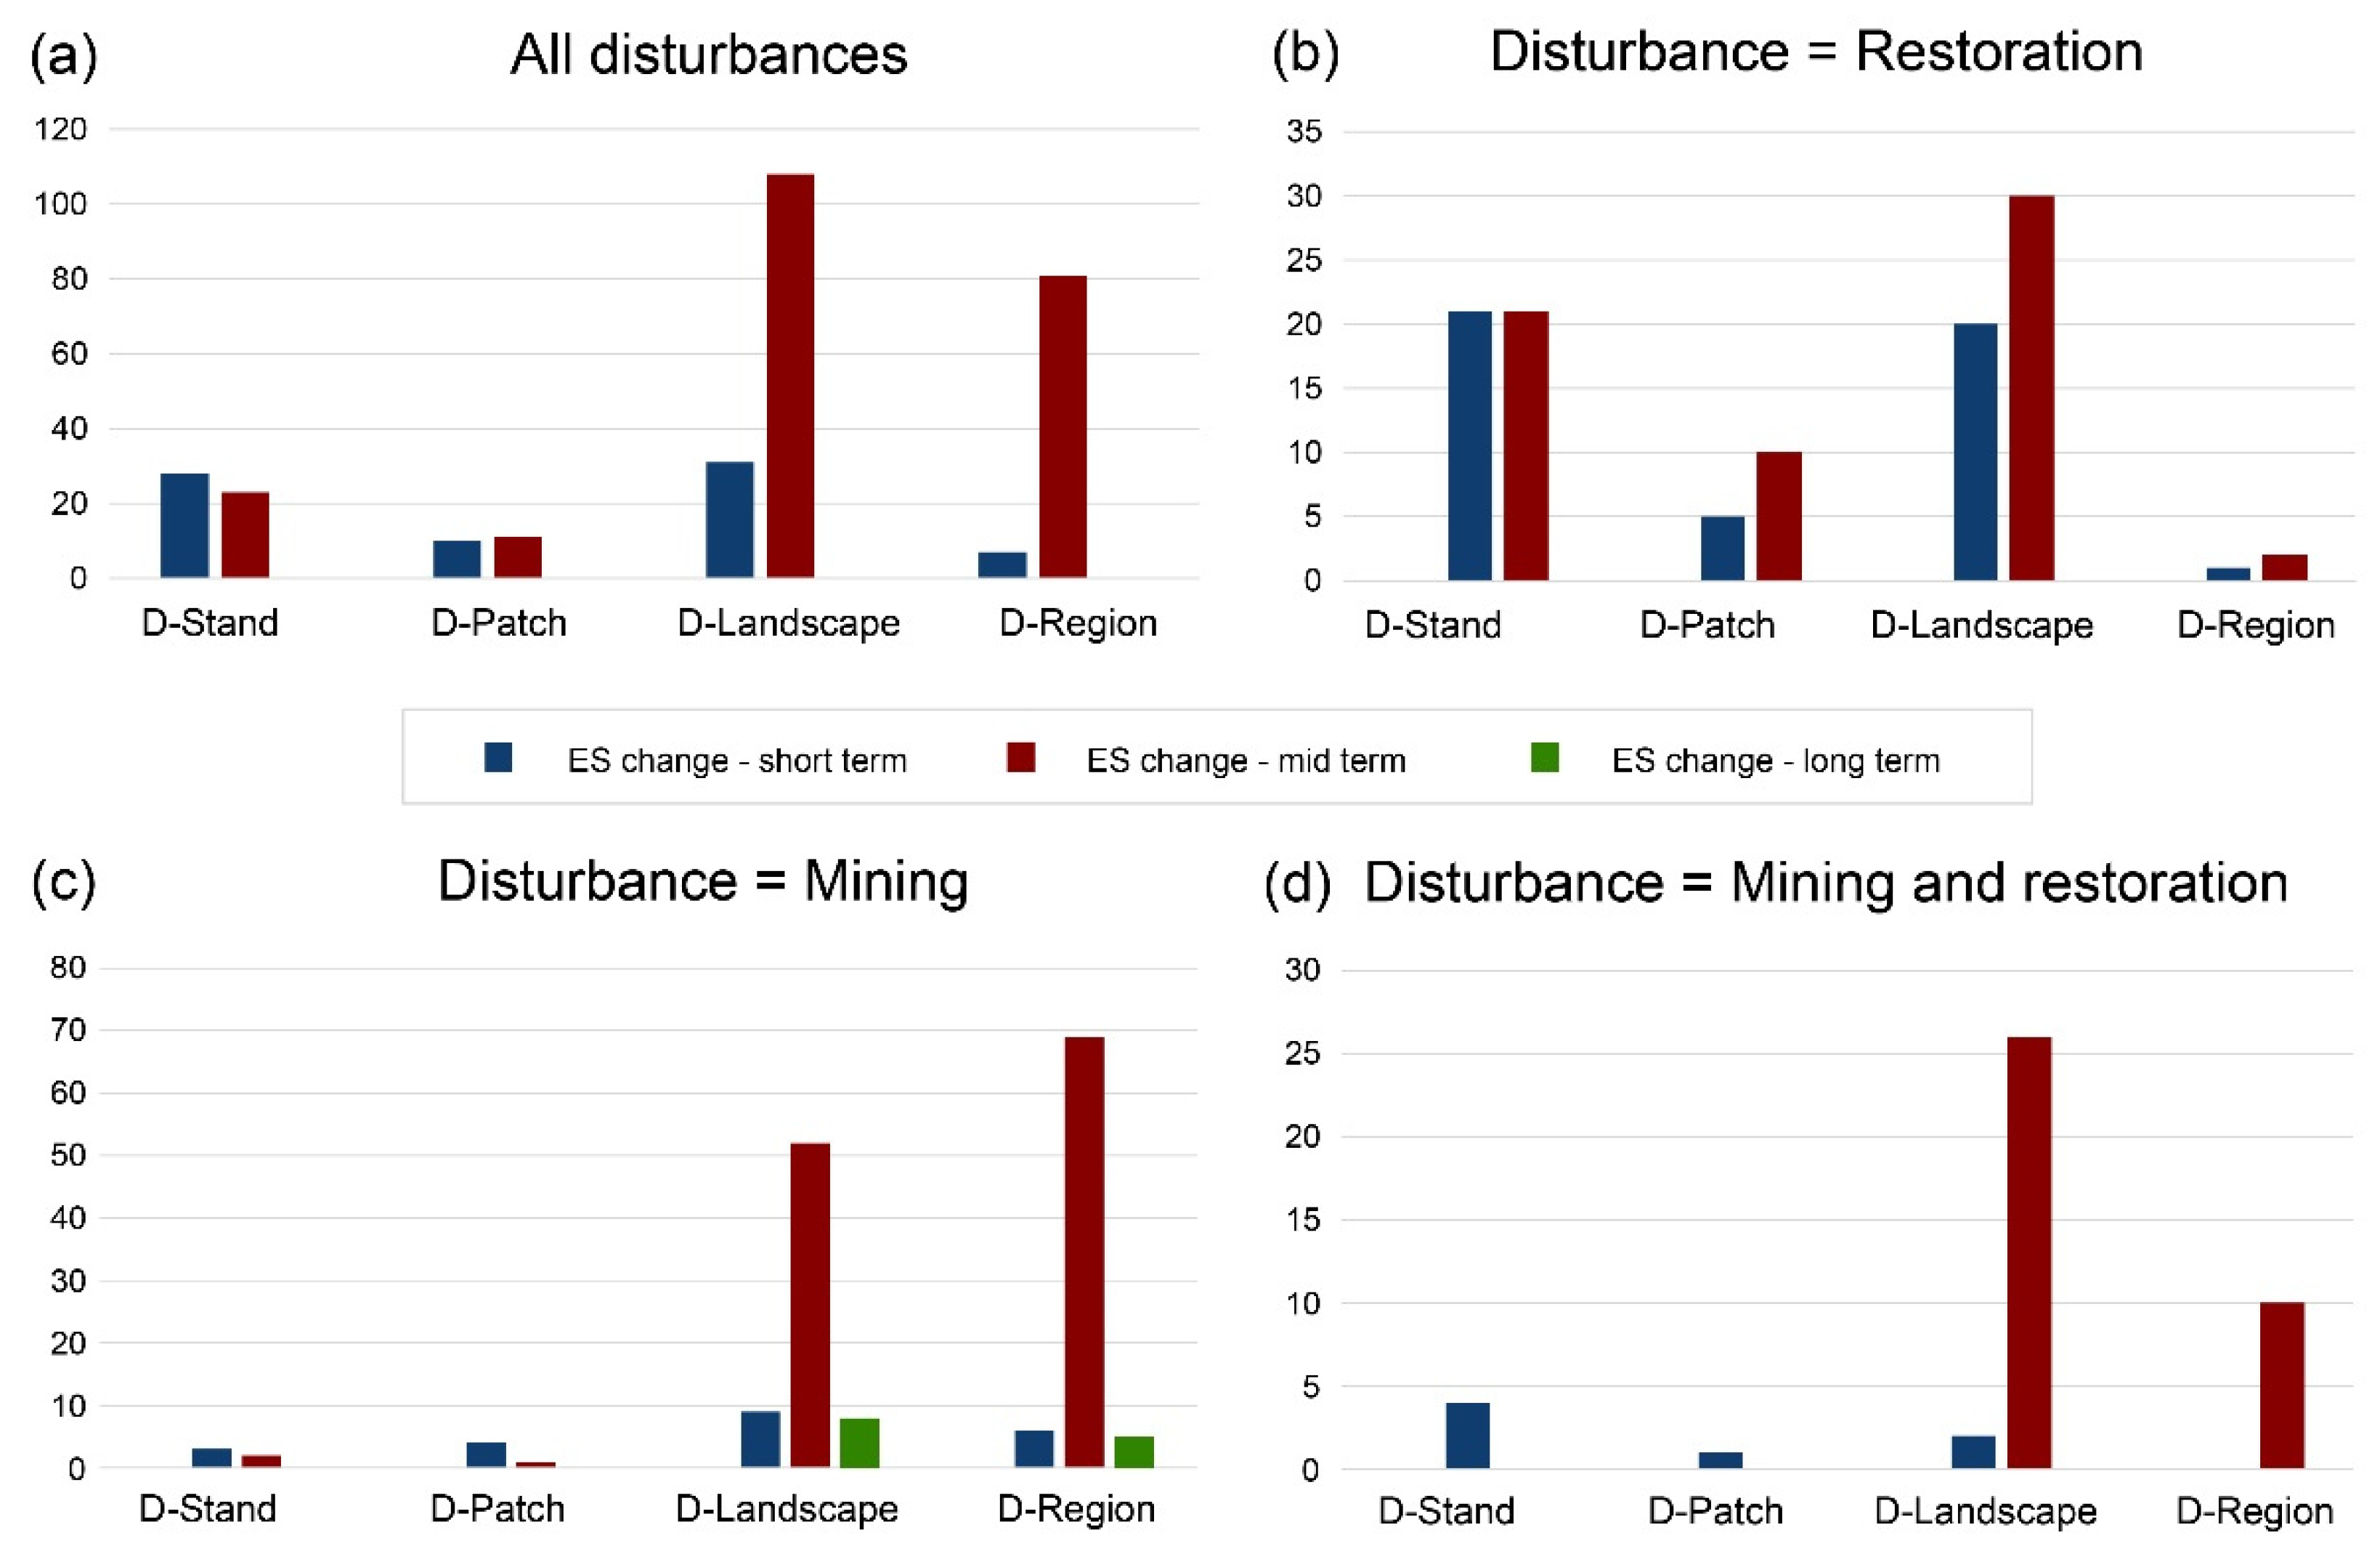
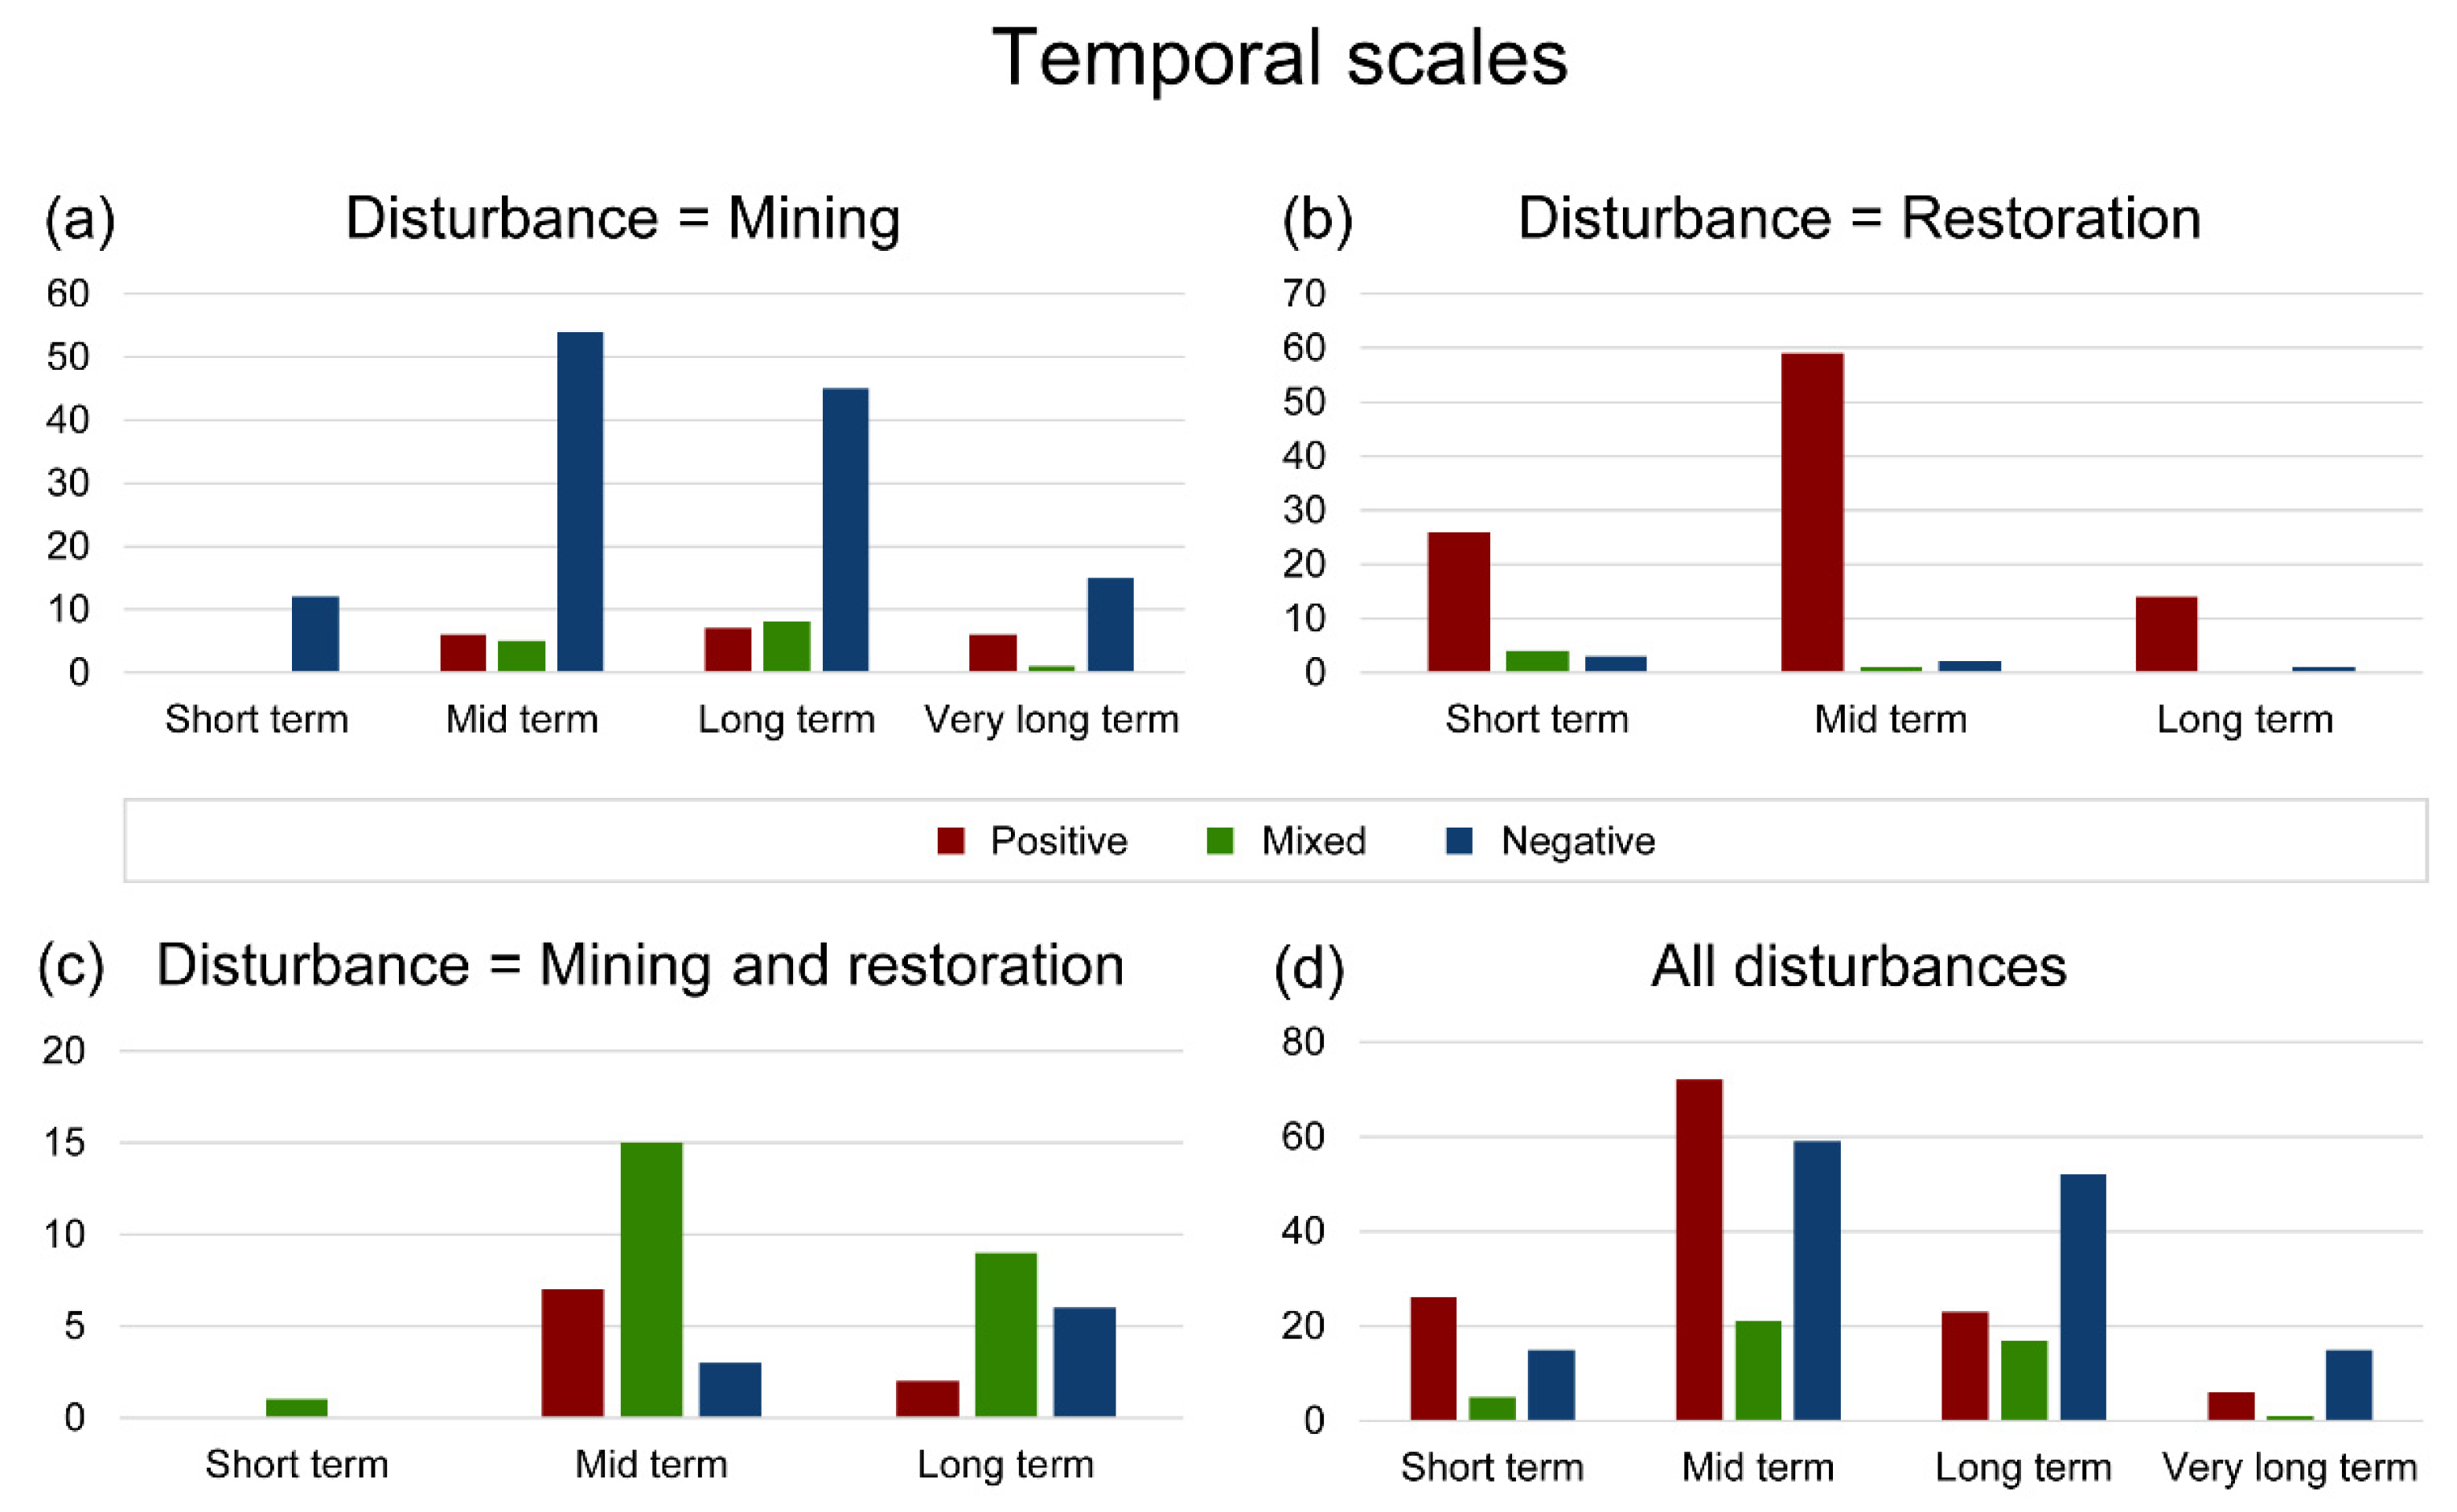
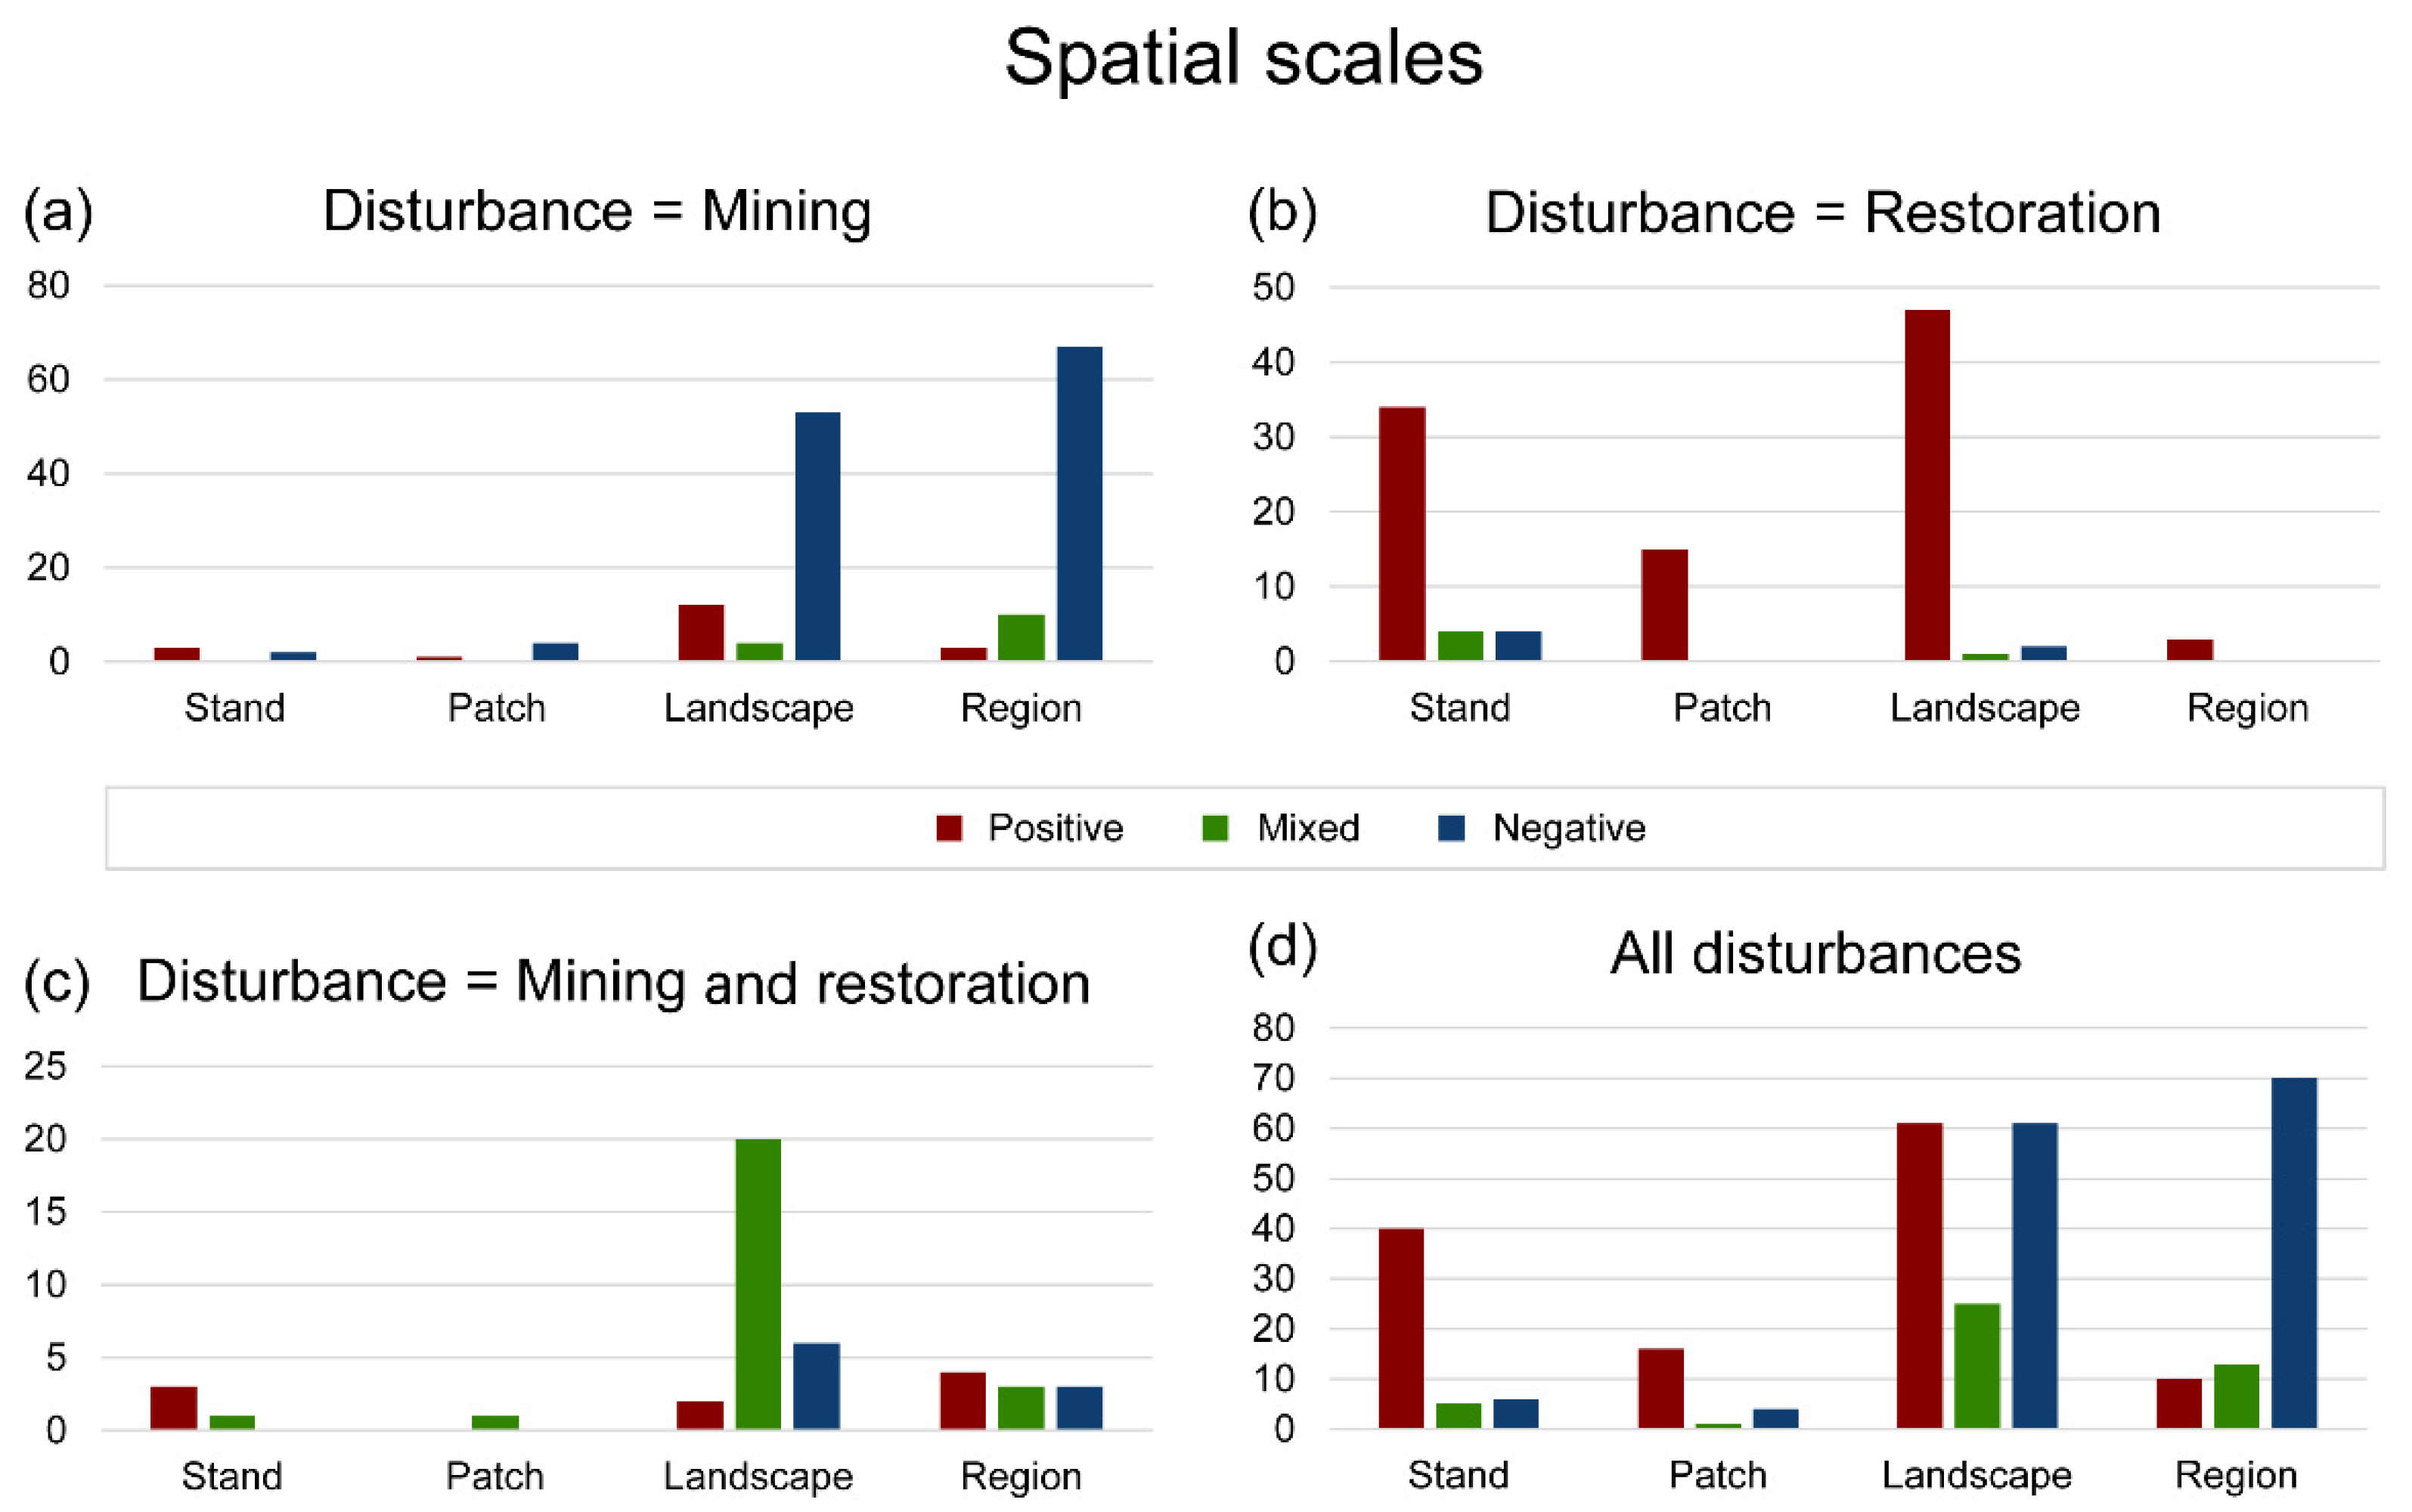
3.2. ESs Response on Temporal and Spatial Scales in Mining Areas to Human Disturbance

In our sample (n = 312) of research with spatiotemporal information, the disturbance time remained mostly mid-term (48.7%) and long-term (29.5%), and the time of ES change remained mostly short-term (24.4%) and mid-term (71.5%) (Figure 6). Furthermore, the spatial scales of disturbance and ES changed are mostly landscape (48.7% and 41%, respectively) and region (29.5% and 30.8%, respectively) (Figure 7). As shown in Table 3, studies based on field samples and observations (31.1%) predominantly considered short temporal scales and small spatial scales (i.e., stand and patch). Remote sensing methods (25%) and simulation (18.9%) were most frequently used in studies considering the mid-temporal scale and large spatial scales (i.e., landscape and region). Studies with an expert opinion approach (7.7%) preferred to assess long-term changes in ESs on a landscape scale. It can be seen that the spatiotemporal scales of ES research are associated with different research methods.
The temporal and spatial scales of ESs studies are inevitably diminished by the research methods. Nevertheless, inter-scale and cross-scale phenomena appear to be significant in explaining the changes in ESs. Our data indicate that long-term mining or restoration is likely to have short- and mid-term consequences on ESs. Beyond that, ESs change in short, mid, and long periods, based on disturbances from very long-term mining. This indicates that the impacts of disturbances on ESs might have produced a lag effect on temporal scales (Figure 6). We found that the ESs were affected at the patch and landscape scales when mining at the patch scale. However, ESs change at all spatial scales after mining at the landscape scale. In contrast, restoration at the patch scale affected ESs at the stand and patch scales. As the restoration intervention expanded to the landscape scale, ESs changed at stand, patch, and landscape scales (Figure 7). While a significant transformation (i.e., spillover effect) on spatial scales was found, it is possible that multiple factors contributed to this change. In addition, under long-term restoration activities, ESs rarely changed on a regional scale (Figure 8). Mining at each temporal scale can cause ESs to eventually change at the four spatial scales. Compared to the stand and patch scale, mining at the landscape scale makes ESs more likely to undergo long-term changes. Regardless of the size of the restoration, ESs showed short- and medium-term changes (Figure 9). This shows that, under the action of temporal and spatial scales, the impact of disturbance is more complicated and may form a cumulative effect.
In the mid-temporal scale, the impact of mining on ESs is negative compared to the positive effect of the restoration. Beyond that, there is a negative effect of mining on ESs at the landscape and regional scales, and a positive effect of restoration at stand and patch scales. However, some samples suggest that mining has a positive impact on ESs in the mid- and long-term, and that restoration has a positive impact in the short- and mid-term (Figure 10). A similar bidirectional impact was observed at the spatial scale (Figure 11). That is, the positive and negative impacts vary by spatiotemporal scales, and there may be interconversion under specific spatiotemporal conditions.
Overall, there is strong evidence for the distinct impact of disturbances on ESs at temporal and spatial scales. Table 4 and Table 5 show that the temporal and spatial scales of ES change were related to the temporal and spatial scales of the disturbances (p  <  0.001). There was a correlation between the temporal scales of disturbances and ESs (Kendall’s tau-c = 0.395, p  <  0.001), and a significant correlation between spatial scales (Kendall’s tau-b = 0.915, p  <  0.001). This suggests that temporal and spatial factors should be considered during disturbance management.

4. Discussion

Our results suggest that the impacts of disturbance on ESs have three effects (i.e., temporal lag, spatial spillover, and spatiotemporal cumulative effect) on the spatiotemporal scale and differ depending on both spatial and temporal factors, which may suggest some mechanisms for spatiotemporal ES variations post-disturbance. Global climate change influences spatiotemporal variability and may exacerbate the impacts of disturbance on ESs [63]. These findings improve our knowledge of the spatiotemporal variability of disturbance effects on ESs and have crucial implications for disturbance management and the sustainable supply of ESs in mining areas.

4.1. Possible Causes and Consequences of the Spatiotemporal Variability

There are delays in the response of ESs to disturbances, especially on long-term scales. This is likely due to the fact that ESs rarely respond instantaneously to disturbances in specific ecological processes. The impacts of mining and restoration are sustained over time [64,65,66,67,68], and may even change the ESs at the mining area for time scales in the order of decades to centuries [69,70,71]. Some studies represent an increase in the spatiotemporal lag on the pollinator and pest control functions, but at even higher lags, the carbon sequestered by large intact forests mitigates climate change, benefiting the entire global community [72]. Therefore, the length of the time lag is uncertain and may be related to the environment (e.g., geology, soil type, topography, and species composition), which may cause drastically different impacts [73].
Since strong regionality was noted for most of the disturbances [74], spatial extent is an important aspect to be considered in studies and the management of ESs [75]. Our results showed that the spatial spillover effect of mining mainly occurred at the patch and landscape scales (Figure 6), suggesting that spatial spillover effects are not significant at restricted small-scale mining and very large spatial scales, and this relationship is characterized by a hump-shaped line. In addition, at fine scales (hundreds of meters), forests in mining areas can provide important pollinator functions to adjacent fields [76,77]. At larger scales, headwater riparian areas deposit waste from mining pollution, but improved water quality is gained downstream [78]. These findings suggest that spatial spillovers in different space scales affect other ESs to a particular spatial extent. Thus, spatial spillover effects can influence multiple ES groups.
In addition, the interactive process of temporal lag and spatial spillover effects provides an opportunity to inform ES-based decision making and governance [79]. Some studies have shown that the intensity of the impact of mining activities diminishes over time, but the total area of sensitive ecosystems at risk is predicted to increase [65]. It is apparent that disturbances can potentially lead to cumulative impacts on ESs across multiple spatiotemporal scales that have emerged as particularly evident for mining areas [80,81]. This might be owing to the additive or interactive processes of temporal and spatial changes in ESs, leading to the accumulation of impacts through repetition [22]. The impacts vary by the duration and frequency of mining and restoration, where a higher intensity disturbance can cause more rapid space expansion. This further suggests that the spatiotemporal effect of ES changes could be a future concern if time lag and spatial spillover have an interactive and cumulative effect on ESs that is overlooked.

4.2. The Contribution of Climate Change to Spatiotemporal Variability

In the present study, we found that spatiotemporal variability is mediated by climate. This is likely attributed to climate change that alters the propagation and running speed of the media between disturbance receptors and disturbance sources. In most locations, there is a 1–6 month time lag between the onset of the rainy season and the seepage of adits at the mine site [82], and heavy rainfall causes pollutants to enter rivers and the sea in a short time [83]. Moreover, in tropical and summer-warm temperate climates, mining areas approached reference conditions relatively rapidly, whereas mining areas restored in cold climates had not recovered to reference conditions after 50 years [71]. Warm and large areas recover more rapidly than cold and smaller areas [84]. This indicates that the significant effects of climate on the rate and degree of spatial spillover effects may cause nonlinear changes in the temporal lag effect after disturbance [42,85,86], which complicates multiple-group ES interactions. Therefore, drastic changes in climate may result in a stronger spatial spillover effect and uncertainty of the time lag length, which may intensify the disturbance effects.
In addition, greater risk from climate stressors can intensify cumulative impacts or trigger additional (or linked) consequences [87]. Climate change alterations in food webs and aqueous environments in mining areas are likely to increase the bioaccumulation and biomagnification of metals and other contaminants in freshwater food webs [88,89], exacerbating the mining-related release of metals or other contaminants that may ultimately affect our food supply [90]. This suggests that the cumulative impacts on ESs are increased by climate change across spatiotemporal scales, which alters the flow of energy through ecosystems, biogeochemical cycling of matter, and/or the composition of biological divers [49,86]. Therefore, our current predictions of spatiotemporal cumulative effects on ESs may be greatly underestimated in the context of climate change.

4.3. Recommendations for How to Cope with the Twofold Pressure of Climate Change and Spatiotemporal Variability

The research reviewed showed that studies over timespans of several decades relied on remotely sensed data, secondary data, or simulations, whereas experimental data and field samples/observations strongly dominated short-term studies. This is owing to the higher costs of maintaining long-term research projects and the higher workload of the researchers involved. Many studies have investigated the impact of disturbance on ESs at the stand or regional scale, as their research methods limit analysis to easily quantifiable features of ecosystems [91]. Therefore, multi-scale observations are necessary [92], as they bridge the knowledge gap created by these research methods [42]. This requires a paradigm shift from the specific-technique, small-spatial-scale, and short-term perspective approach to ES assessment and management to the application of integrated cross-spatiotemporal assessments of changing ES conditions [93]. New technologies and algorithms of the Fourth Industrial Revolution should be used for assessment, and novel models should be used to elucidate ES changes in mining areas after disturbance [94,95]. These studies will contribute to the exploration of the temporal and spatial relationship between disturbance and ES changes and numerical quantification of spatiotemporal variability in future studies.
Failure to account for spatiotemporal variability and the link to ecosystem service outcomes in this progress can result in poorly informed management decisions and the misunderstanding of mechanisms of ES change [96]. Our global meta-analysis suggests that negative disturbance impacts on water ecosystems (affected by mining) and tree communities (affected by restoration) are strongly increased with temporal lag and spatial spillover since the disturbance, but positive effects on biodiversity (affected by restoration) and cultural heritage (affected by mining) also increased with this spatiotemporal effect, especially the accumulation effect due to additive or interactive processes of temporal lag and spatial spillover effects, indicating that appropriate action for disturbance would result in limited impacts on ESs while still benefiting other ESs. Different disturbance impacts on ESs (individual ESs and ES groups) and their interconversion results should be accounted for in ES sustainability management of mining areas under global climate change [97]. Thus, it is important to determine the spatiotemporal scales and threshold value of disturbance [48,98], if the spatial extent and time length of ESs are considered as the key features for determining the disturbance threshold, which favors regulating the effect of disturbance on multi-group ESs and understanding the spatiotemporal variability [99,100].
Although there are many other factors associated with spatiotemporal effects (e.g., research paradigm, disturbance threshold, and interaction among ESs [17]), uncontrollable climatic changes will increase the disturbance frequency and severity on cross-spatiotemporal scales, which makes it difficult to manage disturbances. According to our findings, the main climate-related triggers for ES changes were heavy precipitation, floods, and dry periods. The pressures from human disturbances related to climate change may push the ESs towards a heterogeneous trend [101,102]. Consequently, this has necessitated more research on the potential impacts of climate change on ecosystem services following disturbance management, as well as the feedback of ESs on climate change after management [98]. The overall coordinated development of the economy, politics, society, and ecological environment is included in the disturbance management of mines. The trade-offs between ecological resource utilization and ecological compensation from ecological footprint measurements must be assessed to modify the relationship between anthropogenic disturbance and ES protection. The environmental footprint can be used to analyze the spatiotemporal distribution characteristics and spatiotemporal heterogeneity of human disturbances [103] and to monitor, evaluate, and predict the impact of disturbances on ESs from multiple dimensions. The application of the multidimensional ecological footprint model and human footprint index at spatiotemporal scales provides a theoretical basis for effective disturbance policies [104], which is an implementation path for sustainable development in mining areas.
This study had some limitations, including that the spatiotemporal scale sample is not comprehensive because spatiotemporal data depending on specific research methods. Therefore, it is necessary to improve data-collection methods and spatiotemporal databases to explore the mechanisms that link spatiotemporal effects to ecosystem-service outcomes in the context of climate change. Moreover, owing to data limitations, quantitative analyses were not performed on the specific number of years involved, the spatial area of disturbance, and ES changes. Future research needs to quantify spatiotemporal variability and explore these relationships more rigorously.

5. Conclusions

This study reviewed 340 papers to explore the spatiotemporal variability of human disturbance impacts on ecosystem services in mining areas. We evaluated the impacts of human disturbance on ESs in mining areas and discussed the spatiotemporal effects formed during this process. This review revealed that the ES responses differed significantly from those of mining and restoration, and disturbances can cause both rapid decline and better recovery of ESs in mining areas. We found that the negative and positive impacts on ESs may be interconverted under specific conditions at spatiotemporal scales, which may be attributed to temporal lag, spatial spillover, and cumulative spatiotemporal effects. Due to ongoing climate change, the time lag effect may change nonlinearly, the spatial spillover effect complicates multi-group ESs interactions, and the spatiotemporal cumulative effect of ES changes in post-disturbance mining areas may be significantly underestimated. To address climate-change issues, we support shifting existing research methods to the application of integrated cross-spatiotemporal assessments of ES change and managing the disturbance stress through ecological footprint measurement, the disturbance threshold, and anthropogenically modified systems, which are important for the practical application of mining-resource extraction and ecological restoration.

Supplementary Materials

The following supporting information can be downloaded at: https://www.mdpi.com/article/10.3390/su14137547/s1, Supplementary Materials file, S1: 424 samples without spatiotemporal information; S2: 312 samples with partial spatiotemporal information.

Author Contributions

Conceptualization, S.L., L.L., W.L. and J.L.; methodology, L.L., S.L., W.L. and Q.Z.; software, S.L. and Y.J.; validation, S.L., and Q.Z.; formal analysis, S.L., and Q.Z.; investigation, S.L., J.L., Q.Z. and C.L.; resources, L.L., W.L. and J.L.; data curation, S.L., L.L., W.L. and C.L.; writing—original draft preparation, S.L., L.L. and Y.J; writing—review and editing, L.L. and W.L.; visualization, S.L., L.L. and Q.Z; supervision, L.L., W.L. and J.L.; project administration, W.L. and J.L.; funding acquisition, S.L., L.L. and W.L. All authors have read and agreed to the published version of the manuscript.

Funding

This research was funded by the National Natural Science Foundation of China (grant number 42177072) and the Fundamental Research Funds for the Central Universities of Central South University (grant number 1053320192307).

Institutional Review Board Statement

Not applicable.

Informed Consent Statement

Not applicable.

Data Availability Statement

Not applicable.

Acknowledgments

We would like to express our appreciation to our colleagues from the CSU and SCUT for their valuable insights and expertise, which greatly assisted this study.

Conflicts of Interest

The authors declare no conflict of interest. The funders had no role in the design of the study; in the collection, analyses, or interpretation of data; in the writing of the manuscript, or in the decision to publish the results.

References

  1. Mi, J.X.; Yang, Y.J.; Zhang, S.L.; An, S.; Hou, H.; Hua, Y.; Chen, F. Tracking the land use/land cover change in an area with underground mining and reforestation via continuous landsat classification. Remote Sens. 2019, 11, 1719. [Google Scholar] [CrossRef] [Green Version]
  2. Gläßer, C.; Thürkow, D.; Dette, C.; Scheuer, S. The development of an integrated technical-methodical approach to visualise hydrological processes in an exemplary post-mining area in central Germany. ISPRS J. Photogramm. 2010, 65, 275–281. [Google Scholar] [CrossRef]
  3. Zhang, Z.; Xia, F.; Yang, D.; Huo, J.; Wang, G.; Chen, H. Spatiotemporal characteristics in ecosystem service value and its interaction with human activities in Xinjiang, China. Ecol. Indic. 2020, 110, 105826. [Google Scholar] [CrossRef]
  4. Qindong, F.; Shengyan, D. Response of ecosystem services to land use change in county scale of Fengqiu, Henan Province, China. Arab. J. Geosci. 2015, 8, 9015–9022. [Google Scholar] [CrossRef]
  5. Wang, Z.Y.; Lechner, A.M.; Yang, Y.J.; Baumgartl, T.; Wu, J. Mapping the cumulative impacts of long-term mining disturbance and progressive rehabilitation on ecosystem services. Sci. Total Environ. 2020, 717, 137214. [Google Scholar] [CrossRef] [PubMed]
  6. Phair, N.L.; Toonen, R.J.; Knapp, I.S.S.; von der Heyden, S. Anthropogenic pressures negatively impact genomic diversity of the vulnerable seagrass Zostera capensis. J. Environ. Manag. 2020, 255, 109831. [Google Scholar] [CrossRef]
  7. Myroniuk, V.; Bilous, A.; Khan, Y.; Terentiev, A.; Kravets, P.; Kovalevskyi, S.; See, L. Tracking rates of forest disturbance and associated carbon loss in areas of illegal amber mining in Ukraine using landsat time series. Remote Sens. 2020, 12, 2235. [Google Scholar] [CrossRef]
  8. Hughes, A.C. Understanding the drivers of Southeast Asian biodiversity loss. Ecosphere 2017, 8, 33. [Google Scholar] [CrossRef]
  9. Thisani, S.K.; Kallon, D.V.V.; Byrne, P. Geochemical classification of global mine water drainage. Sustainability 2020, 12, 10244. [Google Scholar] [CrossRef]
  10. Murguía, D.I.; Bringezu, S.; Schaldach, R. Global direct pressures on biodiversity by large-scale metal mining: Spatial distribution and implications for conservation. J. Environ. Manag. 2016, 180, 409–420. [Google Scholar] [CrossRef]
  11. Alamgir, M.; Turton, S.M.; Campbell, M.J.; Macgregor, C.J.; Pert, P.L. Spatial congruence and divergence between ecosystem services and biodiversity in a tropical forested landscape. Ecol. Indic. 2018, 93, 173–182. [Google Scholar] [CrossRef]
  12. Pratiwi; Narendra, B.H.; Siregar, C.A.; Turjaman, M.; Hidayat, A.; Rachmat, H.H.; Mulyanto, B.; Suwardi; Iskandar; Maharani, R.; et al. Managing and reforesting degraded post-mining landscape in Indonesia: A review. Land 2021, 10, 658. [Google Scholar] [CrossRef]
  13. UNE. Programme. United Nations Decade on Ecosystem Restoration (2021–2030). Type Medium. 2019. Available online: https://undocs.org/en/A/RES/73/284 (accessed on 26 March 2020).
  14. UNE. Programme. Becoming #Generationrestoration: Ecosystem Restoration for People, Nature and Climate. Type Medium. 2021. Available online: https://wedocs.unep.org/bitstream/handle/20.500.11822/36251/ERPNC.pdf (accessed on 15 October 2021).
  15. Haase, D.; Schwarz, N.; Strohbach, M.; Kroll, F.; Seppelt, R. Synergies, trade-offs, and losses of ecosystem services in urban regions: An integrated multiscale framework applied to the Leipzig-Halle region, Germany. Ecol. Soc. 2012, 17, 22. [Google Scholar] [CrossRef]
  16. Kossoff, D.; Hudson-Edwards, K.A.; Howard, A.J.; Knight, D. Industrial mining heritage and the legacy of environmental pollution in the Derbyshire Derwent catchment: Quantifying contamination at a regional scale and developing integrated strategies for management of the wider historic environment. J. Archaeol. Sci. Rep. 2016, 6, 190–199. [Google Scholar] [CrossRef] [Green Version]
  17. Adesipo, A.A.; Freese, D.; Zerbe, S.; Wiegleb, G. An approach to thresholds for evaluating post-mining site reclamation. Sustainability 2021, 13, 5618. [Google Scholar] [CrossRef]
  18. Cao, Y.G.; Bai, Z.K.; Zhou, W.; Zhang, X. Characteristic analysis and pattern evolution on landscape types in typical compound area of mine agriculture urban in Shanxi Province, China. Environ. Earth Sci. 2016, 75, 15. [Google Scholar] [CrossRef]
  19. Van der Laan, C.; Budiman, A.; Verstegen, J.A.; Dekker, S.; Effendy, W.; Faaij, A.; Kusuma, A.; Verweij, P. Analyses of land cover change trajectories leading to tropical forest loss: Illustrated for the West Kutai and Mahakam ulu districts, east Kalimantan, Indonesia. Land 2018, 7, 108. [Google Scholar] [CrossRef] [Green Version]
  20. Li, X.; Li, X.B.; Wang, H.; Zhang, M.; Kong, F.; Li, G.; Tian, M.; Huang, Q. Spatiotemporal assessment of ecological security in a typical steppe ecoregion in Inner Mongolia. Pol. J. Environ. Stud. 2018, 27, 1601–1617. [Google Scholar] [CrossRef]
  21. Franke, M.E.; Zipper, C.; Barney, J.N. Invasive autumn olive performance varies in different reclamation conditions: Implications for restoration. Restor. Ecol. 2019, 27, 600–606. [Google Scholar] [CrossRef]
  22. Clark, M.R.; Durden, J.M.; Christiansen, S. Environmental impact assessments for deep-sea mining: Can we improve their future effectiveness? Mar. Policy 2020, 114, 9. [Google Scholar] [CrossRef]
  23. Qian, D.W.; Yan, C.Z.; Xiu, L.N.; Feng, K. The impact of mining changes on surrounding lands and ecosystem service value in the southern slope of Qilian Mountains. Ecol. Complex. 2018, 36, 138–148. [Google Scholar] [CrossRef]
  24. Yu, L.; Xu, Y.D.; Xue, Y.M.; Li, X.; Cheng, Y.; Liu, X.; Porwal, A.; Holden, E.; Yang, J.; Gong, P. Monitoring surface mining belts using multiple remote sensing datasets: A global perspective. Ore Geol. Rev. 2018, 101, 675–687. [Google Scholar] [CrossRef]
  25. Laplante, K.; Sébastien, B.; Derome, N. Parallel changes of taxonomic interaction networks in lacustrine bacterial communities induced by a polymetallic perturbation. Evol. Appl. 2013, 6, 643–659. [Google Scholar] [CrossRef] [PubMed]
  26. Crane, R.A.; Sinnett, D.E.; Cleall, P.J.; Sapsford, D.J. Physicochemical composition of wastes and co-located environmental designations at legacy mine sites in the south west of England and Wales: Implications for their resource potential. Resour. Conserv. Recy. 2017, 123, 117–134. [Google Scholar] [CrossRef]
  27. Trabucchi, M.; Puente, C.; Comin, F.A.; Olague, G.; Smith, S.V. Mapping erosion risk at the basin scale in a Mediterranean environment with opencast coal mines to target restoration actions. Reg. Environ. Chang. 2012, 12, 675–687. [Google Scholar] [CrossRef] [Green Version]
  28. Collins, Y.A. Colonial residue: Redd plus, territorialisation and the racialized subject in Guyana and Suriname. Geoforum 2019, 106, 38–47. [Google Scholar] [CrossRef]
  29. Temper, L.; Martinez-Alier, J. The god of the mountain and Godavarman: Net present value, indigenous territorial rights and sacredness in a bauxite mining conflict in India. Ecol. Econ. 2013, 96, 79–87. [Google Scholar] [CrossRef]
  30. Ferreira, P.C.; Pupin, B.; Rangel, D.E.N. Stress tolerance of soil fungal communities from native Atlantic Forests, reforestations, and a sand mining degraded area. Fungal Biol. 2018, 122, 400–409. [Google Scholar] [CrossRef]
  31. Sinnett, D. Going to waste? The potential impacts on nature conservation and cultural heritage from resource recovery on former mineral extraction sites in England and Wales. J. Environ. Plan. Manag. 2019, 62, 1227–1248. [Google Scholar] [CrossRef] [Green Version]
  32. Heneberg, P.; Řezáč, M. First evidence of the formation of secondary strongholds of threatened epigeic spiders (Araneae) in oligotrophic anthropogenic wetlands that form in sand pits and gravel-sand pits. Ecol. Eng. 2018, 119, 84–96. [Google Scholar] [CrossRef]
  33. Kuznetsov, D.; Rabkina, N.; Ryabova, M.; Valko, O. Coal-mining industry as a forming factor of social, cultural, and linguistic environment of Kuzbass as resource region of Siberia. In E3S Web of Conferences; Tyulenev, M., Zhironkin, S., Khoreshok, A., Voth, S., Cehlar, M., Nuray, D., Janocko, J., Anyona, S., Tan, Y., Abay, A., et al., Eds.; IVth International Innovative Mining Symposium; EDP Sciences: Les Ulis, France, 2019; Volume 105. [Google Scholar] [CrossRef]
  34. Yuan, H.S.; Li, J.; Yin, D.; Chen, X. Evoking the industrial past at the urban-rural border region: Social movements and cultural production. Sustainability 2020, 12, 8249. [Google Scholar] [CrossRef]
  35. Hackworth, Z.J.; Lhotka, J.M.; Cox, J.J.; Barton, C.; Springer, M. First-year vitality of reforestation plantings in response to herbivore exclusion on reclaimed Appalachian surface-mined land. Forests 2018, 9, 222. [Google Scholar] [CrossRef] [Green Version]
  36. Oliphant, A.J.; Li, J.; Wynne, R.H.; Zipper, C.E. Identifying woody vegetation on coal surface mines using phenological indicators with multitemporal landsat imagery. In Isprs Technical Commission I Symposium; Toth, C., Holm, T., Jutzi, B., Eds.; Copernicus Gesellschaft: Göttingen, Germany, 2014; pp. 339–345. [Google Scholar]
  37. Zipper, C.E.; Burger, J.A.; Skousen, J.G.; Angel, P.N.; Barton, C.D.; Davis, V.; Franklin, J.A. Restoring forests and associated ecosystem services on Appalachian coal surface mines. Environ. Manag. 2011, 47, 751–765. [Google Scholar] [CrossRef] [PubMed]
  38. Qiu, J.; Carpenter, S.R.; Booth, E.G.; Motew, M.; Kucharik, C.J. Spatial and temporal variability of future ecosystem services in an agricultural landscape. Landsc. Ecol. 2020, 35, 2569–2586. [Google Scholar] [CrossRef]
  39. Alday, J.G.; Marrs, R.H.; Martínez-Ruiz, C. Vegetation succession on reclaimed coal wastes in Spain: The influence of soil and environmental factors. Appl. Veg. Sci. 2011, 14, 84–94. [Google Scholar] [CrossRef]
  40. Andersen, L. Magic light, Silver City: The business of culture in Broken Hill. Aust. Geogr. 2010, 41, 71–85. [Google Scholar] [CrossRef] [Green Version]
  41. Meli, P.; Holl, K.D.; Rey Benayas, J.M.R.; Jones, H.P.; Jones, P.C.; Montoya, D.; Moreno Mateos, D. A global review of past land use, climate, and active vs. passive restoration effects on forest recovery. PLoS ONE 2017, 12, 17. [Google Scholar] [CrossRef]
  42. Rau, A.L.; Burkhardt, V.; Dorninger, C.; Hjort, C.; Ibe, K.; Keßler, L.; Kristensen, J.A.; McRobert, A.; Sidemo-Holm, W.; Zimmermann, H.; et al. Temporal patterns in ecosystem services research: A review and three recommendations. Ambio 2020, 49, 1377–1393. [Google Scholar] [CrossRef]
  43. Martín-López, B.; Gómez-Baggethun, E.; Lomas, P.L.; Montes, C. Effects of spatial and temporal scales on cultural services valuation. J. Environ. Manag. 2009, 90, 1050–1059. [Google Scholar] [CrossRef]
  44. Renard, D.; Rhemtulla, J.M.; Bennett, E.M. Historical dynamics in ecosystem service bundles. Proc. Natl Acad. Sci. USA 2015, 112, 13411–13416. [Google Scholar] [CrossRef] [Green Version]
  45. Wang, J.L.; Zhao, F.Q.; Yang, J.; Li, X. Mining site reclamation planning based on land suitability analysis and ecosystem services evaluation: A case study in Liaoning Province, China. Sustainability 2017, 9, 890. [Google Scholar] [CrossRef] [Green Version]
  46. M.E. Assessment. Ecosystems and Human Well-Being: Synthesis. Type of Medium. 2005. Available online: http://www.millenniumassessment.org/documents/document.356.aspx.pdf (accessed on 22 June 2020).
  47. Vela-Almeida, D.; Brooks, G.; Kosoy, N. Setting the limits to extraction: A biophysical approach to mining activities. Ecol. Econ. 2015, 119, 189–196. [Google Scholar] [CrossRef]
  48. Magris, R.A.; Marta-Almeida, M.; Monteiro, J.A.F.; Ban, N.C. A modelling approach to assess the impact of land mining on marine biodiversity: Assessment in coastal catchments experiencing catastrophic events (Sw Brazil). Sci. Total Environ. 2019, 659, 828–840. [Google Scholar] [CrossRef] [Green Version]
  49. Waddington, J.M.; Morris, P.J.; Kettridge, N.; Granath, G.; Thompson, D.K.; Moore, P.A. Hydrological feedbacks in northern peatlands. Ecohydrology 2015, 8, 113–127. [Google Scholar] [CrossRef]
  50. Longo, M.H.C.; Rodrigues, R.R. Ecosystem services analysis in environmental impact assessments: Proposal and application in a mining project. Desenvolv. Meio Ambiente 2017, 43, 103–125. [Google Scholar]
  51. Vihervaara, P.; Rönkä, M.; Walls, M. Trends in ecosystem service research: Early steps and current drivers. Ambio 2010, 39, 314–324. [Google Scholar] [CrossRef]
  52. Sacchelli, S.; Fabbrizzi, S.; Bernetti, I.; Menghini, S. State of the art of ecosystem services research at the global level: A multiscale quantitative review. Int. J. Environ. Sustain. Dev. 2017, 16, 359–378. [Google Scholar] [CrossRef]
  53. McDonough, K.; Hutchinson, S.; Moore, T.; Hutchinson, J.M.S. Analysis of publication trends in ecosystem services research. Ecosyst. Serv. 2017, 25, 82–88. [Google Scholar] [CrossRef]
  54. Boldy, R.; Santini, T.; Annandale, M.; Erskine, P.D.; Sonter, L.J. Understanding the impacts of mining on ecosystem services through a systematic review. Extr. Ind. Soc.-Int. J. 2021, 8, 457–466. [Google Scholar] [CrossRef]
  55. Cortinovis, C.; Geneletti, D.; Hedlund, K. Synthesizing multiple ecosystem service assessments for urban planning: A review of approaches, and recommendations. Landsc. Urban Plan. 2021, 213, 104129. [Google Scholar] [CrossRef]
  56. Thom, D.; Seidl, R. Natural disturbance impacts on ecosystem services and biodiversity in temperate and boreal forests. Biol. Rev. Camb. Philos. Soc. 2016, 91, 760–781. [Google Scholar] [CrossRef] [PubMed]
  57. Nahuelhual, L.; Laterra, P.; Villarino, S.; Mastrángelo, M.; Carmona, A.; Jaramillo, A.; Barral, P.; Burgos, N. Mapping of ecosystem services: Missing links between purposes and procedures. Ecosyst. Serv. 2015, 13, 162–172. [Google Scholar] [CrossRef]
  58. Longépée, E.; Ahmed Abdallah, A.A.; Jeanson, M.; Golléty, C. Local ecological knowledge on mangroves in Mayotte Island (Indian Ocean) and influencing factors. Forests 2021, 12, 53. [Google Scholar] [CrossRef]
  59. Rosa, J.C.S.; Geneletti, D.; Morrison-Saunders, A.; Sánchez, L.E.; Hughes, M. To what extent can mine rehabilitation restore recreational use of forest land? Learning from 50 years of practice in Southwest Australia. Land Use Policy 2020, 90, 11. [Google Scholar] [CrossRef]
  60. Mason, T.J.; Krogh, M.; Popovic, G.C.; Glamore, W.; Keith, D.A. Persistent effects of underground longwall coal mining on freshwater wetland hydrology. Sci. Total Environ. 2021, 772, 144772. [Google Scholar] [CrossRef]
  61. Corredor, J.A.G.; Perez, E.H.; Figueroa, R.; Casas, A.F. Water quality of streams associated with artisanal gold mining; Suarez, department of Cauca, Colombia. Heliyon 2021, 7, e07047. [Google Scholar] [CrossRef]
  62. Asyakina, L.K.; Dyshlyuk, L.S.; Prosekov, A.Y. Reclamation of post-technological landscapes: International experience. Food Process. Tech. Technol. 2022, 51, 805–818. [Google Scholar] [CrossRef]
  63. Ramachandra, T.V.; Bharath, S.; Gupta, N. Modelling landscape dynamics with Lst in protected areas of Western Ghats, Karnataka. J. Environ. Manag. 2018, 206, 1253–1262. [Google Scholar] [CrossRef]
  64. Rodríguez-Uña, A.; Hidalgo-Castañeda, J.; Salcedo, I.; Moreno Mateos, D. Interaction recovery between European beech (Fagus sylvatica) and Ectomycorhizal fungi 140 years after the end of mining. Ecosistemas 2019, 28, 61–68. [Google Scholar] [CrossRef] [Green Version]
  65. Lv, X.J.; Xiao, W.; Zhao, Y.L.; Zhang, W.; Li, S.; Sun, H. Drivers of spatio-temporal ecological vulnerability in an arid, coal mining region in Western China. Ecol. Indic. 2019, 106, 18. [Google Scholar] [CrossRef]
  66. Woodbury, D.J.; Yassir, I.; Arbainsyah; Doroski, D.A.; Queenborough, S.A.; Ashton, M.S. Filling a void: Analysis of early tropical soil and vegetative recovery under leguminous, post-coal mine reforestation plantations in east Kalimantan, Indonesia. Land Degrad. Dev. 2020, 31, 473–487. [Google Scholar] [CrossRef]
  67. Van der Heyde, M.; Bunce, M.; Dixon, K.; Wardell-Johnson, G.; White, N.E.; Nevill, P. Changes in soil microbial communities in post mine ecological restoration: Implications for monitoring using high throughput DNA sequencing. Sci. Total Environ. 2020, 749, 142262. [Google Scholar] [CrossRef] [PubMed]
  68. Haffert, L.; Haeckel, M.; de Stigter, H.; Janssen, F. Assessing the temporal scale of deep-sea mining impacts on sediment biogeochemistry. Biogeosciences 2020, 17, 2767–2789. [Google Scholar] [CrossRef]
  69. Montserrat, F.; Guilhon, M.; Corrêa, P.V.F.; Bergo, N.M.; Signori, C.N.; Tura, P.M.; de losSantos Maly, M.; Moura, D.; Jovane, L.; Pellizari, V.; et al. Deep-sea mining on the Rio Grande Rise (southwestern Atlantic): A review on environmental baseline, ecosystem services and potential impacts. Deep Sea Res. I 2019, 145, 31–58. [Google Scholar] [CrossRef]
  70. Martin, P.A.; Newton, A.C.; Bullock, J.M. Carbon pools recover more quickly than plant biodiversity in tropical secondary forests. Proc. Biol. Sci. 2013, 280, 20132236. [Google Scholar] [CrossRef]
  71. Eisenhauer, N. Plant diversity effects on soil microorganisms: Spatial and temporal heterogeneity of plant inputs increase soil biodiversity. Pedobiologia 2016, 59, 175–177. [Google Scholar] [CrossRef]
  72. Fremier, A.K.; DeClerck, F.A.J.; Bosque-Pérez, N.A.; Carmona, N.E.; Hill, R.; Joyal, T.; Keesecker, L.; Klos, P.Z.; Martínez-Salinas, A.; Niemeyer, R.; et al. Understanding spatiotemporal lags in ecosystem services to improve incentives. BioScience 2013, 63, 472–482. [Google Scholar] [CrossRef]
  73. Bennett, L.T.; Mele, P.M.; Annett, S.; Kasel, S. Examining links between soil management, soil health, and public benefits in agricultural landscapes: An Australian perspective. Agric. Ecosyst. Environ. 2010, 139, 1–12. [Google Scholar] [CrossRef]
  74. Motiejūnaitė, J.; Børja, I.; Ostonen, I.; Bakker, M.R.; Bjarnadottir, B.; Brunner, I.; Iršėnaitė, R.; Mrak, T.; Oddsdóttir, E.S.; Lehto, T. Cultural ecosystem services provided by the biodiversity of forest soils: A European review. Geoderma 2019, 343, 19–30. [Google Scholar] [CrossRef]
  75. de Mello, K.; Taniwaki, R.H.; de Paula, F.R.; Valente, R.A.; Randhir, T.O.; Macedo, D.R.; Leal, C.G.; Rodrigues, C.B.; Hughes, R.M. Multiscale land use impacts on water quality: Assessment, planning, and future perspectives in brazil. J. Environ. Manag. 2020, 270, 110879. [Google Scholar] [CrossRef]
  76. Ricketts, T.H. Tropical forest fragments enhance pollinator activity in nearby coffee crops. Conserv. Biol. 2004, 18, 1262–1271. [Google Scholar] [CrossRef]
  77. Avelino, J.; Romero-Gurdián, A.; Cruz-Cuellar, H.F.; Declerck, F.A. Landscape context and scale differentially impact coffee leaf rust, coffee berry borer, and coffee root-knot nematodes. Ecol. Appl. 2012, 22, 584–596. [Google Scholar] [CrossRef] [PubMed] [Green Version]
  78. Lecce, S.A.; Pavlowsky, R.T. Floodplain storage of sediment contaminated by mercury and copper from historic gold mining at Gold Hill, North Carolina, USA. Geomorphology 2014, 206, 122–132. [Google Scholar] [CrossRef]
  79. Kang, T.; Yang, S.; Bu, J.; Chen, J.; Gao, Y. Quantitative assessment for the dynamics of the main ecosystem services and their interactions in the northwestern arid area, China. Sustainability 2020, 12, 803. [Google Scholar] [CrossRef] [Green Version]
  80. Wang, Z.Y.; Lechner, A.M.; Baumgartl, T. Mapping cumulative impacts of mining on sediment retention ecosystem service in an Australian mining region. Int. J. Sustain. Dev. World Ecol. 2018, 25, 69–80. [Google Scholar] [CrossRef]
  81. Geneletti, D.; Biasiolli, A.; Morrison-Saunders, A. Land take and the effectiveness of project screening in environmental impact assessment: Findings from an empirical study. Environ. Impact Assess. Rev. 2017, 67, 117–123. [Google Scholar] [CrossRef]
  82. Dobson, P.F.; Ghezzehei, T.A.; Cook, P.J.; Rodríguez-Pineda, J.A.; Villalba, L.; De la Garza, R. Heterogeneous seepage at the nopal I natural analogue site, Chihuahua, Mexico. Hydrogeol. J. 2012, 20, 155–166. [Google Scholar] [CrossRef] [Green Version]
  83. Albert, S.; Kvennefors, C.; Jacob, K.; Kera, J.; Grinham, A. Environmental change in a modified catchment downstream of a Gold Mine, Solomon Islands. Environ. Pollut. 2017, 231, 942–953. [Google Scholar] [CrossRef]
  84. Moreno-Mateos, D.; Power, M.E.; Comín, F.A.; Yockteng, R. Structural and functional loss in restored wetland ecosystems. PLOS Biol. 2012, 10, e1001247. [Google Scholar] [CrossRef] [Green Version]
  85. Lu, J.; Yang, Z.; Ma, X.; Ma, M.; Zhang, Z. The role of meteorological factors on mumps incidence among children in Guangzhou, Southern China. PLoS ONE 2020, 15, e0232273. [Google Scholar] [CrossRef]
  86. Sutherland, I.J.; Villamagna, A.M.; Dallaire, C.O.; Bennett, E.M.; Chin, A.T.M.; Yeung, A.C.Y.; Lamothe, K.A.; Tomscha, S.A.; Cormier, R. Undervalued and under pressure: A plea for greater attention toward regulating ecosystem services. Ecol. Indic. 2018, 94, 23–32. [Google Scholar] [CrossRef]
  87. Lopes, C.L.; Bastos, L.; Caetano, M.; Martins, I.; Santos, M.M.; Iglesias, I. Development of physical modelling tools in support of risk scenarios: A new framework focused on deep-sea mining. Sci. Total Environ. 2019, 650, 2294–2306. [Google Scholar] [CrossRef] [PubMed]
  88. Alava, J.J.; Cisneros-Montemayor, A.M.; Sumaila, U.R.; Cheung, W.W.L. Projected amplification of food web bioaccumulation of Mehg and PCbs under climate change in the northeastern Pacific. Sci. Rep. 2018, 8, 13460. [Google Scholar] [CrossRef] [PubMed]
  89. Schartup, A.T.; Thackray, C.P.; Qureshi, A.; Dassuncao, C.; Gillespie, K.; Hanke, A.; Sunderland, E.M. Climate change and overfishing increase neurotoxicant in marine predators. Nature 2019, 572, 648–650. [Google Scholar] [CrossRef] [PubMed]
  90. Levin, L.A.; Wei, C.L.; Dunn, D.C.; Amon, D.J.; Ashford, O.S.; Cheung, W.W.L.; Colaço, A.; Dominguez-Carrió, C.; Escobar, E.G.; Harden-Davies, H.R.; et al. Climate change considerations are fundamental to management of deep-sea resource extraction. Glob. Change Biol. 2020, 26, 4664–4678. [Google Scholar] [CrossRef]
  91. Wen, X.; Théau, J. Assessment of ecosystem services in restoration programs in China: A systematic review. Ambio 2020, 49, 584–592. [Google Scholar] [CrossRef]
  92. Gu, L.P.; Kong, J.J.; Chen, K.; Guo, Y.Q. Monitoring soil biological properties during the restoration of a phosphate mine under different tree species and plantation types. Ecotoxicol. Environ. Saf. 2019, 180, 130–138. [Google Scholar] [CrossRef]
  93. Sherman, K. Adaptive management institutions at the regional level: The case of large marine ecosystems. Ocean. Coast. Manag. 2014, 90, 38–49. [Google Scholar] [CrossRef]
  94. Kinh Bac, D.; Thuy, N.T.; Huu Hao, N.; Burkhard, B.; Müller, F.; Dang, V.B.; Nguyen, H.; Ngo, V.L.; Pham, T.P.N. Integrated methods and scenarios for assessment of sand dunes ecosystem services. J. Environ. Manag. 2021, 289, 112485. [Google Scholar]
  95. Li, S.; Wang, J.; Zhang, M.; Tang, Q. Characterizing and attributing the vegetation coverage changes in North Shanxi coal base of China from 1987 to 2020. Resour. Policy 2021, 74, 102331. [Google Scholar] [CrossRef]
  96. Dade, M.C.; Mitchell, M.G.E.; McAlpine, C.A.; Rhodes, J.R. Assessing ecosystem service trade-offs and synergies: The need for a more mechanistic approach. Ambio 2019, 48, 1116–1128. [Google Scholar] [CrossRef] [PubMed]
  97. Li, S.; Zhao, Y.; Xiao, W.; Yellishetty, M.; Yang, D. Identifying ecosystem service bundles and the spatiotemporal characteristics of trade-offs and synergies in coal mining areas with a high groundwater table. Sci. Total Environ. 2022, 807, 151036. [Google Scholar] [CrossRef] [PubMed]
  98. Dong, X.B.; Dai, G.S.; Ulgiati, S.; Na, R.; Zhang, X.; Kang, M.; Wang, X. On the relationship between economic development, environmental integrity and well-being: The point of view of herdsmen in Northern China grassland. PLoS ONE 2015, 10, e0134786. [Google Scholar] [CrossRef] [PubMed]
  99. Li, J.; Liang, J.; Wu, Y.; Yin, S.; Yang, Z.; Hu, Z. Quantitative evaluation of ecological cumulative effect in mining area using a pixel-based time series model of ecosystem service value. Ecol. Indic. 2021, 120, 106873. [Google Scholar] [CrossRef]
  100. Damptey, F.G.; de la Riva, E.G.; Birkhofer, K. Trade-offs and synergies between food and fodder production and other ecosystem services in an actively restored forest, natural forest and an agroforestry system in Ghana. Front. For. Glob. Change 2021, 4, 630959. [Google Scholar] [CrossRef]
  101. Oliveras, I.; Malhi, Y. Many shades of green: The dynamic tropical forest-savannah transition zones. Philos. Trans. R. Soc. Lond. B Biol. Sci. 2016, 371, 20150308. [Google Scholar] [CrossRef] [Green Version]
  102. Bovolo, C.I.; Wagner, T.; Parkin, G.; Hein-Griggs, D.; Pereira, R.; Jones, R. The guiana shield rainforests-overlooked guardians of South American climate. Environ. Res. Lett. 2018, 13, 12. [Google Scholar] [CrossRef]
  103. Chen, Y.; Qiao, Y.; Yan, P.; Lu, H.; Yang, L.; Xia, J. Spatial-temporal variation and nonlinear prediction of environmental footprints and comprehensive environmental pressure in urban agglomerations. J. Clean. Prod. 2022, 351, 131556. [Google Scholar] [CrossRef]
  104. Li, X.; Xiao, L.; Tian, C.; Zhu, B.; Chevallier, J. Impacts of the ecological footprint on sustainable development: Evidence from China. J. Clean. Prod. 2022, 352, 131472. [Google Scholar] [CrossRef]
Figure 1. Research keywords of documents searched for (“ecosystem services”) AND (“mine” OR “mining”).
Sustainability 14 07547 g001
Figure 2. Flow chart of the integrative review.
Sustainability 14 07547 g002
Figure 3. The number of articles in our database and the WoS in 2010–2020.
Sustainability 14 07547 g003
Figure 4. Geographic distribution of disturbances and disturbed ecosystem types. The pie charts represent the relative share of ecosystem types disturbed on each continent. The size of the circles and the percentage after the circle represent the relative share of three disturbance conditions in each continent, while the percentage after the continent name indicates the relative share of all disturbances in each continent.
Sustainability 14 07547 g004
Figure 5. Distribution of the disturbance impacts in ES categories. Under the disturbance of (a) mining, (b) restoration, (c) mining and restoration, and (d) all disturbances, the distribution of disturbance impacts (positive, negative, mixed) in ESs (expressed as a percentage). The blue series indicates samples with spatiotemporal information, which together with the red series constitute the total sample. ES acronyms are as follows: FO-food, FW-fresh water, FI-fiber, GR-genetic resources, BNMP-biochemicals, natural medicines and pharmaceuticals, AQR-air quality regulation, CR-climate regulation, DR-disease regulation, ER-erosion regulation, NHR-natural hazard regulation, PO-pollination, WR-water regulation, WPWT-water purification and waste treatment, AV-aesthetic values, CHV-cultural heritage values, EV-educational values, IN-inspiration, KS-knowledge systems, RE-recreation and ecotourism, SRV-spiritual and religious values, SR-social relations, SP-sense of place, NC-nutrient cycling, PP-primary production, PH-photosynthesis, SF-soil formation, WC-water cycling.
Sustainability 14 07547 g005
Figure 6. Temporal scales of disturbances and ES changes. The distribution of disturbances (i.e., mining, restoration, mining and restoration, all disturbances) and ES changes at temporal scale. (a) all disturbances, (b) disturbance = restoration, (c) disturbance = mining, (d) disturbance = mining and restoration.
Sustainability 14 07547 g006
Figure 7. Spatial scales of disturbances and ES changes. The distribution of disturbances (i.e., mining, restoration, mining and restoration, all disturbances) and ES changes at spatial scale. (a) all disturbances, (b) disturbance = restoration, (c) disturbance = mining, (d) disturbance = mining and restoration.
Sustainability 14 07547 g007
Figure 8. Spatial scales of ES changes after different temporal scales of disturbance. Under the different disturbance conditions (i.e., mining, restoration, mining and restoration, all disturbances), the spatial scales (i.e., stand, patch, landscape, and region, represented by blue, red, green, and yellow, respectively) of ESs change in different time periods. (a) all disturbances, (b) disturbance = restoration, (c) disturbance = mining, (d) disturbance = mining and restoration.
Sustainability 14 07547 g008
Figure 9. Temporal scales of ES changes after different spatial scales of disturbance. Under the different disturbance conditions (i.e., mining, restoration, mining and restoration, all disturbances), the temporal scales (i.e., short, mid, and long term, represented by blue, red, and green, respectively) of ESs change after disturbance at different spatial scales. (a) all disturbances, (b) disturbance = restoration, (c) disturbance = mining, (d) disturbance = mining and restoration.
Sustainability 14 07547 g009
Figure 10. Impacts of different disturbances on ESs at various temporal scales. (a) disturbance = mining, (b) disturbance = restoration, (c) disturbance = mining and restoration, (d) all disturbances.
Sustainability 14 07547 g010
Figure 11. Impacts of different disturbances on ESs at various spatial scales. (a) disturbance = mining, (b) disturbance = restoration, (c) disturbance = mining and restoration, (d) all disturbances.
Sustainability 14 07547 g011
Table 1. Search terms of disturbance and ecosystem services (ESs) and their respective synonyms are used in the research analysis.
Search TermsSynonyms
Mining
AND
Ecosystem service
Quarry

Cultural service; provisioning service; regulating service; supporting service
Restoration
AND
Ecosystem service
AND
Mine
Ecological restoration; phytoremediation; reclamation; rehabilitation; revegetation
Cultural service; provisioning service; regulating service; supporting service

Management
AND
Ecosystem service
AND
Mine


Supporting service; cultural service; provisioning service; regulating service
Table 2. The strength and direction of correlation between dependent (effect types of disturbance on ESs) and independent variables (disturbance factors).
Adjusted Standardized Residuals (ASRs)
IndicatorPositiveMixedNegativePearson Chi-SquareContingency Coefficient
Mining−13.5−4.315.8433.739 ***0.609 ***
Restoration16.2−2.6−14.4
Mining and Restoration−3.513.0−4.0
*** represents statistical significant < 0.001.
Table 3. Research methodology and spatiotemporal scales of ES changes (n = 312) regarding disturbance impacts on ESs in mining areas.
Research Methodology
Temporal ScaleSpatial ScaleExpert OpinionEmpiricalMixedRemote SensingSimulationQuestionnaireTotal
Short termStand033203442
Patch0601007
Landscape211302220
Region0131207
Mid termStand027011029
Patch07101110
Landscape1391338198100
Region33163428084
Long termLandscape4013008
Region2000305
Total 249739785915312
Table 4. Correlation of disturbance with ES changes on temporal scales.
Adjusted Standardized Residuals (ASRs)
DisturbanceESs-ShortESs-MidESs-LongpKendall’s Tau-c
Short term12.9−11.6−1.50.0000.39475468 ***
Mid term−6.37.6−3.6
Long term−1.92.8−2.4
Very long term−2.2−3.813.4
*** represents statistical significance < 0.001. Adjusted standardized residuals of +3.0 or greater (marked in red) indicate a positive relationship and a higher strength of correlation, while adjusted standardized residuals of −3.0 or less (marked in blue) indicate a negative relationship and a lower strength of correlation.
Table 5. Correlation of disturbance with ES changes on spatial scales.
Adjusted Standardized Residuals (ASRs)
DisturbanceESs-StandESs-PatchESs-LandscapeESs-RegionpKendall’s Tau-b
Stand14.4−1.9−6.5−5.20.0000.914621497 ***
Patch−0.413.8−3.0−3.2
Landscape−4.7−3.015.1−10.4
Region−6.2−2.8−9.617.3
*** represents statistical significance < 0.001. Adjusted standardized residuals of +3.0 or greater (marked in red) indicate a positive relationship and a higher strength of correlation, while adjusted standardized residuals of −3.0 or less (marked in blue) indicate a negative relationship and a lower strength of correlation.
Publisher’s Note: MDPI stays neutral with regard to jurisdictional claims in published maps and institutional affiliations.

