Article

Development and Optimization of a Sustainable Process Assisted by Microwave Energy to Dye Cellulosic Fabrics by Juglans regia Barks Residues Extract

1
Research Laboratory-Environmental Chemistry and Clean Processes (LR21ES04), Faculty of Sciences of Monastir, University of Monastir, Monastir 5000, Tunisia
2
Department of Early Childhood, University College of Turabah, Taif University, P.O. Box 11099, Taif 21944, Saudi Arabia
*
Author to whom correspondence should be addressed.
Sustainability 2022, 14(13), 7534; https://doi.org/10.3390/su14137534
Submission received: 6 May 2022 / Revised: 16 June 2022 / Accepted: 17 June 2022 / Published: 21 June 2022
(This article belongs to the Topic Solid Waste Management)

Abstract

:
Juglans regia barks contain a diversity of phenolic compounds. Two of the most important groups of phenolic compounds are tannins, and flavonoids. These latter, possess different antioxidant, anti-inflammatory, and antibacterial properties. This paper explores the usefulness of dyeing cellulosic fabrics, namely cotton, with Juglans regia barks residues extract. The dyeing process proposed was assisted by microwave energy. The impact of the main dyeing conditions (percentage of cationizing agent, pH, dyeing duration, and microwave power) on the color strength (K/S) and the L*, a*, b*, C*, and h* coordinates were studied. Optimization experiments were carried out using a definitive screening type plan (MINITAB 19). It was found that the best conditions to achieve the dyeing of cellulosic fabrics were: a pH of 6.23; a percentage of cationizing agent of 6.5%; a microwave power of 690 W, and a dyeing duration of 4.5 min.

1. Introduction

The majority of plants produce a variety of secondary metabolites, and among them are phenolic compounds, such as anthocyanins, flavonoids, and tannins. Numerous textile scientists have focused on using the phenolic compounds as natural dyes for textile materials [1,2].
The growing environmental concern related to the use of synthetic dyes, and adjuvants has led us to think of alternative natural dyes that could be used in the coloring of textiles [3], cosmetics, and foods [4,5]. Throughout history, dyes have been of major importance in cultural and economic exchanges between different regions of the world. Indeed, these dyes offer a rich palette of colors for dyeing textiles, papers, animal skins, hair, and certain foods [6]. These dyes could be classified according to whether they are of vegetable, animal or mineral origins [7]. Until the end of the last century, natural dyes were the principal source of colors for all textiles commonly used by humans [8]. These dyes are supposed protected just as of their anti-toxic, anti-allergenic properties, and biodegradable nature [9].
The main criterion for selecting sources of natural dyes is the availability of the raw material. Thus, reliable extraction techniques must be used for the maximum extraction of colorants with minimum environmental pollution. It is necessary to advance unconventional techniques for extracting natural dyes from plant materials for dyeing applications [10,11]. Microwave-assisted extraction has been applied to the extraction of organic compounds of very different type of matrix, thanks to these ecological and economic advantages (saves solvent, fast, and efficient in terms of energy use). This method accelerates the transfer of energy, facilitates the solvation of analytes, and promotes the breaking of hydrogen bonds.
Contrary to conventional heating techniques by convection or conduction, the employment of microwaves involves a direct interaction between electromagnetic radiation and matter (plant). Microwave heating of a product thus results from the heat conversion of the energy of an electromagnetic wave inside material [12]. This specific transfer of energy induces a transfer of matter whose mechanisms differ notably from those of conventional solid-liquid extraction. The efficiency, whether in terms of kinetics or extraction yield or in terms of selectivity (purity of the products) of microwave-assisted extraction processes, is in correlation with these conditions of transfer of matter and energy [13].
Swak, or Juglans regia bark, is another type of natural wood that helps whiten teeth and keep the mouth healthy thanks to its powerful antioxidant activity. Its bark is rich in phenolic compounds such as Tannins and flavonoids [14]. In this framework, this study aims to value the residues of Juglans regia barks as a natural source of dye in order to avoid harmful synthetic dyes and explore waste in the right direction.
Cotton is the widely used natural textile fiber in clothing thanks to its sensory and thermal properties that give an excellent comfort sensation. In this paper, the cationization of cotton was carried out through a cationizing agent “sera fast” to obtain better adsorption properties and an electropositive charge on the fabric surface [15].
According to the literature, many studies have been reported on dyeing properties of Juglans regia on different textile fibers. In fact, Hwang and Park, (2013) focused on the dyeing properties of silk fibers by the application of green walnut husk [16]. Moreover, Ali et al., (2016) used Juglans regia barks to study the effect of potassium aluminum sulphate mordant on dyeing quality of wool fibers [17]. Concerning this study, it is the extension of work reported by Ben Ticha et al., (2021, 2022) in which the microwave assisted extraction process of Juglans regia barks was developed and optimized [18]. In this paper, the aim was to focus on the development and optimization of the dyeing process which was also assisted by microwave energy in order to dye cotton fabrics by Juglans Regia barks residues extract in optimal conditions. Moreover, mordanting process was studied and was assisted by microwave energy. Fastness tests of the cotton samples dyed with the colored extract obtained under the optimal microwave dyeing conditions were also studied. The mordanting process developed a wide range of beautiful shades on cotton.
The present project aims to develop a sustainable dyeing process of cationized cotton with Juglans regia barks residues. In order to determine the optimal response (K/S); the effect of dyeing power, percentage of cationizing agent, and dyeing duration on the dyeing quality were exanimated as well as the relationship between parameters.

2. Materials and Methods

2.1. Material Preparation

Juglans regia barks residues used in this project were picked up from Fernena region (a city located in the North-West of Tunisia) in 2018. The samples were washed and rinsed to eliminate impurities, then dried and ground to obtain a smooth powder.

2.2. Extraction Process of Natural Dye

An amount of 5 g of the powder of Juglans regia barks residues was placed in one liter of distilled water, and the extraction process was carried out in a microwave at a power of about 850 W and an extraction time of 4 min.

2.3. Determination of the Content of Colored Compounds

The determination of the content of flavonoids is estimated by the alcl3 method [19], the standard used is the catechin. The determination of the content of condensed tannins is based on the condensation of polyphenolic compounds with vanillin in an acid medium [20], the condensed tannin concentration is calculated from the regression equation of the catechin standard [19]. The determination of the content of hydrolyzable tannins is based on a reaction with ferric chloride. The mixture of the tannic extract with the ferric chloride reagent causes the complexion to turn purple-red, resulting in the formation of ions. The concentration of hydrolyzable tannins is calculated from the regression equation for the standard gallic acid [21].

2.4. Spectroscopic Analysis of Colored Components

The extract of Juglans regia barks was characterized by UV Visible spectroscopy (Camspec M501 single Beam UV/Vis spectrophotometer) after appropriate dilution. The visible spectrum was obtained in the 250–800 nm wavelength range.

2.5. Microwave Dyeing Process

The samples of cotton fabric were measured to 1 g. The dyeing bath ratio was 1 g of the fiber/40 mL of Juglans regia barks extract with a concentration of 5 g/L. The pH of all baths was adjusted to desired values (3–13) using NaOH and HCl solutions, both at 1 M concentration. The dyeing process was carried out using microwave. The machine was programmed for each combination of power (160–850 W), duration (0.5–5 min) and cationizing agent (0–17%). Afterwards, the obtained fabrics were thoroughly rinsed with water and dried.

2.6. Mordanting Processes

The pre-mordanting method was tested by using five mordants (copper sulfate, tin chloride, tannic acid, mimosa, and iron sulfate). All pre-mordanting were done out at 350 W for 3 min with 3% of mordant (3%/sample mass). Then the samples were rinsed with water, and subsequently dried and dyed with the barks extract.

2.7. Dyeing Quality Evaluation

The spectral reflectance of the samples dyed with Juglans regia barks extract was calculated using Spectraflash (SF300) spectrophotometer with data Master 2.3 software (Data Color International, Lawrenceville, NJ, USA). The color strength (K/S) values were measured by Kubelka-Munk [22] equation:
K S = 1 R 2 2 R 1 R 0 2 2 R 0
where: R is the reflectance decimal fraction of colored sample; R0 is the reflectance decimal fraction of uncolored sample; K is the absorption coefficient and S is the scattering coefficient.
Concerning the CIELab coordinates: L*, a*, b*, C*, h (where L*: lightness; a*: red/green value; b*: yellow/blue value; C*: saturation value, and h*: hue) were calculated from the reflectance data for 10° observer and illuminant D65.

2.8. Testing the Fastness Properties of Dyed Fabrics

The fastness properties of dyed samples were measured according to standard methods, namely the washing fastness (ISO 105-C06, 2010), light fastness (ISO 105-B02, 2015), and rubbing fastness (ISO 105-X12, 2016).

2.9. Fourier Transform Infrared Spectroscopic Analysis

Fourier transform infrared (FTIR) spectra were recorded using a Perkin Elmer® spectrophotometer. The samples were subjected to electromagnetic radiation with wavelengths between 2.5 and 25 μm. Fourier Transformed Infrared Spectra (FTIR) was registered in the range of 4000–400 cm−1.

2.10. Statistical Analysis

The experimental design method, provided by software (MINITAB Ver 19.0), was used to model and optimize the operating conditions of the ecological cotton dyeing process proposed in this paper.

2.11. DPPH Radical Scavenging Assay

2.11.1. Antioxidant Activity of The Coloring Extract

The antioxidant activity of the ethanolic extract of Juglans regia barks residues was determined by the DPPH radical scavenging assay as described by Brand -Williams et al. [23]. The inhibition percentage (%I) of DPPH° was calculated by the following formula:
% I = Abs 0 Absi Abs 0 100
where, Abs0 is the absorbance of the negative control and Absi is the absorbance of the coloring extract.
Briefly, a volume of 77 µL of ethanolic extract at various concentrations (0.125–1 mg/mL) was added to 3 mL of diluted DPPH solution (6.10–5 mol.L−1) in ethanol as a source of free radicals. In the dark and at 25 °C, the mixtures were incubated for 30 min. The scanning capacity was determined by the spectrophotometer in absorbance at 517 nm. The radical form of DPPH has an absorption band at 517 nm which disappeared upon reduction by an anti-free radical compound. The anti-free radical activity expressed as IC50 (mg/mL), the concentration needed to inhibit 50% of the DPPH, and a lower IC50 value correspond to a higher antioxidant activity of ethanolic extract.

2.11.2. Anti-Oxidant Activity of Dyed Cotton Fabrics

The most harmful to human skin is ultraviolet (UV) rays. Many researchers have reported the chemopreventive impact of antioxidants against UV radiation. Therefore, if the antioxidant capacity could be imparted to the textile or clothing material, covering our skin, it would be helpful for the health of the epidermis. The antioxidant activity of dyed fabric was determined by DPPH° assay. An amount of 0.5 g of dyed cotton fabric was immersed in a 30 mL of solution of 0.15 mM DPPH in ethanol. After one hour of incubation in the dark, the absorbance of the solution was measured at 517 nm. Through this equation, the antioxidant activity was calculated [24]:
DPPH % = 100 × C S C
where, C and S being respectively the absorbance of the control and of the sample.

3. Results and Discussion

3.1. Characterization of The Aqueous Extract of Juglans Regia Barks

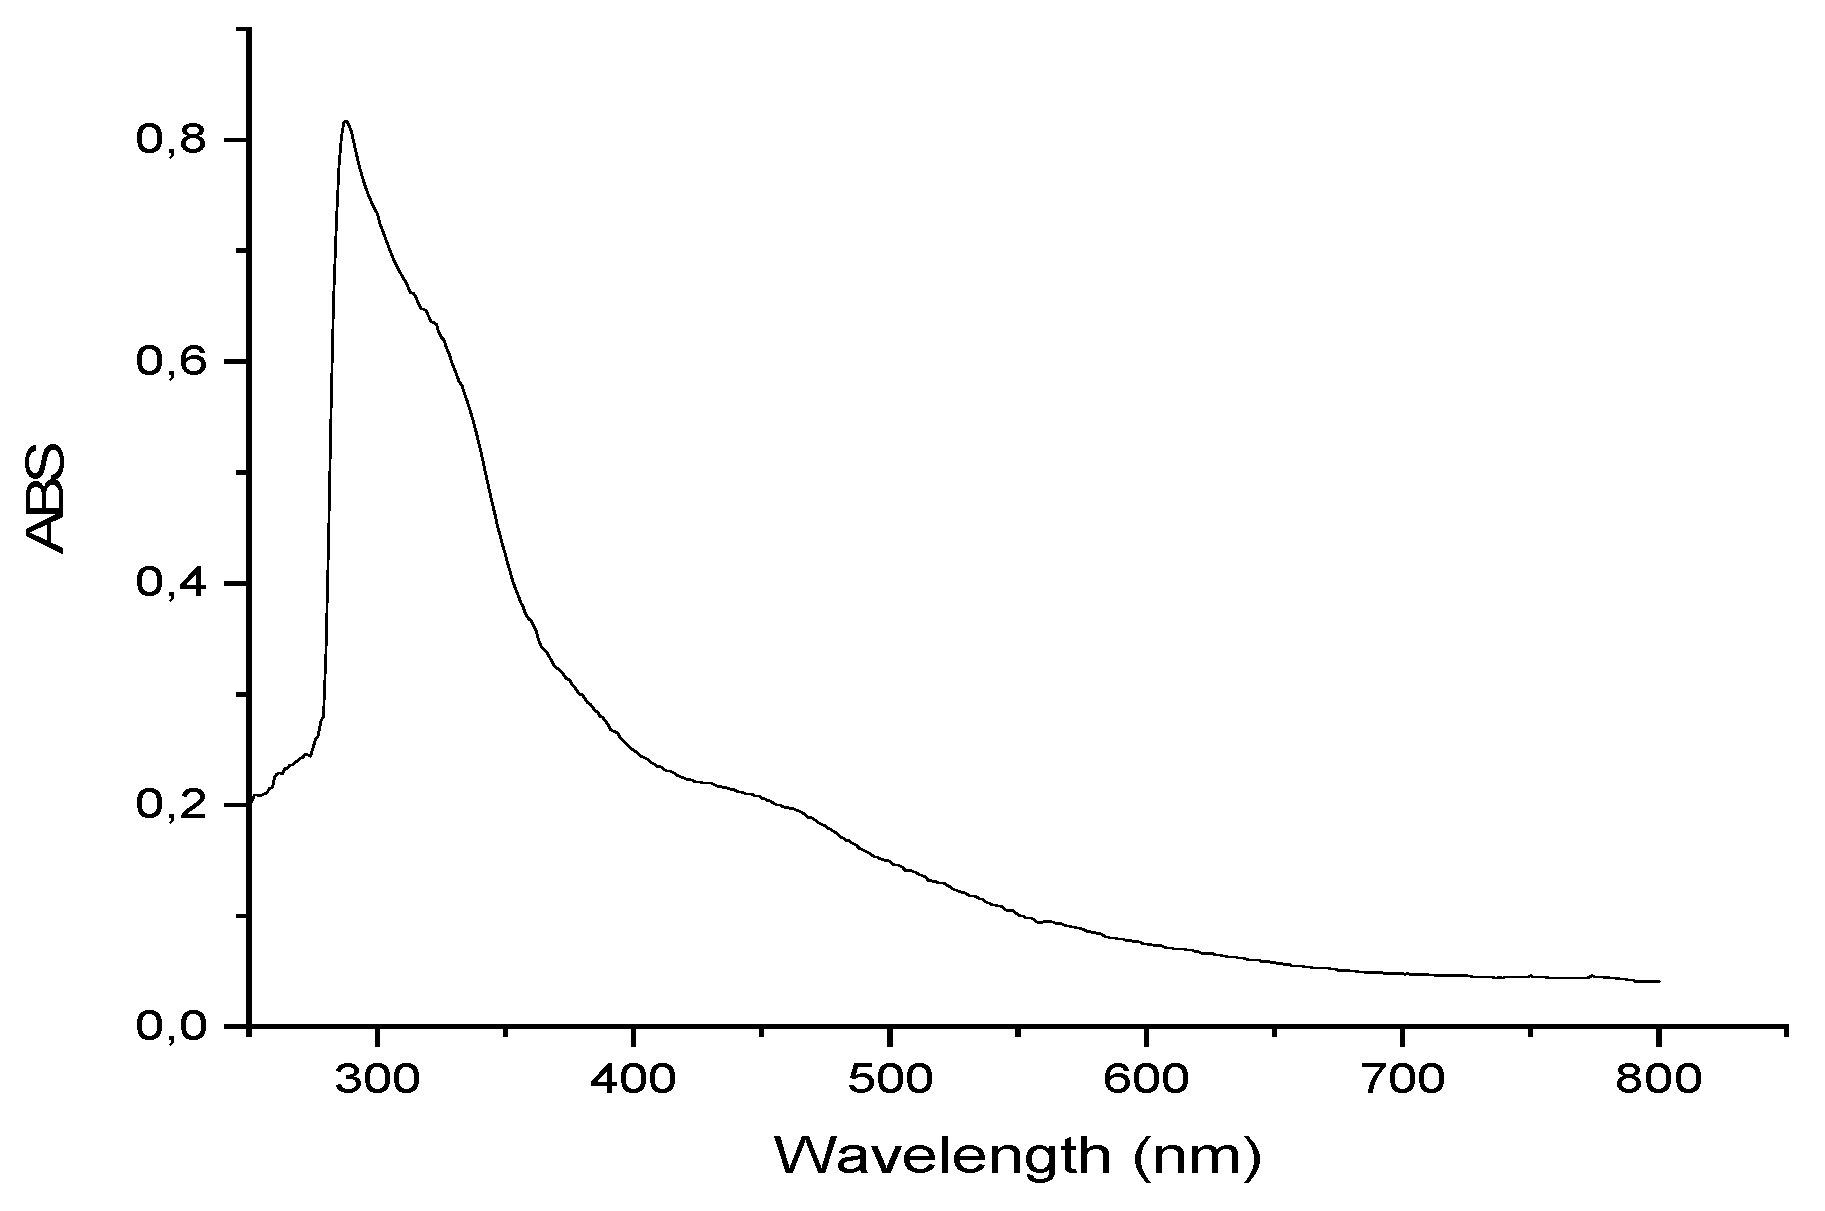
3.1.1. Characterization by UV-Visible Spectroscopy

The presence of phenolic compounds in the extract of Juglans regia barks residues was confirmed by UV-Vis spectrophotometry. The UV-Vis Spectrum of the barks extract (Figure 1) showed that molecules in the dye extract absorb light at a wavelength of 320 nm which can be attributed to the presence of phenolic compounds specially flavonoids [1].

3.1.2. Determination of Composition

The composition of the residues of Juglans Regia barks was determined. Analysis by dosages of the extract of Juglans regia showed that our plant contains essentially phenolic compounds (1.832 mg.mL1), which are the flavonoids (1.004 mg.mL1), the condensed tannins (1.176 mg.mL1), and the hydrolysable tannins (0.188 mg.mL1).

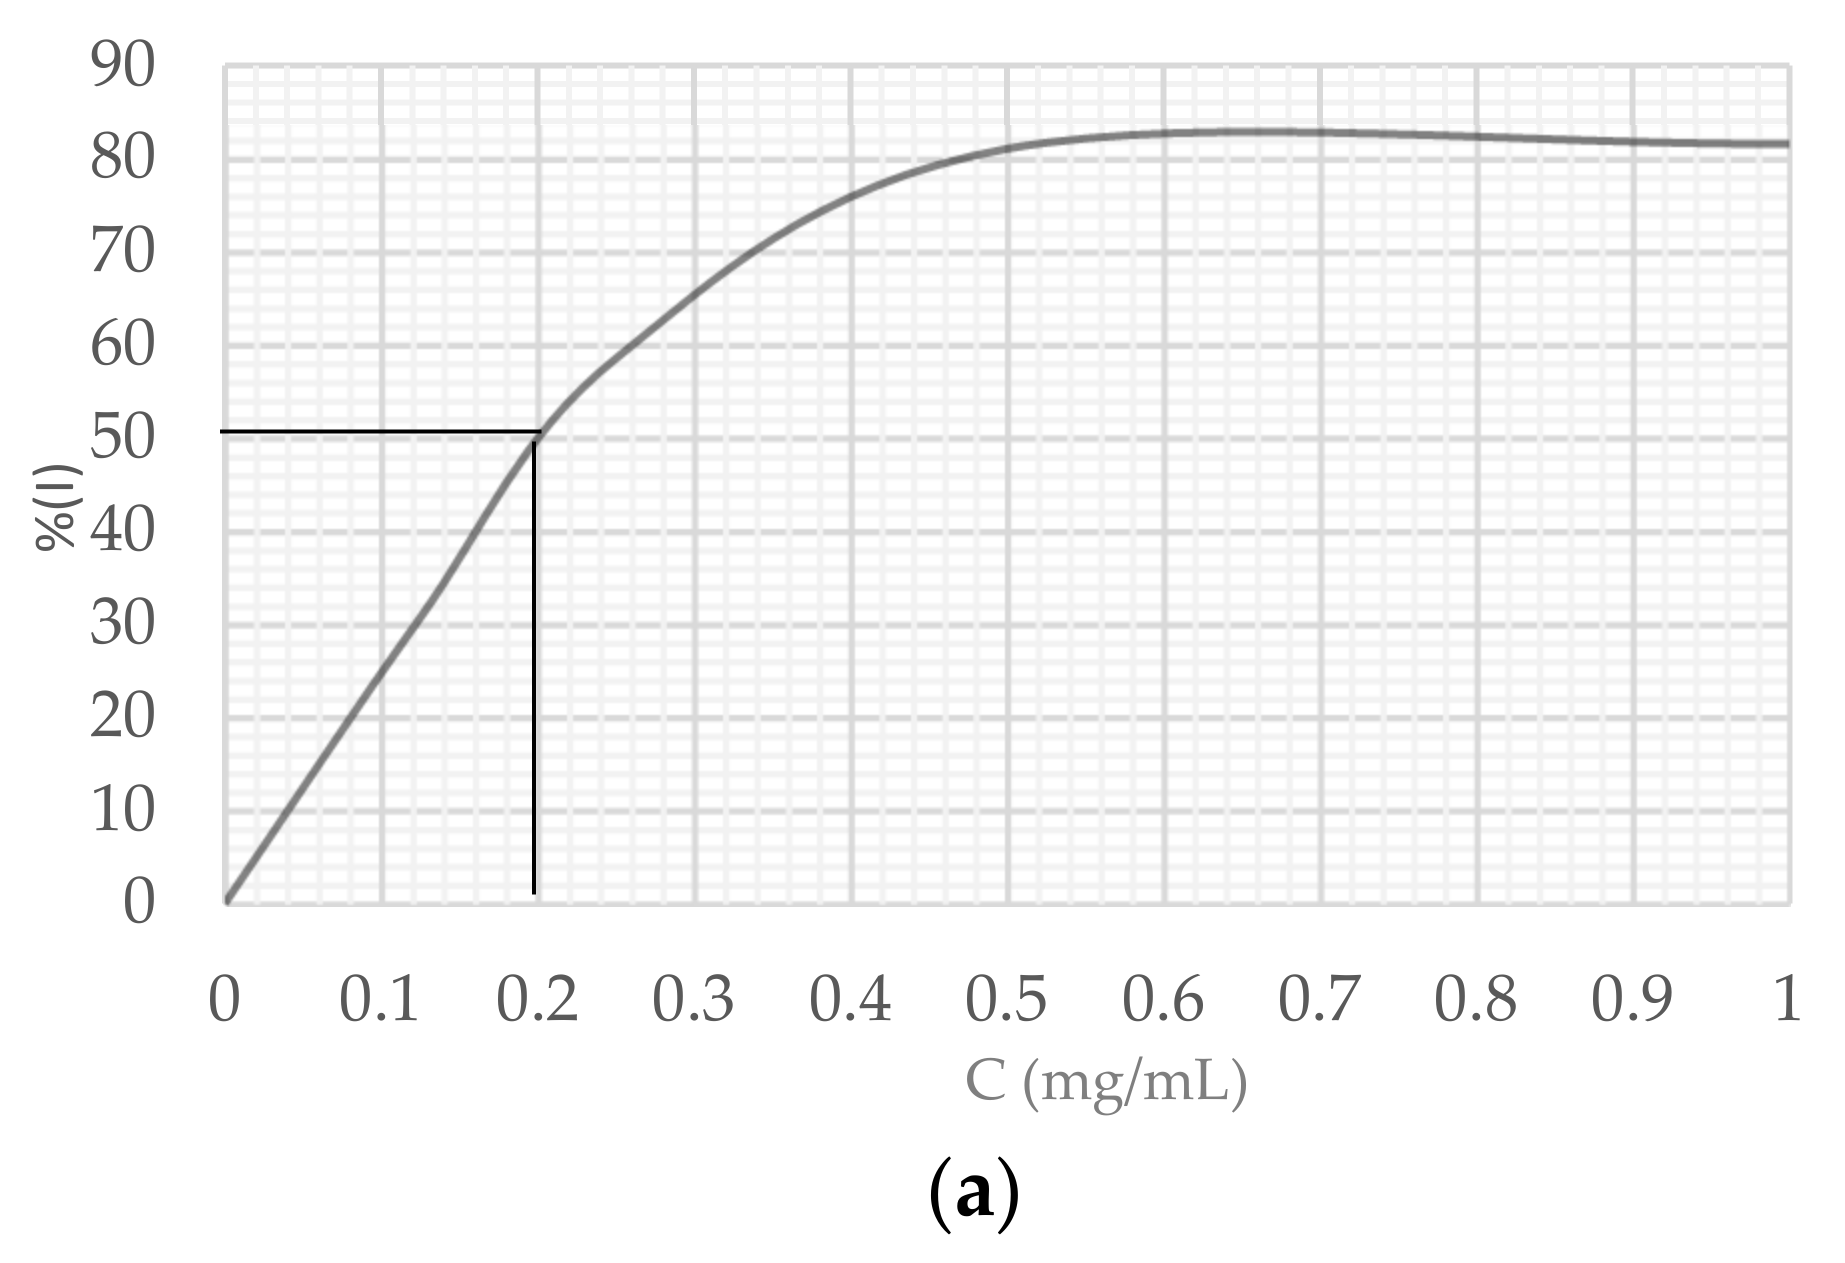
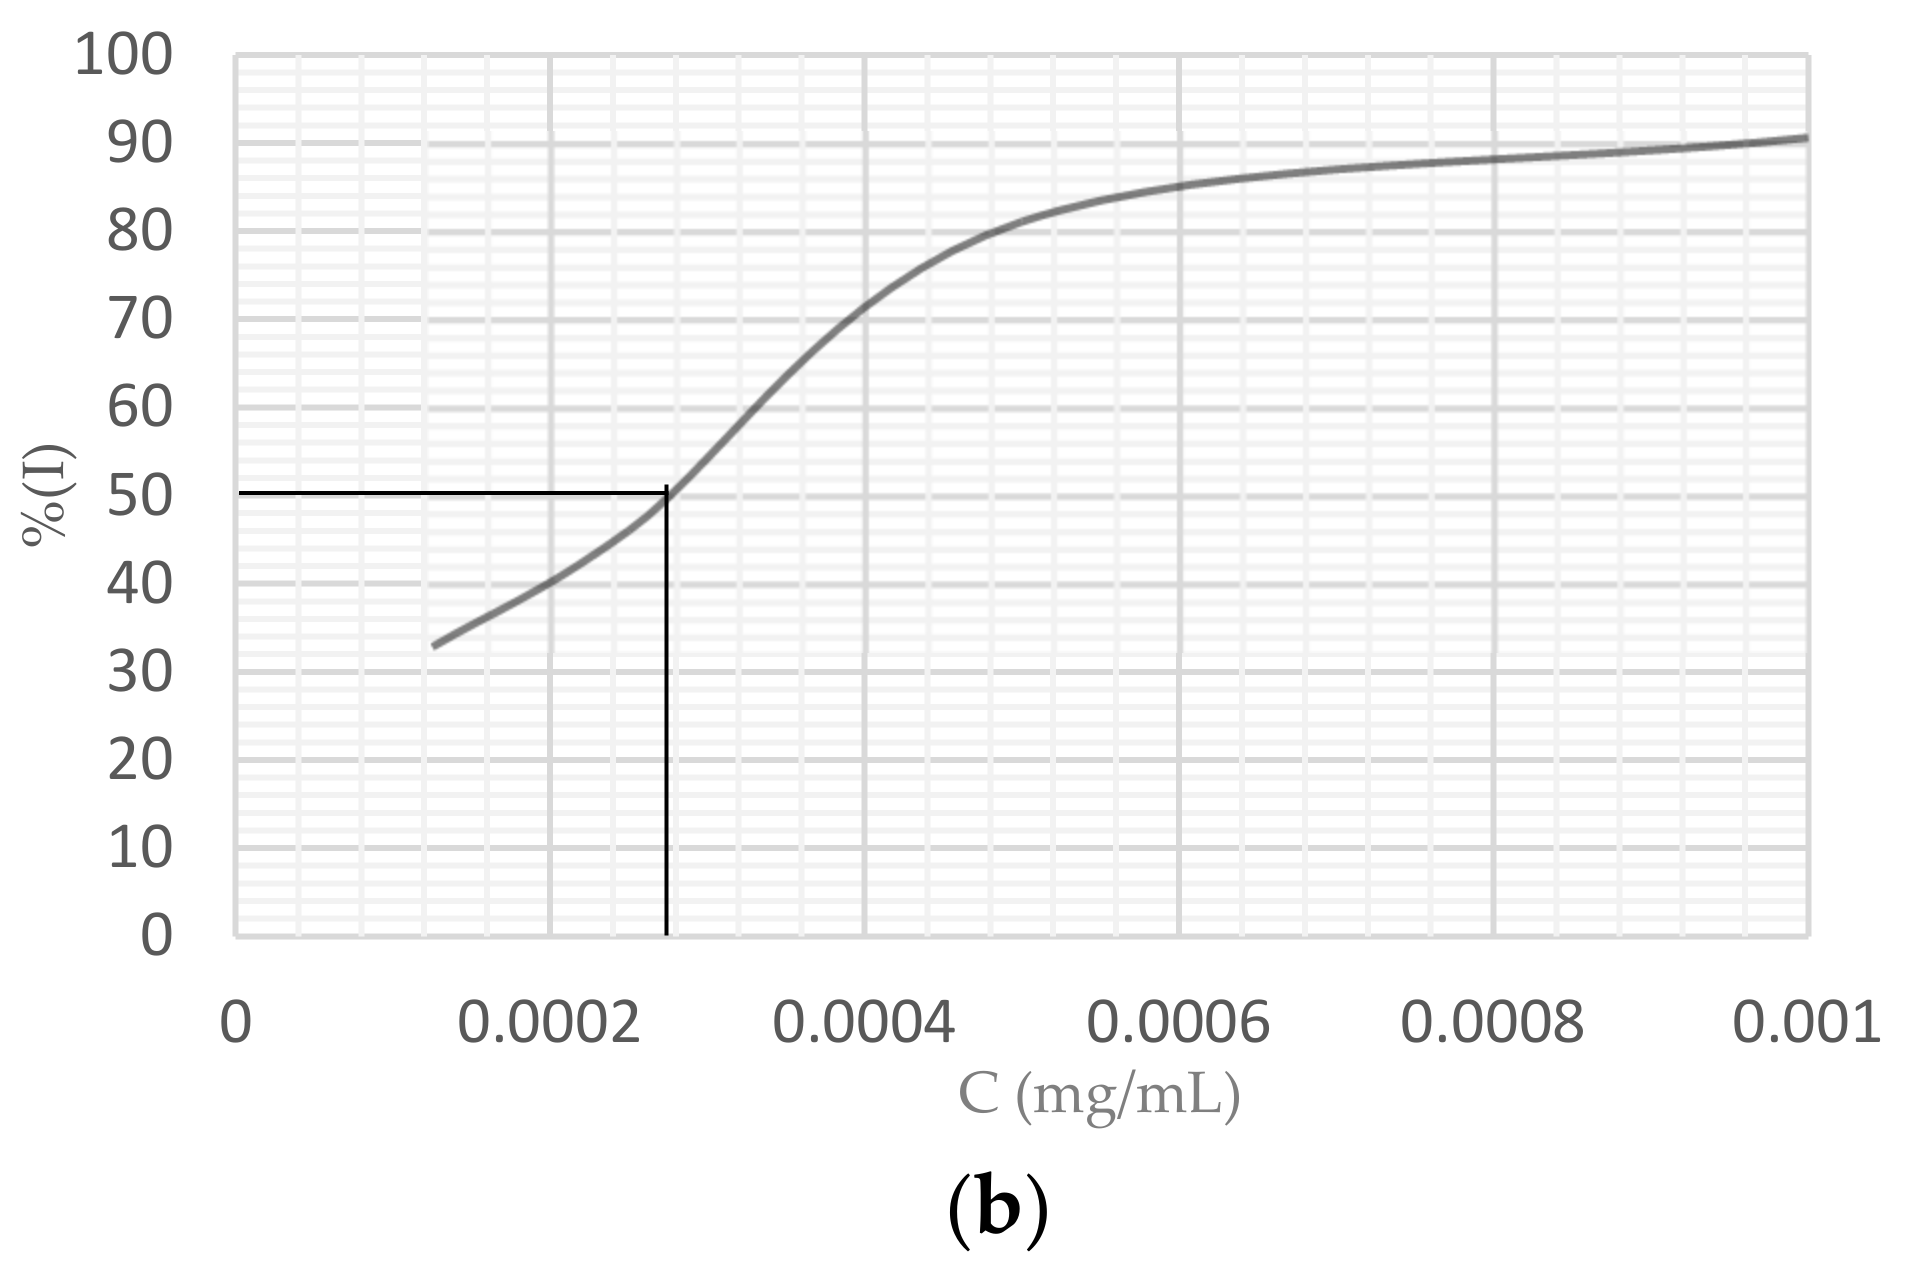
3.1.3. Antioxidant Activity Measurement

Phytochemical analyzes of the aqueous extract produced by microwave extraction of Juglans regia barks residues confirmed the presence of polyphenols, flavonoids, and tannins, which are appreciated by their antioxidant power. This activity has been evaluated for the aqueous extract and the results are showed in Figure 2. Compared to the positive reference (quercetin solution), Juglans regia barks residues extract has a significant antioxidant power. In fact, inhibitory concentration (IC50) was got at 0,2 mg/mL for the extract (Figure 2a), adjacent to quercetin solution (IC50 = 0.28 × 10³ mg.mL−1) (Figure 2b).
The polyphenols contained in the extract are probably at the origin of this activity [25].

3.2. Development of a Dyeing Process for Cellulosic Fabrics with Juglans Regia Barks Residues Extract

The cellulosic fabrics, namely cotton fabrics, were dyed out under the following conditions: pH = 9, P = 500 W, t = 3 min, bath report = 1/60, and Percentage of cationizer equal to 5% of the weight of the cotton. The values of K/S and the color coordinates (L*, a*, b*) given in tables represent the averages of three replications.

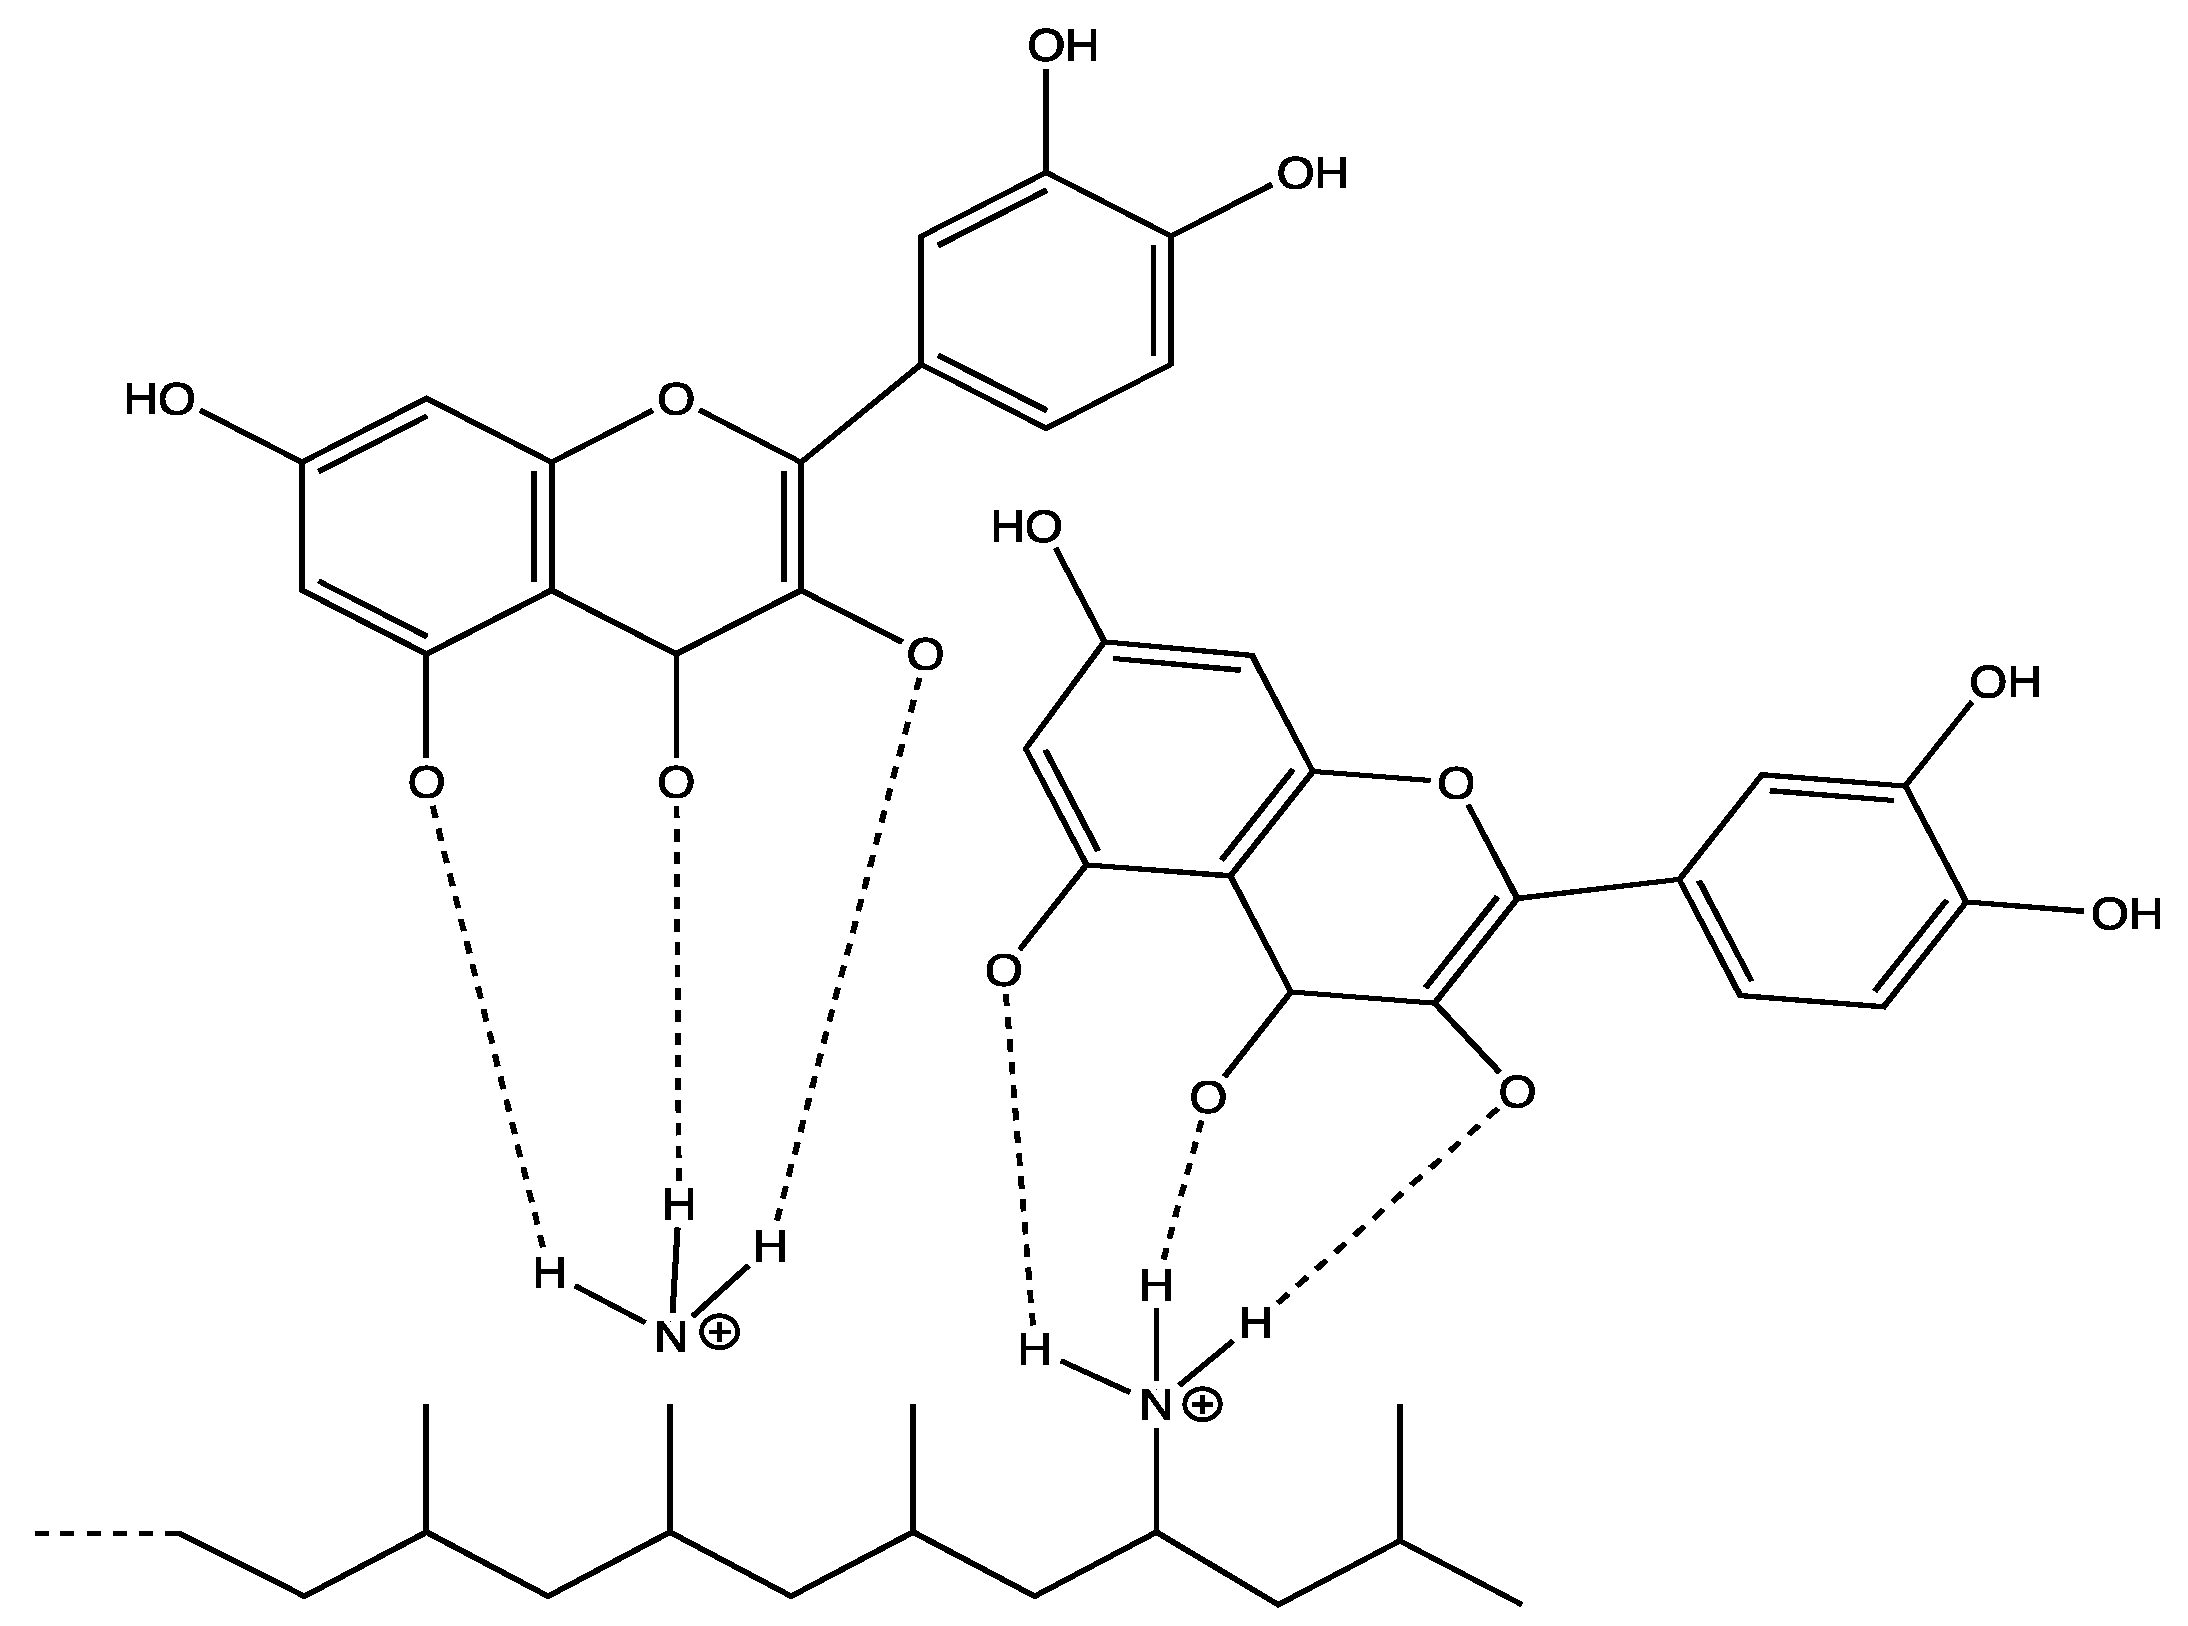
3.2.1. Effect of The Cotton Cationization on Dyeing Quality

The cationization of cotton is not new as a concept, the idea of modifying cotton by introducing amino groups into its structure dates back to 1926 [26]. The main goal is to improve the substantivity of cellulosic fibers for anionic dyes. The method camouflages the negative charges on the surface of the cotton by inserting cationic charges, which will increase the affinity of the fiber towards the dye (negatively charged) and subsequently improve the dyeing quality [27,28]. The cationization was carried out by a commercial cationizing agent known as “Sera Fast” which is composed of a mixture of quaternary ammonium. Thus, nitrogen, which is positively charged and fixed on the cellulose fibers, increased the affinity of the dyes [29]. The conditions of cotton cationization process were: Power = 350 W, t = 3 min, Percentage of cationizing agent equal to 5% of the weight of cotton. The cationized cotton was immersed in the dye bath under the conditions already mentioned. Table 1 shows the cationization effect of cotton as a function of the percentage of the cationizing agent. From this table we could notice that the darkest sample is the samples cationized with 5% (lowest L* value) of the cationizing agent.
This same sample is characterized by the largest value of a*. Hence, the reddest sample. The 17% cationization percentage sample has the largest b* value. Hence it is the greenest.
The obtained results (see Table 1) showed that the color strength increased with the increase in the percentage of cationization. The color strength of cotton reached a maximum at a percentage of cationization of 20%, This is explained by the presence of the cationizing agent (sera) in large quantity, which plays a very important role in the adsorption of the color on the textile surface (cotton) [30]. By cationization treatment, the electric charge of cotton fabrics has been completely changed from negative to positive values. The modified cotton shows a stronger adsorption of anionic substances than raw cotton, thanks to the electrostatic interactions between the charged particles containing in the extract (phenolic compounds) and the specific quaternary ammonium groups located on the surface of the cationized cellulosic fabrics [14].

3.2.2. Effect of pH on Dyeing Quality of Cationized Cellulosic Fabrics

The color coordinates of cationized cotton dyed with the obtained extract, varied as a function of the pH of the microwave-assisted dyeing as shown in Table 1.
This table shows that the luminosity L* of cotton was higher in acidic and neutral medium than in alkaline medium, which proves that the cotton samples dyed at pH 9, 11 and 13 are the darkest. The values of a* ranged between 4.22 and 9.60. Note that at a pH equal to 9 we obtained the highest value of a* (a* = 9.60) so the sample became redder.
The b* values were all positive and varied between 11.24 at pH 13 and 17.26 at pH 3, this highest value of b* shows that the sample turned yellow.
Similar to the L*values that were darker at pH 9 and 11, it could be noticed that the color strength (K/S) of cotton was weak at acidic pH but increased at basic pH. This is explained by the strong electrostatic interactions between the functional groups of cotton and those of the coloring matter. Note that the use of positively charged quaternary ammoniums led to the creation of ionic bonds with the negatively charged groups of dye.

3.2.3. Effect of Microwave Power on Dyeing Quality of Cationized Cellulosic Fabrics

This study consists in varying the dyeing power of cationized cotton while keeping the pH and the dyeing time constant. Table 1 shows the evolution of the colorimetric coordinates of cationized cotton as a function of the dyeing power. The results demonstrated that the higher the dyeing power was, the darker the sample became.
The values of a* and b* were positive. Consequently, all the dyed samples are in the red-yellow area of the color space. The color strength of cotton increased with increasing dyeing power from 160 W to 750 W, and decreased to 850 W at a value of 4.8.
As a result, cotton fibers should be dyed powers that do not exceed 750 W. Increasing the dyeing power beyond 750 W causes the dye’s affinity for cotton fibers to decrease, possible due to the decomposition of polyphenols responsible for the coloring.

3.2.4. Effect of Duration on Dyeing Quality of Cationized Cellulosic Fabrics

This study consists in varying the dyeing time of cotton while keeping the pH and the power constant.
The evolution of the color coordinates of the cotton dyed with the extract, as a function of the duration of dyeing assisted by microwave, is presented in Table 1. The brightness values L* show that the darkest sample is that taken at 4 min (the lowest L* value) and the brightest sample is that taken at 1 min (the value of L* the highest), the values of a* and b* were positive. Consequently, all the dyed samples are in the red-yellow area of the color space.
From the results, it could be noticed that the obtained color strength increased with the duration of the dye and reached a maximum value at a duration of 3 min, then a plateau is attained after 3 up to 5 min. It seems that cationized cotton fabrics reached the saturation and they did not absorb more natural dyes.

3.2.5. Effect of Pre-Mordanting on The Dyeing Quality of Cationized Cellulosic Fabrics

Effect on Colorimetric Coordinates and Color Strength of Cationized Cellulosic Fabrics

The mordanting was carried out in a microwave oven for 3 min with a power of 500 W and an amount of mordant of 3% of the weight of the fiber to be etched (cotton). Once mordanted, the cotton fabric was floundered in the dye bath for 3 min at 500 W. Table 2 shows the evolution of the colorimetric coordinates and the integral of the color strength (K/S) following the pre-mordanting of cotton. From this table, it could be noticed that copper sulfate gave the highest color strength (K/S = 5.89) and the lowest luminosity (L* = 44.12). Therefore, mordanting with copper sulphate gave a darker sample. This could also be confirmed by looking at the color change from slightly light brown to dark brown. Tin chloride has the weakest color strength (K/S = 3.08) and the highest luminosity (L* = 59.45) therefore the clearest sample; this is confirmed by the nuances obtained between the sample mordanted with tin chloride. It could be therefore concluded that copper is the mordant which has the greatest capacity to form coordination complexes with dye molecules. The increasing order of the color strength of cationized cotton fabrics dyed using the pre-mordanting method is as follows:
Tin chloride < Tannic acid < Mimosa < Iron sulfate < Copper sulfate

Effect on Fastness Properties of Cationized Cellulosic Fabrics

Each fastness test was carried out on a cotton sample prepared under very specific conditions. After the test, fastness properties could be estimated. Table 3 presents the fastnesses properties of cationized cotton fabrics. According to this table, fastness was increased after mordanting. Therefore, it could be deduced that the mordants improved the fastness to light, washing, and rubbing. Hence the advantage of carrying out this step.

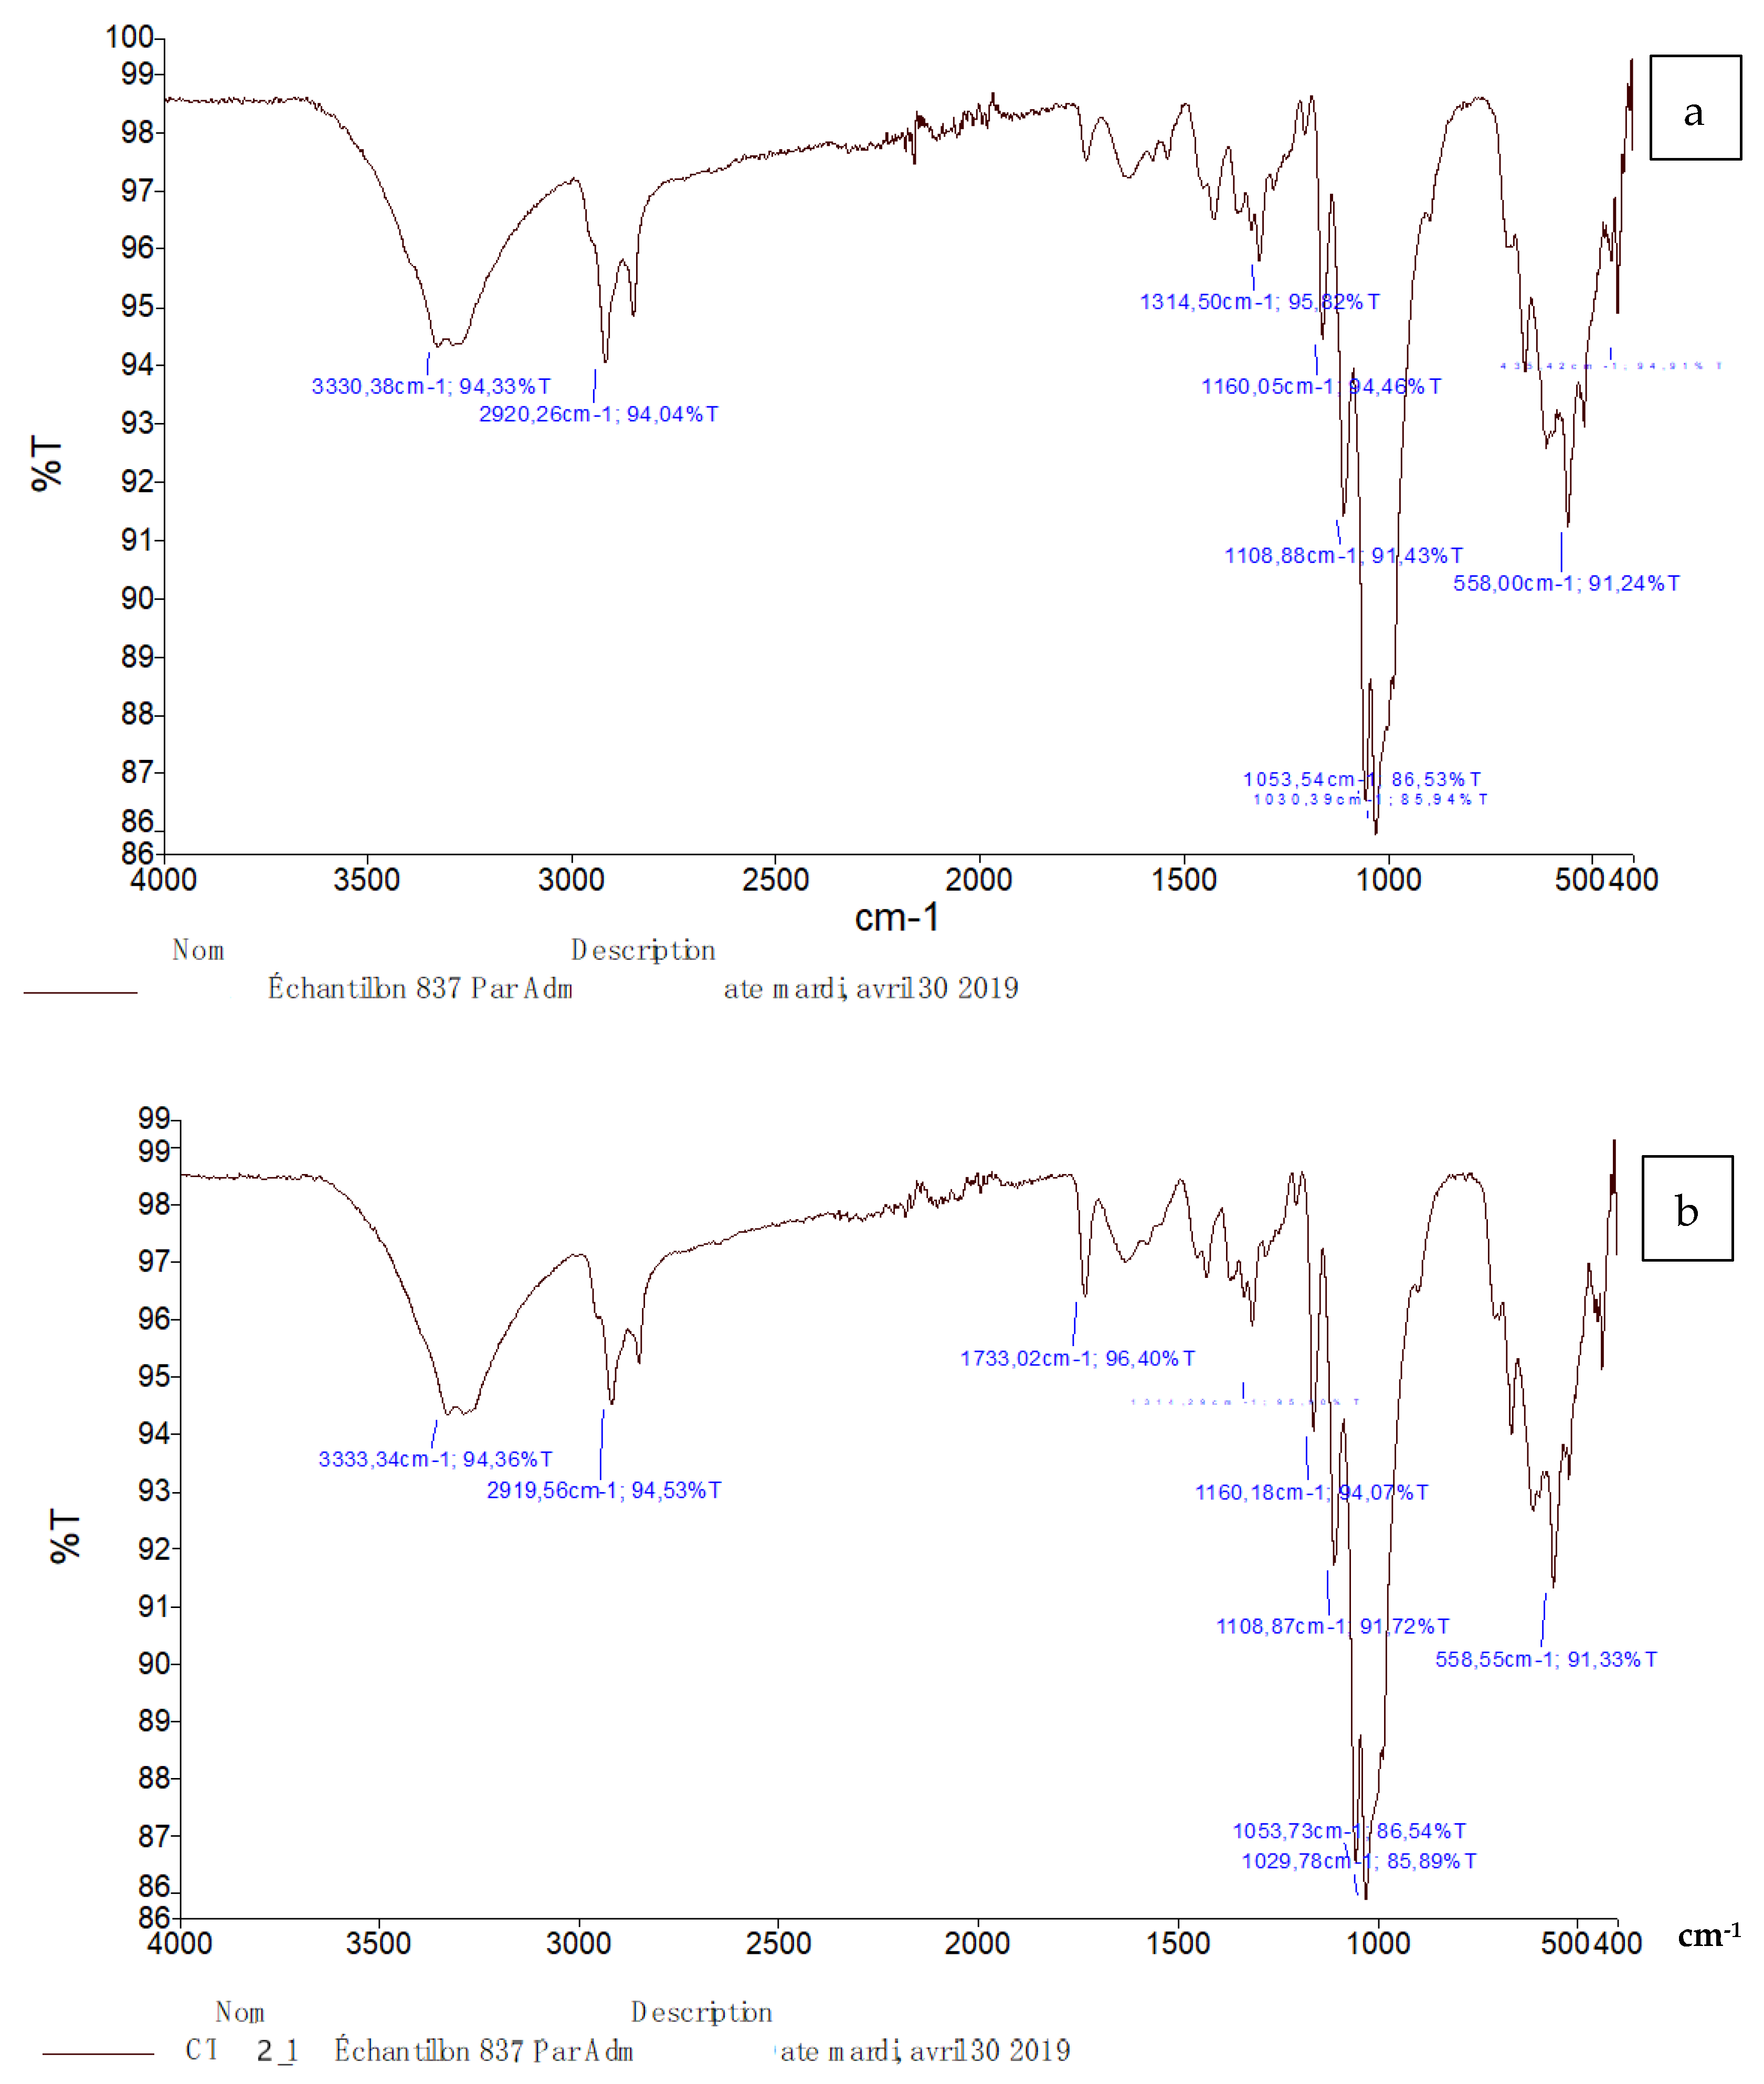
3.2.6. Characterization of Raw and Dyed Cotton Fibers

The cationized cotton fabric and dyed cotton IR spectra are shown in Figure 3. The infrared spectra of both samples gave characteristic bands of cellulose about 1000–1200 cm−1 [30]. Other characteristic bands linked to the chemical structure of the cellulose are namely: the hydrogen bonded (OH function), which extended from 3550 to 3100 cm−1 [30]. The elongation of the C-H function to 2920 cm−1 and a band around 11,600 cm−1 is attributable to the vibration of elongation of the C-N group (due to the ammonium ion of the cationizing agent) [29].
By comparing the two FTIR spectra of raw and dyed cotton, it can be seen that the intensity of the band appearing around 1733 cm−1 has increased (OH deformation of the alcohol function).
Based on these results, it could therefore propose the connection mechanism between the extract and the cotton fiber as shown in Figure 4.

3.3. Optimization of Cationized Cotton Dyeing by The Extract of Juglans Regia Barks Residues

3.3.1. Response Surface Design

The screening plan aims to target linear terms, this plan has the lowest number of runs in a single replicate for a given number of factors. This study discusses, a three-level screening plan. This plan was used to determine the values of the factors operating conditions producing the “best” response, to find the values of the factors which satisfy the operating or process specifications, to identify new operating conditions allowing a demonstrated improvement of product quality versus quality achieved under current conditions and model a relationship between quantitative factors and response [31]. The parameters to be studied in this part are: the percentage of cationizing agent, pH, potency, and duration of dyeing. The plan drawn up in this study consists of a comprehensive four-factor, three-level screening design (Table 4).
Where %cat is the percentage of the cationizing agent, pH is the pH of the dyeing bath, P is the microwave power, t is the dyeing duration, and K/S is the color strength of the dyed cellulosic fabrics.

3.3.2. Regression Equation Analysis

Regression analysis allows to study and model the relationship between a response variable and one or more inputs. A full quadratic response model led to the following equations:
K/S = −51.4 + 5.379 pH + 1.43% cat + 0.0312 P (W) + 13.32 t (min) − 0.3308 pH* pH − 0.1118% cat *% cat − 0.000023 P(W) * P (W) − 1.26 t (min) * t (min) + 0.0032 pH*% cat − 0.280 pH* t (min).
the coefficient of correlation R2 was important, (R2 =97.46%), which indicates that the model is predictable.

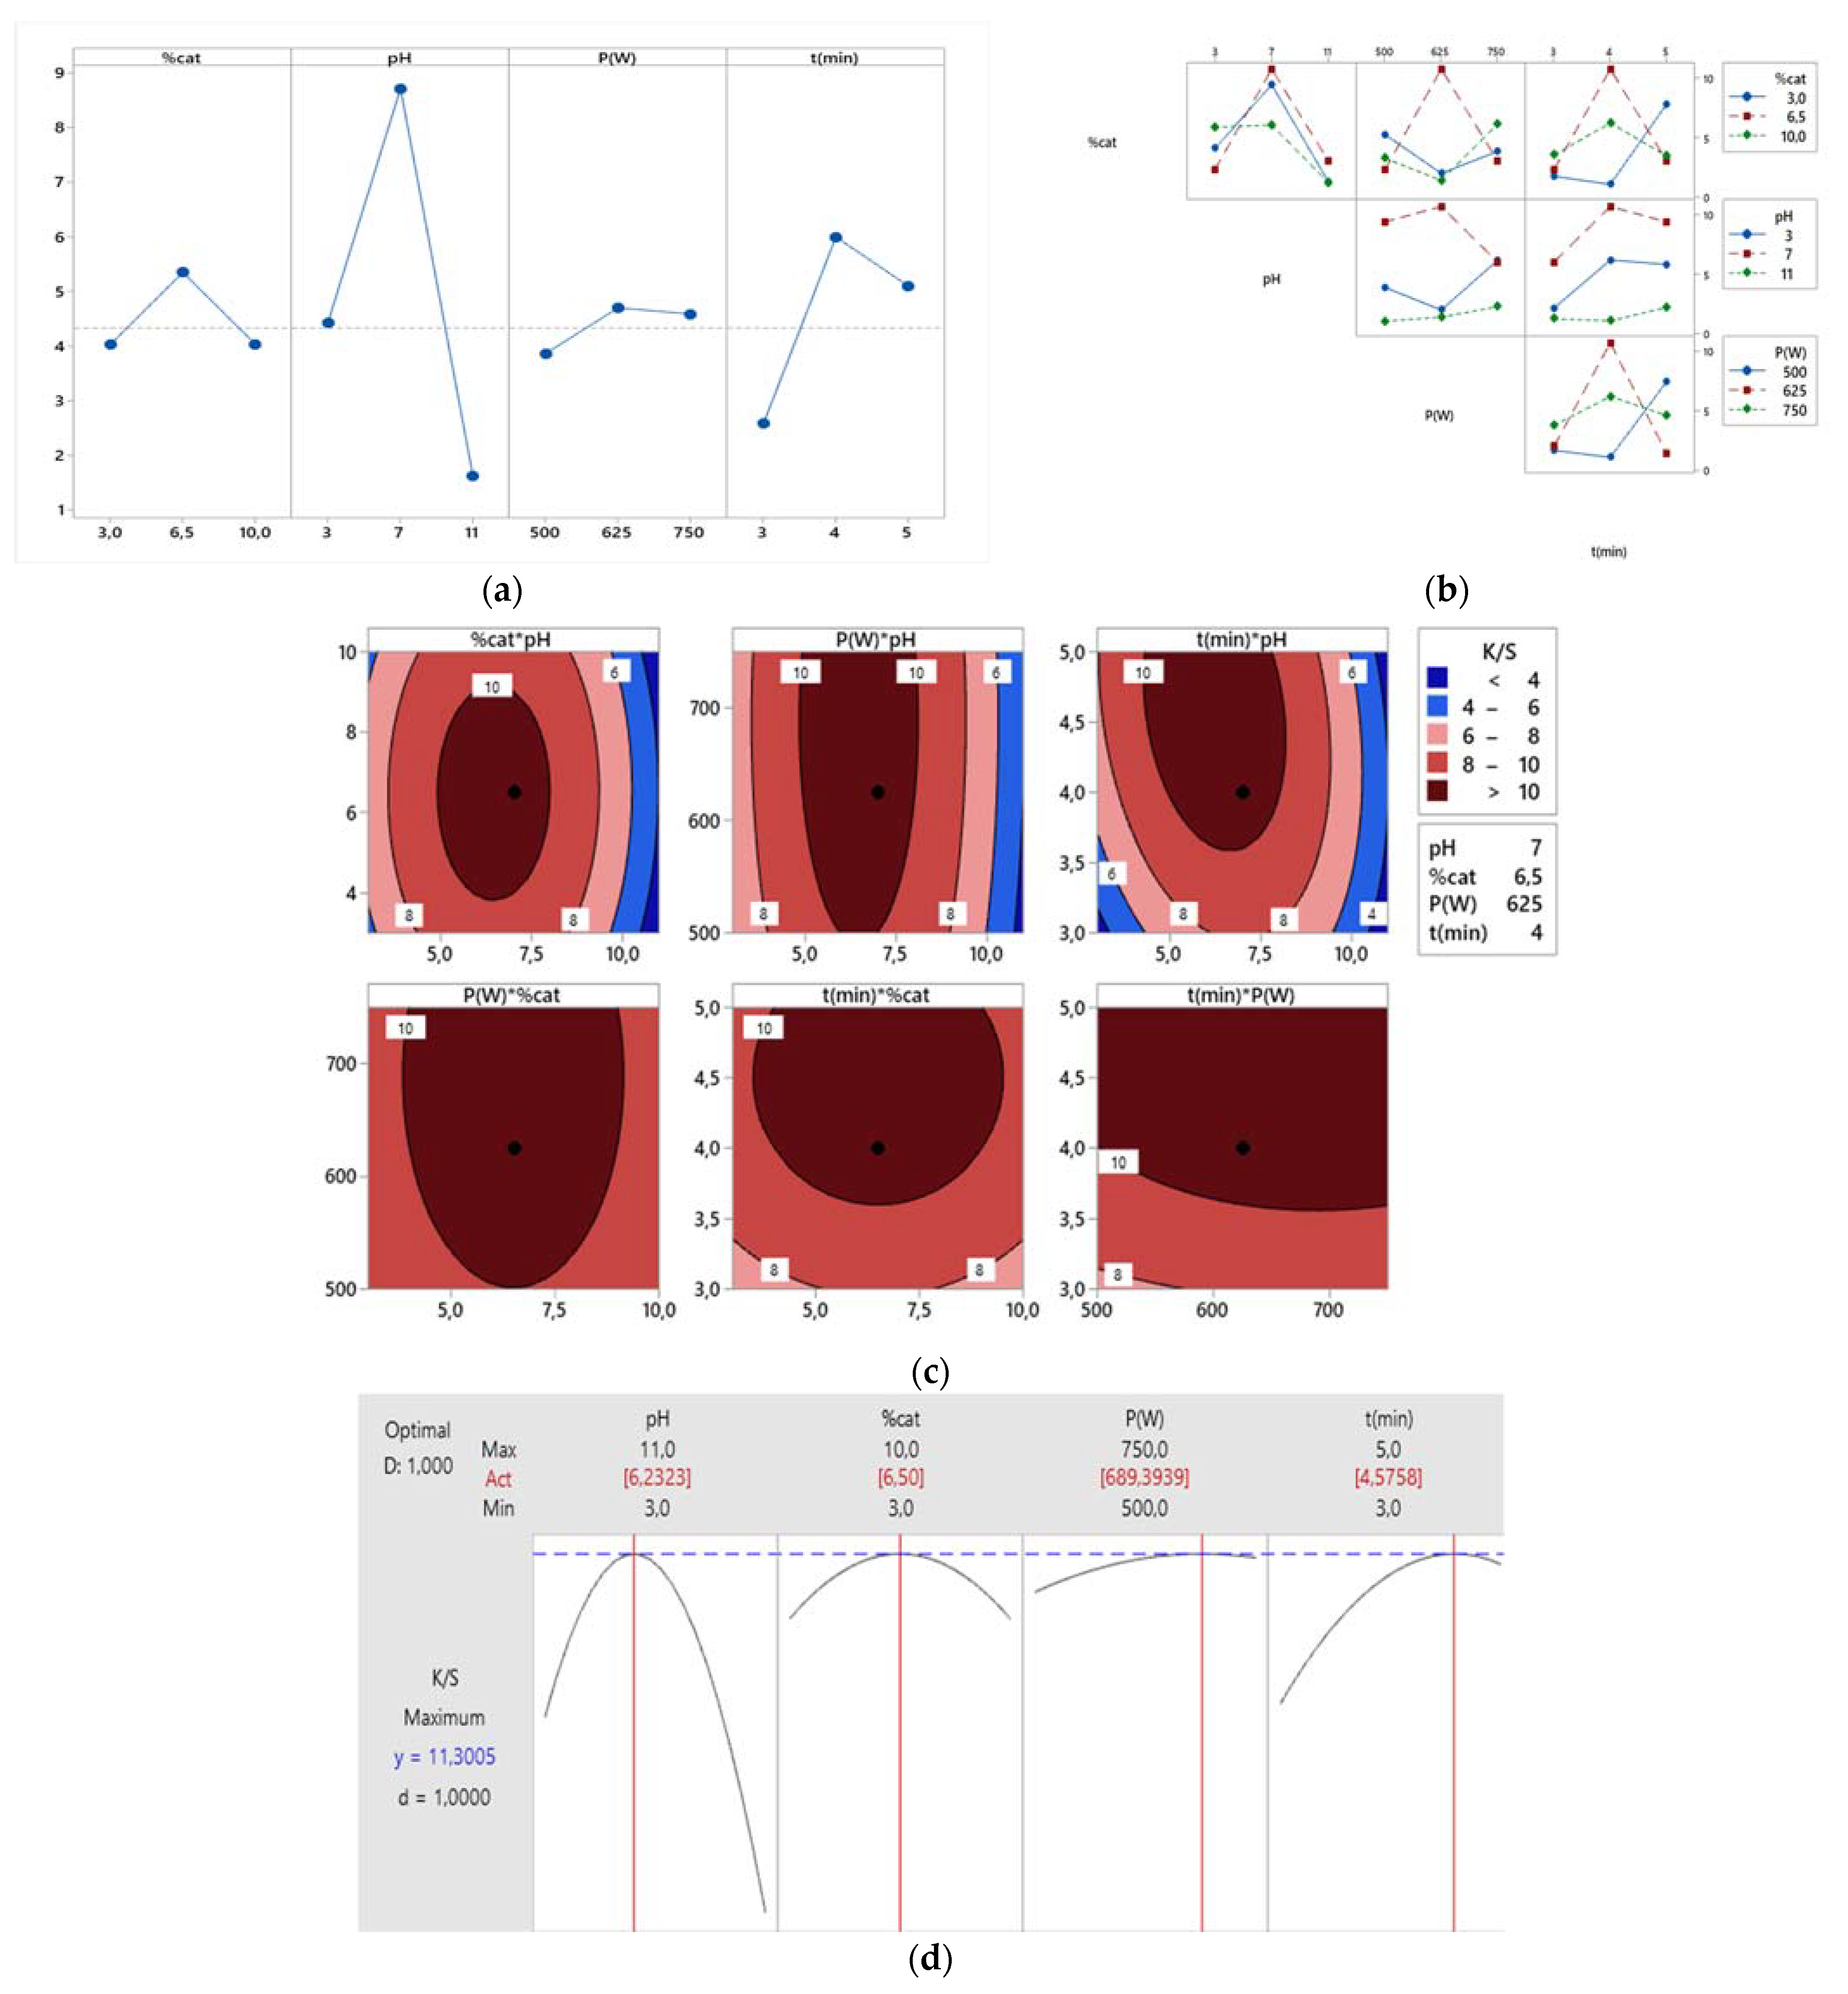
3.3.3. Main Effects Graph Evaluation

From Figure 5a it could be deduced that:
-
A percentage of cationizing agent ranging from 3 to 6.5% significantly improved the color strength K/S. However, a higher percentage causes a decrease in K/S.
-
The pH ranging from 3 to 7 positively affected the color strength. For a pH greater than 7 K/S weakened.
-
The effect of the dyeing power is positive. An increase in power up to 625 W stimulated the K/S response. For a power greater than 625 W the effect became practically negligible.
-
A dyeing duration of 3–4 min positively affected the K/S response. Beyond 4 min, the K/S response decreased.

3.3.4. Interaction Diagram Evaluation

The interaction diagram (see Figure 5b) indicates the presence of a strong interaction between the four factors justified by the non-parallel lines on the diagram. This interaction effect confirms the regression coefficients estimated for the K/S response.

3.3.5. Contours Graph Evaluation

A contour graph displays a two-dimensional look of the surface, where points with the similar response are linked to produce contour lines of constant responses. Contour graphics help establish desirable response values and operating conditions. The graphical results shown in Figure 5c suggest that high K/S values (K/S > 10) can be achieved if the cationizing percentages and the dye strength increase while keeping the pH between 5 and 7.

3.3.6. Response Optimization

Based on Figure 5d, The numerical optimization function of the MINITAB 19 program registered that, for a color strength (K/S) of 11.3, the optimal values for each variable are: a pH of 6.23; a percentage of cationizing agent of 6.5%; a microwave power of nearly 690 W, and a dyeing duration of 4.5 min.

3.4. Antioxidant Activity of Cotton Dyed with Barks Extract

The antioxidant power is transferred to the cotton dyed with the residues of Juglans regia barks extract. Good antioxidant power has been found: DPPH (%) = 78%.

4. Conclusions

The aspiration of this study is to advance residues of Juglans Regia barks in the dyeing of cellulosic fibers. To achieve this purpose, the coloring potential of the aqueous extract of these solid residues was explored by applying this extract on cotton fabrics under several conditions. The expected recovery is affordable by using the residues of Juglans Regia barks as a raw material at the level of extraction in order to produce new coloring matters mainly for textile use. Because raw cotton fabric had a very low affinity for the extract, cotton fabric was cationized with a commercial cationization agent Sera Fast, which increase its affinity for the dye and consequently improved the dye uptake and color strength. Subsequently, the effect of pre-mordanting on the dye quality (by measuring the value of the color strength and the colorimetric coordinates) and on the fastness (fastness to washing and fastness to light) were examined. A study of the infrared spectra of the dyed and raw fibers was carried out in order to establish connections, which could take place between the dye compounds and the cellulosic fibers. The dyeing of cotton with the coloring extract of Juglans regia barks residues has been optimized through a statistical analysis using MINITAB 19 software.

Author Contributions

Conceptualization, N.S. and M.B.T.; methodology, W.S.; software, N.S.; validation, N.S., W.S. and M.B.T.; formal analysis, N.S.; investigation, W.S.; resources, H.D.; data curation, C.B.; writing—original draft preparation, N.S.; writing—review and editing, M.B.T. and H.D.; visualization, W.S.; supervision, C.B. and H.D.; project administration, H.D. All authors have read and agreed to the published version of the manuscript.

Funding

This research received no external funding.

Data Availability Statement

Not applicable.

Acknowledgments

The authors would like to thank the Tunisian Higher Education and Scientific Research Ministry. Moreover, authors would like to acknowledge Taif University Researchers Supporting Project number (TURSP-2020/188), Taif University, Taif, Saudi Arabia.

Conflicts of Interest

The authors declare no conflict of interest.

References

  1. Dhouibi, N.; Ben Ticha, M.; Raddaoui, H.; Boudokhane, C.; Dhaouadi, H. Valorization and Reuse of Centaurea Kroumeriensis Hydrodistillation Effluent:A Sustainable Phytodyeing Process for Wool Fabrics. Fibers Polym. 2021, 22, 2238–2250. [Google Scholar] [CrossRef]
  2. Souissi, M.; Guesmi, A.; Moussa, A. Valorization of natural dye extracted from date palm pits (Phoenix dactylifera) for dyeing of cotton fabric. Part 1: Optimization of extraction process using Taguchi design. J. Clean. Prod. 2018, 202, 1045–1055. [Google Scholar] [CrossRef]
  3. Vankar, P.S.; Shanker, R.; Srivastava, J. Ultrasonic dyeing of cotton fabric with aqueous extract of Eclipta alba. Dyes Pigm. 2007, 72, 33–37. [Google Scholar] [CrossRef]
  4. Clydestale, F.M. Color as a factor in food Choice. Crit. Rev. Food Sci. Nutr. 2009, 33, 38–101. [Google Scholar] [CrossRef] [PubMed]
  5. Wrolstad, R.E. Anthocyanin Pigments: Bioactivity and Coloring Properties. J. Food Sci. 2004, 69, 419–425. [Google Scholar] [CrossRef]
  6. Geetha, B.; Sumathy, V.J.H. Extraction of Natural Dyes from Plants. Int. J. Pharm. Chem. 2013, 1, 502–509. [Google Scholar]
  7. Siva, R. Status of natural dyes and dye-yielding plants in India. Curr. Sci. 2007, 92, 916–925. [Google Scholar]
  8. Prabhavathi, R.; Sharada, A.; Anitha, A. Improving the Colour Fastness of the Selected Natural Dyes on Cotton (Improving the sunlight fastness and washfastness of the eucalyptus barks dye on cotton). J. Polymer Text. Eng. 2014, 1, 27–30. [Google Scholar]
  9. Haddar, W.; Baaka, N.; Meksi, N.; Elksibi, I.; Mhenni, M.F. Optimization of an ecofriendly dyeing process using the wastewater of the olive oil industry as natural dyes for acrylic fibers. J. Clean. Prod. 2014, 66, 546–554. [Google Scholar] [CrossRef]
  10. Ben Ticha, M.; Meksi, N.; Attia, H.; Haddar, W.; Guesmi, A.; Ben Jannet, H.; Mhenni, M.F. Ultrasonic extraction of Parthenocissus quinquefolia colorants: Extract identification by HPLC-MS analysis and cleaner application on the phytodyeing of natural fibres. Dyes Pigm. 2017, 141, 103–111. [Google Scholar] [CrossRef]
  11. Baaka, N.; Haddar, W.; Ben Ticha, M.; Amorim, M.T.P.; MHenni, M.F. Sustainability issues of ultrasonic wool dyeing with grape pomace colourant. Nat. Prod. Res. 2017, 31, 1655–1662. [Google Scholar] [CrossRef] [PubMed]
  12. Pérez Cid, B.; Fernández Alborés, A.; Fernández Gómez, E.; Falqué López, E. Use of microwave single extractions for metal fractionation in sewage sludge samples. Anal. Chim. Acta 2001, 431, 209–218. [Google Scholar] [CrossRef]
  13. Pasquet, V.; Chérouvrier, J.R.; Farhat, F.; Thiéry, V.; Piot, J.M.; Bérard, J.B.; Kaas, R.; Serive, B.; Patrice, P.; Cadoret, J.P.; et al. Study on the microalgal pigments extraction process: Performance of microwave assisted extraction. Process Biochem. 2011, 46, 59–67. [Google Scholar] [CrossRef] [Green Version]
  14. Ben Ticha, M.; Slama, N.; Dhouibi, N.; Boudokhane, C.; Dhaouadi, H. Barks Residues Recovery of Juglans Regia. L For the Dyeing of Wool Fabrics: Development of Microwave-assisted Extraction and Dyeing Processes. J. Nat. Fibers. 2021. [Google Scholar]
  15. Saleh, M.; Abd El-Baset, Y.A.; El-Badry, K.H. Dyeing of Cationized Cotton Fabrics with Natural Dye Extracted from Acacia. Int. J. Text. Sci. 2013, 2, 30–35. [Google Scholar]
  16. Hwang, J.S.; Park, S.Y. Application of green husk of Juglans regia Linn and effect of mordants for staining of silk. J. Converg. Inf. Technol. 2013, 12, 279–283. [Google Scholar]
  17. Ali, M.K.; Islam, S.; Mohammad, F. Extraction of natural dye from walnut barks and its dyeing properties on wool yarn. J. Nat. Fibers 2016, 13, 458–469. [Google Scholar]
  18. Ben Ticha, M.; Slama, N.; Dhouibi, N.; Boudokhane, C.; Dhaouadi, H. Valorization of Juglans Regia. L Barks residues as a natural colorant basing on a response surface methodology: A chal-lenging approach for a sustainable dyeing process of acrylic fabrics. Sustainability 2022, 14, 4134. [Google Scholar] [CrossRef]
  19. Swain, T.; Hillis, W.E. The phenolic constituents of Prunus domestica. I.—The quantitative analysis of phenolic constituents. J. Sci. Food Agric. 1959, 10, 63–68. [Google Scholar] [CrossRef]
  20. Butler, L.G.; Price, M.L.; Brotherton, J.E. Vanillin assay for proanthocyanidins (condensed tannins): Modification of the solvent for estimation of the degree of polymerization. J. Agric. Food Chem. 1982, 30, 1087–1089. [Google Scholar] [CrossRef]
  21. Mole, S.; Waterman, P.G. A critical analysis of techniques for measuring tannins in ecological studies. Oecologia 1987, 72, 137–147. [Google Scholar] [CrossRef] [PubMed]
  22. Brinkworth, B.J. Interpretation of the Kubelka-Munk Coefficients in Reflection Theory. Appl. Opt. 1972, 11, 1434–1435. [Google Scholar] [CrossRef] [PubMed]
  23. Brand-Williams, W.; Cuvelie, M.E.; Berset, C. Comparative Studies of the Phytochemical, Antioxidant and Antimicrobial Properties of Cashew Leaf, Barks and Fruits Extracts. LWT 1995, 28, 25–30. [Google Scholar] [CrossRef]
  24. Hong, K. Preparation and properties of cotton and wool fabrics dyed by black rice extract. Text. Res. J. 2015, 85, 1875–1883. [Google Scholar] [CrossRef]
  25. Kim, H.; Moon, J.Y.; Kim, H.; Lee, D.S.; Cho, M.; Choi, H.K.; Kim, Y.S.; Mosaddik, A.; Kim Cho, S. Antioxidant and antiproliferative activities of mango (Mangifera indica L.) flesh and peel. Food Chem. 2010, 121, 429–436. [Google Scholar] [CrossRef]
  26. Ben Ticha, M.; Haddar, W.; Meksi, N.; Guesmi, A.; Mhenni, M.F. Improving dyeability of modified cotton fabrics by the natural aqueous extract from red cabbage using ultrasonic energy. Carbohydr. Polym. 2016, 154, 287–295. [Google Scholar] [CrossRef]
  27. Kamel, M.M.; El-Shishtawy, R.M.; Youssef, B.M.; Mashaly, H. Ultrasonic assisted dyeing. IV. Dyeing of cationised cotton with lac natural dye. Dyes Pigm. 2007, 73, 279–284. [Google Scholar] [CrossRef]
  28. Kamel, M.M.; El Zawahry, M.M.; Ahmed, N.S.E.; Abdelghaffar, F. Ultrasonic dyeing of cationized cotton fabric with natural dye. Part 1: Cationization of cotton using Solfix E. Ultrason Sonochem. 2009, 16, 243–249. [Google Scholar] [CrossRef]
  29. Kamel, M.M.; El Zawahry, M.M.; Ahmed, N.S.E.; Abdelghaffar, F. Ultrasonic dyeing of cationized cotton fabric with natural dye. Part 2: Cationization of cotton using Quat 188. Ind. Crops Prod. 2011, 34, 1410–1417. [Google Scholar] [CrossRef]
  30. Haddar, W.; BenTicha, M.; Guessmi, A.; Khoffi, F.; Durand, B. A novel approach for a natural dyeing process of cotton fabric with Hibiscus mutabilis (Gulzuba): Process development and optimization using statistical analysis. J. Clean. Prod. 2014, 68, 114–120. [Google Scholar] [CrossRef]
  31. Bouatay, F.; Baaka, N.; Shahid, A.; Mhenni, M.F. A novel natural source Vicia faba L. membranes as colourant: Development and optimisation of the extraction process using response surface methodology (RSM). Nat. Prod. Res. 2019, 33, 59–65. [Google Scholar] [CrossRef] [PubMed]
Figure 1. UV-Visible spectrum of the aqueous extract of Juglans regia barks residues.
Sustainability 14 07534 g001
Figure 2. Antioxidant activity of Juglans regia barks extract (a), Antioxidant activity of quercetin solution (b).
Sustainability 14 07534 g002aSustainability 14 07534 g002b
Figure 3. FTIR spectrum of cationized cotton (a) and dyed cotton (b).
Sustainability 14 07534 g003
Figure 4. Proposal of the mechanism for dyeing cotton cationized with the extract of solid residues from the barks of Juglans Regia.
Sustainability 14 07534 g004
Figure 5. Optimization of cationized cotton dyeing with the extract of Juglans regia barks residues, (a) Main effects diagrams related to the color strength (K/S), (b) Interaction diagram related to the color strength (K/S), (c) Contour graph related to the color strength (K/S), (d) Response optimization related to the color strength (K/S).
Sustainability 14 07534 g005
Table 1. Evaluation of colorimetric coordinates and the color strength of cellulosic fabrics.
FactorsL*a*b*SamplesK/S
Cationizing agent (%)071.534.5013.44 Sustainability 14 07534 i0010.9
353.789.0515.01 Sustainability 14 07534 i0023.37
551.0910.315.66 Sustainability 14 07534 i0033.63
753.769.8816.14 Sustainability 14 07534 i0043.6
1056.598.1616.29 Sustainability 14 07534 i0053.58
1255.838.9717.56 Sustainability 14 07534 i0063.6
1554.969.3217.92 Sustainability 14 07534 i0074.12
1754.389.1518.01 Sustainability 14 07534 i0084.23
2052.348.7917.12 Sustainability 14 07534 i0094.80
pH373.674.6517.26 Sustainability 14 07534 i0101.12
574.404.2215.44 Sustainability 14 07534 i0110.97
766.437.418.05 Sustainability 14 07534 i0121.99
960.389.6016.95 Sustainability 14 07534 i0132.57
1155.847.4416.00 Sustainability 14 07534 i0143
1368.645.2211.24 Sustainability 14 07534 i0151.34
Microwave power (W)16062.208.9018.55 Sustainability 14 07534 i0162.50
35055.678.8616.86 Sustainability 14 07534 i0173.39
50052.2510.2316.94 Sustainability 14 07534 i0184.23
65051.9810.1917.20 Sustainability 14 07534 i0194.44
75051.809.4516.84 Sustainability 14 07534 i0205.30
85052.668.9916.15 Sustainability 14 07534 i0214.80
Duration (min)0.552.6410.3715.89 Sustainability 14 07534 i0222.07
155.489.7012.63 Sustainability 14 07534 i0232.43
249.9210.1511.53 Sustainability 14 07534 i0243.03
354.919.5212.49 Sustainability 14 07534 i0254.44
444.7010.1911.60 Sustainability 14 07534 i0263.77
550.379.2011.86 Sustainability 14 07534 i0273.8
Table 2. Evaluation of the colorimetric coordinates and the color strength of dyed cellulosic fabrics without and after mordanting.
MordantL*a*b*K/SSamples
Without mordanting------------54.498.5916.393.82 Sustainability 14 07534 i028
Pre-mordantingCopper sulfate44.128.4511.565.89 Sustainability 14 07534 i029
Iron sulfate44.374.358.925.21 Sustainability 14 07534 i030
Mimosa51.619.4418.405.14 Sustainability 14 07534 i031
Tin chloride59.458.9918.983.08 Sustainability 14 07534 i032
Tannic acid54.3010.7820.564.62 Sustainability 14 07534 i033
Table 3. Dyeing fastness of pre-mordanting cellulosic fabrics.
FabricMordantFastness to Light
(ISO 105-B02)
Fastness to Wash
(ISO 105-C06)
Fastness to Rubbing
(ISO 105-X12).
WetDried Up
CottonWithout mordanting33–43–44
Iron sulfate4444–5
Copper sulfate44–544–5
Tin chloride4444–5
Tannic acid4444–5
Mimosa44–544–5
Table 4. Response surface design.
FactorsResponse
cat (%)pHP (W)t (min)K/S
3750059.4
31150041.08
3362532
6.51175053.04
101150031.03
31175031.5
3375056.15
101162551.4
6.57625411.04
10350055.5
10375046.2
6.5350032.3
10775036.03
Publisher’s Note: MDPI stays neutral with regard to jurisdictional claims in published maps and institutional affiliations.

