Article

Dynamic Monitoring of Desertification in Ningdong Based on Landsat Images and Machine Learning

1
College of Geosciences and Surveying Engineering, China University of Mining and Technology (Beijing), Beijing 100083, China
2
State Key Laboratory of Coal Mining and Clean Utilization, Beijing 100013, China
3
CCTEG Coal Mining Research Institute, Beijing 100013, China
4
Shanxi Coking Coal Group Co., Ltd., Taiyuan 030053, China
5
Institute of Land and Resources Investigation and Monitoring of Ningxia Hui Autonomous Region, Yinchuan 750002, China
*
Author to whom correspondence should be addressed.
Sustainability 2022, 14(12), 7470; https://doi.org/10.3390/su14127470
Submission received: 8 May 2022 / Revised: 14 June 2022 / Accepted: 16 June 2022 / Published: 18 June 2022
(This article belongs to the Topic Climate Change and Environmental Sustainability)

Abstract

:
The ecological stability of mining areas in Northwest China has been threatened by desertification for a long time. Remote sensing information combined with machine learning algorithms can effectively monitor and evaluate desertification. However, due to the fact that the geological environment of a mining area is easily affected by factors such as resource exploitation, it is challenging to accurately grasp the development process of desertification in a mining area. In order to better play the role of remote sensing technology and machine learning algorithms in the monitoring of desertification in mining areas, based on Landsat images, we used a variety of machine learning algorithms and feature combinations to monitor desertification in Ningdong coal base. The performance of each monitoring model was evaluated by various performance indexes. Then, the optimal monitoring model was selected to extract the long-time desertification information of the base, and the spatial-temporal characteristics of desertification were discussed in many aspects. Finally, the factors driving desertification change were quantitatively studied. The results showed that random forest with the best feature combination had better recognition performance than other monitoring models. Its accuracy was 87.2%, kappa was 0.825, Macro-F1 was 0.851, and AUC was 0.961. In 2003–2017, desertification land in Ningdong increased first and then slowly improved. In 2021, the desertification situation deteriorated. The driving force analysis showed that human economic activities such as coal mining have become the dominant factor in controlling the change of desert in Ningdong coal base, and the change of rainfall plays an auxiliary role. The study comprehensively analyzed the spatial-temporal characteristics and driving factors of desertification in Ningdong coal base. It can provide a scientific basis for combating desertification and for the construction of green mines.

1. Introduction

Desertification occurs as land degrades in arid, semiarid, and dry, subhumid areas, owing to various factors, including climate variability and human activities [1]. China is one of the countries which is most severely affected by desertification in the world. The fifth national census on desertification and sandification showed that the amount desertification land area in China makes up 2.6116 million km2, which is 27.2% of the total land area, located mainly in Xinjiang, Inner Mongolia, Gansu, and other western regions [2]. Wind desertification, water desertification, freeze-thaw desertification, and soil salinization are the main types of desertification in China [3]. Most desert areas are characterized by a serious degradation state.
The degree of land desertification has aggravated owing to the large-scale development of coal resources in the mining areas of northwestern China [4]. To promote the co-ordinated development of energy industries and ecological civilizations, we must conduct in-depth research on desertification caused by human activities, such as mining development, to understand climate change, mining development, and other impacts on desertification while providing a scientific basis for reducing the risk of negative environmental impacts caused by mining.
In the 1970s, high-resolution aerial images were used as data sources for desertification research at home and abroad, which laid the foundation for remote sensing monitoring of desertification [5,6]. At present, remote sensing technology has gradually become an important means of desertification monitoring. In the traditional remote sensing monitoring technology of desertification, although visual interpretation has high accuracy, it is time-consuming and requires a lot of expert experience [7]. The Albedo-NDVI feature space model proposed by Zeng et al. [8] is widely used because of its simple principle and easy implementation [9,10,11]. Later, some scholars considered the influence of soil background on NDVI, used MSAVI to replace NDVI, and proposed the albedo MSAVI feature space model [11]. However, the desertification inversion accuracy of the feature space model depends on the calculation accuracy of typical surface parameters, and the wrong sampling points will cause the inversion accuracy to be damaged [12]. Based on multisource data such as climate, vegetation, and soil, the establishment of comprehensive assessment models using methods such as AHP is also commonly used in desertification monitoring work [13,14,15]. However, this method has defects such as cumbersome data collation, strong subjectivity, and data coupling correlation [16,17,18]. Mixed pixel decomposition is also used in desertification monitoring [19]. It makes the classification scale from pixel level to subpixel level [20], which can effectively improve the classification accuracy and reduce the influence of terrain [21]. However, the related algorithms are mainly aimed at hyperspectral images, which makes it difficult to realize long-time and large-scale desertification monitoring. If multispectral imagery is used for mixed pixel decomposition, it is difficult to ensure the accuracy of the results.
Recently, the application of machine learning has played a positive role in promoting desertification monitoring via remote sensing. Compared with traditional desertification monitoring methods, machine learning can better obtain the potential information of classification features [22]. Unsupervised classification methods such as K-mean can classify images without samples, which is fast and has a low labor cost. However, the effect of unsupervised classification is excessively dependent on the quality of image data [23]. Intelligent algorithms, such as decision tree, need to manually select sampling points based on expert knowledge to establish training samples which belong to supervised classification [24]. The classification results are more accurate than unsupervised classification. The desertification monitoring research using the intelligent algorithm of supervised classification is mainly different in the selection of classification characteristics and machine learning algorithms. In the establishment of multifeature datasets, most studies choose spectral features such as NDVI, Albedo, and TGSI [25,26,27,28]. They consider the vegetation, soil, radiance, and other information comprehensively. On this basis, some studies introduce texture features to make the classification results more accurate [29]. However, few studies have considered the impact of the quality of features on the prediction performance and training rate of machine learning models. Therefore, it is necessary to discuss the performance of machine learning algorithms on feature combinations of different qualities to verify the anti-interference ability of machine learning algorithms. The intelligent algorithms commonly used in desertification monitoring include decision tree, random forest, and support vector machine [25,30,31]. Most studies are too single on the choice of algorithms and do not discuss the effect of other algorithms in desertification monitoring [21,32]. In order to further improve the technologies and methods of desertification monitoring, it is necessary to comprehensively evaluate the performance of various machine learning algorithms in desertification monitoring.
In this paper, we take a typical ecologically fragile mining area in northwest China—Ningdong coal base—as the research object. Based on Landsat images, 17 features were obtained, and three different feature combinations were established. The performance differences of 11 machine learning intelligence algorithms on different combinations of features were comparatively analyzed by four performance metrics. Then, the spatial-temporal distribution and dynamic evolution of desertification in Ningdong coal base from 2003 to 2021 were statistically analyzed by using the optimal intelligent algorithm and feature combination. Finally, the driving factors of desertification in Ningdong coal base were explored and discussed. The main purposes of this study are: (1) To evaluate the performance of various machine learning classification algorithms in desertification monitoring. (2) To monitor the dynamic changes of desertification in Ningdong coal base in recent 19 years. (3) To reveal the factors driving the desertification change in Ningdong coal base.

2. Methods

2.1. Study Area

Ningdong coal base is located in the Middle East of the Ningxia Hui Autonomous Region and in the transition zone between the Ordos platform and Yinchuan plain. It is a semidesert desertification zone and one of the 14 large coal bases in China exceeding 100 million tons. It is composed of Hongshiwan, Maliantai, Renjiazhuang, Shigouyi, Qingshuiying, Lingxin, Meihuajing, Yangchangwan, Zaoquan, Hongliu, Shuangma, Jinfeng, and other mines with abundant coal resources. Ningdong coal base is flat, with an average altitude of 1480 m, and has a continental climate in the mid temperate zone. It is characterized by drought, concentrated rainfall, long sunshine durations, and large temperature differences between day and night. Sandstorms usually persist in spring. Its vegetation consists mainly of shrub and shrub-grass composed of Salix psammophila, Allium mongolicum, and other xerophytic vegetation, with sparse and uneven distributions and poor resilience [33]. The soil types mainly include light gray calcium soil, aeolian sand, silty fine sand, and saline alkali soil [34]. The soil is barren and the ecological environment is highly fragile. Figure 1 shows the location of Ningdong coal base and its coal mines.

2.2. Data Collection

2.2.1. Imaging Data and Preprocessing

The imaging data used in this study were Landsat products (downloaded from https://earthexplorer.usgs.gov/ (accessed on 21 November 2021)), with a spatial resolution of 30 m, suitable for long-term analysis and variation monitoring of surface information [35]. Selected Landsat imaging data from 2003, 2005, 2007, 2010, 2014, 2017, and 2021 for the Ningdong coal base were downloaded. To avoid misclassification due to seasonal factors, the month scale was from June to September, when vegetation becomes bushy. Imaging clouds were all <2%.
Radiometric calibration and atmospheric correction of Landsat images were performed using the general calibration tool and FLAASH model in ENVI, respectively, to eliminate the effects of sensors, atmosphere, and other factors. Landsat T1 already has good geometric accuracy. To improve the reliability of the results of the study, more accurate geometric correction using ground control points (GCP) was used. Then, images were cut. Improved normalized difference water index [36,37], enhanced construction land index [38], and the Fmask algorithm [39,40] are used to mask water, construction land, and cloud and cloud shadow, respectively.

2.2.2. Topographic Data

The digital elevation model (DEM) was obtained from the ASTGTM2 DEM data provided by the Geospatial Data Cloud (https://www.gscloud.cn/ (accessed on 8 December 2021)). The global spatial resolution of the DEM data is 30 m. First, images were mosaic-processed, projection-transformed, and edge-trimmed to match the Landsat data. Based on the DEM data, we calculated the slope and aspect of the study area. We then explored the changes in the spatial distribution of the desertification under different altitudes, slopes, and aspect conditions.

2.2.3. Desertification Driving Force Analysis Data

Based on previous studies focusing on the driving mechanism of desertification in northwestern China [9,28,41,42], as well as considering the mining characteristics of this region, 12 indexes were selected as the representative natural and human activity driving factors. These indexes included the average temperature, annual rainfall, total agricultural output value, total animal husbandry output value, and the number of main livestock and coal production activities. They were used to analyze the driving force of desertification at the Ningdong coal base to examine the main controlling factors and statistical characteristics of desertification evolution. All data were obtained from the Chinese meteorological data service center (http://data.cma.cn/ (accessed on 29 December 2021)) and the statistical yearbook for the Ningxia Hui Autonomous Region (http://nxdata.com.cn/publish.htm?cn=G01/ (accessed on 1 January 2022)).

2.3. Data Analysis

We used 7-period Landsat images of the Ningdong coal base from 2003 to 2021. Based on the preprocessed images, 9 spectral features and 8 texture features were obtained, and the missing value, abnormal value, and data dimension of the features were processed. Then, the importance and relevance of features were evaluated by using the feature selection method based on the tree model and Pearson correlation coefficient method. According to the evaluation results, three different quality feature combinations were established. Based on these three feature combinations and 11 machine learning intelligent algorithms, different desertification monitoring models were established. The performance of different monitoring models was compared by using the four indicators of accuracy, kappa, marco-f1, and AUC. The best monitoring model was used to extract the long-term desertification information of Ningdong from 2003 to 2021. Then, the spatio-temporal change law and driving factors of desertification were analyzed by using the gravity center migration model, dynamic change intensity index, and PCA. Figure 2 shows a flowchart of this study.

2.3.1. Desertification Classification System and Sample Selection

The development of desertification changes the structure and coverage of surface vegetation and the soil capacity. Different degrees of desertification show varying vegetation coverage and landscape characteristics [43]. Based on the monitoring and evaluation indicator system for sandy desertification [44], as well as the regional characteristics of the Ningdong coal base, the degree of land desertification was divided into four grades: nondesertification, light desertification, moderate desertification, and severe desertification. Table 1 lists the indexes and UAV image features of each category. Referencing the UAV images and Google Earth high-resolution images from the same period, nearly 2000 sampling points were randomly selected by QGIS software to establish the sample pool. Among them, severe, moderate, mild, and nondesertification samples accounted for about 22%, 21%, 22%, and 35%, respectively. The hold-out method [45] was used to divide 75% of the samples into the training dataset, and 25% were used as the validation dataset in a stratified manner. Figure 3 shows the distribution of the training sample points.

2.3.2. Desertification Classification Indicators

Based on the preprocessed Landsat image data, 17 feature indicators containing 9 spectral features and 8 textural features, which represented information on the vegetation, soil, surface radiation, and texture, were calculated. The corresponding characteristic values of the sample points were extracted using the Point Sampling Tool in QGIS to establish the initial dataset. Spectral information, such as the surface vegetation, soil, and albedo, are widely used in desertification research [46,47,48,49,50]. Effectively using this information is crucial for the accurate extraction of the degree of surface desertification. Textural features can reflect the structural features and spatial arrangement patterns of these features; therefore, they are widely used in scenarios such as remote sensing image processing and pattern recognition [51,52]. The textural features of desertified land are notable; adding textural features can effectively improve the recognition accuracy. Table 2 lists the equations for each feature. Of these, the tassel cap transformation coefficients for Landsat 5 TM were proposed by Crist and Cicone in 1984 [53]. The tassel cap transformation coefficients for Landsat 8 OLI were proposed by Baig in 2014 [54]. The textural features were obtained using the grayscale co-occurrence matrix (GLCM) calculations [55,56,57].

2.3.3. Feature Preprocessing

Owing to errors in the data itself or improper manual interpretations, there are missing values, outliers, and inconsistent magnitudes in the dataset. To import the accuracy of desertification extraction, the dataset should first be preprocessed [58].
  • Missing values and abnormal value management
    Samples with missing or abnormal values should be deleted or processed with the mean, plurality, model prediction, interpolation, or weighting methods for compensation [59,60]. The dataset only had a few missing or abnormal values; all of these samples were deleted.
  • Feature standardization
    Different dimensions of features can reduce the convergence rate of the algorithm model and affect the accuracy of algorithm analysis; therefore, data standardization is necessary. The Max–Min normalization method was used to linearly map the feature values to 0–1 to eliminate the influence of the dimensional difference on the accuracy of model:
X = x x m i n x m a x x m i n ,
where x is the original value, X is the mapped value of x ,   x m a x is the maximum value of the dataset, and x m i n is the minimum value of the dataset.

2.3.4. Feature Combinations

In order to explore the influence of feature combinations with different qualities on the performance of intelligent algorithms for desertification monitoring, we used the feature selection method based on tree model and the Pearson correlation coefficient method to evaluate the importance and correlation of features. Both methods are implemented in Python language:
  • Tree model feature selection method
    First, noise interference was added to the out-of-bag data. The importance of each feature variable was then obtained by calculating the degree of decline in the Gini index or the residual sum of squares caused by each feature variable in each decision tree [61,62]. Finally, all feature variables were ranked according to their value of importance; the features were selected by a given threshold.
  • Pearson correlation coefficient
    The Pearson correlation coefficient shown in Equation (2) is used to measure the degree of linear correlation between two variables. The range of the Pearson correlation coefficient is between −1 and +1. Positive values show a positive correlation while negative values show a negative correlation [63]. The greater the Pearson correlation coefficient, the stronger the correlation between two variables. A strong correlation can reduce the data application efficiency and rate of model operation:
r = i = 1 n X i X ¯ Y i Y ¯ i = 1 n X i X ¯ 2 i = 1 n Y i Y ¯ 2 ,
where r is the Pearson correlation coefficient, n is the total number of samples, X i , Y i is the value of the X and Y variables of the i -th sample, and X ¯ ,   Y ¯ is the average of the X and Y variables.
Figure 4 and Figure 5 show the results of feature importance and the Pearson correlation coefficient, respectively. We used an importance > 0.03 and absolute value of Pearson correlation coefficient of <0.65 (features with an absolute correlation coefficient value ≥ 0.65 were considered as strongly correlated while only one feature with high importance was selected) as the threshold to establish three feature combinations: ① the feature combination after importance and correlation screening (the feature is of high importance and weak correlation), ② the feature combination after importance screening (the feature is of high importance but strong correlation), and ③ all features (including features with low importance and strong correlation). Table 3 shows the composition of each feature combination.

2.3.5. Intelligent Algorithms

Recently, the computational efficiency and reliability of artificial intelligence technology and machine learning algorithms have improved effectively with increased development. These methods have been widely used in different application scenarios. In order to compare the performance of different machine learning intelligent algorithms in desertification monitoring, 11 commonly used classification algorithms were selected for experiments. All algorithms were written in Python, and the parameters of each algorithm were optimized by grid search and cross-validation to eliminate the influence of differences in features and make the results more reliable.
  • Multinomial Logistic Regression (MLR)
Logistic regression simulates the probabilities of binary dependent variables. It assumes a linear relationship between the log odds of the dependent variable and the independent variable [64]. It applies to binary classification. MLR is a generalization of logistic regression models that can be applied to multiclassification problems. It is a conversion of linear regression using the softmax function [65].
2.
Linear Discriminant Analysis (LDA)
LDA projects high-dimensional sample feature data onto low dimensions, and finds the best recognized vector space to achieve the effect of extracting classification information and compressing feature space dimensions. The projection ensures that the pattern sample has the largest interclass distance and the smallest intraclass distance in the new subspace, that is, the pattern has the best separability in that space [66].
3.
Quadratic Discriminant Analysis (QDA)
QDA is a variant of LDA. It also assumes that the observed values of each class come from Gaussian distribution, and inserts the estimated values of parameters into Bayesian Theorem for prediction. The difference is that LDA assumes that the covariance matrix of each classification is the same, while the covariance matrix of each classification in QDA is different, which is the basic reason why LDA is more flexible than QDA [67].
4.
Classification and Regression Tree (CART)
CART is the search for the best classification system from a complex set of ir-regularly distributed data. CART sets a heterogeneity threshold, and when heterogeneity reaches that threshold range, a classification node is generated, otherwise it is reselected and combined from a multitude of categorical attributes, and it goes back and forth until heterogeneity reaches that threshold range [68].
5.
Support Vector Machines (SVM)
When dealing with classification problems, SVM maps the input vector into a high-dimensional space through some nonlinear function relationship, and then solves the optimal classification surface to realize classification [69]. SVM classifiers have a high accuracy in remote sensing image classification, and also avoid the problem of overfitting in theory.
6.
Naive Bayes classifier (NB)
The classification principle of NB is based on the Bayesian formula. The posterior probability of an object is calculated from its prior probability, that is, the probability that the object belongs to a certain class. It is a way to implement decision making at the probability level [70]. NB has a fast convergence speed and is suitable for classification of a small amount of data.
7.
K-Nearest Neighbor (KNN)
KNN does not depend on a specific function distribution, and it is classified by measuring the distance between different eigenvalues. For newly input sample data, if most of the k nearest sample data in the feature space belong to a certain category, the sample data will also be divided into this category [71].
8.
Random Forests (RF)
RF is an ensemble learning algorithm proposed by Breiman et al. [72]. RF uses the decision tree of randomly selected features and sample sets as a weak learner to determine the final classification results according to the votes of all decision tree classifiers. The selection of each tree sample in the random forest is made by randomly putting back samples from the original data set for N times to generate N different, untrimmed decision trees. Each node in the decision tree randomly selects K features from all the features. Each split is tested according to the Gini index to select the best features. Finally, the decision tree with the fastest reduction of the Gini index is obtained. Random forest algorithms have randomness in sample and feature selection, which makes it difficult for random forest to fall into overfitting and gives it a good antinoise ability [61].
9.
Extremely Randomized Trees (ERT)
ET is an ensemble learning algorithm proposed by Pierre Geurts et al. in 2006 [73]. Its principle is similar to RF, by integrating multiple decision tree voting results to determine the final classification results. Each subdecision tree in ET is trained using the original dataset. In feature selection, ET randomly selects an eigenvalue to divide the decision tree.
10.
AdaBoost (AB)
AB was proposed by Freund et al. in 1997 [74]. It is widely used because of its fast speed, low complexity, and good compatibility. AB reasonably combines multiple weak classifiers to make it a strong classifier. Using the idea of iteration, a weak classifier is trained in each iteration and applied to the next iteration.
11.
Gradient Boosting Machine (GBM)
GBM is a machine learning algorithm proposed by Friedman on the basis of AB [75]. The basic principle is to train the newly added weak classifier according to the negative gradient information of the loss function of the current model, and then combine the trained weak classifier with the existing model in the form of accumulation. The main innovation of GBM is that it proposes to estimate the basis function with the nonparametric method and use “gradient descent” in function space for approximate solution.

2.3.6. Performance Index

Four indicators were selected to compare the performance of these algorithms.
  • Accuracy
Accuracy is the proportion of the number of samples classified correctly with respect to the total number of samples, with values between 0 and 1. The higher the value of the accuracy indicator, the better classification result. Imbalances in the sample size easily influence the evaluation effect.
A c c = 1 m i = 1 m 𝟙 f x i = y i
where m is the total number of samples, f x i is the predicted result of sample x i , y i is the true markup corresponding to x i , and 𝟙 x is the indicating function: when x is true, the value is 1; when x is false, the value is 0.
2.
Kappa
Kappa can eliminate problems associated with a false high accuracy caused by category imbalance, with values between −1 and 1, generally set from 0 to 1. The evaluation index is Kapp ≤ 0.2 (poor consistency), 0.2 ≤ Kappa ≤ 0.4 (fair consistency), 0.4 ≤ Kappa ≤ 0.6 (medium consistency), 0.6 ≤ Kappa ≤ 0.8 (good consistency), and 0.8 ≤ Kappa ≤ 1 (excellent consistency).
p o = A c c
p e = i = 1 c a i b i m 2
K = p o p e 1 p e  
where A c c is the accuracy, c is the number of classes,   a i is the actual quantity corresponding to class i , b i is the predicted quantity corresponding to class i , and m is the total number of samples.
3.
Macro-F1
F1 is the harmonic mean of the precision and recall, which can be used to measure the accuracy of the binary classification, with values between 0 and 1. Its high value corresponds to a high accuracy. The precision is the proportion of the number of samples classified correctly to the total number of prediction results in the category. Recall is the proportion of the number of samples classified correctly to the actual total number in the category. The Macro-F1 is a variant model of the F1 that decomposes the multiclassification into multiple binary classifications [76].
Macro - F1 = 2 × i = 1 n P i n × i = 1 n R i n i = 1 n P i n + i = 1 n R i n
where n is the number of binary classifications decomposed by multiclassification, P i is the precision corresponding to the i binary classification, and R i is the recall corresponding to the i binary classification.
4.
AUC
The AUC is the area under the ROC curve, which can directly evaluate the performance of the binary classification model [77], with values between 0.5 and 1. Larger values indicate better performance. Here, 0.5 represents the random guessing performance while 1 represents the optimal performance [78]. For multiclassification, the AUC can be calculated by decomposing multiples into binary classifications.
l r a n k = 1 m + m x + D + x D 𝟙 f x + < f x + 1 2 𝟙 f x + = f x
AUC = 1 i = 1 n l r a n k i n
where m + ,   m , respectively, correspond to the sample numbers of positive and negative classes in the binary classification, D + , D , respectively, correspond to the sample sets of positive and negative classes in the binary classification. f x + ,   f x , respectively, correspond to the predicted values of positive and negative classes in the binary classification. n is the number of binary classifications decomposed by multiclassification. 𝟙 x is the indicating function: when x is true, the value is 1; when x is false, the value is 0.

2.3.7. Gravity Center Migration Model

The gravity center migration model is an effective method that reflects the changes in the center of the gravity position of the research object. This method was first proposed to examine the center of gravity of the population distribution. Now it is widely used to examine changes in the spatial patterns in human economy and ecological landscapes, among others [79,80,81,82]. In this study, the gravity center migration was calculated to analyze the spatial variation in desertification land at the Ningdong Coal Base from 2003 to 2021. The gravity co-ordinate was calculated as follows:
X j = i = 1 n C j i × X j i / i = 1 n C j i   and
Y j = i = 1 n C j i × Y j i / i = 1 n C j i ,
where X j ,   Y j are the longitude and latitude co-ordinates of the gravity center of a certain type of desertification land in the j -th year, n is the number of patches of the calculated type of desertification land in the j -th year, C j i is the area of the i -th patch of the calculated type of desertification land in the j -th year, and X j i , Y j i are the geometric center co-ordinates of the i -th patch of the calculated type of desertification land in the j -th year.

2.3.8. Desertification Dynamic Change Intensity Index

As listed in Table 4, to explore the dynamic changes in desertification land at the Ningdong coal base, we proposed six levels of the change intensity according to the spanned desertification grade, which were severe degradation, moderate degradation, light degradation, light improvement, moderate improvement, and significant improvement.
The desertification change intensity index, T, was introduced to characterize the intensity of desertification change in each period, as follows:
T w   = i = 3 1 i × S i S ,
T r   = j = 1 3 j × S j S ,   and
T = T w   + T r   ,
where   T w   is a degenerate intensity; T r   is the improvement intensity;   T is the overall change intensity; i = −3, −2, −1 correspond to severe, moderate, and light degradation, respectively;   j   = +1, +2, +3 correspond to light, moderate, and significant improvements, respectively; S i , S j represent the desertification area of the corresponding level; and S represents the total area of desertification change.

2.3.9. Dimidiate Pixel Model

Vegetation cover is an important ecological factor affecting the degree of surface desertification; vegetation degradation leads to the deterioration of surface ecosystem conditions. Wind, rainfall, solar radiation, freeze-thaw changes, and other factors, under low vegetation cover conditions, affect the surface soil and trigger different degrees of surface desertification. The dimidiate pixel model is a vegetation coverage estimation model frequently used for its simplicity and practicality [83,84,85], which assumes that a pixel in the image is composed of both vegetation and nonvegetation coverage [86]. We used the NDVI as the parameter for the dimidiate pixel model to extract vegetation coverage information for the Ningdong coal base:
FVC = NDVI NDVI s o i l / NDVI v e g NDVI s o i l ,
where FVC is the Fractional Vegetation Cover and NDVI s o i l , NDVI v e g are the NDVI information reflected by pure soil and vegetation pixels, respectively.

2.3.10. PCA

PCA is a multivariate statistical method for dimension reduction of variable information, commonly used for data simplification and multi-index comprehensive evaluation [87]. It is widely used in social economics, medicine, meteorology, environmental science, and other fields. PCA is a linear transformation of multiple related variables into ir-relevant comprehensive index variables [88]. PCA approximately generalizes most of the original data to eliminate the effect of subjective desirability. PCA was used to extract the driving factors of desertification at the Ningdong coal base and analyze its influencing weight to reveal the driving mechanism of desertification.

3. Results

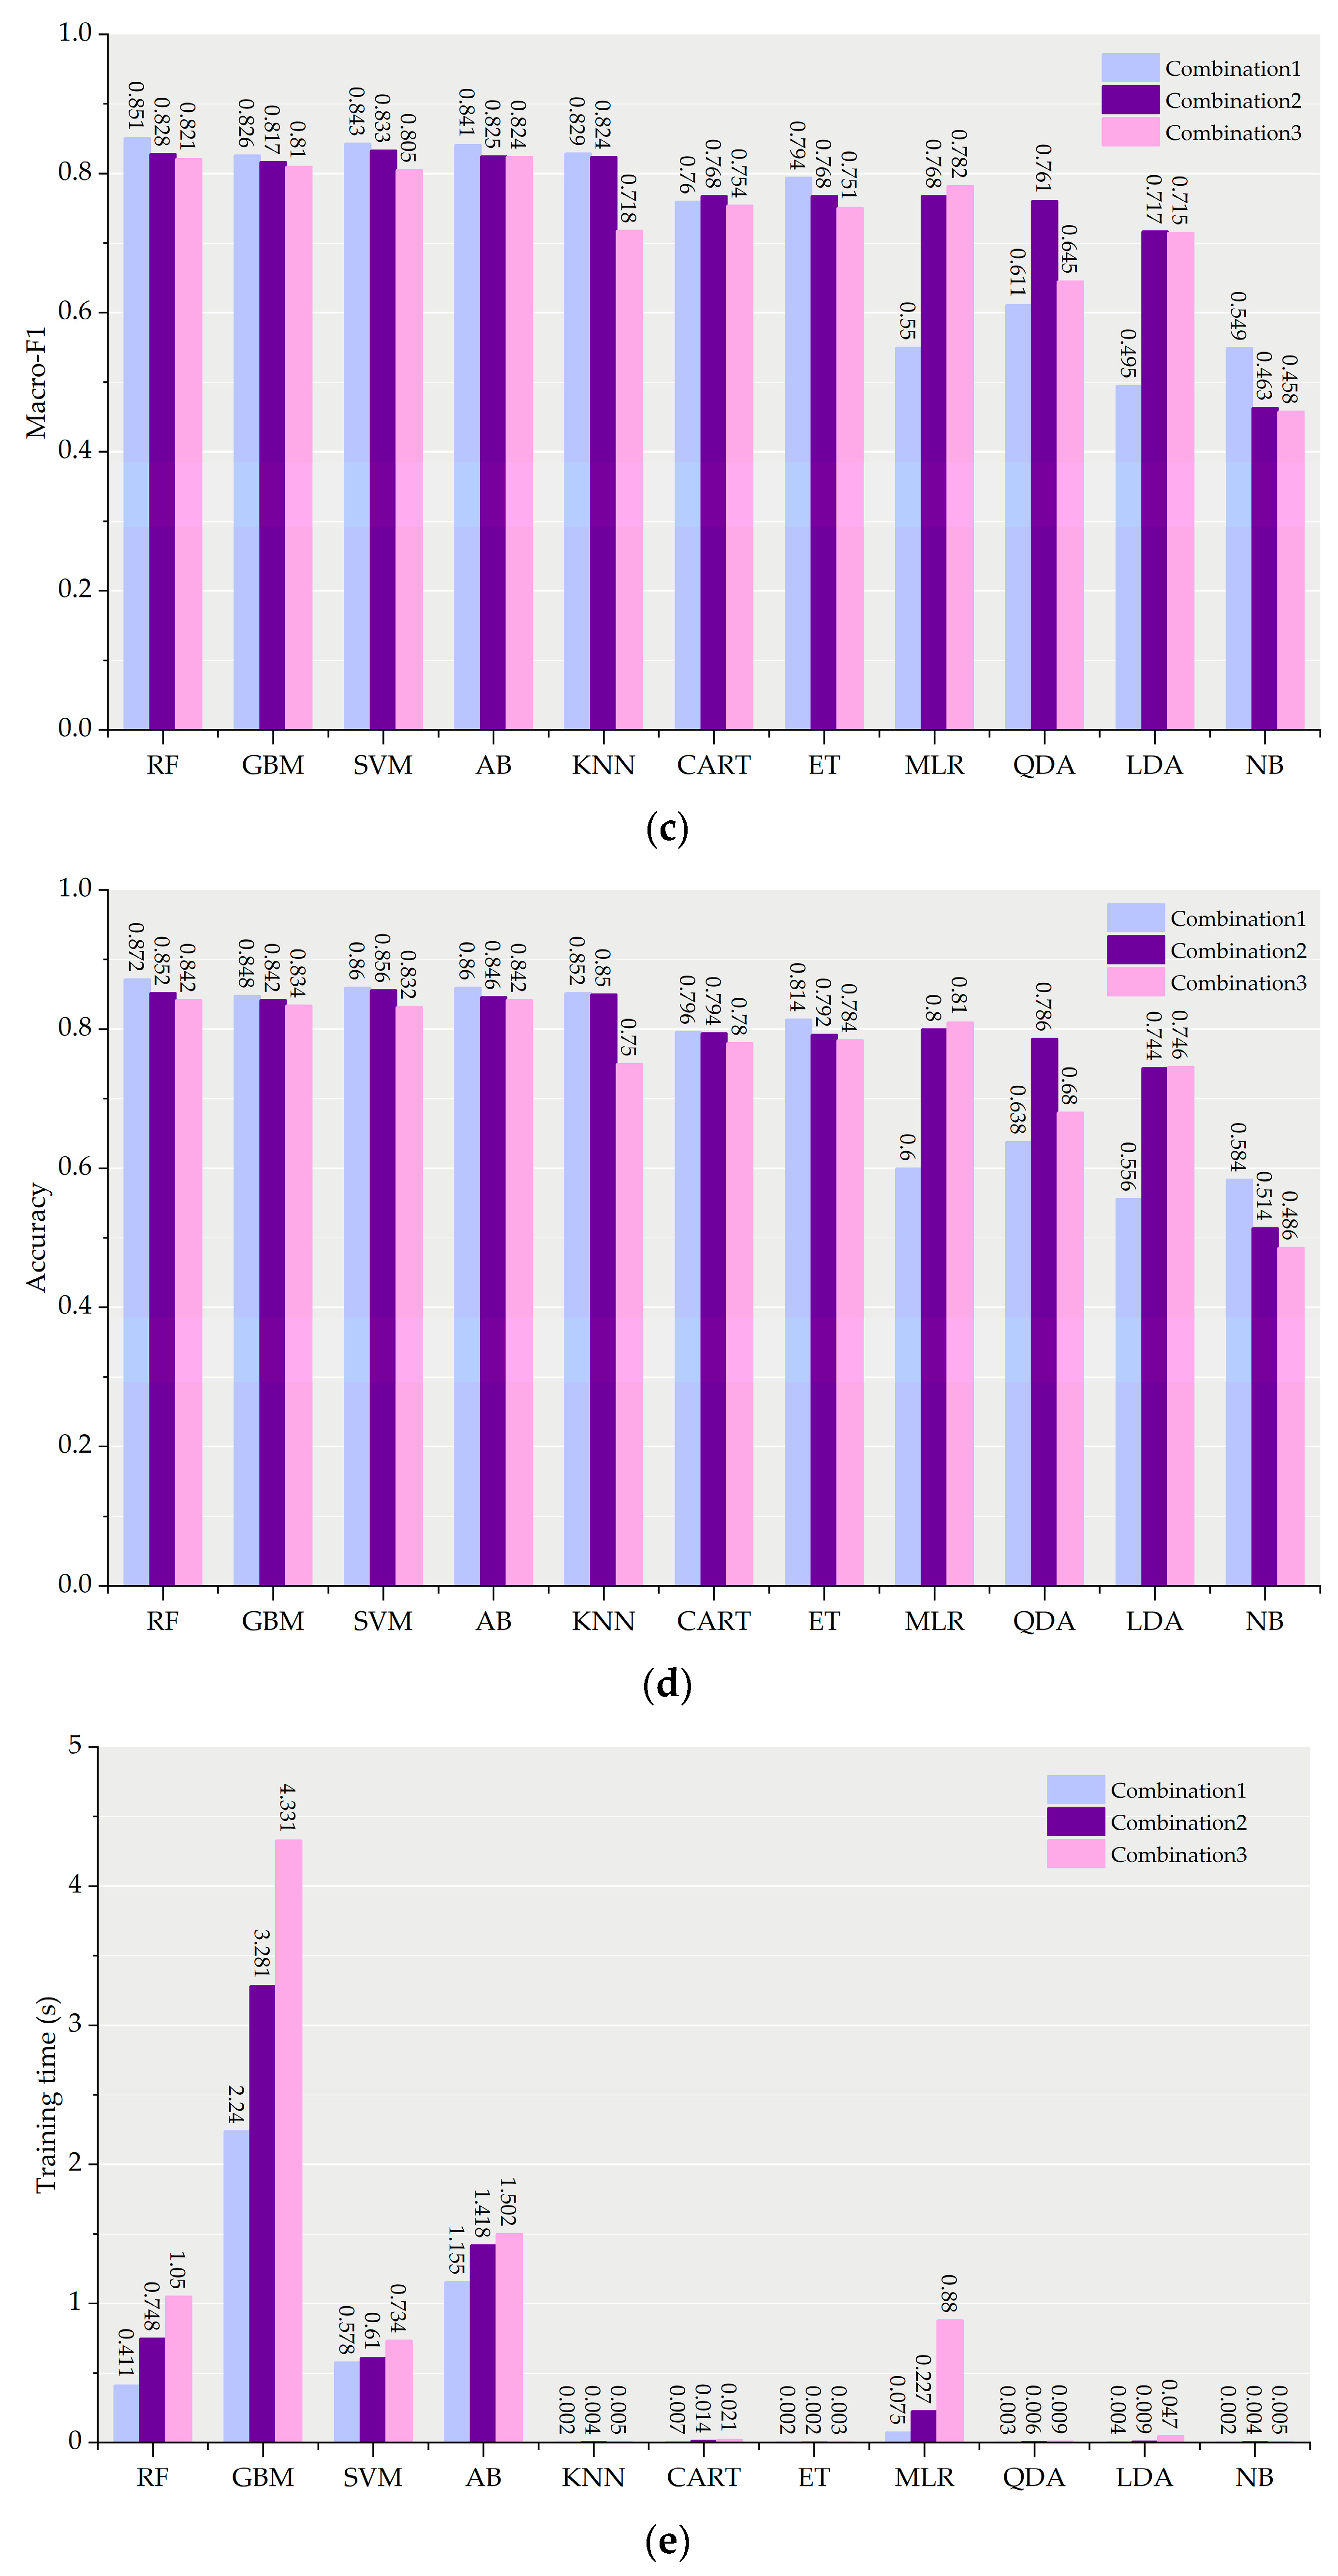
3.1. Comparison of Desertification Monitoring Models

Figure 6 shows the performance of different desertification monitoring models. It can be seen that different intelligent algorithms with different feature combinations had certain differences in the prediction effect and training rate. In terms of feature combination, when RF, GMB, AB, KNN, ET, NB, CART, and SVM were used, feature combination 1 showed good results, but the accuracy was low when MLR, QDA, and LDA were used. It may be that LR, QDA, and LDA are classification algorithms based on geometric principles, but the linear correlation degree of combination 1 was greatly weakened after correlation screening. The overall performance of combination 2 was slightly worse than that of combination 1, but its accuracy was much higher than that of combination 1 when using MLR, QDA, and LDA. The performance of combination 3 was slightly better than that of combination 2 only when MLR and LDA algorithms were used. However, its time complexity was too high, and the training time was several times that of the latter. In terms of training time, feature selection could effectively improve the training rate of the machine learning model. Overall, the combination 1, screened by importance and correlation, had better applicability, which was more suitable for extracting desertification information in Ningdong base.
As the intelligent algorithms often used in desertification monitoring, RF and SVM still had good results in this study. Especially RF, whose accuracy was 0.872, Kappa was 0.825, Macro-F1 was 0.851, and AUC was 0.872 under the best combination. The four indexes were the best among the 11 algorithms, which shows that it had high accuracy, consistency, and strong generalization ability. In addition, GBM and AB also showed good performance in this study, and the prediction effect was slightly lower than that of RF and SVM. It can be seen from the results that the accuracy of GBM and AB was similar, but the training time of GBM was about twice that of AB, which may be due to the fact that GBM modified the error of the previous base learner by fitting the (quasi) residual of the previous base learner [89]. KNN had high accuracy in combinations 1 and 2, while it decreased by about 13% in combination 3. The algorithm was vulnerable to noise. Although CART and ET had good anti-interference abilities and fast training rates, their accuracy was lower than the previous algorithms. MLR, QDA, and LDA had low accuracy and unstable performance, which was greatly affected by decision boundary and feature quality. NB is a classifier that assumes that each feature is independent of each other, and the relationship between the features has a greater impact on its prediction results [90]. Its performance was the worst among the 11 algorithms, and the best results of its Accuracy, Kappa, Macro-F1, and AUC were only 0.584, 0.442, 0.549, and 0.584, respectively. Overall, RF had higher accuracy and stability than other algorithms, so it was more suitable for extracting desertification information from Ningdong coal base.

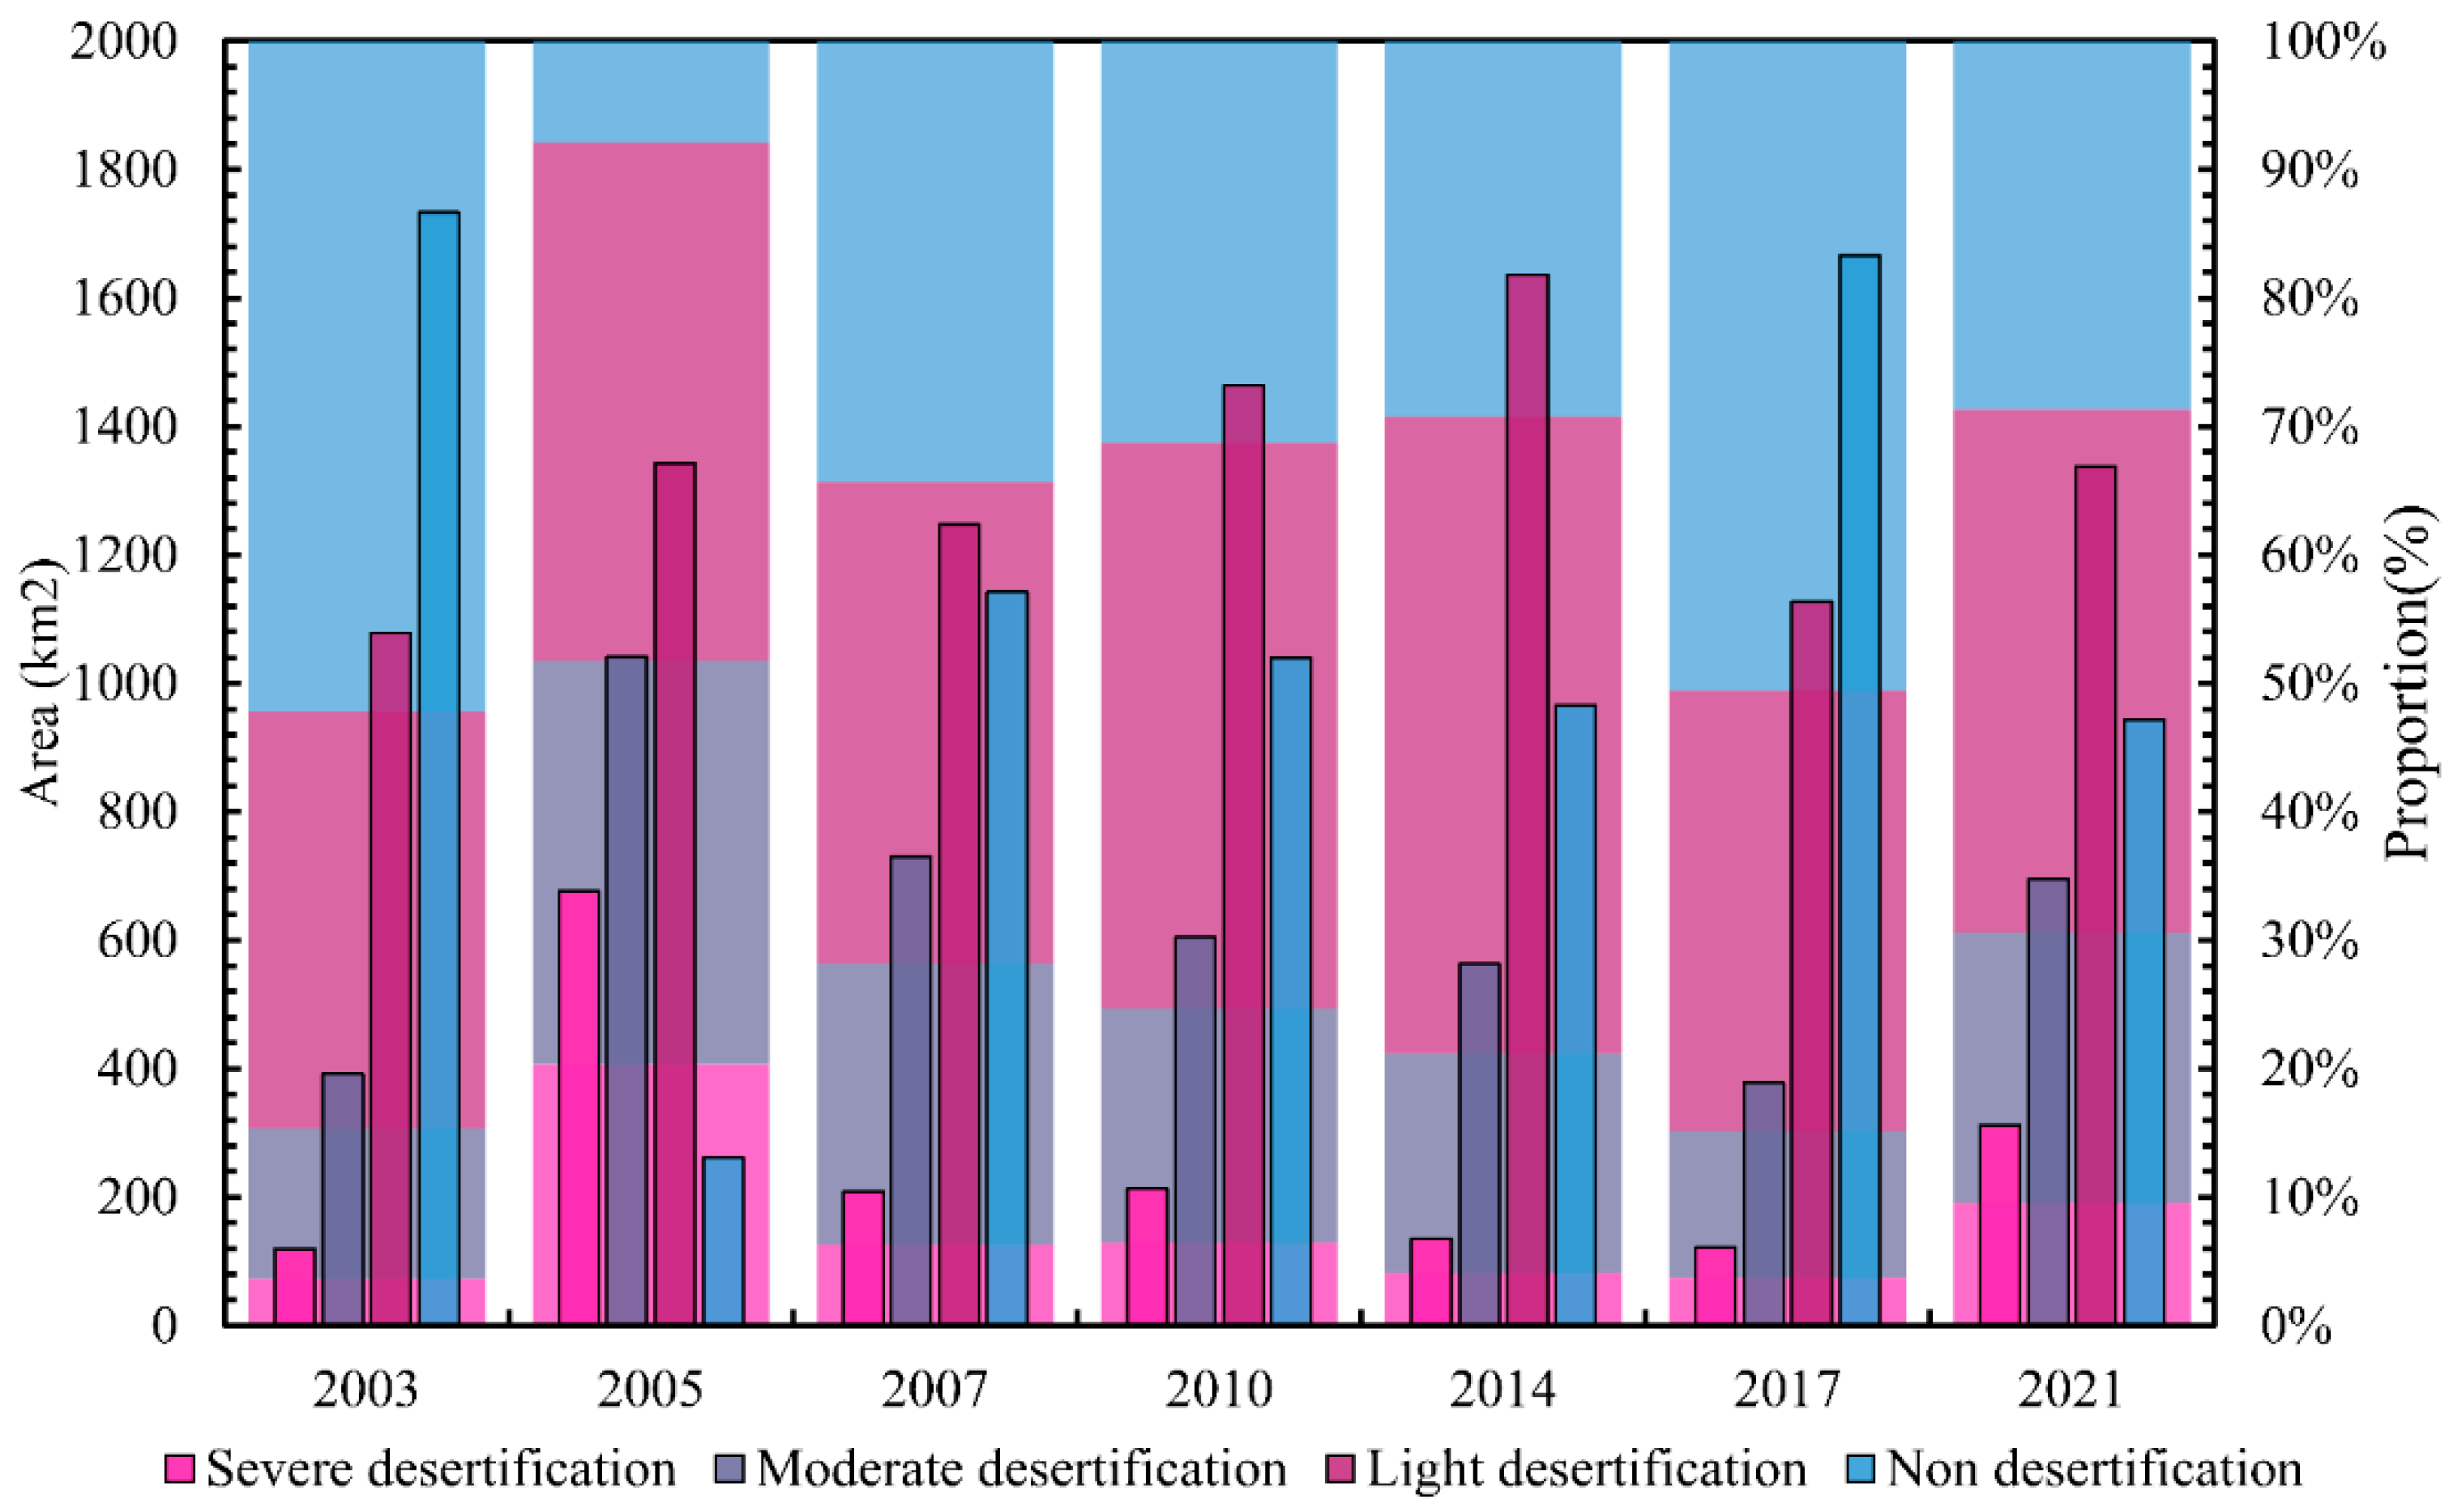
3.2. Spatial and Temporal Distribution of Desertification

Based on combination 1, RF was used to extract desertification at the Ningdong coal base. Figure 7 and Figure 8 show the desertification zoning map and the area of each desertification type in Ningdong coal base from 2003 to 2021, respectively. From 2003–2005, large-scale desertification occurred in the central and southern areas of the Ningdong coal base: the area of severe desertification increased to 676.12 km2. From 2005–2007, the area of nondesertification land increased to 1142.09 km2, mainly located in the northern and eastern areas. From 2007–2014, moderate desertification and nondesertification land decreased yearly while the area of light desertification increased yearly, showing a slow overall deterioration trend. From 2014–2017, the area of various types of desertification land decreased and nondesertification areas in the northern and southern areas of the base increased. From 2017–2021, the desertification status of the base deteriorated while the nondesertification area decreased to 943.41 km2. Severe and moderate desertification land was mainly distributed in the northeast, central, and southwest corners of the base.

3.3. Desertification Variations under Different Topographic Conditions

To examine desertification changes at the Ningdong coal base under different terrain conditions, the topographic conditions were classified based on the elevation, aspect, and slope. Table 5 lists the classification index information.

3.3.1. Desertification Variations at Different Elevations

Figure 9 shows the proportion of desertification types at different elevations at the Ningdong coal base. There were different distributions of the desertification types at different elevations. With an increase in elevation, the proportion of the severe desertification area showed a decreasing trend; the proportion of moderate desertification also decreased gradually from 1275 m. The area of light desertification increased with an increase in the elevation and tended to become stable at elevations > 1475 m. The area of nondesertification land decreased first and then increased, with the smallest proportions in areas at elevations from 1475–1575 m.

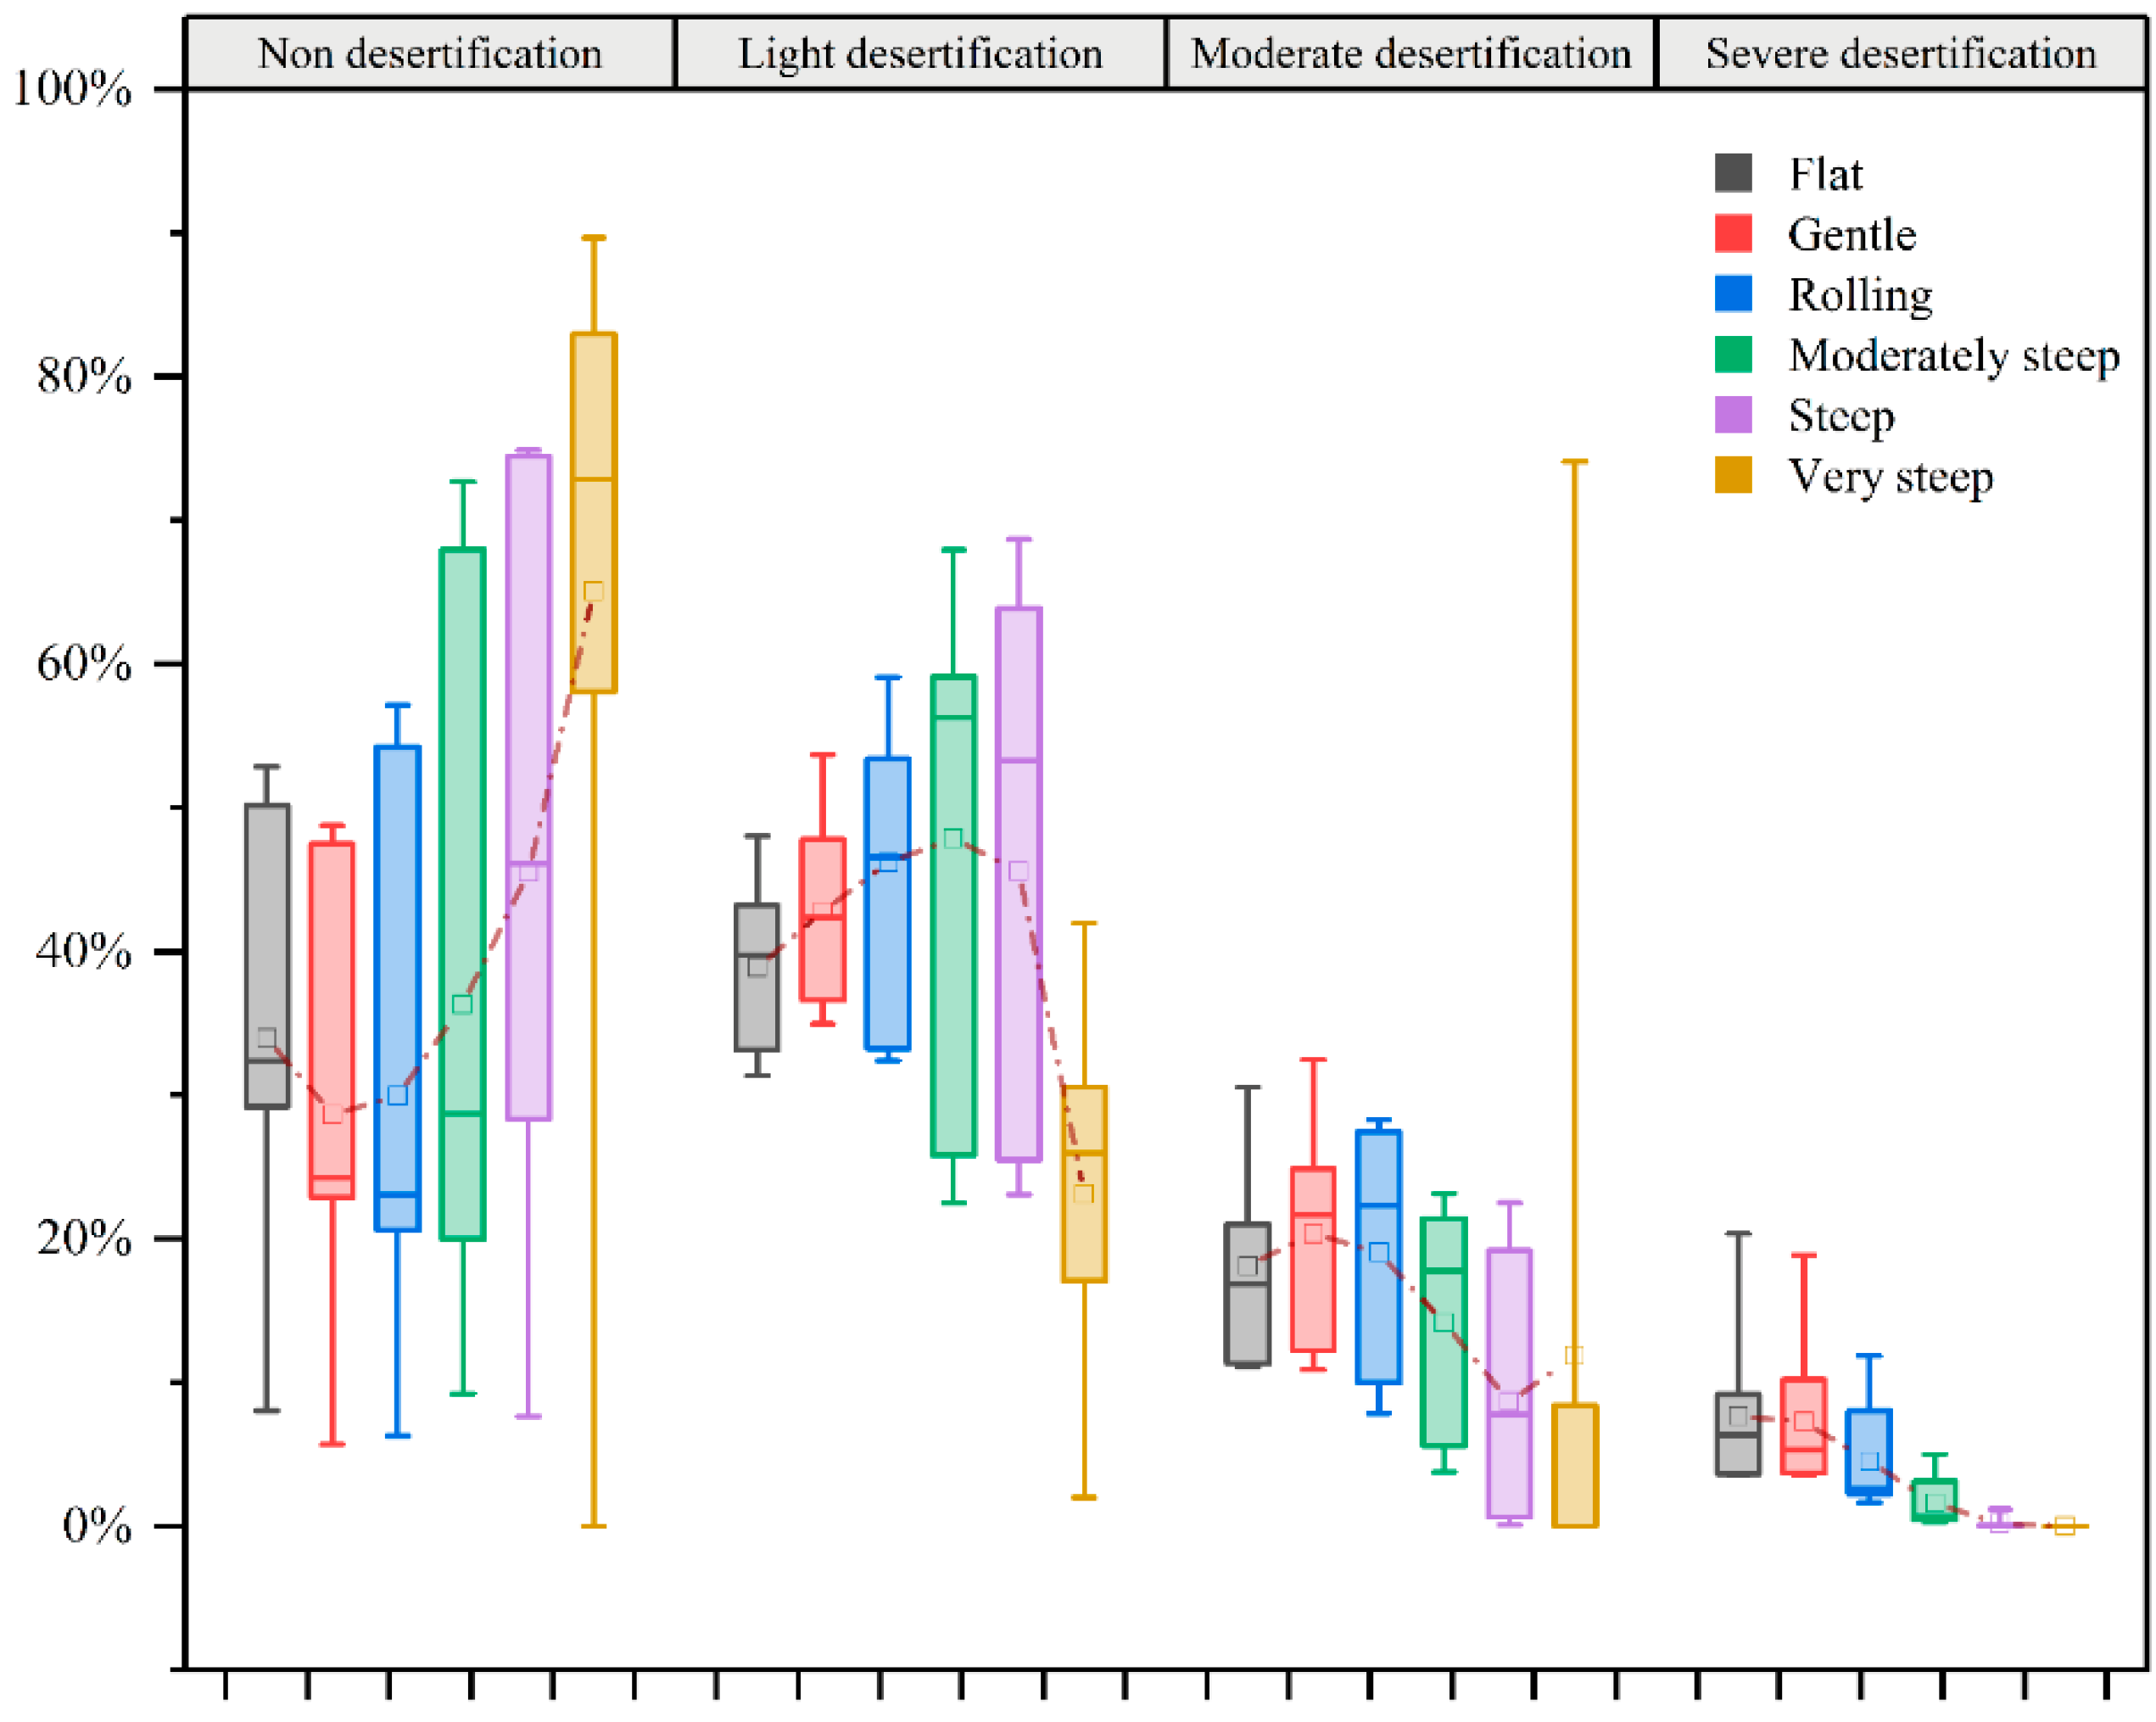
3.3.2. Desertification Variations at Different Slopes

Figure 10 shows the proportions of the desertification types at different slopes at the Ningdong coal base. There was a correlation between the proportions of the different desertification types and changes in the slope. With an increase in the slope, the proportions of severe and moderate desertification land at the Ningdong coal base decreased gradually; there were almost no severe desertification lands in areas > 25°. Light desertification land first increased and then decreased with an increase in the slope, reaching its maximum at a moderately steep slope. The proportion of nondesertification land area showed an increasing trend, with the largest proportion at very steep slopes.

3.3.3. Desertification Variations at Different Aspects

Figure 11 shows the proportions of desertification types at different aspects of the Ningdong coal base. Difference aspects had negligible impacts on desertification; the proportion of each desertification type in the different slope direction areas fluctuated by no more than 5%. With the change in the aspect from the north to the south, land with severe, moderate, and light desertification first increased and then decreased. Land with severe and moderate desertification accounted for the largest proportion in the east slope while land with light desertification accounted for the largest proportion across the south and southwest slopes. The proportion of nondesertification land first decreased and then increased from the north to south; the proportion was the smallest on the east slope.

3.4. Type Transformation of Desertification

Table 6 lists the transfer matrix for the desertification land types at the Ningdong Coal Base from 2003 to 2021. From 2003 to 2005, a large area of land had a desertification trend, which was mostly nondesertification land that was transformed into light desertification land. From 2005–2007, 942.07 km2 of desertification land was converted to nondesertification land, thus improving the situation. From 2007–2014, the transformation occurred mainly in moderate, light, and nondesertification land. From 2014–2017, the desertification trend improved, and a large area of light desertification land was converted to nondesertification land. From 2017–2021, there was a large increase in the area of desertification land with general deterioration.

3.5. Gravity Center Migration of Desertification

Figure 12 and Table 7 provide the center of gravity migration for the different desertification types at the Ningdong coal base from 2003 to 2021. The center of gravity of the desertification land mainly migrated between the north and the south. The gravity center of severe desertification migrated the largest distance from 2005 to 2007, i.e., 22.11 km to the south. From 2007–2010, the gravity center of moderate desertification migrated only 1.18 km to the northwest, with negligible changes. The changes in the gravity center migration direction for light desertification and nondesertification land were similar, at 17.96 and 14.60 km land migration to the south from 2014–2017, respectively. The gravity center migration direction of desertification was similar for the two periods characterized by serious desertification deterioration (2003–2005 and 2017–2021). The gravity center of severe desertification migrated to the northeast, the gravity center of moderate desertification land migrated to the southeast, the gravity center of light desertification land migrated to the northwest, and the gravity center of nondesertified land migrated to the north. Notably, the change in the desertification gravity center had a certain regularity with desertification intensification.

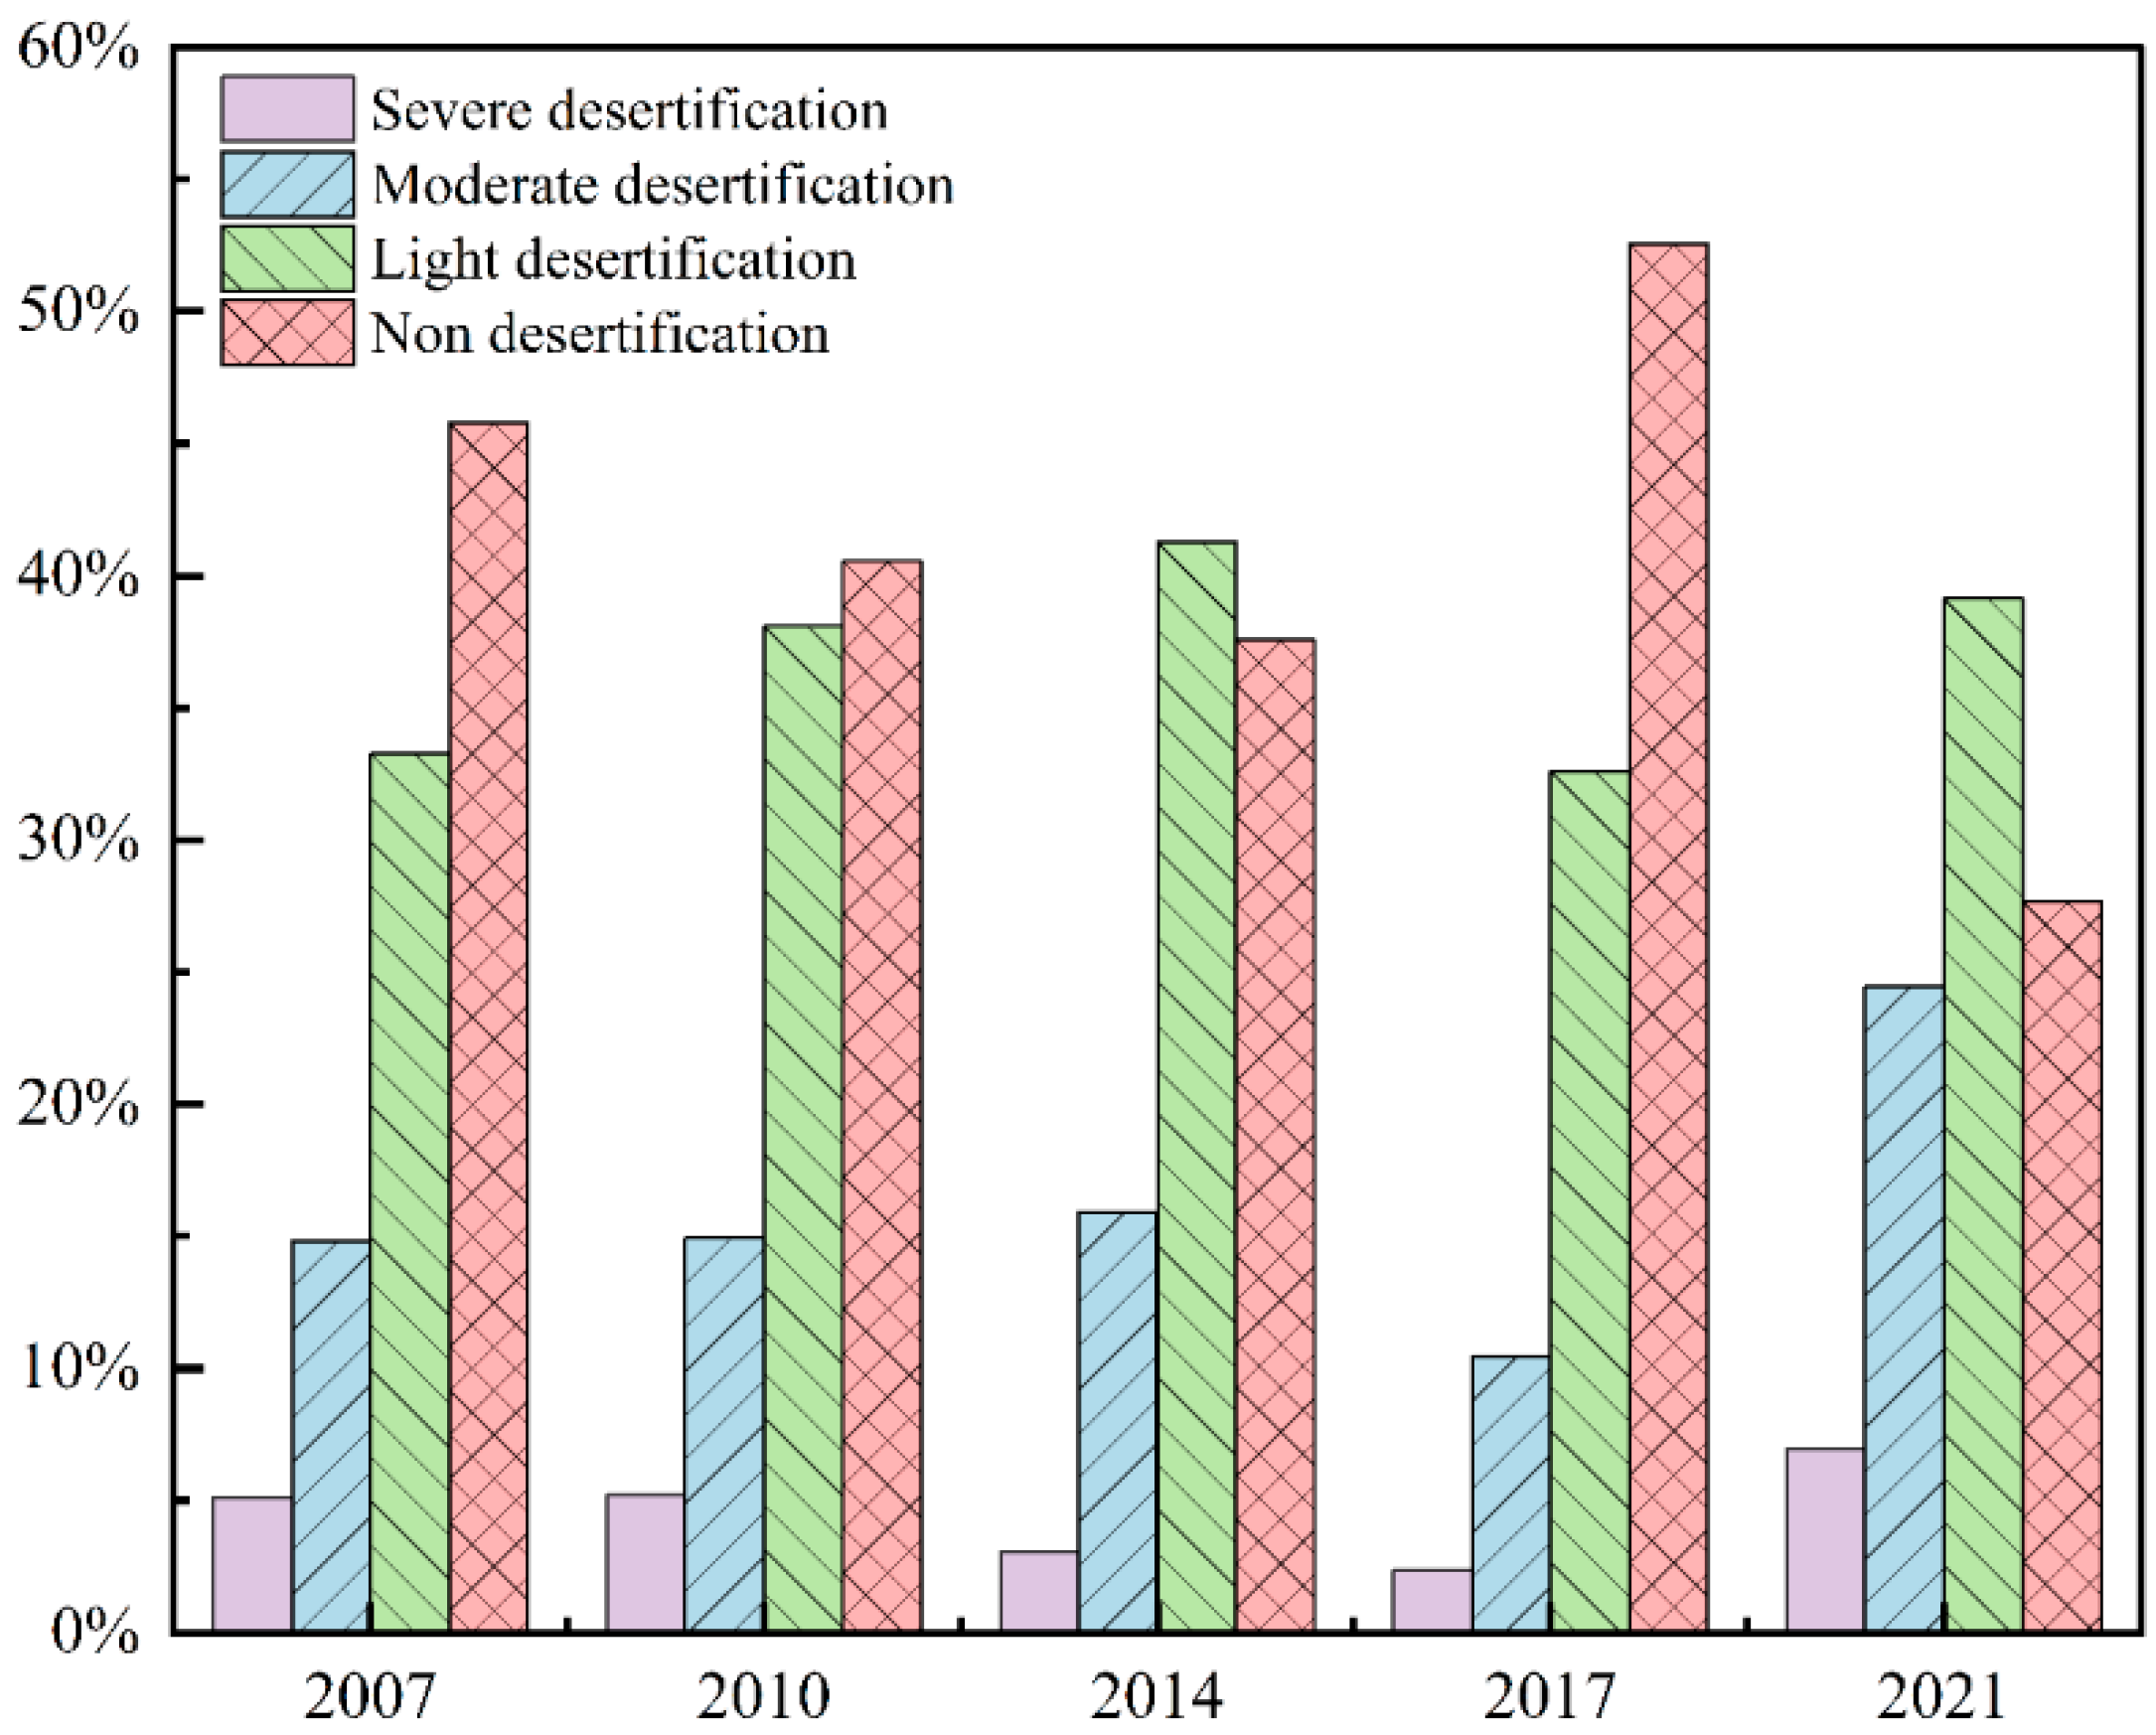
3.6. Desertification Change Intensity

Figure 13 shows the dynamic change intensity of the spatial distribution of different desertification types at the Ningdong coal base from 2003–2021. From 2003–2005, the trend at the Ningdong coal base deteriorated and the central and southern parts of the base were severely degraded. From 2005–2007, the trend at the base was reversed while the degree of desertification in the northern and central parts improved significantly. From 2007–2010, the desertification situation in a few areas in the northern part of the base was seriously degraded. There were only slight changes from 2010–2014. From 2014–2017, a large area in the northern part of the base showed moderate improvements; the deterioration areas were mainly concentrated in the middle, mostly with a light degradation trend. From 2017–2021, a large area of land had a moderate degradation, with changes across the northern and southern parts of the base.
Figure 14 shows the desertification change intensity index from 2003–2021. In terms of the overall change intensity, desertification showed a worsening trend from 2003–2005 and 2017–2021, whereas the situation improved during the remainder of the study period. From 2003–2005, the deterioration intensity was at its highest, i.e., −0.68. From 2005–2007, the recovery intensity was the largest; the overall change intensity reached 0.94. The overall change intensity during the two periods from 2007–2014 was approximately zero, indicating that there were negligible fluctuations in the desertification land types.

3.7. Analysis of Desertification Driving Factors

The load matrix and variance contribution rate of the desertification driving factors were obtained based on the PCA using statistical data from 2007–2020 with SPSS, as listed in Table 8. Three principal components with eigenvalues > 1 were extracted. The cumulative contribution rate reached 86.13%, covering most of the data. These three principal components were selected to discuss the impact that the natural driving factors and human activities had on the desertification status of the Ningdong coal base.
The contribution rate of the first principal component was 57.61%, including the total output value of agriculture, animal husbandry, main livestock, traffic freight volume, industrial wastewater discharge, and industrial solid waste production. Human activities played a leading role in the change in land desertification at the Ningdong base. The contribution rate of the second principal component was 19.71%, mainly including the number of mining enterprises, coal industry personnel, annual coal output, and total output value of the coal industry. This explained the driving effect that human activities, as dominated by coal resource mining, had on desertification at the Ningdong coal base. The contribution rate of the third principal component was 8.81%, mainly including annual rainfall, which indicates that climate change was another important factor affecting desertification at the Ningdong coal base. Overall, human activities dominated the evolution of desertification at the Ningdong coal base, followed by climate change.

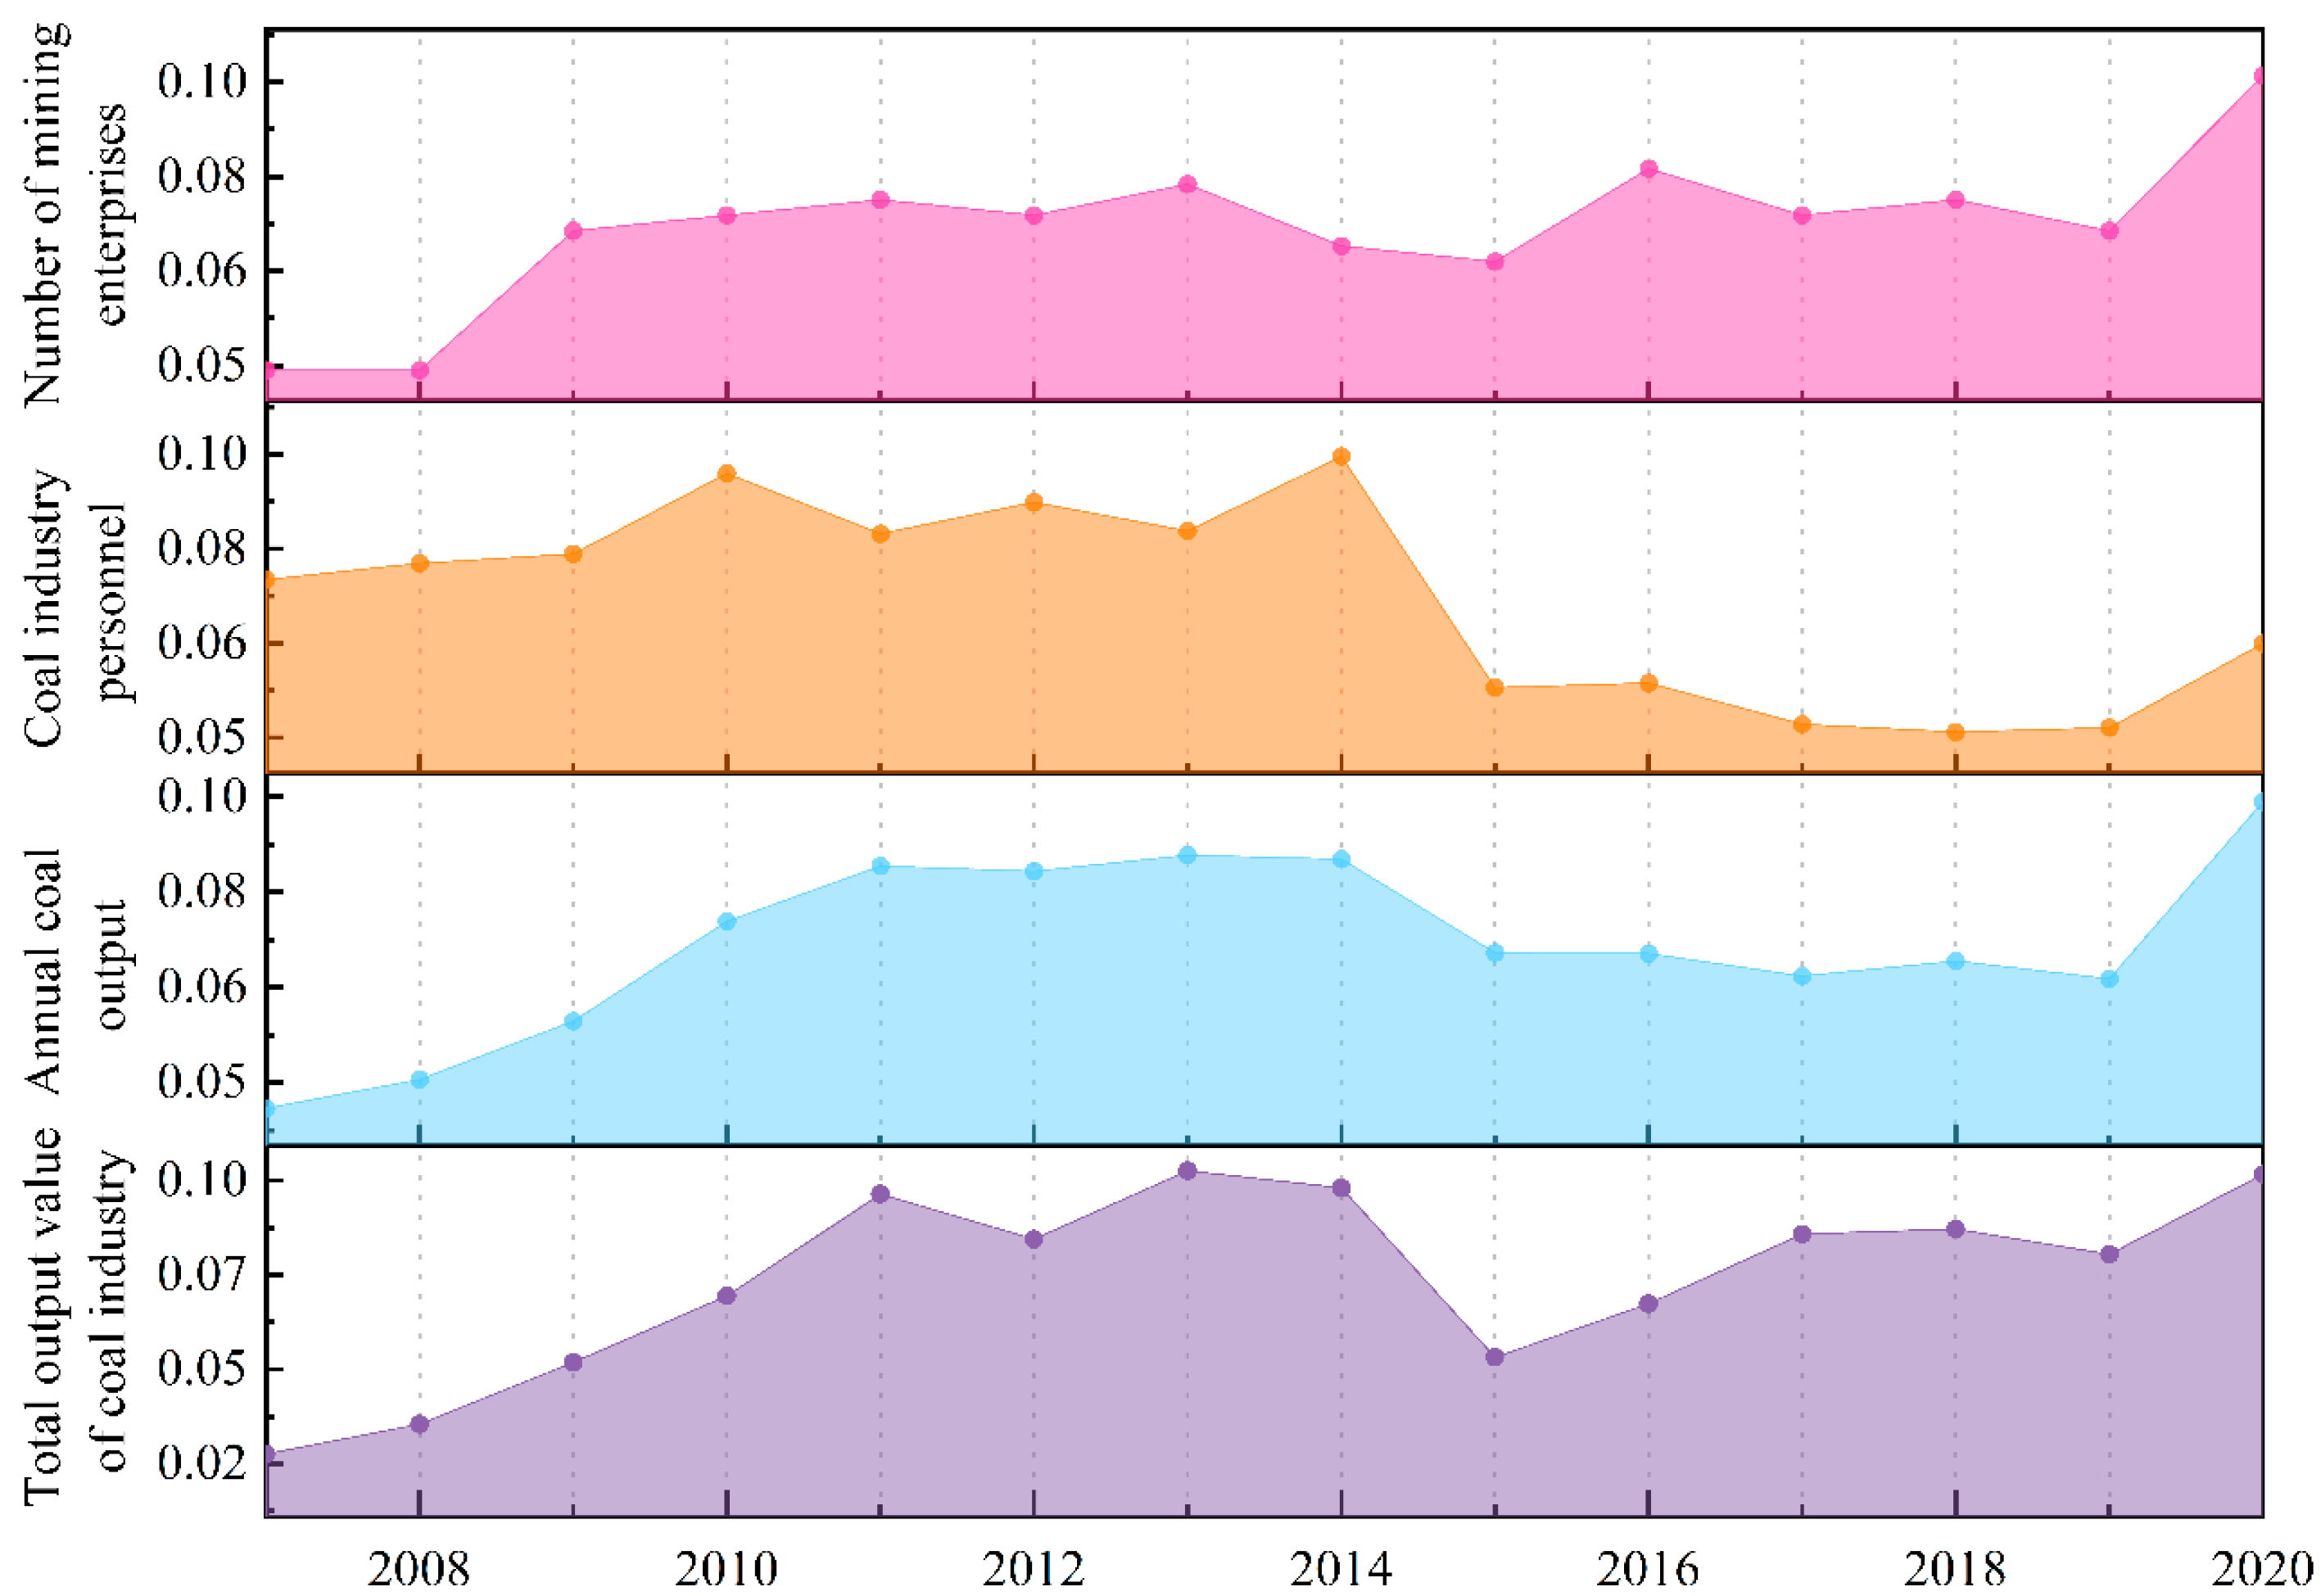
3.7.1. Human Activity Factors

The cumulative contribution rate of the first and second principal components reached 77.32%, which was mainly related to human activities. Human economic activities were the core driving forces of the positive and negative changes in desertification at the Ningdong coal base. The change in the ecological environment across the study area was partially reflected by indicators such as the agricultural output value, animal husbandry output value, and number of main livestock stocks. For the relative lag in agricultural technology, the ir-rational use of land resources, such as the rapid reclamation of farmland and overgrazing, will destroy the original surface vegetation growth environment, yielding the degradation of vegetation and expansion of desertification.
The exploitation of coal resources is the most important driving force for the development and change in desertification at the Ningdong coal base. The large-scale exploitation of mineral resources destroys the stress balance in the rock strata above the goaf, resulting in movement and fracture. This causes surface subsidence in the mining area, destroys the original soil structure, and changes the soil void ratio. Discontinuous deformation, such as ground fissures, accelerates the evaporation rate of soil moisture and reduces water retention in the surface soil [91]. Soil erosion accelerates the generation and development of surface desertification [92]. The expansion of the resource exploitation scale can increase indicators such as the personnel density, transportation volume, and waste emissions in the mining area. The deterioration of desertification will intensify when the damage exceeds the bearing capacity of the environment itself.
Figure 15 shows the changes in the proportions of the desertification types in the mining area after large-scale coal mining at the Ningdong coal base from 2007–2021. From 2007–2014, the desertification status of the mining area at the Ningdong coal base deteriorated continuously. The proportion of moderate and light desertification increased yearly while nondesertification land decreased yearly. Desertification in mining areas improved from 2014–2017. The proportions of severe, moderate, and light desertification land decreased to 2.4, 10.5, and 32.6%, respectively, while the proportion of nondesertification land increased to 52.6%. From 2017–2021, the desertification situation in the mining areas deteriorated again. Figure 16 shows that the number of large- and medium-sized mining enterprises, number of industrial personnel, annual coal production, and total industrial output value at the base continued increasing from 2007–2014, trended downward from 2014–2017, and increased again from 2017–2021. In summary, the change in desertification in the mining areas was consistent with the number of mining enterprises, number of employees, and annual coal and industrial output, and were all positively correlated. This shows that the exploitation of mineral resources had a strong driving effect on the development of land desertification at the Ningdong coal base. The increase in the intensity of mineral exploitation has aggravated the degree of desertification at the Ningdong coal base.

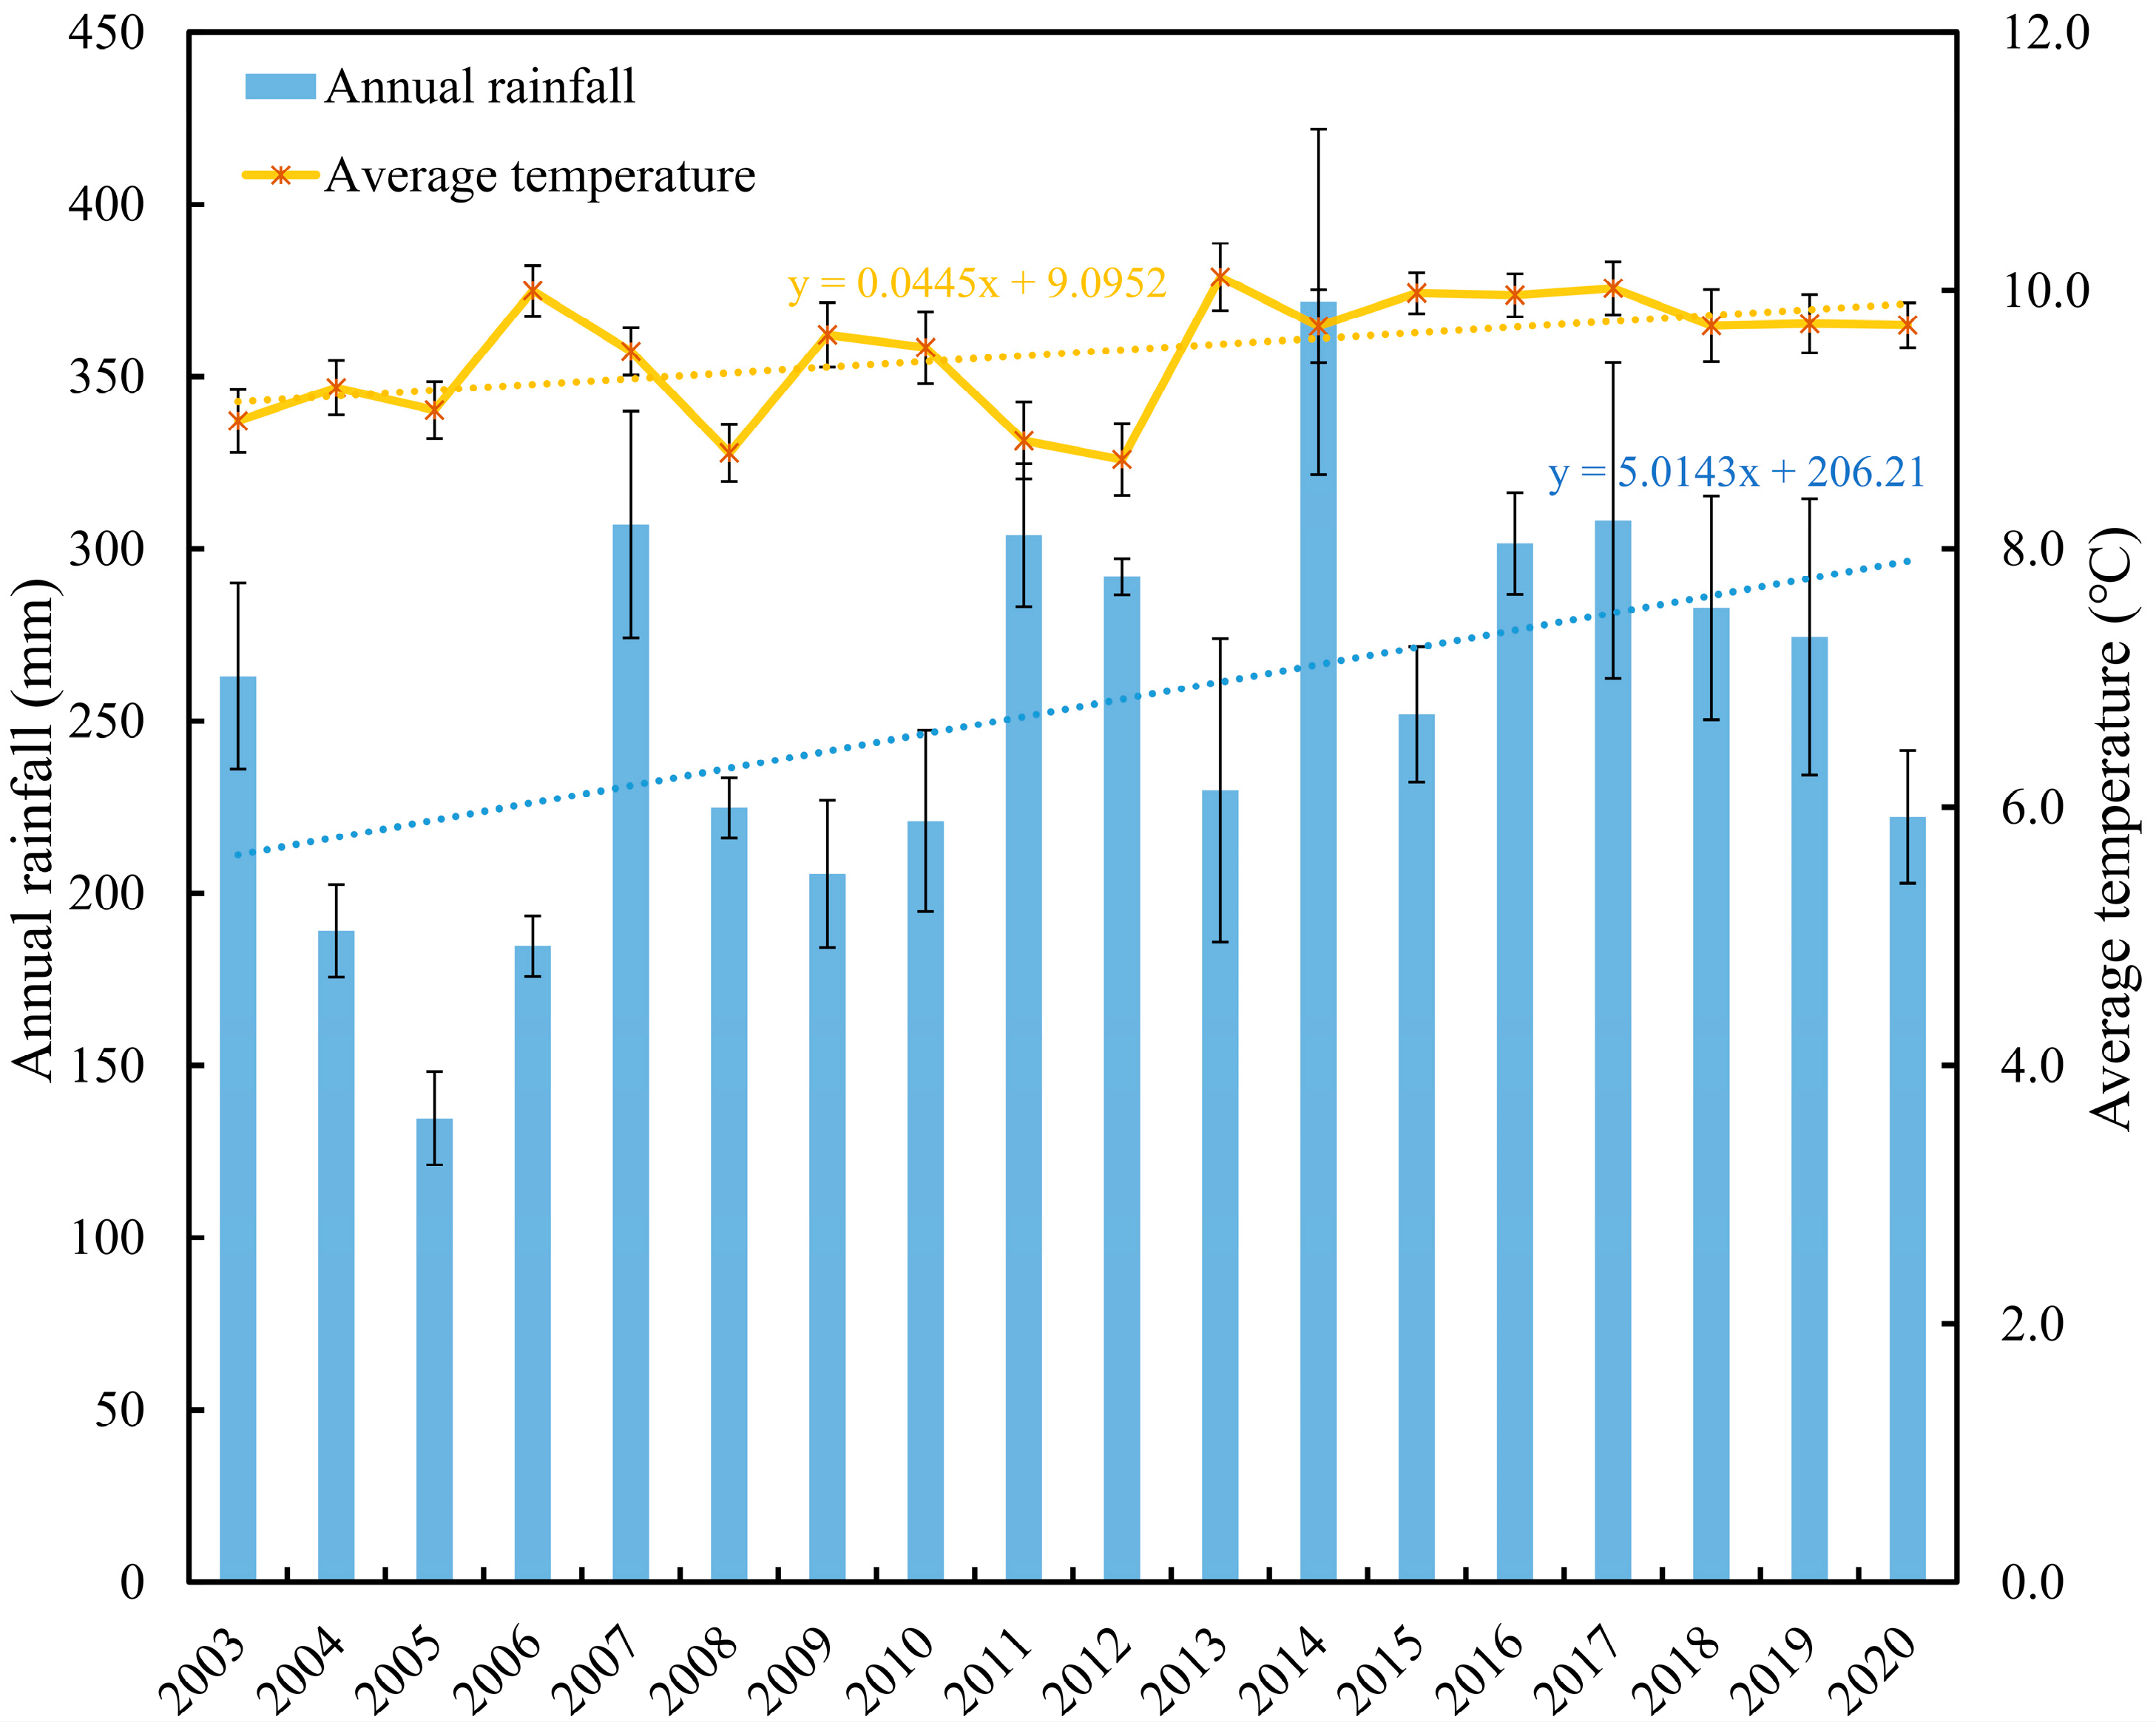
3.7.2. Natural Factors

Annual rainfall had the largest load on the third principal component, indicating that it was closely related to desertification at the Ningdong coal base. Rainfall drives the development of desertification by affecting vegetation growth. An abnormal reduction in rainfall can cause the disappearance of vegetation over a large area and aggravate the degree of land desertification. Figure 17 shows the average annual temperature and precipitation at the Ningdong coal base from 2003–2020. From 2004–2006, the rainfall decreased abnormally, then increased, and reached a peak in 2014. Annual rainfall first increased and then decreased from 2015–2020. The average temperature in the mining area fluctuated from 8.5–10.2 °C. Before 2013, the average temperature changed significantly. Rainfall showed a notable correlation with desertification at the Ningdong coal base, but the temperature did not have any notable relationship with it.

3.7.3. Synergy of Human Activities and Natural Factors

Farmland reclamation, livestock storage and grazing, mineral exploitation, rainfall changes, and other factors affect the ecological structure of surface vegetation, which leads to the intensification and improvement in desertification. The pixel dichotomy model was used to estimate the FVC of the Ningdong coal base. According to the unique ecological characteristics of vegetation in the mining area, the FVC was divided into five grades: very low, low, moderate, moderately high, and high. The combined influence of human and natural factors was examined to understand the evolution of vegetation cover and its driving effect on desertification land changes at the Ningdong coal base.
Figure 18 shows the proportion of the FVC area at all levels at the Ningdong coal base from 2003–2021. The results showed that the vegetation condition in 2003 was superior, with the highest proportion of moderately high and high coverage vegetation areas. In 2005, the vegetation situation deteriorated seriously; the proportion of very low and low coverage vegetation areas reached 83.23%. From 2007–2017, the vegetation condition improved and tended to be stable, mainly concentrated in low and middle coverage areas. The vegetation condition deteriorated in 2021; the degree of deterioration was similar to 2005. However, the proportion of high coverage vegetation was higher than that in 2005. Based on the UAV image, this area was mainly derived from cultivated land. The vegetation status was negatively correlated with desertification. Good vegetation conditions played an important role in preventing desertification.

4. Discussion

4.1. Practicability of Different Machine Learning Algorithms in Desertification Monitoring

In practical applications, we not only require the algorithm model to have high accuracy, but also hope that the model has a strong anti-interference ability. It is not easily affected by factors such as noise variables, feature correlations, etc. RF and SVM algorithms are commonly used in remote sensing monitoring research, and their good performance has been verified in many studies [25,61,93,94]. They also showed a good recognition effect in this study. In addition, we found that the two boosting algorithms, GBM and AB, are also very useful in desertification monitoring. Like random forest, boosting algorithm is also based on the idea of ensemble learning. The difference is that random forest tries to make decision trees ir-relevant, while boosting algorithm uses each weak learner to make up for the shortcomings of all previous learners. They are accurate, insensitive to noise variables and feature correlation, and have stable performance. The accuracy of KNN decreases significantly when there are noise variables. This is because KNN does not consider response variables in classification, which makes it vulnerable to noise variables [95]. Therefore, when using KNN for desertification monitoring, it is necessary to filter out the noise variables in the dataset. Contrary to KNN, CART considers the influence of eigenvectors on response variables when dividing regions, and only uses one splitting variable at a time [68]. Therefore, CART is suitable for high-dimensional space and is not susceptible to noise variables. This also explains why CART has similar effects on three different feature combinations. It is worth mentioning that RF, AB, GBM, and ET are all ensemble algorithms based on CART, so they have good anti-interference. SVM, MLR, LDA, and QDA are all algorithms based on geometric principles, but the stability of SVM in desertification monitoring is much better than that of the latter three. This may be because SVM is usually determined by only a few support vectors, so it is less affected by noise variables. MLR, LDA, QDA, and NB have a poor recognition effect, and their stability is easily affected by data quality and type, so they are not very suitable for desertification monitoring. In addition, the feature combinations used by different algorithms are not necessarily the same when the accuracy of desertification identification is the highest, indicating that the selection of features needs to adapt to the algorithm, rather than assuming the more the better or the less the better. Therefore, the importance of feature selection is self-evident, especially when the amount of data is huge.

4.2. Driving Mechanism of Desertification in Ningdong

Land desertification is a complex process affected by both natural factors and human activities. It is not rigorous to judge the driving causes of desertification regardless of research scale and regional characteristics [96]. Ningdong coal base is located in the arid and semiarid region of northwestern China, which is a typical ecologically fragile area. Abnormal changes in natural conditions and human activities are the most rapid and direct causes of desertified land changes in this region. The average precipitation in Ningxia dropped to 199 mm in 2005, which is 31% lower than the average of many years, and it experiences a dry season once in a decade [97,98]. The vegetation growth was seriously degraded, and the desertification was deteriorated. At this time, the catastrophic drought was the main reason for the serious deterioration of the desertification in East Ningdong. Around 2007, with the government‘s policy of closing hills and prohibiting grazing in an effort to return farmland to forest, the cultivated land area decreased, the forest land area increased, and the ecological environment of the base improved. After 2010, Ningdong coal base began large-scale coal mining activities. Mining is one of the engineering activities that has the strongest impact on the geological environment, and its negative impact on desertification in mining areas is very large: mineral exploitation directly destroys the original topography and biological communities in the mining area, resulting in serious degradation of surface ecosystems; deep mining will also change the aquifer and destroy groundwater resources, resulting in vegetation degradation; a large number of industrial wastes generated in mining development are piled up around the mining area, forming a large number of coal gangue piles and dumps; a large amount of sand and dust spreads under the action of wind, which adversely affects the surrounding ecological environment; and the growth of industrial personnel density, traffic volume, mine construction, and road construction will all have a negative impact on the surrounding environment. Although the government has implemented a number of ecological protection and restoration projects in mining areas and enacted relevant environmental protection policies, the status of desertification in the base remains tense due to the weak ecological resilience of the base itself and the impact of mineral resources’ exploitation and related industries. Clearly grasping the driving mechanism of desertification is the key to control and prevent desertification in the base, which should be paid enough attention to.

4.3. Recommendations for Desertification Control

Lucid waters and lush mountains are invaluable assets. While human beings demand infinitely from nature, they should respect, protect, and comply with nature to achieve co-ordinated and sustainable development of social economy and ecological environment. Ningdong coal base is located in the fragile ecological area of the arid and semiarid zone in the northwest. The situation of desertification control is very serious. Future governance and restoration can be carried out from the following aspects:
(1)
The ecological protection and engineering of mining areas should be carried out in depth, and the restoration and management of abandoned industrial and mining land should be strengthened. An artificial wind break and sand fixation forest shouldbe established at the boundary of the mining area to prevent the desertification land from spreading to the surrounding areas. Protecting the existing vegetation and cultivating new vegetation for wind prevention and sand fixation should be focused on. On the premise of improving soil texture, increasing the content of organic matter in desertification land, improving the fertility of desertification land, and enhancing the environmental carrying capacity of mining areas should be considered.
(2)
Mineral enterprises should reasonably arrange the mining, production, and business activities of mineral resources and control the intensity of mineral exploitation. They should also further optimize the resource mining technology to minimize the negative impact of mining activities on the ecological environment.
(3)
A monitoring and early warning program for desertification in mining areas should be built. A supervision and monitoring system is formed by means of administrative supervision, remote sensing monitoring, etc., combined with technologies such as big data and cloud platforms. At the same time, reasonable early warning programs should be set up to prevent desertification from aggravating.
(4)
The government should establish a sound legal guarantee system to ensure the smooth implementation of ecological projects in the form of legislation. Law enforcement departments should improve the legal monitoring system, strengthen law enforcement, and severely crack down on activities such as deforestation, reclamation, and illegal exploitation. Law popularization departments should strengthen legal publicity and enhance public legal awareness to prevent land desertification caused by human factors.

4.4. Shortcomings and Prospects of Research

This paper explored the performance of different machine learning algorithms in the field of remote sensing monitoring of desertification, and extracted the desertification information of Ningdong coal base for many years. We had achieved good results. However, there are still some deficiencies in this paper, which need to be further improved:
(1)
This study only used the spectral and textural information generated by satellite images to establish a dataset, without considering the impact of soil, meteorology, and other factors. In future research, multisource data can be used to improve the performance of desertification monitoring of machine learning models.
(2)
For long-term desertification monitoring, the machine learning model established only by the training samples of single-phase images is prone to overfitting when predicting and segmenting images in other years. Although this study selected training samples for each year, due to the lack of field survey data, it is easy to produce subjective misjudgment and affect the accuracy of the model only relying on Google Earth images and UAV images. In future research, it is worth looking forward to developing new methods to accurately discriminate wrong pixels in sample data.
(3)
When discussing the factors driving the desertification process in Ningdong, we only discussed the corresponding relationship between the desertification status and each factor in the time dimension, and lacked the mapping verification in the space dimension. In future research, it is necessary to use buffer zone analysis and other technologies to discuss the driving causes of desertification in different areas of the mining area.
(4)
In this paper, ENVI, QGIS, Python, and other tools were used in the whole monitoring process. The workflow was scattered and the time complexity was high, which was not conducive to large-scale desertification monitoring. In future research, it is of great significance for desertification control to establish a comprehensive remote sensing monitoring platform with a unified process and simple operation to realize large-scale, long-time sequence, high-frequency, and high-precision desertification monitoring.

5. Conclusions

Combining quantitative remote sensing and machine learning, this paper discussed the performance of various machine learning models in desertification monitoring, and analyzed the spatial-temporal changes and driving factors of desertification land in Ningdong coal base over the last 19 years. The main conclusions are as follows:
(1)
Among the 11 algorithms, RF, SVM, GBM, and AB had good performances in desertification monitoring, with reliable and stable accuracy. RF was especially effective, and performed best in this study.
(2)
The results showed that in 2003–2017, the area of desertification land first increased rapidly, and then decreased slowly. In 2017–2021, the desertification situation deteriorated and a large number of nondesertified land turned into mild desertification land.
(3)
The driving analysis results showed that human economic activities, dominated by coal mining, played a major role in driving desertification in mining areas, and natural driving forces such as rainfall played a secondary role.
In future research, a comprehensive monitoring and evaluation system of cloud platforms based on machine learning, big data, and remote sensing should be established to control the desertification in mining areas comprehensively.

Author Contributions

Conceptualization, P.L. and P.C.; methodology, P.L.; software, P.C.; validation, W.D. and X.K.; formal analysis, P.C.; investigation, P.C. and J.S.; resources, G.W.; data curation, P.C. and S.Z.; writing—original draft preparation, P.C. and P.L.; writing—review and editing, P.L.; visualization, P.L.; supervision, P.L.; project administration, P.L.; funding acquisition, P.L. All authors have read and agreed to the published version of the manuscript.

Funding

This research was funded by the Fundamental Research Funds for the Central Universities (Grant Nos. 2022YQDC01, 2022YJSDC08), the Ecological-Smart Mines Joint Research Fund of the Natural Science Foundation of Hebei Province (Grant No. E2020402086), and the open funds of the State Key Laboratory of Coal Mining and Clean Utilization (Granted No. 2021-CMCU-KF014).

Institutional Review Board Statement

Not applicable.

Informed Consent Statement

Not applicable.

Data Availability Statement

Data gathered in this study are available from the corresponding author upon request.

Acknowledgments

The authors would like to acknowledge the open dataset of satellite images provided by the USGS and open survey data published by local Chinese governments, as well as the anonymous reviewers for their constructive comments and suggestions that improved the quality of this paper.

Conflicts of Interest

The authors declare no conflict of interest.

References

  1. Yan, C.Z.; Wang, T.; Han, Z.W.; Qie, Y.F. Surveying Sandy Deserts and Desertified Lands in North-western China by Remote Sensing. Int. J. Remote Sens. 2007, 28, 3603–3618. [Google Scholar] [CrossRef]
  2. Tu, Z.F.; Li, M.X.; Sun, T. The status and trend analysis of desertification and sandification. Forest Resour. Manag. 2016, 1, 13. [Google Scholar] [CrossRef]
  3. Chen, A.; Yang, X.; Xu, B.; Jin, Y.; Guo, J.; Xing, X.; Yang, D.; Wang, P.; Zhu, L. Monitoring the Spatiotemporal Dynamics of Aeolian Desertification Using Google Earth Engine. Remote Sens. 2021, 13, 1730. [Google Scholar] [CrossRef]
  4. Wang, Y.J. Research progress and prospect on ecological disturbance monitoring in mining area. Acta Geod. Cartogr. Sin. 2017, 46, 1705–1716. [Google Scholar] [CrossRef]
  5. Li, S.; Zheng, Y.; Luo, P.; Wang, X.; Li, H.; Lin, P. Desertification in Western Hainan Island, China (1959 to 2003). Land Degrad. Dev. 2007, 18, 473–485. [Google Scholar] [CrossRef]
  6. Zha, Y.; Gao, J.Q.; Ni, S.X.; Jiang, J.J.; Liu, Y.S. Application of Remote Sensing Technology on Desertification Dynamics: A Case Study in YuLin City, ShanXi Province. J. Desert Res. 1997, 13, 68–72. Available online: https://kns.cnki.net/kcms/detail/detail.aspx?dbcode=CJFD&dbname=CJFD9697&filename=ZGSS703.011&uniplatform=NZKPT&v=SAD4MTMWY4lQv_odtyw-NiDHpQca4cFbgmtGL444tMkwAesVOYG7_nzTFyzBsF_f (accessed on 13 February 2022).
  7. Xia, G.-S.; Wang, Z.; Xiong, C.; Zhang, L. Accurate Annotation of Remote Sensing Images via Active Spectral Clustering with Little Expert Knowledge. Remote Sens. 2015, 7, 15014–15045. [Google Scholar] [CrossRef] [Green Version]
  8. Zeng, Y.N.; Xiang, N.P.; Feng, Z.D.; Xu, H. Albedo–NDVI Space and Remote Sensing Synthesis Index Models for Desertification Monitoring. Sci. Geol. Sin. 2006, 26, 75–81. [Google Scholar]
  9. Ding, H.; Xingming, H. Spatiotemporal Change and Drivers Analysis of Desertification in the Arid Region of Northwest China Based on Geographic Detector. Environ. Chall. 2021, 4, 100082. [Google Scholar] [CrossRef]
  10. Guo, B.; Wei, C.; Yu, Y.; Liu, Y.; Li, J.; Meng, C.; Cai, Y. The Dominant Influencing Factors of Desertification Changes in the Source Region of Yellow River: Climate Change or Human Activity? Sci. Total Environ. 2022, 813, 152512. [Google Scholar] [CrossRef]
  11. Wen, Y.; Guo, B.; Zang, W.; Ge, D.; Luo, W.; Zhao, H. Desertification Detection Model in Naiman Banner Based on the Albedo-Modified Soil Adjusted Vegetation Index Feature Space Using the Landsat8 OLI Images. Geomat. Nat. Hazards Risk 2020, 11, 544–558. [Google Scholar] [CrossRef]
  12. Zheng, Y.; Han, J.; Huang, Y.; Fassnacht, S.R.; Xie, S.; Lv, E.; Chen, M. Vegetation Response to Climate Conditions Based on NDVI Simulations Using Stepwise Cluster Analysis for the Three-River Headwaters Region of China. Ecol. Indic. 2018, 92, 18–29. [Google Scholar] [CrossRef]
  13. Xu, D.; You, X.; Xia, C. Assessing the Spatial-Temporal Pattern and Evolution of Areas Sensitive to Land Desertification in North China. Ecol. Indic. 2019, 97, 150–158. [Google Scholar] [CrossRef]
  14. Sharma, L.K.; Raj, A.; Somawat, K. Spatio-Temporal Assessment of Environmentally Sensitive Areas (ESA) in The Thar Desert India, to Combat Desertification under UNCCD Framework. J. Arid. Environ. 2021, 194, 104609. [Google Scholar] [CrossRef]
  15. Abuzaid, A.S.; Abdelatif, A.D. Assessment of Desertification Using Modified MEDALUS Model in the North Nile Delta, Egypt. Geoderma 2022, 405, 115400. [Google Scholar] [CrossRef]
  16. Afzali, S.F.; Khanamani, A.; Maskooni, E.K.; Berndtsson, R. Quantitative Assessment of Environmental Sensitivity to Desertification Using the Modified MEDALUS Model in a Semiarid Area. Sustainability 2021, 13, 7817. [Google Scholar] [CrossRef]
  17. Cuo, L.; Zhang, Y.; Wu, Y.; Hou, M. Desertification Affecting the Tibetan Plateau between 1971–2015: Viewed from a Climate Perspective. Land Degrad. Dev. 2020, 31, 1956–1968. [Google Scholar] [CrossRef]
  18. Egidi, G.; Cividino, S.; Paris, E.; Palma, A.; Salvati, L.; Cudlin, P. Assessing the Impact of Multiple Drivers of Land Sensitivity to Desertification in a Mediterranean Country. Environ. Impact Assess. Rev. 2021, 89, 106594. [Google Scholar] [CrossRef]
  19. Hua, Y.C.; Li, Z.Y.; Gao, Z.H. Extraction of sand information using object-oriented segmentation combined with the decomposition of mixed pixels. Arid. Zone Res. 2020, 37, 1346–1352. [Google Scholar] [CrossRef]
  20. Bullock, E.L.; Woodcock, C.E.; Olofsson, P. Monitoring tropical forest degradation using spectral unmixing and Landsat time series analysis. Remote Sens. Environ. Interdiscip. J. 2020, 238, 110968. [Google Scholar] [CrossRef]
  21. Pu, J.; Zhao, X.; Dong, P.; Wang, Q.; Yue, Q. Extracting Information on Rocky Desertification from Satellite Images: A Comparative Study. Remote Sens. 2021, 13, 13. [Google Scholar] [CrossRef]
  22. Xiao, X.W.; Shen, X.Y.; Ke, C.Q.; Zhou, X.H. Comparison of machine learning algorithms based on Sentinel-1A data to detect icebergs. Acta Geod. Cartogr. 2020, 49, 509–521. [Google Scholar] [CrossRef]
  23. Wu, Q.; Lane, C.R.; Li, X.; Zhao, K.; Zhou, Y.; Clinton, N.; DeVries, B.; Golden, H.E.; Lang, M.W. Integrating LiDAR Data and Multi-Temporal Aerial Imagery to Map Wetland Inundation Dynamics Using Google Earth Engine. Remote Sens. Environ. 2019, 228, 1–13. [Google Scholar] [CrossRef] [PubMed] [Green Version]
  24. Duan, H.; Wang, T.; Xue, X.; Yan, C. Dynamic Monitoring of Aeolian Desertification Based on Multiple Indicators in Horqin Sandy Land, China. Sci. Total Environ. 2019, 650, 2374–2388. [Google Scholar] [CrossRef] [PubMed]
  25. Fan, Z.; Li, S.; Fang, H. Explicitly Identifying the Desertification Change in CMREC Area Based on Multisource Remote Data. Remote Sens. 2020, 12, 3170. [Google Scholar] [CrossRef]
  26. Meng, X.; Gao, X.; Li, S.; Li, S.; Lei, J. Monitoring Desertification in Mongolia Based on Landsat Images and Google Earth Engine from 1990 to 2020. Ecol. Indic. 2021, 129, 107908. [Google Scholar] [CrossRef]
  27. Zhan, Q.; Zhao, W.; Yang, M.; Xiong, D. A Long-Term Record (1995–2019) of the Dynamics of Land Desertification in the Middle Reaches of Yarlung Zangbo River Basin Derived from Landsat Data. Geogr. Sustain. 2021, 2, 12–21. [Google Scholar] [CrossRef]
  28. Li, J.; Li, Z.; Dong, S.; Wei, M.; Zhou, J. Spatial and Temporal Changes in Vegetation and Desertification (1982–2018) and Their Responses to Climate Change in the Ulan Buh Desert, Northwest China. Theor. Appl. Climatol. 2021, 143, 1643–1654. [Google Scholar] [CrossRef]
  29. Lu, L.L.; Jie, Y.W.; Huang, X.J.; Zhang, X.X.; Li, R.Y. Desertification Information Extraction Method Research based on the CART Decision Tree Classification. Remote Sens. Technol. Appl. 2017, 32, 499–506. [Google Scholar] [CrossRef]
  30. Gou, F.; Liang, W.; Sun, S.; Jin, Z.; Zhang, W.; Yan, J. Analysis of the Desertification Dynamics of Sandy Lands in Northern China over the Period 2000–2017. Geocarto Int. 2021, 36, 1938–1959. [Google Scholar] [CrossRef]
  31. Zhou, H.; Fu, L.; Sharma, R.P.; Lei, Y.; Guo, J. A Hybrid Approach of Combining Random Forest with Texture Analysis and VDVI for Desert Vegetation Mapping Based on UAV RGB Data. Remote Sens. 2021, 13, 1891. [Google Scholar] [CrossRef]
  32. Yu, W.; Cui, J.; Gao, Y.; Zhu, M.; Shao, L.; Shen, Y.; Zhang, X.; Guo, C.; Zhang, H. Evolution of Desertification Types on the North Shore of Qinghai Lake. Comput. Mater. Contin. 2022, 71, 3635–3646. [Google Scholar] [CrossRef]
  33. Zheng, W.D. Analysis of Dynamic Changes of Vegetation Coverage and Driving Factors in Lingwu City, Ningxia. Master’s Thesis, Inner Mongolia Agricultural University, Hohhot, China, 2020. [Google Scholar]
  34. Ke, H.L.; Xu, Y.L.; Zhang, J.H.; Qiao, G.; Chen, Q.H.; Yang, M.; He, F. Quality evaluation of soil based on the ecological reconstruction in Ningdong coal base. Geol. Bull. China 2018, 37, 2208–2214. [Google Scholar]
  35. Dwyer, J.L.; Roy, D.P.; Sauer, B.; Jenkerson, C.B.; Zhang, H.K.; Lymburner, L. Analysis Ready Data: Enabling Analysis of the Landsat Archive. Remote Sens. 2018, 10, 1363. [Google Scholar] [CrossRef]
  36. Xu, S.Q. A Study on Information Extraction of Water Body with the Modified Nomalized Difference Water Index (MNDWI). Natl. Remote Sens. Bull. 2005, 589–595. [Google Scholar]
  37. Bhaga, T.D.; Dube, T.; Shekede, M.D.; Shoko, C. Impacts of Climate Variability and Drought on Surface Water Resources in Sub-Saharan Africa Using Remote Sensing: A Review. Remote Sens. 2020, 12, 4184. [Google Scholar] [CrossRef]
  38. Wu, Z.J.; Zhao, S.H. A Study of Enhanced Index-based Built-up Index Based on Landsat TM Imagery. Remote Sens. Nat. Resour. 2012, 24, 50–55. [Google Scholar] [CrossRef]
  39. Qiu, S.; Zhu, Z.; He, B. Fmask 4.0: Improved Cloud and Cloud Shadow Detection in Landsats 4–8 and Sentinel-2 Imagery. Remote Sens. Environ. 2019, 231, 111205. [Google Scholar] [CrossRef]
  40. Zhu, Z.; Woodcock, C.E. Automated Cloud, Cloud Shadow, and Snow Detection in Multitemporal Landsat Data: An Algorithm Designed Specifically for Monitoring Land Cover Change. Remote Sens. Environ. 2014, 152, 217–234. [Google Scholar] [CrossRef]
  41. Wei, W.; Guo, Z.; Shi, P.; Zhou, L.; Wang, X.; Li, Z.; Pang, S.; Xie, B. Spatiotemporal Changes of Land Desertification Sensitivity in Northwest China from 2000 to 2017. J. Geogr. Sci. 2021, 31, 46–68. [Google Scholar] [CrossRef]
  42. Han, J.; Wang, J.; Chen, L.; Xiang, J.; Ling, Z.; Li, Q.; Wang, E. Driving Factors of Desertification in Qaidam Basin, China: An 18-Year Analysis Using the Geographic Detector Model. Ecol. Indic. 2021, 124, 107404. [Google Scholar] [CrossRef]
  43. Zhu, Z.D.; Liu, L. The concept of desertification and the differentiation its development. J. Desert Res. 1984, 4, 6–12. [Google Scholar]
  44. Gao, S.W.; Wang, B.F.; Zhu, L.Y.; Wang, J.H.; Zhang, Y.G. Monitoring and evaluation indicator system on sandy desertification of China. Sci. Silvae Sin. 1998, 34, 3–12. [Google Scholar] [CrossRef]
  45. Zhou, Z.H. Machine Learning; Tsinghua University Press: Beijing, China, 2016; pp. 25–26. ISBN 978-7-302-42328-7. [Google Scholar]
  46. Chen, A.; Yang, X.; Guo, J.; Xing, X.; Yang, D.; Xu, B. Synthesized Remote Sensing-Based Desertification Index Reveals Ecological Restoration and Its Driving Forces in the Northern Sand-Prevention Belt of China. Ecol. Indic. 2021, 131, 108230. [Google Scholar] [CrossRef]
  47. Xiao, J.; Shen, Y.; Tateishi, R.; Bayaer, W. Development of Topsoil Grain Size Index for Monitoring Desertification in Arid Land Using Remote Sensing. Int. J. Remote Sens. 2006, 27, 2411–2422. [Google Scholar] [CrossRef]
  48. Rasmussen, K.; Fog, B.; Madsen, J.E. Desertification in Reverse? Observations from Northern Burkina Faso. Glob. Environ. Chang. 2001, 11, 271–282. [Google Scholar] [CrossRef]
  49. Yu, X.; Zhuo, Y.; Liu, H.; Wang, Q.; Wen, L.; Li, Z.; Liang, C.; Wang, L. Degree of Desertification Based on Normalized Landscape Index of Sandy Lands in Inner Mongolia, China. Glob. Ecol. Conserv. 2020, 23, e01132. [Google Scholar] [CrossRef]
  50. Akbari, M.; Shalamzari, M.J.; Memarian, H.; Gholami, A. Monitoring Desertification Processes Using Ecological Indicators and Providing Management Programs in Arid Regions of Iran. Ecol. Indic. 2020, 111, 106011. [Google Scholar] [CrossRef]
  51. Mao, L.J.; Li, M.S. Sentinel active and passive data to map land cover in a national park from GEE platform. Geom. Inf. Sci. Wuhan Univ. 2021. [Google Scholar] [CrossRef]
  52. Ma, Z.Y. Quantitative Method for Extracting of Desertification Information Based on TM Image. Master’s Thesis, Lanzhou University, Lanzhou, China, 2013. [Google Scholar]
  53. Crist, E.P.; Cicone, R.C. Comparisons of the Dimensionality and Features of Simulated Landsat-4 MSS and TM Data. Remote Sens. Environ. 1984, 14, 235–246. [Google Scholar] [CrossRef]
  54. Baig, M.H.A.; Zhang, L.; Shuai, T.; Tong, Q. Derivation of a Tasselled Cap Transformation Based on Landsat 8 At-Satellite Reflectance. Remote Sens. Lett. 2014, 5, 423–431. [Google Scholar] [CrossRef]
  55. Bo, H.; Ma, F.L.; Jiao, L.C. Research on computation of GLCM. ACTA Electron. Sin. 2006, 34, 155–158. [Google Scholar] [CrossRef]
  56. Iqbal, N.; Mumtaz, R.; Shafi, U.; Zaidi, S.M.H. Gray Level Co-Occurrence Matrix (GLCM) Texture Based Crop Classification Using Low Altitude Remote Sensing Platforms. PeerJ Comput. Sci. 2021, 7, e536. [Google Scholar] [CrossRef] [PubMed]
  57. Benco, M.; Hudec, R.; Kamencay, P.; Zachariasova, M.; Matuska, S. An Advanced Approach to Extraction of Colour Texture Features Based on GLCM. Int. J. Adv. Robot. Syst. 2014, 11, 104. [Google Scholar] [CrossRef]
  58. Zhang, Y.H.; Ding, W.; He, J.; Hua, Z.J. Risk analysis of hazard-pregnant environment in Brahmaputra based on XGBoost. J. Yangtze River Sci. Res. Inst. 2020. [Google Scholar] [CrossRef]
  59. Jin, Y.J. Imputation Adjustment Method for Missing Data. J. Appl. Stat. Manag. 2001, 20, 47–53. [Google Scholar] [CrossRef]
  60. Deng, J.X.; Shan, L.B.; He, D.Q.; Tang, R. Processing method of missing data and its developing tendency. Stat. Decis. 2019, 35, 28–34. [Google Scholar] [CrossRef]
  61. Belgiu, M.; Drăguţ, L. Random Forest in Remote Sensing: A Review of Applications and Future Directions. ISPRS J. Photogramm. Remote Sens. 2016, 114, 24–31. [Google Scholar] [CrossRef]
  62. Genuer, R.; Poggi, J.-M.; Tuleau-Malot, C. Variable Selection Using Random Forests. Pattern Recognit. Lett. 2010, 31, 2225–2236. [Google Scholar] [CrossRef] [Green Version]
  63. Chen, P.; Li, F.; Wu, C. Research on Intrusion Detection Method Based on Pearson Correlation Coefficient Feature Selection Algorithm. J. Phys. Conf. Ser. 2021, 1757, 012054. [Google Scholar] [CrossRef]
  64. Nafouanti, M.B.; Li, J.; Mustapha, N.A.; Uwamungu, P.; AL-Alimi, D. Prediction on the Fluoride Contamination in Groundwater at the Datong Basin, Northern China: Comparison of Random Forest, Logistic Regression and Artificial Neural Network. Appl. Geochem. 2021, 132, 105054. [Google Scholar] [CrossRef]
  65. Moon, S.-H.; Kim, Y.-H. An Improved Forecast of Precipitation Type Using Correlation-Based Feature Selection and Multinomial Logistic Regression. Atmos. Res. 2020, 240, 104928. [Google Scholar] [CrossRef]
  66. Izenman, A.J. Linear Discriminant Analysis. In Modern Multivariate Statistical Techniques; Springer: New York, NY, USA, 2013; pp. 237–280. [Google Scholar] [CrossRef]
  67. Tharwat, A. Linear vs. Quadratic Discriminant Analysis Classifier: A Tutorial. Int. J. Appl. Pattern Recognit. 2016, 3, 145–180. [Google Scholar] [CrossRef]
  68. Muller, R.; Möckel, M. Logistic Regression and CART in the Analysis of Multimarker Studies. Clin. Chim. Acta 2008, 394, 1–6. [Google Scholar] [CrossRef] [PubMed]
  69. Noble, W.S. What Is a Support Vector Machine? Nat. Biotechnol. 2006, 24, 1565–1567. [Google Scholar] [CrossRef]
  70. Soria, D.; Garibaldia, J.M.; Ambrogi, F.; Biganzoli, E.M.; Ellis, I.O. A ‘Non-Parametric’ Version of the Naive Bayes Classifier. Knowl. Based Syst. 2011, 24, 775–784. [Google Scholar] [CrossRef] [Green Version]
  71. Garg, R.; Kumar, A.; Prateek, M.; Pandey, K.; Kumar, S. Land Cover Classification of Spaceborne Multifrequency SAR and Optical Multispectral Data Using Machine Learning. Adv. Space Res. 2022, 69, 1726–1742. [Google Scholar] [CrossRef]
  72. Breiman, L. Random Forests. Mach. Learn. 2001, 45, 5–32. [Google Scholar] [CrossRef] [Green Version]
  73. Geurts, P.; Ernst, D.; Wehenkel, L. Extremely Randomized Trees. Mach. Learn. 2006, 63, 3–42. [Google Scholar] [CrossRef] [Green Version]
  74. Yoav, F.; Schapire, R.E. A Decision-Theoretic Generalization of On-Line Learning and an Application to Boosting. J. Comput. Syst. Sci. 1997, 55, 119–139. [Google Scholar] [CrossRef] [Green Version]
  75. Friedman, J.H. Greedy Function Approximation: A Gradient Boosting Machine. Ann. Stat. 2001, 29, 1189–1232. [Google Scholar] [CrossRef]
  76. Cekik, R.; Uysal, A.K. A Novel Filter Feature Selection Method Using Rough Set for Short Text Data. Expert Syst. Appl. 2020, 160, 113691. [Google Scholar] [CrossRef]
  77. Agarwal, S.; Graepel, T.; Herbrich, R.; Har-Peled, S.; Roth, D.; Jordan, M.I. Generalization Bounds for the Area Under the ROC Curve. J. Mach. Learn. Res. 2005, 6, 2005. [Google Scholar] [CrossRef]
  78. Wang, Y.Y.; Chen, S.C. A Survey of Evaluation and Design for AUC Based Classifier. Pattern Recognit. Artif. Intell. 2011, 24, 64–71. [Google Scholar] [CrossRef]
  79. Li, J.H.; Chen, Y.; Yang, G.J.; Zhou, L.H. The aeolian desertification process and driving mechanism of Minqin Oasis from 1975 to 2018. J. Desert Res. 2021, 41, 44–55. [Google Scholar] [CrossRef]
  80. Lin, H.; Jianjun, T.; Jianping, Y.; Chunhai, X.; Jiaxing, P.; Debin, L.; Zuolin, Y.; Wenyu, Z. Regional eco-efficiency evaluation and spatial pattern analysis of the Yangtze River Economic Zone. J. Geogr. Sci. 2020, 30, 1117–1139. [Google Scholar] [CrossRef]
  81. Na, R.; Du, H.; Na, L.; Shan, Y.; He, H.S.; Wu, Z.; Zong, S.; Yang, Y.; Huang, L. Spatiotemporal Changes in the Aeolian Desertification of Hulunbuir Grassland and Its Driving Factors in China during 1980–2015. Catena 2019, 182, 104123. [Google Scholar] [CrossRef]
  82. Xu, D.Y.; Kang, X.W.; Liu, Z.L.; Zhuang, D.F.; Pan, J.J. Assessment of the relative role of climate change and human activities in desertification: A review. J. Geogr. Sci. 2011, 21, 926–936. [Google Scholar] [CrossRef]
  83. Leprieur, C.; Verstraete, M.M.; Pinty, B. Evaluation of the Performance of Various Vegetation Indices to Retrieve Vegetation Cover from AVHRR Data. Remote Sens. Rev. 1994, 10, 265–284. [Google Scholar] [CrossRef]
  84. Zribi, M.; Le Hégarat-Mascle, S.; Taconet, O.; Ciarletti, V.; Vidal-Madjar, D.; Boussema, M.R. Derivation of Wild Vegetation Cover Density in Semi-Arid Regions: ERS2/SAR Evaluation. Int. J. Remote Sens. 2003, 24, 1335–1352. [Google Scholar] [CrossRef]
  85. Tong, S.; Zhang, J.; Ha, S.; Lai, Q.; Ma, Q. Dynamics of Fractional Vegetation Coverage and Its Relationship with Climate and Human Activities in Inner Mongolia, China. Remote Sens. 2016, 8, 776. [Google Scholar] [CrossRef] [Green Version]
  86. Li, M.M.; Wu, B.F.; Yan, C.Z.; Zhou, W.F. Estimation of vegetation fraction in the upper basin of Miyun reservoir by remote sensing. Resour. Sci. 2004, 26, 153–159. [Google Scholar] [CrossRef]
  87. He, H.; Tian, C.; Jin, G.; Han, K. Principal Component Analysis and Fisher Discriminant Analysis of Environmental and Ecological Quality, and the Impacts of Coal Mining in an Environmentally Sensitive Area. Environ. Monit. Assess. 2020, 192, 207. [Google Scholar] [CrossRef] [PubMed]
  88. Zhang, Q.; Cheng, J.; Liang, S. Deriving High-Quality Surface Emissivity Spectra from Atmospheric Infrared Sounder Data Using Cumulative Distribution Function Matching and Principal Component Analysis Regression. Remote Sens. Environ. 2018, 211, 388–399. [Google Scholar] [CrossRef]
  89. Ayyadevara, V.K. Gradient Boosting Machine. In Pro Machine Learning Algorithms; Apress: Berkeley, CA, USA, 2018; pp. 117–134. [Google Scholar] [CrossRef]
  90. Saritas, M.M.; Yasar, A. Performance Analysis of ANN and Naive Bayes Classification Algorithm for Data Classification. Int. J. Intell. Syst. Appl. Eng. 2019, 7, 88–91. [Google Scholar] [CrossRef] [Green Version]
  91. Liu, Y.; Lei, S.G.; Chen, X.Y.; Chen, M.; Yang, Y.M.; Li, X.H.; Zhang, X.Y.; Long, L.L.; Bian, Z.F. Temporal variation and driving factors of vegetation coverage in Shendong central mining area based on the perspective of guided restoration. J. China Coal Soc. 2021, 46, 3319–3331. [Google Scholar] [CrossRef]
  92. Liu, S.; Li, W.; Qiao, W.; Wang, Q.; Hu, Y.; Wang, Z. Effect of Natural Conditions and Mining Activities on Vegetation Variations in Arid and Semiarid Mining Regions. Ecol. Indic. 2019, 103, 331–345. [Google Scholar] [CrossRef]
  93. Fan, M.Z.; Li, S.B. Spatio-temporal pattern change of desertification and its driving factors analysisin China-Mongolia-Russia economic corridor. Acta Ecol. Sin. 2020, 40, 4252–4263. [Google Scholar] [CrossRef]
  94. Qian, C.; Qiang, H.; Wang, F.; Li, M. Optimization of Rocky Desertification Classification Model Based on Vegetation Type and Seasonal Characteristic. Remote Sens. 2021, 13, 2935. [Google Scholar] [CrossRef]
  95. Guo, G.; Wang, H.; Bell, D.; Bi, Y.; Greer, K. KNN Model-Based Approach in Classification. In Proceedings of the Move to Meaningful Internet Systems 2003: CoopIS, DOA, and ODBASE, Catania, Italy, 3–7 November 2003; Springer: Berlin/Heidelberg, Germany, 2003; pp. 986–996. [Google Scholar]
  96. Guo, Z.; Wei, W.; Shi, P.; Zhou, L.; Wang, X.; Li, Z.; Pang, S.; Xie, B. Spatiotemporal Changes of Land Desertification Sensitivity in the Arid Region of Northwest China. Dili XuebaoActa Geogr. Sin. 2020, 75, 1948–1965. [Google Scholar] [CrossRef]
  97. Yang, S.P.; Zhao, G.P.; Sun, Y.C.; Ma, L.W.; Su, Z.S.; Mu, J.H. Diagnosis Analysis on Extremely Drought Events in Ningxia during 2004–2005. J. Desert Res. 2006, 26, 948–952. [Google Scholar]
  98. Ningxia Water Resources Bulletin. 2005. Available online: http://slt.nx.gov.cn/xxgk_281/fdzdgknr/gbxx/szygb/202105/t20210507_2826056.html (accessed on 27 April 2022).
Figure 1. Location of Ningdong coal base and its mining area.
Sustainability 14 07470 g001
Figure 2. Flowchart for the monitoring of Ningdong densification.
Sustainability 14 07470 g002
Figure 3. Distribution of the training sample points.
Sustainability 14 07470 g003
Figure 4. Feature importance ranking.
Sustainability 14 07470 g004
Figure 5. Correlation coefficient matrix.
Sustainability 14 07470 g005
Figure 6. Comparison of the performance for desertification monitoring models: (a) accuracy, (b) Kappa, (c) Macro-F1, (d) AUC, and (e) training time.
Sustainability 14 07470 g006aSustainability 14 07470 g006b
Figure 7. Zoning maps of the different degrees of desertification at the Ningdong coal base from 2003 to 2021.
Sustainability 14 07470 g007
Figure 8. Area and proportion of each desertification type at the Ningdong coal base from 2003 to 2021.
Sustainability 14 07470 g008
Figure 9. Proportions of desertification types at different elevations at the Ningdong coal base.
Sustainability 14 07470 g009
Figure 10. Proportion of desertification types at different slopes in Ningdong coal base.
Sustainability 14 07470 g010
Figure 11. Proportions of desertification types along different slopes’ directions at the Ningdong coal base.
Sustainability 14 07470 g011
Figure 12. Migration of the desertification gravity center at Ningdong coal base from 2003 to 2021: (a) severe desertification, (b) moderate desertification, (c) light desertification, and (d) nondesertification.
Sustainability 14 07470 g012
Figure 13. Spatial distribution of the dynamic desertification change intensity at the Ningdong coal base from 2003 to 2021. Legend: (−3): severe degradation; (−2): moderate degradation; (−1) light degradation; (+3) light improvement; (+2): moderate improvement; and (+1) significant improvement.
Sustainability 14 07470 g013
Figure 14. Change intensity for desertification at the Ningdong coal base from 2003–2021. A positive value of change intensity indicates that the degree of desertification has improved, i.e., the larger the value, the greater the improvement. A negative change intensity indicates that the degree of desertification has deteriorated, i.e., the smaller the value, the greater the deterioration.
Sustainability 14 07470 g014
Figure 15. Proportional changes in the desertification types in the mining areas at the Ningdong coal base from 2007–2021.
Sustainability 14 07470 g015
Figure 16. Changes in the relevant indexes for coal-resource development at the Ningdong coal base from 2007–2020.
Sustainability 14 07470 g016
Figure 17. Statistics on the annual precipitation and average temperature at the Ningdong coal base from 2003–2020.
Sustainability 14 07470 g017
Figure 18. Change in the vegetation coverage areas for different grades at the Ningdong coal base from 2003–2021.
Sustainability 14 07470 g018
Table 1. Land desertification classification index.
Desertification TypeVegetation
Coverage (%)
Vegetation CharacteristicsImage Characteristics
Severe desertification≤10Desertification land occurs in a large area and vegetation disappears regionally. Sustainability 14 07470 i001
Moderate desertification10–30Desertification land is clearly visible with degraded plants and sand vegetation. Sustainability 14 07470 i002
Light desertification50–70Vegetation begins to decline; original vegetation growth has been affected; growth is not strong; sparse sand appears. Sustainability 14 07470 i003
Nondesertification≥70Vegetation grows normally without notable degradation. Negligible desertification. Sustainability 14 07470 i004
Table 2. Characteristic computational formulas.
Characteristic IndexComputational Formula
NDVI NDVI = ρ NIR ρ Red ρ NIR + ρ Red
MSAVI MSAVI = 2 ρ NIR + 1 2 ρ NIR + 1 2 8 ρ NIR ρ Red 2
SMMI SMMI = ρ NIR 2 + ρ Red 2 2
BSI BSI = ρ SWIR 1 + ρ Red ρ NIR + ρ Blue ρ SWIR 1 + ρ Red + ρ NIR + ρ Blue
TGSI TGSI = ρ Red ρ Blue ρ Red + ρ Blue + ρ Green
Albedo Albedo = 0.356 × ρ Blue + 0.13 × ρ Red + 0.373 × ρ NIR + 0.085 × ρ SWIR 1 + 0.072 × ρ SWIR 2 0.0018
Brightness Brightness Landsat   5 = 0.33183 × ρ Blue + 0.33121 × ρ Green + 0.55177 × ρ Red + 0.42514 × ρ NIR + 0.48087 × ρ SWIR 1 + 0.25252 × ρ SWIR 2
Brightness Landsat   8 = 0.3029 × ρ Blue + 0.2786 × ρ Green + 0.4733 × ρ Red + 0.5599 × ρ NIR + 0.508 × ρ SWIR 1 + 0.1872 × ρ SWIR 2
Greenness Greenness Landsat   5 = 0.24717 × ρ Blue 0.16263 × ρ Green reen 6239 × ρ Red + 0.85468 × ρ NIR + 0.05493 × ρ SWIR 1 0.11749 × ρ SWIR 2
Greenness Landsat   8 = 0.2941 × ρ Blue 0.243 × ρ Green 0.5424 × ρ Red + 0.7276 × ρ NIR + 0.0713 × ρ SWIR 1 0.1608 × ρ SWIR 2
Wetness Wetness Landsat   5 = 0.13929 × ρ Blue + 0.22490 × ρ Green + 0.40359 × ρ Red + 0.25178 × ρ NIR 0.70133 × ρ SWIR 1 0.45732 × ρ SWIR 2
Wetness Landsat   8 = 0.1511 × ρ Blue + 0.1973 × ρ Green + 0.3283 × ρ Red + 0.3407 × ρ NIR 0.7117 × ρ SWIR 1 0.4559 × ρ SWIR 2
Mean Mean = i j i × p i , j
Variance V a r i a n c e = i j i μ 2 p i , j , μ = M e a n
Homogeneity H o m o g e n e i t y = i j p i , j 1 + i j
Contrast Contrast = n n 2 i j p i , j , n = i j
Dissimilarity Dissimilarity = i j p i , j × i j
Entropy E n t r o p y = i j p i , j log p i , j
Angular Second Moment Angular   Second   Moment = i j p 2 i , j
Correlation Correlation = i j i j p i , j μ 1 μ 2 σ 1 σ 2 , μ = M e a n , σ = V a r i a n c e
Note: ρ Blue ,   ρ Green ,   ρ Red ,   ρ NIR ,   ρ SWIR 1 ,   and   ρ SWIR 2 correspond to blue, green, red, near infrared, short infrared 1, and short infrared 2 bands of the Landsat images, respectively. p i , j i , j = 0 ,   1 ,   2 ,   ,   L 1 :   GLCM; L: Image gray level; and   i , j : Pixel gray value.
Table 3. Details of feature combinations.
Feature CombinationFeature Variables
Combination 1MSAVI, BSI, Brightness, Mean, TGSI, Wetness
Combination 2NDVI, MSAVI, Albedo, SMMI, BSI, TGSI, Brightness, Greenness, Wetness, Mean
Combination 3NDVI, MSAVI, Albedo, SMMI, BSI, TGSI, Brightness, Greenness, Wetness, Contrast, Correlation, Dis-similarity, Entropy, Homogeneity, Mean, Second Moment Variance
Table 4. Change intensity level divisions.
Change IntensityType before ChangeType after Change
Significant improvementSevereNon
Moderate improvementSevereLight
ModerateNon
Light improvementSevereModerate
ModerateLight
LightNon
Light degradationNonLight
LightModerate
ModerateSevere
Moderate degradationNonModerate
LightSevere
Severe degradationNonSevere
Table 5. Classification index of the topographic elements at the Ningdong coal base.
GradeInterval
ElevationLevel 11175–1275 m
Level 21275–1375 m
Level 31375–1475 m
Level 41475–1575 m
Level 51575–1675 m
Level 61675–1775 m
AspectFlat−1
North0–22.5°, 337.5–360°
Northeast22.5–67.5°
East67.5–112.5°
Southeast112.5–157.5°
South157.5–202.5°
Southwest202.5–247.5°
West247.5–292.5°
Northwest292.5–337.5°
SlopeFlat0–5°
Gentle5–10°
Rolling10–15°
Moderately steep15–25°
Steep25–35°
Very steep35°
Table 6. Desertification land type transfer matrix from 2003 to 2021 (km2).
2003–20052005–20072007–20102010–20142014–20172017–2021
Severe–Moderate17.33230.9533.2477.9513.7113.65
Severe–Light5.51165.5835.7446.4529.8329.44
Severe–Non0.08103.6431.5322.4136.587.42
Moderate–Severe160.7338.7454.6329.2638.5443.49
Moderate–Light56.47391.51311.96220.45194.81157.75
Moderate–Non3.30234.8960.3850.44188.9823.92
Light–Severe214.9817.6225.6433.3828.11128.72
Light–Moderate394.97128.13158.87177.86175.29189.21
Light–Non20.65603.54282.31201.36661.1496.05
Non–Severe174.574.1428.9611.516.4459.95
Non–Moderate468.453.8295.8741.9835.46303.46
Non–Light910.9346.45349.01288.25144.38475.17
Total deterioration area2324.63238.89712.98582.24428.221200.00
Total reversal area103.331730.11755.16619.041125.05328.24
Total2427.971969.001468.141201.291553.271528.24
Table 7. Migration distance for the desertification gravity center at the Ningdong coal base from 2003 to 2021 (km).
Severe DesertificationModerate DesertificationLight DesertificationNondesertification
2003–20056.662.6010.316.83
2005–200722.119.2310.2010.23
2007–20103.851.1811.797.21
2010–201417.8210.9211.667.33
2014–201711.5210.4317.9614.60
2017–20213.532.732.509.33
Table 8. Principal component factor load matrix for the driving forces of desertification.
IndexesFirst Principal ComponentSecond Principal ComponentThird Principal Component
Annual rainfall (mm)0.1060.1370.982
Annual average temperature (°C)0.523−0.343−0.021
Number of mining enterprises−0.5130.733−0.104
Coal industry personnel−0.5820.711−0.043
Annual coal production (10,000 tons)0.5810.782−0.088
Total output value of coal industry (10,000 yuan)0.7300.6070.079
Total output value of agricultural (10,000 yuan)0.9770.0310.023
Total output of animal husbandry (10,000 yuan)0.955−0.027−0.053
Stock of main livestock (10,000)0.926−0.080−0.189
Traffic freight volume (10,000 tons)0.7950.411−0.032
Industrial wastewater discharge (10,000 tons)0.941−0.1600.138
Output of industrial solid waste (10,000 tons)0.956−0.052−0.082
Characteristic value6.9132.3651.057
Variance contribution rate (%)57.6119.718.81
Cumulative variance contribution rate (%)57.6177.3286.13
Publisher’s Note: MDPI stays neutral with regard to jurisdictional claims in published maps and institutional affiliations.

