Article

Protected Cultivation of Horticultural Crops as a Livelihood Opportunity in Western India: An Economic Assessment

by
Prakash Pachiyappan
1,
Pramod Kumar
2,
Krishna Viswanatha Reddy
3,*,
Kotamraju N. Ravi Kumar
4,
Srinivasa Konduru
5,
Venkatesh Paramesh
6,
Gandhamanagenahalli A. Rajanna
7,
Shashidhar K. Shankarappa
8,
Duraisamy Jaganathan
1,
Sheela Immanuel
1,
Ankush L. Kamble
9,
Raman Selvakumar
2,
Kingsly T. Immanuelraj
10,
Boopathy Raja Manogaran
11,
Anbukani Perumal
2,
Umamageswari Maruthanayagam
12 and
Sivalingam Niranjan
2
1
ICAR-Central Tuber Crops Research Institute, Thiruvananthapuram 695017, Kerala, India
2
ICAR-Indian Agricultural Research Institute, New Delhi 110012, India
3
ICAR-Central Tobacco Research Institute, Rajahmundry 533105, Andhra Pradesh, India
4
Department of Agricultural Economics, ANGRAU, Bapatla 522034, Andhra Pradesh, India
5
Department of Agri-Business, University of California, Fresno, CA 93740, USA
6
ICAR-Central Coastal Agricultural Research Institute, Goa Velha 403402, Goa, India
7
ICAR-Directorate of Groundnut Research, Junagadh 362001, Gujarat, India
8
Unit of Livestock Farm Complex, Faculty of Veterinary and Animal Sciences, Rajeev Gandhi South Campus, Institute of Agricultural Sciences, Banaras Hindu University, Varanasi 221005, Uttar Pradesh, India
9
ICAR-Central Institute of Fisheries Education, Mumbai 400061, Maharashtra, India
10
ICAR-National Institute of Agricultural Economics and Policy Research, New Delhi 110012, India
11
Department of Livestock Production Management, Veterinary College and Research Institute, Tamil Nadu Veterinary and Animal Sciences University, Chennai 600051, Tamil Nadu, India
12
Department of Agricultural Economics and Extension, Pandit Jawaharlal Nehru College of Agriculture and Research Institute, Karaikal 609603, Puducherry, India
*
Author to whom correspondence should be addressed.
Sustainability 2022, 14(12), 7430; https://doi.org/10.3390/su14127430
Submission received: 6 May 2022 / Revised: 8 June 2022 / Accepted: 13 June 2022 / Published: 17 June 2022
(This article belongs to the Special Issue Agrifood Production and Conservation Agriculture)

Abstract

:
Protected cultivation is an innovative way of raising seasonal and off-seasonal crops under a controlled environment. Vegetables and flower crops have tremendous potential to augment productivity, generate employment, utilize land efficiently and enhance export. This study was undertaken to assess the economic feasibility of protected cultivation in the high export potential zones of the Pune and Nasik districts of Maharashtra, India, by employing project analytical tools and the regression model. The results revealed that the cultivation of flowers and vegetables under protected cultivation was highly lucrative with high investment. The protected cultivation of rose and capsicum had higher cultivation cost (300%), gross return (250%) and net return (190%) as compared to open cultivation. Moreover, most of the crops grown in polyhouses are highly profitable at different discount rates (7%, 10% and 12%), whereas a few crops were rewarding under shade net condition with subsidies. Factors such as literacy (p < 0.05), income (p < 0.05), access to subsidy (p < 0.05) and the risk orientation index (p < 0.01) were found statistically significant in technology adoption. In the context of a changing climate and shrinking land resources, water scarcity, incidence of pests and diseases, an ever-increasing population, low productivity under open conditions and changes in consumer’s preference are the drivers for switching over to protected cultivation. In the recent past, protected cultivation has been gaining importance in different parts of the country, including Maharashtra. The policy implications are creating modern infrastructure, enhanced application of ICTs, maximum crop production with minimum utilization of land and institutional support to promote technology on a commercial scale.

1. Introduction

The impact of climate change has led to a rise in average temperatures, prolonged drought or excessive rainfall and the emergence of new pests and diseases, which have an adverse impact on agricultural production in Southeast and South Asia [1,2,3]. These adverse changes have put open field farming on bumpy roads while sustaining agricultural production. Therefore, to provide a favorable microclimate to crops, protected cultivation would be a feasible alternative, mitigating climate risk [4]. Protected cultivation is a hi- tech method of growing crops under a controlled environment and protection from adverse climatic conditions using innovative structures (polyhouses, nethouses, screen houses, tunnels) or protections (windbreaks, irrigation, mulches). Protected cultivation is more sustainable as the effect of climate is minimized as the environment is controlled and the inputs such as fertilizers, pesticides and water are utilized more efficiently than that of open methods of cultivation [5,6,7], and improved productivity with better quality ensures higher returns for the produce [8,9,10]. Protected cultivation lets farmers produce crops off season and fetch higher prices [11,12]. Protected cultivation can help in the reduction of greenhouse gas emissions and the overall environmental impact of food production [13]. Heating, artificial lighting, post-harvest transport, packaging and use of fertilizers under hi-tech greenhouses are a major environmental concern [13,14,15]. The productivity obtained under protected cultivation was three to five times higher than open methods of cultivation depending on the crops [16,17]. Further, it was revealed that in vegetables and flowers, the protected cultivation was a very lucrative venture [11,18]. Nevertheless, results of the study showed that the incentive schemes, such as subsidies, has to provide to boost maximum farmers to embrace protected cultivation, and finance and marketing support has to be extended to aid in better quality input supply and to realize maximum earnings for farm produce [19]. Yet, protected cultivation in India is at a very nascent stage with only 0.2 percent penetration, which is very low as compared to Netherlands, Turkey and Israel. In India, the advent of protected cultivation technology emerged in the early nineties. The liberalization of industrial and trade policy paved the way for the development of export-oriented cut flowers. Subsequently, the programmes and incentives of the central and state governments have led to a substantial increase in the area under protected cultivation in India. It was estimated that about 2.15 lakh hectare of land was brought under the National Horticulture Mission (NHM) between 2005–06 and 2017–18 [20]. At present, India is the predominant producer of fruits and vegetables in the world, accounting for 10.49% of global fruit production and 11.15% of global vegetable production [21]. The major states adopting the protected cultivation technologies are Chhattisgarh, Odisha, Andhra Pradesh, Gujarat, Madhya Pradesh and Maharashtra.
Maharashtra is one of the leading states in area under protected cultivation. The Central and state governments implement several schemes and programmes to promote and develop protected cultivation. Under various schemes, the National Horticulture Mission (NHM) is the major scheme which is taken up by the farmers. It provides a 50% subsidy for establishing protected cultivation structures and a 50% subsidy for planting materials of flowers and vegetables grown under protected cultivation [22]. Apart from this, Maharashtra Industrial Development Corporation (MIDC) has established a floriculture park at Talegaon, Pune. The Indian Council of Agricultural Research (ICAR) under the Ministry of Agriculture and Farmers Welfare set up the ICAR-National Research Centre for Grapes, Directorate of Onion and Garlic Research, the ICAR-Directorate of Floricultural Research and the ICAR-National Research Centre on Pomegranate. In addition, extension services were created for the hand holding of stakeholders and undertaking research on different crops grown in the region. Pune district has been identified as an Agri Export Zone (AEZ) for floriculture, and the state agricultural marketing board has established the Horticulture Training Centre at Talegaon Dabhade [23]. At this centre, training is provided to farmers regarding green/poly house management, with a special focus on floriculture. Moreover, numerous public and private nurseries were established for meeting the planting materials requirements both for protected and open field conditions. All these efforts were targeted to increase the profitability of the protected cultivation technology and ultimately the income of the farmers. Despite its importance, there is hardly any study that analyses the economic feasibility of protected cultivation of horticultural crops in Maharashtra, India. This paper is an attempt to fill in this research gap and a few studies found in the Maharashtra state to address the economics of protected cultivation and constraints in adoption [4,24,25]. With this background, the research study was conducted in the Pune and Nasik districts of Maharashtra with the following objectives: (i) to estimate the economics of protected cultivation of horticultural crops, (ii) to assess the economic viability of protected cultivation and (iii) to identify the determinants for adoption of protected cultivation.

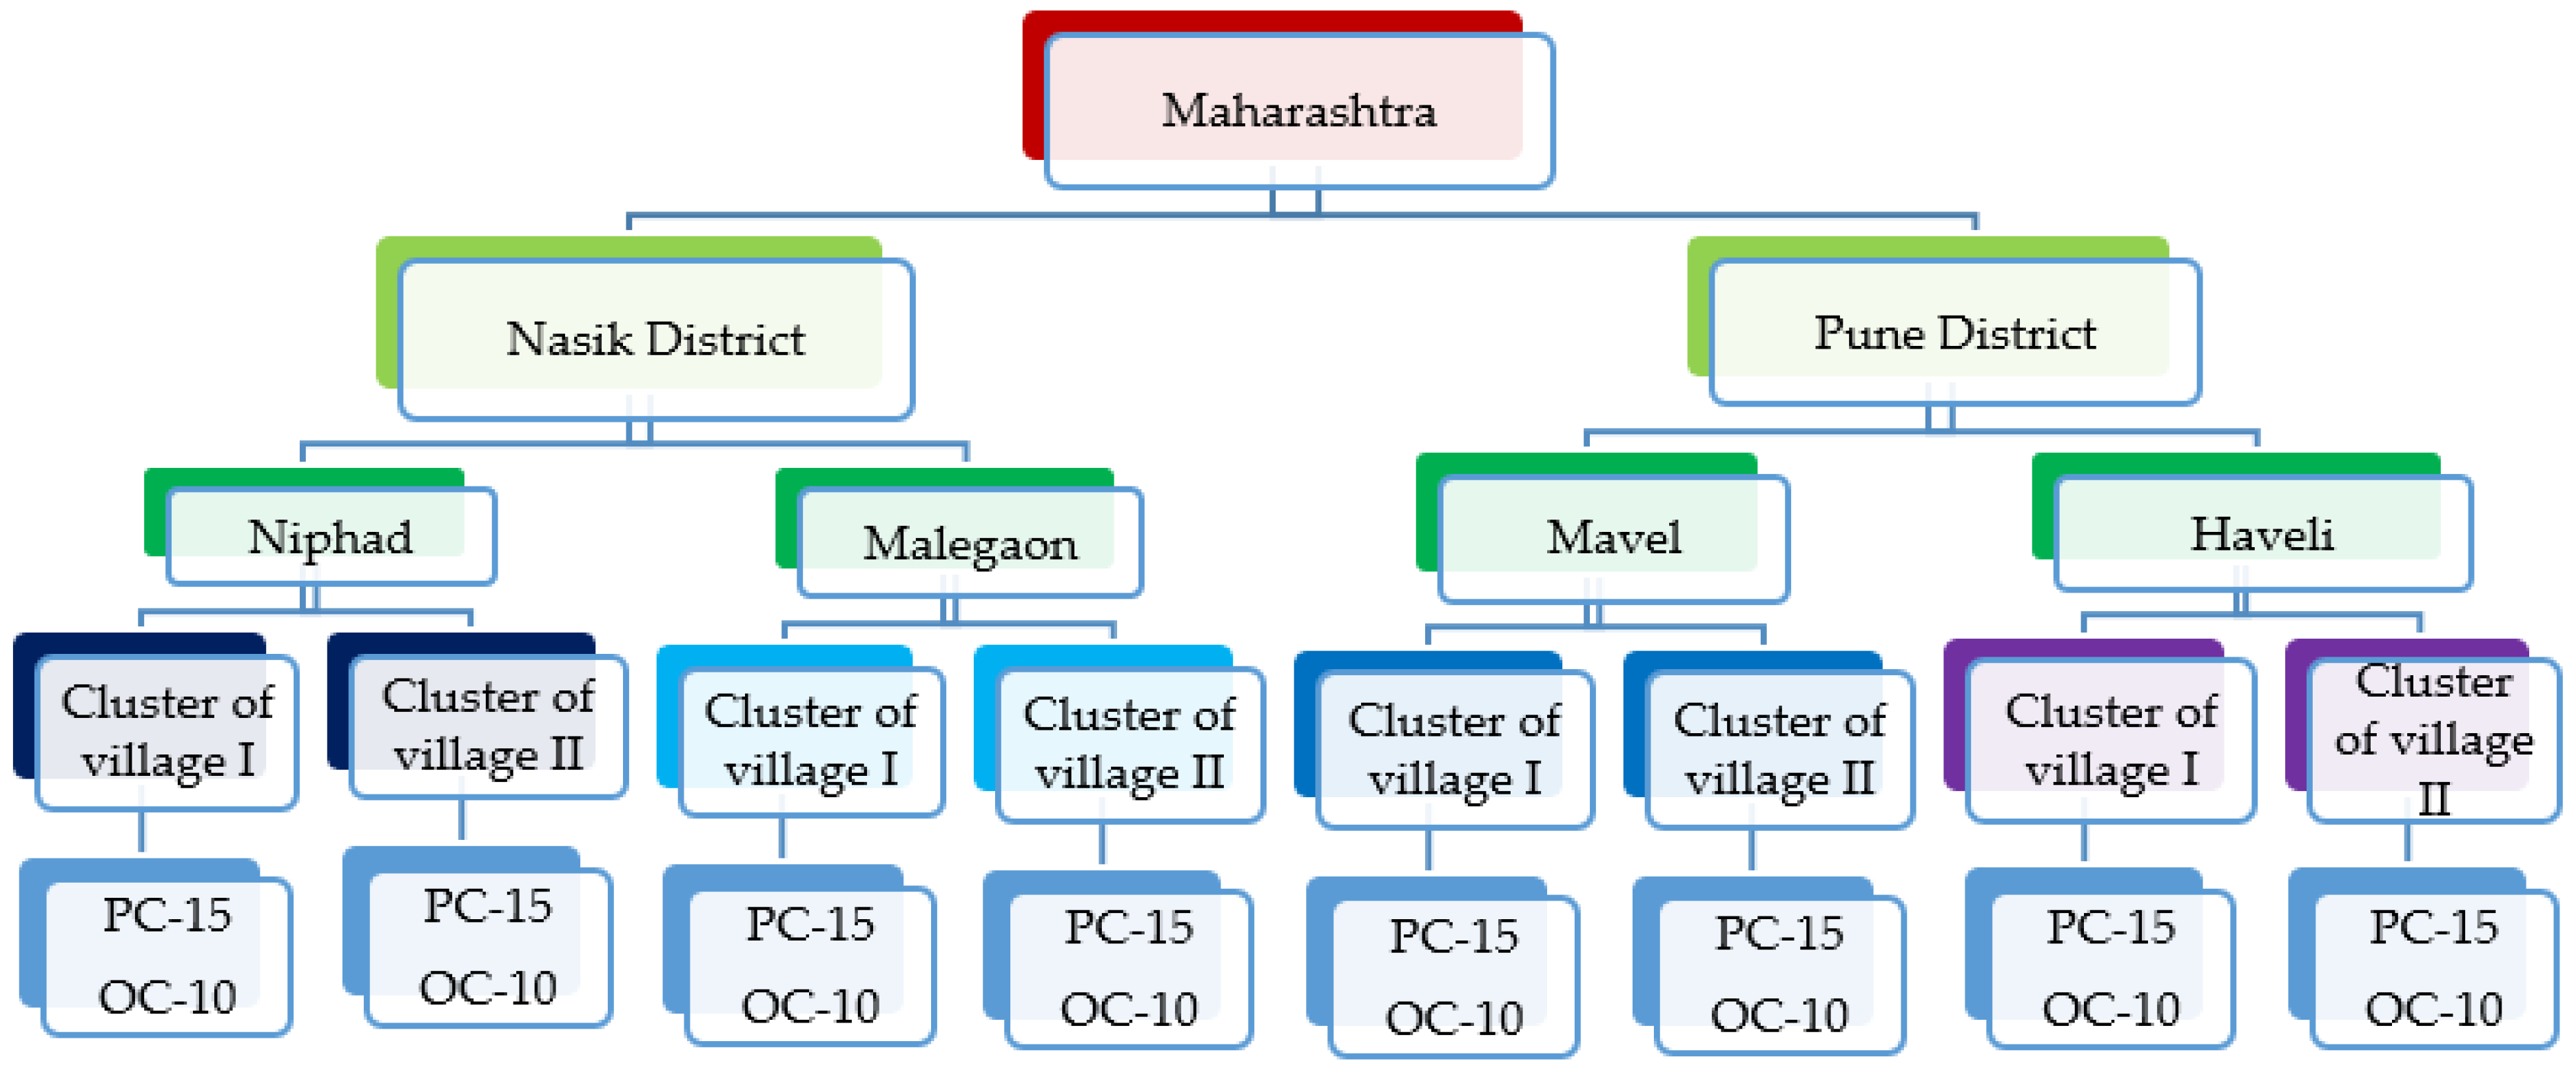
2. Materials and Methods

The study was based on primary data collected from a cross sectional survey of the farmers practicing protected and open field cultivation in Maharashtra during 2018–2019. Purposive and multistage sampling techniques were employed for this study. At the first stage, the Pune and Nasik districts of Maharashtra were selected purposively (Figure 1), as they had the largest area under protected cultivation [26]. At the second stage, a total of four blocks were selected, two blocks from each district. At the third stage, from each block two clusters of villages, each comprising 2–3 villages, were selected. At the final stage, from each selected clusters of villages, both protected cultivation farmers (15) and open cultivation farmers (10) were randomly selected to the tune of 200 as the total sample size, which comprised 120 protected and 80 open field cultivators (Figure 2). Most of the farmers who practice protected cultivation are registered and as most of them have taken loans from the government. For taking a loan in India, the farmer has to register and submit the documents based on the submission of required documents; then, the farmers are selected on the basis of a first-come, first-served basis in a given season or year.
To understand the protected cultivation scenario and aspects related to its feasibility, three focus groups (n = 12 per group) were conducted in each district. Most farmers who practice protected cultivation grow rose (Rosa sp.), carnation (Dianthus caryophyllus), gerbera (Gerbera L.) and capsicum (Capsicum annuum) in a polyhouse and capsicum (Capsicum annuum), tomato (Solanumlycopersicum), cucumber (Cucumissativus) and marigold (Tagetes) under shade nets. After an initial assessment, the selected farmers were interviewed using a standard interview schedule to gather information on the level of input use, type of crops grown, crop yield, price of product, net return, gross return, price of inputs, type of structure constructed by the farmers, cost of establishment of greenhouse structure, cost of cultivation and the factors determining the adoption of protected cultivation and the feasibility of the protected cultivation.
Farm business analysis was done to estimate the costs incurred and returns accrued from flowers and vegetables grown under protected cultivation. The costs were classified into fixed and variables costs. The rental value of land was calculated based on the prevailing rents. Interest rates on fixed and working capital assumed 12 and 7% per annum, respectively, which are comparable to the prevailing rate of interest for short-term and term loans for agriculture from financial institutions [27,28]. The interest on loans increased for greenhouse structures, micro irrigation systems and equipment, and other implements were considered for calculating interest on fixed capital. The amortized cost of crop establishment was estimated using the compound growth rate formula and considering the economic life of the garden. The family labour was imputed according to the prevalent wage rates, whereas in the case of hired labour, the actual wages paid were calculated. The machine labour cost (both hired and owned) was calculated at the prevailing rates. The cost of one’s own planting materials and farm yard manures were calculated by imputing them at the prevailing market price. The cost of purchased planting materials, fertilizers and plant protection chemicals was considered by taking the actual amount paid by the farmers. The cost of packaging and transportation were calculated by taking into account the actual amount paid for marketing their flowers and vegetables, including loading and unloading and other incidental charges. The irrigation charges were calculated based on the cost incurred on the electricity. Depreciation was calculated using the straight line method based on the expected life of the assets. The gross returns were calculated by total production of flowers and vegetables multiplied with the respective prices received. The net returns were calculated by subtracting the gross returns from total production costs.
The project analysis tools, namely net present value (NPV), Benefit-cost ratio (BCR), internal rate of return (IRR) and Payback period (PBP) were used to assess the feasibility of the protected cultivation. The projected lifespan of the flowers and vegetables based in polyhouses and shade net houses was assumed to be 12 years [29,30].
The Net Present Worth is the difference between the sum of the present value of benefits and sum of the costs for a given life period of the polyhouse and/or shade net house.It collates the total benefits with the total costs, covering items such as capital and depreciation costs of the polyhouse and the shade net house [19,31,32,33]. In terms of the NPW criterion, the investments on the polyhouse and shade net house can be considered economically viable if the present value of benefits is greater than the present value of the costs.
N P V = t = 1 n B t ( 1 + r ) t I N V
where INV is the initial investment, and in the case of a series of investments remade over the years, the present value of such costs [ C t ( 1 + r ) t ] should be computed and used. Bt is the cash flow at the end of year t, n is the life of the project and r is the appropriate discount rate.
Moreover, the BCR, which is also linked to NPV as it is obtained by dividing the present worth of the benefit stream with that of the cost stream, is determined following [31,32,33].
B C R = B t ( 1 + r ) t C t ( 1 + r ) t
If the BCR > 1, then the investment made on the polyhouse and shade net house can be considered as economically viable. If the BCR > 1, then the NPW of the benefit stream is higher than that of the cost stream.
The IRR is the discount rate that makes the net present value (NPV) of the cash flow zero and was determined following [31,32,33,34].
I R R = B t ( 1 + r ) t C t ( 1 + r ) t = 0
In terms of the IRR criterion, the projects with IRR greater than the cost of capital should be selected. The IRR can be interpreted as the return per INR100 and is the most favoured measure.
A major flaw in the conventional payback period is that it ignores the value of money. In order to overcome this limitation, the discounted payback period was applied. The payback period is the time it takes for an investment to be redeemed and was determined following [35,36].
P B P = I E .
where PBP is the payback period; I is the initial investment and E is the projected net cash flow per year from the investment.
Farmers were asked whether they adopted protected cultivation or not. The intent is to look at the factor that drives the decision making process. It is also important to understand how each factor affects the farmer’s choice. The observed pattern of adoption of technology can be described as the outcome of a binary choice model. Hence, the choice of individual farmers is therefore represented by a dummy variable [37,38].
Y i = { 1   i f t h e f a r m e r a d o p t s p r o t e c t e d c u l t i v a t i o n 0   i f t h e f a r m e r d o e s n o t a d o p t p r o t e c t e d c u l t i v a t i o n
The probability that a farmer adopts the protected cultivation technology is denoted as p = P while [ y i = 1 ] , whereas the probability for non-adopters of protected cultivation is 1 p = P [ y i = 0 ] . This binary adoption of the variable has a probability function f ( y ) = p y ( p ) 1 y where y = 0, 1. Hence, the probability of technology adoption is expressed as
P [ y i = 1 ] = P ( e i > X i β ) = 1 F   ( Xi β ) =   F   ( Xi β )
where F is the cumulative distribution function (CDF). β is the parameters to be estimated using the maximum probability procedure. Binary choice models differ only by assuming the functional form of F. The binary logistic regression model can be used to estimate the likelihood that the farmer’s will adopt the protected cultivation and it can be expressed as
P i = P ( y i = 1 ) = e β X i 1 + e β X i
The logit model is preferred over the probit model in this paper because of its mathematical simplicity and ease of use [39] while also being common across similar studies [40,41]. The explanatory variables employed in the regression model are summarized in Table 1. The marginal effects, as defined, of a unit change in Xi, and all other factors remained constant, on the probability of a farmer choosing to adopt protected cultivation. The marginal effect of the logit model is referred to as
Δ p i Δ X i { a l l   o t h e r   X   c o n s t a n t } = p i X i

3. Results and Discussion

Socioeconomic characteristics of farmers practicing protected and open field cultivation in Maharashtra are presented in Table 2. The majority of farmers were between 30 to 45 years of age, which was 72% and 70% in case of protected and open field cultivation, respectively. The farmers who adopted protected cultivation had completed their high school education, whereas about 30% of the farmers doing open field farming had either primary school or less than that. The majority of the farmers practicing protected cultivation had an intermediate education (41.7%), followed by high school education (28.3%) and graduates and above (26.7%). However, farmers who adopted protected cultivation are new entrants in farming as compared to open method of cultivation as protected cultivation is a relatively new technology in India. This may be due to attracting other sector entrepreneurs with high, promising profitability. Under open field cultivation, almost all the farmers had more than 10 years of experience. The majority of the farmers working under open field conditions were engaged in agriculture (97.5%), whereas in the case of protected cultivation, about 92% of the farmers were engaged in farming by profession, followed by businessmen/service providers (5.83%), LIC agents (1.67%) and very few were government servants (0.83%). About 90% and 85% of the respondents doing protected cultivation and open field cultivation, respectively, were either small or marginal farmers.

3.1. Economics of Polyhouse Cultivation

The total establishment cost under polyhouse conditions was higher for rose (INR LAKH 16.15), followed by gerbera (INR LAKH 13.79 lakh), carnation (INR LAKH 12.99) and capsicum (INR LAKH 10.06) for a polyhouse size of 0.1 ha area (Table 3). Similar results were reported by Gamanagatti and Patil [42]. The establishment cost for a polyhouse structure was higher for capsicum, which constituted about 84% of the total establishment cost, followed by rose (80%), gerbera (72%) and carnation (66%). Of these, the structural frame (GI pipe) alone constituted a major proportion of the total establishment cost with 64% share of the total establishment cost in case of capsicum, followed by carnation (42%), gerbera (39%) and rose (33%). On the other hand, the crop establishment was high for carnation with about INR LAKH 3.12 (24%), followed by gerbera (19%), rose (9%) and capsicum (3%) of the total establishment cost. The amount of subsidy received by the beneficiaries to the total establishment cost was INR LAKH 7.19 for rose, INR LAKH 5.98 for carnation, INR LAKH 5.76 for gerbera and INR LAKH 4.77 for capsicum respectively for the polyhouse size of 0.1 ha area.
The item-wise cost incurred in cultivation of different crops under polyhouse cultivation was analyzed and the results are presented in Table 4. The total cost incurred in cultivation under polyhouse conditions was more for carnation (INR LAKH 4.61), followed by gerbera (INR LAKH 4.60), rose (INR LAKH 4.49) and capsicum (INR LAKH 3.15) per year for 0.1 ha area. The total variable cost forms the major component in the cost of cultivation. Among the variable costs, the human labour share to the total cost of cultivation was high for rose (35%), followed by carnation (33%), gerbera (31%) and capsicum (27%). Results were observed by Punera [18]; Sudhagar [43] reported that the planting materials and human labour cost were the major investments. Further, it was observed that the total yield obtained from the polyhouse was INR LAKH 2.22, 2.07 and 2.00 in numbers of gerbera, carnation and rose, respectively, whereas 11,325 kgs of capsicum fruit yield was obtained. The gross income received from polyhouse cultivation was high for carnation (INR LAKH 6.83), followed by gerbera (INR LAKH 6.23), rose (INR LAKH 6.14) and capsicum (INR LAKH 4.19). Similarly, the net income realized from polyhouse cultivation was high for carnation (INR LAKH 2.22), followed by rose (INR LAKH 1.64), gerbera (INR LAKH 1.64) and capsicum (INR LAKH 1.04).

3.2. Economics of Shade Net House Cultivation

The crop-wise establishment cost under a shade net house is presented in Table 5. The total establishment cost without subsidy ranged between INR LAKH 5.72 and INR LAKH 5.82 depending on the crops raised in a 0.1 ha area. The highest proportion of the total cost of establishment was represented by polyhouse structures, which ranged from 74 to 75%, whereas, the cost of irrigation system and equipment accounted for about 21 to 22% and land development constituted 2 to 4% of the total establishment cost. Among the polyhouse structures, the proportion of amount spent on GI pipes was the highest, which ranged between 55 and 56% of the total establishment cost. The subsidy for shade net houses was 47 to 48% of the total establishment cost.
The cost of cultivation of different crops under shade net houses is displayed in Table 6. The total cost of cultivation under shade net house was highest for capsicum (INR LAKH 2.90), followed by tomato (INR LAKH 2.73), cucumber (INR LAKH 1.16) and marigold (INR LAKH 1.09) per eight months for a 0.1 ha area. Total variable cost (80%) forms the major component in the total cost of cultivation. Among the variable costs, the share of human labour in the total cost of cultivation was highest in the case of tomato (42% to the total cost of cultivation), followed by capsicum (38% to the total cost of cultivation), marigold (37% of total cost of cultivation) and cucumber (33% to the total cost of cultivation). The total fixed cost accounted for 20% of the total cost of cultivation. Among the fixed costs, about 10.5% to 11% of the fixed cost was incurred as interest on fixed capital. The total yield obtained from shade net houses was estimated to be 18.9 tons for tomato, 9.5 tons for capsicum, 7.1 tons for cucumber and 6 tons for tomato for the size of 0.1 ha area. The net return realized from shade net houses was highest in the case of capsicum (INR LAKH 1.04), followed by marigold (INR LAKH 0.38), cucumber (INR LAKH 0.19) and tomato (INR LAKH 0.11).

3.3. Economics of Protected and Open Field Cultivation

Table 7 provides a comparative analysis of costs and returns of producing roses grown on protected and open fields. The total annual cost of growing rose under protected was about INR LAKH 12.91 per acre which was INR LAKH3.02 under open conditions. The protected cultivation farmers realized 130% of higher yield of rose as compared to that of open methods of cultivation. The average price received per flower under protected cultivation was INR 3 and it was about INR 2 under open conditions. The gross return and net return of protected cultivation were also higher by 252% and 192%, respectively, as compared to that of open methods of cultivation.
The cost and returns analyses for capsicum production in protected and open cultivation are displayed in Table 8. The total annual cost of growing capsicum under protected was very high (INR LAKH 3.85 per year per acre) as compared to that of open methods of cultivation. Farmers using protected cultivation technology realized 137% higher yield of capsicum compared to open conditions. Capsicum produced under protected conditions was sold at nearly three times the price of capsicum grown in open fields due to its better quality in term of colour and size. The gross return and net return of protected cultivation were also higher by 600% and 594%, respectively, compared to open field cultivation. Production of capsicum under protected cultivation is a good investment for farmers compared to an equal size of open field cultivation as it is reflected in the gross and net income.

3.4. Viability Analysis of Protected Cultivation of Horticultural Crops

The project analysis tools were used to estimate the benefit–cost ratio, net present value and internal rate of returns under three sets of scenarios: (a) with and without subsidies; (b) under three sets of discount rates, i.e., 7%, 10% and 12% and (c) different combinations of crops under polyhouses and shade net houses, which are presented in Table 9 and Table 10. A feasibility analysis of crop combinations cultivated by the farmers in polyhouses was evaluated and the results are presented in Table 9. Without a subsidy for setting up a polyhouse along witha7% discount rate, the IRR varied from 25% for rose to 41% for carnation, with capsicum depending on the crops raised by the farmers. The NPV ranged from INR LAKH 8.50 for capsicum to INR LAKH17.58 for carnation. The benefit–cost ratio ranged from 1.33 for capsicum to 1.47 for carnation. Thus, based on all the three measures, the polyhouse cultivation of different crops was observed to be feasible. However, under the higher discount rate scenario, the cultivation of crops under polyhouse conditions was also feasible. With a subsidy on a polyhouse along with a 7% discount rate, the IRR varied from56% for rose to 93% for the carnation with capsicum. The NPV ranged from INR LAKH12.87 for capsicum to INR LAKH 21.95 for carnation, and the benefit–cost ratio was from 1.61 for capsicum to 1.68 for carnation with capsicum. Consquently by all the three evaluation measures the polyhouse cultivation of different crops was found to be highly rewarding. With subsidy on polyhouse and planting materials with 7% discount rate, the IRR ranged from 61% for rose to 131% for carnation with capsicum. The benefit–cost ratio ranged from 1.62 for capsicum to 1.75 for carnation with capsicum and the NPV ranges from INR LAKH12.95 for capsicum to INR LAKH21.49 for carnation with capsicum. However, in the higher discount rate scenario, the value of IRR, NPV and the benefit–cost ratio did not fall much and was observed to be very profitable. The payback period for polyhouse production of different crops is estimated to be 1.48 to 2.34 years with subsidies, and 2.51 to 4.04 years without subsidies for a 0.1 ha area. Similar results were reported by Punera [18], which indicated that the investment can be recovered within 5 years depending upon the crops grown in the polyhouse. Additionally, the internal rate of returns varies from 31% for carnation with capsicum to 73% for carnation.
A feasibility analysis of different crop combinations cultivated by the farmers under shade net houses was evaluated and the results are presented in Table 10. Without a subsidy for setting up of shade net houses along with a discount rate of 7%, the IRR varied from 7% for the tomato to 40% for capsicum depending on the crops raised by the farmers. The NPV ranged from INR LAKH−0.01 to INR LAKH 7.52 and the benefit–cost ratio ranged from 0.99 to 1.31. Thus, on all three project analysis measures, the cultivation of crops under shade net houses reveals a few crop enterprises were found to be rewarding. However, under the higher discount rate scenario at 10 and 12%, the feasibility was affected. With subsidies on polyhouses along with a 7% discount rate, the cultivation of crops under shade net houses was observed to be profitable with IRR ranging from 29% for the tomato to 135% for capsicum. The NPV ranged from INR LAKH 2.55 to INR LAKH 10.08 and the benefit–cost ratio varied from 1.12 to 1.46. Thus, it was revealed that in all the three project evaluation measures, the cultivation of crops under shade net houses was found to be quite rewarding with subsidy support. The payback period without subsidy takes nearly 3.12 to 9.22 years to make it break even, whereas it was 1.32 to 3.20 years with a subsidy to make it break even depending on the crops raised under shade nets. Similar results were found in the study carried out by Murthy [44], which indicated that tomato production was not economically viable and that it takes almost nine years to make it break even without subsidy support.

3.5. Determinants of the Adoption of Protected Cultivation

The adoption of protected cultivation has been affected by several factors which were identified through binary logit regression and the results are presented in Table 11. The Binary logistic regression model does not make the assumption of linearity between dependent and independent variables and does not assume homoskedasticity. Furthermore, it does not assume variables are normally distributed [45]. The analysis pertains to cross- sectional data, so the model was fitted with an entire data set and the robustness of model was assessed [46]. The independent variables were tested for multicollinearity with the help of the Variance Inflation Factor (VIF). A tolerance limit (1/VIF) close to 1 indicated that some multicollinearity exists, whereas, a value close to 0 indicated the presence of severe multicollinearity. The estimated average tolerance level for the independent variables was 0.66, suggesting that there was no severe multicollinearity. The results of logistic regression indicated that the years of schooling, household income, access to subsidies and risk orientation index were significant factors in the adoption of protected cultivation technology. The analysis of marginal effects showed that the probability of adopting a protected cultivation technology increases by 2.5% for each year of increase in formal schooling. The estimated marginal effects of household income suggested that a 1% increase in household income will increase the likelihood of adopting protected cultivation by 5.6%. Access to subsidies is also significant and positively associated with the adoption of technology at a significant 5% level. The estimated marginal effects of the dummy variable showed that the accessibility to subsidies increases the probability of adoption by 13%. Finally, farmers risk orientation, which encourages the adoption of technology. The marginal effects of this variable suggested that the probability of technology adoption increases by 42% if the farmer is a risk bearer. Other studies report on the level of education as well; additionally, household income and orientation towards risk were the significant factors for adoption of technology [47,48,49]. However, the sustainable livelihood security at the local/regional level needs to be considered by taking into account some of the Sustainable Development Goals (SDGs) of United Nations, such as SDG-2,which is related to zero hunger, SDG-3 for good health and well-being, SDG-5 for gender equality, SDG-8 for decent work and economic growth, SDG-13 for climate action and SDG-15, related to life on land in the direction of enhancing crop productivity and farm income while maintaining the sustainable use of natural resources [50]. However, the sustainability aspects in terms of institutional support such as credit and insurance subsidies for small and resource-poor farmers are needed for socially inclusive development of regions. The development departments and research organizations need to work in coordination for extending technical and extension services to the farmers, which in turn will bring socially inclusive development of the regions and farmers’ prosperity.

4. Conclusions and Policy Implications

Globally, the success of protected cultivation technology has encouraged research and projects to transfer the technologies to overcome agronomic constraints and safeguard crop production year-round in the milieu of climate change and shrinking land resources. Protected cultivation technology unlocks the potential to produce crops with high productivity and superior quality; it also generates employment and augments farm income, brings foreign exchange revenue as well as effective utilization of scarce agricultural land. Education played a key role in adoption of protected cultivation and the majority of adopters were more educated. The cost of establishment of crops under protected cultivation was high but the net return was more profitable. Total cost of cultivation and net return in production of rose and capsicum under protected cultivation were higher compared to open methods of cultivation. The protected cultivation leads to conservation of soil and water, as excessive use of water is not there as most of farmers use micro-irrigation, so the amount of water needed is only drawn from the ground and used. The fertility of soil is maintained as the farmers use the right doses of fertilizer, and the soil is also not impacted by rain or wind erosion as it is covered. The major conclusions that can be drawn from this study are protected cultivation techniques can be suitably replicated to other regions, and financial incentives such as subsidy schemes need to be extended to encourage more farmers to adopt the protected cultivation technology. The use of modern technologies in protected cultivation such as artificial intelligence, robotics for plucking fruits, for identification of right stage of harvesting of fruits, selective plucking of fruits, and use of IoT or sensor-based irrigation scheduling would enhance efficiency and income if regional farmers adopted the technology. Since protected cultivation technology is capital intensive, there is fear that it will be adopted by the large, educated and progressive farmers. To overcome this fear of the negative aspect of technology by way of massive subsidy, quotas for subsidies for small and marginal farmers, SC/ST farmers, technology such as shade nets, poly houses, fan pad systems, air-conditioning, tunnels, etc. should be developed, so as to popularise a wide variety of technology so that farmers can more conveniently adopt and realise higher incomes and could progress towards more capital-intensive technology. Separate departments and schemes for high-end technology and low -end and less capital intensive technology may be created. Training may be arranged so as to increase the awareness about the technology so that knowledge gap is minimised across farmers of different land size classes. The policy implications are creating modern infrastructure, need for enhanced application of ICTs, maximum crop production with minimum utilization of land and institutional support to promote technology on a commercial scale. The profitability of protected cultivation should be sensitized as an agri-business enterprise among the farmers through capacity building programmes, development of low-cost protected cultivation structures befitting various crops and agro-climatic conditions in India.

Author Contributions

All authors contributed to the preparation, analyses, writing. All authors have read and agreed to the published version of the manuscript.

Funding

This research received no external funding.

Institutional Review Board Statement

Not applicable.

Informed Consent Statement

Informed consent was obtained from all subjects involved in the study.

Data Availability Statement

The data presented in this study are openly available in the public domain given in the references.

Acknowledgments

This paper is a part of the Ph.D. research work of the first author. The authors are grateful to the ICAR-Indian Agricultural Research Institute, New Delhi, for their financial assistance in carrying out research work and to the ICAR-Central Tuber Crops Research Institute, Thiruvananthapuram for granting study leave.

Conflicts of Interest

The authors declare no conflict of interest.

References

  1. Rosenzweig, C.; Iglesias, A.; Yang, X.; Epstein, P.R.; Chivian, E. Climate change and extreme weather events; implications for food production, plant diseases, and pests. Glob. Chang. Hum. Health 2001, 2, 90–104. [Google Scholar] [CrossRef]
  2. Chhogyel, N.; Kumar, L. Climate change and potential impacts on agriculture in Bhutan: A discussion of pertinent issues. Agric. Food Secur. 2018, 7, 79. [Google Scholar] [CrossRef]
  3. Aryal, J.P.; Sapkota, T.B.; Khurana, R.; Khatri-Chhetri, A.; Rahut, D.B.; Jat, M.L. Climate change and agriculture in South Asia: Adaptation options in smallholder production systems. Environ. Dev. Sustain. 2020, 22, 5045–5075. [Google Scholar] [CrossRef] [Green Version]
  4. Prabhakar, I.; Vijayaragavan, K.; Singh, P.; Singh, B.; Janakiram; Manjunatha, B.L.; Jaggi, S.; Sekar, I. Constraints in adoption and strategies to promote poly house technology among farmers: A multi-stakeholder and multi-dimensional study. Indian J. Agric. Sci. 2017, 87, 485–490. [Google Scholar]
  5. Jensen, M.H. Controlled environment agriculture in deserts tropics and temperate regions—A world review. Acta Hortic. 2002, 578, 19–25. [Google Scholar] [CrossRef]
  6. Stanghellini, C.; Montero, J.I. Resource use efficiency in protected cultivation: Towards the greenhouse with zero emissions. Acta Hortic. 2012, 927, 91–100. [Google Scholar] [CrossRef] [Green Version]
  7. Mehta, K.; Thakur, R.K.; Guleria, J.S. Socio-economic impact of protected cultivation on tomato growers of Himachal Pradesh. Econ. Aff. 2020, 65, 1–7. [Google Scholar] [CrossRef]
  8. Spehia, R.S. Status and impact of protected cultivation in Himachal Pradesh Indian. Curr. Sci. 2015, 108, 2254–2257. [Google Scholar]
  9. Choudhary, A.K. Scaling-up of protected cultivation in Himachal Pradesh Indian. Curr. Sci. 2016, 111, 272–277. [Google Scholar] [CrossRef]
  10. Kumar, P.; Chauhan, R.S.; Grover, R.K. Economic analysis of tomato cultivation under poly house and open field conditions in Haryana. Int. J. Appl. Sci. 2016, 8, 846–848. [Google Scholar] [CrossRef] [Green Version]
  11. Sabir, N.; Singh, B. Protected cultivation of vegetables in the global arena: A review. Indian J. Agric. Sci. 2013, 83, 123–135. [Google Scholar]
  12. Singh, B. Protected cultivation of horticultural crops in India: Challenges and opportunities. In Proceedings of the 2014 Conference Third International Conference on Agriculture and Horticulture, Hyderabad, India, 27–29 October 2014. [Google Scholar]
  13. Gruda, N.; Bisbis, M.; Tanny, J. Impacts of Protected Vegetable Cultivation on Climate Change and Adaptation Strategies for Cleaner Production—A Review. J. Clean. Prod. 2019, 225, 324–339. [Google Scholar] [CrossRef]
  14. Anton, A.; Torrellas, M.; Montero, J.I.; Ruijs, M.; Vermeulen, P.; Stanghellini, C. Environmental impact assessment of Dutch tomato crop production in a Venlo glasshouse. Acta Hortic. 2012, 927, 781–791. [Google Scholar] [CrossRef] [Green Version]
  15. Theurl, M.C.; Hortenhuber, S.J.; Lindenthal, T.; Palme, W. Unheated soil-grown winter vegetables in Austria: Greenhouse gas emissions and socio-economic factors of diffusion potential. J. Clean. Prod. 2017, 151, 134–144. [Google Scholar] [CrossRef] [Green Version]
  16. Jethi, R.; Srinivas, K.; Bisht, J.K. Economics of production of tomato under open and protected field conditions in hills of Uttarakhand. Indian J. Ext. Educ. 2012, 48, 13–16. [Google Scholar]
  17. Negi, V.S.; Maikhuri, R.K.; Rawat, S.; Parshwan, D. Protected cultivation as option of livelihood in mountain region of central Himalaya, India. Int. J. Sustain. Dev. World Ecol. 2013, 5, 416–425. [Google Scholar] [CrossRef]
  18. Punera, B.; Pal, S.; Jha, G.K.; Kumar, P. Economics and institutional aspects of protected cultivation of carnation in Himachal Pradesh. Agric. Econ. Res. Rev. 2017, 30, 73–80. [Google Scholar] [CrossRef]
  19. Kumar, P.; Kar, A.; Singh, D.R.; Perumal, A.; Shivamurthy, S.G.C.; Reddy, K.V.; Badal, P.S.; LalaKamble, A.; Kamalvanshi, V.; Jha, G.K.; et al. Protected Cultivation of Horticultural Crops in Uttarakhand: An Economic Analysis. Agronomy 2021, 11, 692. [Google Scholar] [CrossRef]
  20. Prakash, P.; Kumar, P.; Kar, K.; Singh, A.K.; Anbukkani, P. Progress and performance of protected cultivation in Maharashtra. Indian J. Econ. Dev. 2019, 15, 555–563. [Google Scholar] [CrossRef]
  21. Government of India. Horticultural Statistics at a Glance 2017; Horticulture Statistics Division, Department of Agriculture, Cooperation and Farmers Welfare, Ministry of Agriculture and Farmers Welfare, Government of India: New Delhi, India, 2017. [Google Scholar]
  22. Government of India. Mission for Integrated Development of Horticulture, Operational Guidelines; Horticulture Division, Department of Agriculture, and Cooperation, Ministry of Agriculture and Farmers Welfare, Government of India: New Delhi, India, 2014. [Google Scholar]
  23. Prakash, P.; Kumar, P.; Kar, A.; Singh, A.K. Status and impact of protected cultivation of horticultural crops in Maharashtra. Indian J. Hortic. 2020, 77, 518–526. [Google Scholar] [CrossRef]
  24. Walawande, S.R.; Rahane, R.K.; Mali, R.R.; Waghmare, M.N. State of floriculture in Maharashtra: A case study of floriculturists in Pune District. Agric. Econ. Res. Rev. 2013, 26, 221. [Google Scholar]
  25. Waghmare, M.N.; Shendage, P.N. Economic Analysis of Production of Cut Roses under Polyhouses in Western Maharashtra. Int. J. Curr. Microbiol. Appl. Sci. 2019, 8, 234–241. [Google Scholar] [CrossRef]
  26. Government of India. Mission for Integrated Development of Horticulture; Department of Agriculture, and Cooperation, Ministry of Agriculture and Farmers Welfare, Government of India: New Delhi, India, 2019. [Google Scholar]
  27. Bishta, D.R.; Kumar, P.; Mathur, V.C. Progress and performance of kisan credit card scheme with a case study of Bihar. Agric. Econ. Res. Rev. 2012, 25, 125–135. [Google Scholar]
  28. Prakash, P.; Kumar, P. Performance of kisan credit card scheme in Tamil Nadu. Indian J. Agric. Econ. 2016, 71, 191–211. [Google Scholar]
  29. Mishra, G.P.; Singh, N.; Kumar, H.; Singh, S.B. Protected cultivation for food and nutritional security at Ladakh. Def. Sci. J. 2010, 61, 219–225. [Google Scholar] [CrossRef] [Green Version]
  30. Prakash, P.; Kumar, P.; Niranjan, S.; Jaganathan, D.; Kishore, P.; Immanuel, S. Economic feasibility of protected cultivation of rose under polyhouse and its supply chain in Maharashtra. J. Community Mobilization Sustain. Dev. 2021, 16, 939–946. [Google Scholar]
  31. Gittinger, J.P. Economic Analysis of Agricultural Projects; Published for the Economic Development Institute of the World Bank; Johns Hopkins University Press: Baltimore, MD, USA, 1982. [Google Scholar]
  32. Franco, D.; Singh, D.R.; Praveen, K.V. Economic feasibility of vegetable production under polyhouse: A case study from Palakkad district of Kerala. J. Crop Weed. 2018, 14, 134–139. [Google Scholar]
  33. Chahal, A.S.; Sharma, R.; Dev, K. Economic analysis of carnation under protective cultivation: A study of Mid Hills Zone of Himachal Pradesh. Indian J. Ecol. 2020, 47, 369–377. [Google Scholar]
  34. Prakash, P.; Kumar, P.; Kar, A.; Singh, A.K.; Ankukkani, P. Economic analysis of carnation (Dianthus caryophyllus) under protected cultivation in Maharashtra. Indian J. Agric. Sci. 2022, 92, 460–463. [Google Scholar]
  35. Panwar, N.L.; Kothari, S.; Kaushik, S.C. Cost-benefit and systems analysis of passively ventilated solar greenhouses for food production in arid and semi-arid regions. Environ. Syst. Decis. 2014, 34, 160–167. [Google Scholar] [CrossRef]
  36. Nirmal, K.; Malik, D.P.; Raj, K. An economicanalysisof Mango (Mangiferaindica L.) cultivation in Haryana. Indian J. Econ. Dev. 2019, 15, 282–288. [Google Scholar]
  37. Rogers, E.M. Diffusion of Innovations, 4th ed.; Thee Free Press, A Division of Simon & Schuster Inc.: New York, NY, USA, 1995. [Google Scholar]
  38. Griliches, Z. Hybrid Corn: An Exploration in the Economics of Technological Change. Econometrica 1957, 25, 501–522. [Google Scholar] [CrossRef] [Green Version]
  39. Greene, W.H. Econometric Analysis, 6th ed.; Prentice Hall: Hoboken, NJ, USA, 2007. [Google Scholar]
  40. Feder, G.; Just, E.R.; Zilberman, D. Adoption of Agricultural Innovations in Developing Countries: A Survey. Econ. Dev. Cult. Chang. 1985, 33, 255–298. [Google Scholar] [CrossRef] [Green Version]
  41. Green, D.A.G.; Ng’ong‘ola, D.H. Factors Affecting Fertilizer Adoption in Less Developed Countries: An Application of Multivariate Logistic Analysis in Malawi. J. Agric. Econ. 1993, 44, 99–109. [Google Scholar] [CrossRef]
  42. Gamanagatti, P.; Patil, B. Economic evaluation of protected cultivation technology for horticultural crops. In Proceedings of the 2018 Conference International Association of Agricultural Economists, Vancouver, BC, USA, 28 July–2 August 2018. [Google Scholar]
  43. Sudhagar, S. Production and marketing of cut flower (Rose and Gerbera) in hosurtaluk. Int. J. Bus. Manag. Invent. 2013, 2, 15–25. [Google Scholar]
  44. Murthy, D.S.; Prabhakar, B.S.; Hebbar, S.S.; Srinivas, V.; Prabhakar, M. Economic viability of vegetable production under polyhouse: A case study of capsicum and tomato. J. Hortic. Sci. 2009, 4, 148–152. [Google Scholar]
  45. Afolami, C.A.; Obayelu, A.E.; Vaughan, I.I. Welfare impact of adoption of improved cassava varieties by rural households in South Western Nigeria. Agric. Econ. 2015, 3, 18. [Google Scholar] [CrossRef]
  46. Ntshangase, N.L.; Muroyiwa, B.; Sibanda, M. Farmers perceptions and factors influencing the adoption of no-till conservation agriculture by small scale farmers in Zashuke Kwazula Natal Province. Sustainability 2018, 10, 555. [Google Scholar] [CrossRef] [Green Version]
  47. Mariano, M.J.; Vilano, R.; Fleming, E. Factors influencing farmer’s adoption of modern rice technologies and good management practices in the Philippines. Agric. Syst. 2012, 110, 41–53. [Google Scholar] [CrossRef]
  48. Franco, D.; Singh, D.R.; Praveen, K.V. Evaluation of adoption of precision farming and its profitability in banana crop. Indian J. Econ. Dev. 2018, 14, 225–234. [Google Scholar] [CrossRef]
  49. Vijayasarathy, K.; Ashok, K.R. Climate adaptation in agriculture through technological option: Determinants and impact on efficiency of production. Agric. Econ. Res. Rev. 2015, 28, 103–116. [Google Scholar] [CrossRef]
  50. Krishna, V.R.; Paramesh, V.; Das, V.A.B.; Elansary, H.O.; Parab, A.; Reddy, D.D.; Shashidhar, K.S.; El-Ansary, D.O.; Mahmoud, E.A.; El-Sheikh, M.A. Assessment of sustainability and priorities for development of Indian west coast region: An Application of Sustainable Livelihood Security Indicators. Sustainability 2020, 12, 8716. [Google Scholar] [CrossRef]
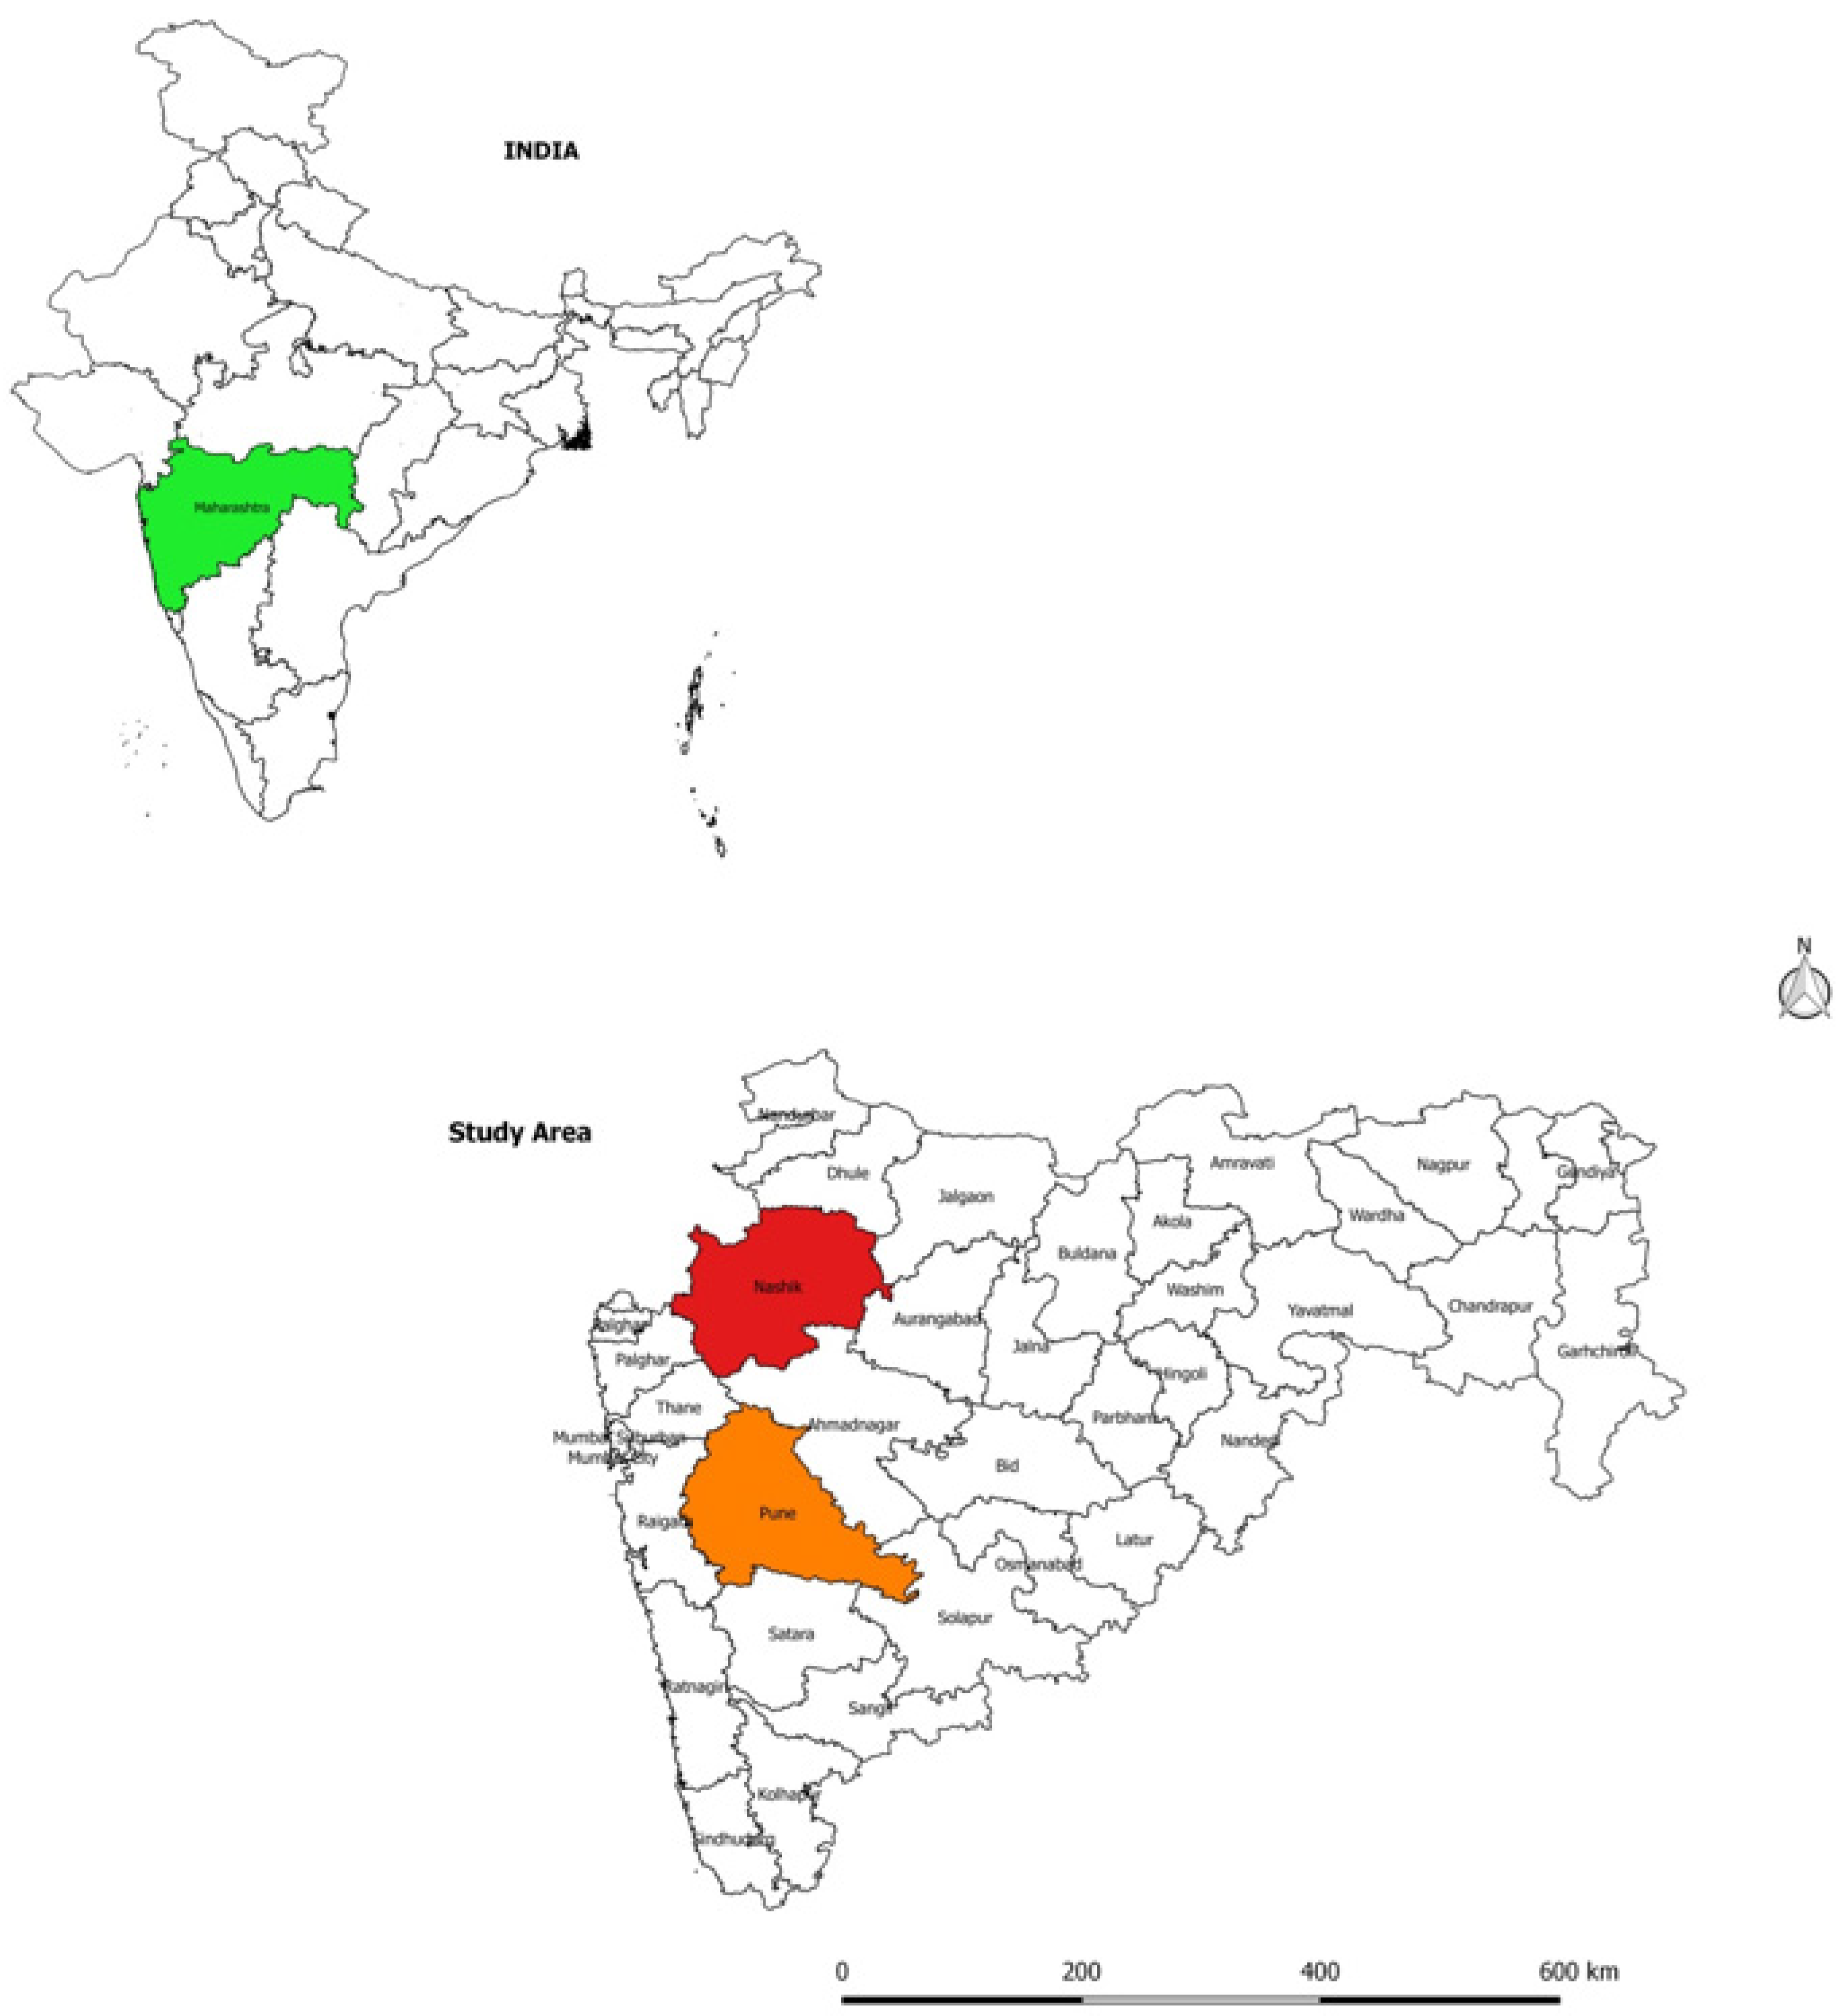
Figure 1. Locations of the study area.
Sustainability 14 07430 g001
Figure 2. Sampling framework. Note: PC—Protected cultivation; OC—Open cultivation.
Sustainability 14 07430 g002
Table 1. Definition of Variables used for the Adoption of Protected Cultivation Technology.
S. NoUnit of MeasurementExpected Sign
Dependent variable1 if farmers adopts protecetd cultivation; 0 otherwise
AgeAge of the head of the household (years)-
EducationNumber of years of formal education by the farmer+
Farm sizeSize of the land owned by household (ha)±
Household sizeNumber of people in the household±
Ln_IncomeAverage household annual income (INR) +
Loan1 if the farmer has access to credit; 0 otherwise±
Subsidy1 if the farmers has access to a subsidy; 0 otherwise+
Distance to marketDistance of the farm to the market (km)-
Extension contact1 if the farmers access to advice from extension workers; 0 otherwise+
Risk orientationRisk orientation index+
District dummies1 if the farmer belongs to Pune; 0 otherwise±
The costs and returns and feasibility analysis were analyzed using Microsoft Excel 2013 V.15.0 andabinary logistic regression model was done using STATA Software V. 14.1.
Table 2. Classification of farmers on the basis of socio-economic characteristics (n = 200).
ParticularsClassificationProtectedOpen Field
Age (years)Less than 309.215.0
30–4571.770.0
More than 4519.215.0
EducationIlliterate (0)0.010.0
Primary (1–5)0.830.0
High school (6–10)30.845.0
Intermediate (11–12)41.715.0
Graduate and Above (>12)26.70.0
Farming Experience (years)Less than 29.20.0
2 to 535.80.0
5 to 1037.50.0
More than 1017.5100
OccupationFarmer91.6797.5
Business/service5.832.5
Government0.830.0
LIC agent1.670.0
Landholding size (ha)Marginal farmers (<1)50.050.0
Small farmers (1–2)40.035.0
Medium farmers (2–10)10.015.0
Table 3. Crop-wise establishment cost under polyhouse for 0.1 ha area.
ParticularsRoseCarnationGerberaCapsicum
Amount
(INR LAKH)
% to TotalAmount
(INR LAKH)
% to TotalAmount
(INR LAKH)
% to TotalAmount
(INR LAKH)
% to Total
1.Polyhouse structure
Structural frame (GI pipe)5.4333.585.4341.755.4339.335.4353.95
Polythene sheet1.086.671.088.301.087.811.0810.72
Shade net0.392.410.393.000.392.830.393.88
Packaging unit4.5027.86--1.5010.87--
Miscellaneous1.579.731.7213.251.5711.391.5715.63
Sub total12.9780.268.6266.309.9772.248.4784.17
2.Irrigation system and equipments
Irrigation &Fertigation1.177.241.179.001.178.481.1711.63
Sprayers0.060.370.080.620.060.400.090.93
Equipment’s0.503.10------
Sub total1.7310.711.259.621.238.881.2612.57
3.Crop establishment
Planting material1.026.312.6020.012.1615.66--
Bed preparation0.301.840.312.370.302.160.333.26
Organic manures0.050.320.050.420.050.37--
Fertilizer0.030.170.020.170.020.13--
Plant protection0.020.140.020.180.030.20--
Labour0.040.240.120.920.050.36--
Sub total1.469.033.1324.082.6018.880.333.26
4.Total establishment cost16.1510012.9910013.7910010.06100
5.Subsidy7.19 5.98 5.76 4.77
6.Establishment cost minus subsidy8.97 7.02 8.04 5.29
Table 4. Crop-wise costs# and returns# under polyhouse for 0.1 ha area.
Cost ComponentsRoseCarnationGerberaCapsicum
Amount
(INR LAKH)
% to TotalAmount
(INR LAKH)
% to TotalAmount
(INR LAKH)
% to TotalAmount
(INR LAKH)
% to Total
A. Fixed cost
Land rent and revenue0.102.220.102.170.901.960.103.18
Interest on fixed capital @ % 12 p.a1.0823.950.8418.270.9621.000.6320.18
Amortised cost of crop establishment0.235.130.7616.510.5010.920.113.43
Depreciation0.6514.450.6013.000.7115.350.5216.64
Total fixed cost2.0645.762.3049.962.2649.231.3743.43
B. Variable cost
Plant protection0.112.520.081.740.091.860.113.45
Machine labour------0.010.21
Planting materials------0.216.75
Organic fertilizers------0.041.34
Fertilizers0.153.230.132.730.153.370.123.93
Labour charges1.5734.841.5333.251.4431.340.8527.11
Irrigation electricity charges0.051.210.030.590.030.600.020.76
Packaging and transportation0.408.900.398.450.4710.280.278.61
Miscellaneous------0.020.72
Interest on working capital @ 7% p.a0.163.550.153.270.153.320.123.70
Total variable cost2.4454.242.3150.042.3350.771.7856.57
Total annual cost (A+B)4.491004.611004.601003.15100
C. Production and price
Total flowers produced (LAKH Nos.)2.00 2.07 2.23 11,325 kg
Sale price (INR /flower)3.1 3.3 2.8 37 kg
Gross returns (INR LAKH)6.14 6.83 6.23 4.19
Net returns (INR LAKH)1.64 2.22 1.64 1.04
Source: Authors calculations based on field survey (2018); Note: #—for one year, p.a.—per annum.
Table 5. Crop-wise establishment cost under shade net houses for 0.1 ha area.
ParticularsCapsicumTomatoCucumberMarigold
Amount (INR LAKH)% to TotalAmount (INR LAKH)% to TotalAmount (INR LAKH)% to TotalAmount (INR LAKH)% to Total
1.Polyhouse structure
Structural frame
(GI pipe)
3.2255.493.2256.283.2255.323.2256.14
Shade net0.335.630.335.710.335.610.335.69
Insect net0.203.460.203.510.203.450.203.50
Miscellaneous0.579.840.579.980.579.800.579.95
Sub total4.3274.424.3275.474.3274.184.3275.28
2.Irrigation system and equipment
Irrigation and Fertigation1.1720.171.1720.461.1720.111.1720.41
Sprayers0.071.120.071.270.122.060.061.05
Sub total1.2421.291.2421.731.2922.171.2321.45
3.Land development0.254.280.162.800.213.640.193.26
4.Total establishment cost5.801005.721005.821005.73100
5.Subsidy2.75 2.75 2.75 2.75
6.Establishment cost minus subsidy3.05 2.97 3.07 2.99
Table 6. Crop-wise costs# and returns# under shade net houses for 0.1 ha area.
Cost componentsCapsicumTomatoCucumberMarigold
Amount
(INR LAKH)
% to TotalAmount
(INR LAKH)
% to TotalAmount
(INR LAKH)
% to TotalAmount
(INR LAKH)
% to Total
A. Fixed cost
Land rent and revenue0.041.430.041.530.021.440.021.53
Interest on fixed capital @ 12% p.a0.3110.520.3010.910.1210.600.1211.00
Amortised cost of crop establishment0.072.350.041.610.022.010.021.89
Depreciation0.175.750.165.950.075.740.065.79
Total fixed cost0.5820.060.5519.990.2319.790.2220.22
B. Variable cost0.00 0.00 0.00 0.00
Machine labour0.010.220.010.220.010.600.010.64
Planting materials0.269.090.259.170.2117.940.1816.57
Plant protection0.113.620.113.940.043.620.021.93
Organic fertilizers0.051.550.041.470.032.290.021.52
Fertilizers0.124.260.124.470.065.200.054.97
Labour charges1.1138.221.1441.780.3832.890.4137.28
Irrigation electricity charges0.020.810.020.900.010.820.010.82
Packaging and transportation0.4314.720.2910.510.108.410.097.82
Miscellaneous0.072.430.062.310.043.190.033.01
Interest on working capital @ 7% p.a0.155.240.145.230.065.250.065.22
Total variable cost2.3279.942.1880.010.9380.210.8779.78
Total annual cost (A+B)2.901002.731001.161001.09100
C. Production and price
Production (kg)9500 18,900 7150 6000
Sale price (INR/kg)41.5 15 18.9 24.5
Gross returns (INR LAKH)3.94 2.84 1.35 1.47
Net returns (INR LAKH)1.04 0.11 0.19 0.38
Source: Authors calculations based on field survey (2018); Note: #—eight month, p.a.—per annum.
Table 7. Costs# and returns# of rose cultivation under protected and open field conditions.
ParticularsProtected Open
Total cost (INR LAKH/acre)12.913.02
Production (LAKH Nos./acre)8.00
(130%)
3.48
 
Sale price (INR/flower)3.0
(53%)
1.96
Gross return (INR LAKH/acre)24.00
(252%)
6.82
 
Net return (INR LAKH/acre)11.09
(192%)
3.80
 
Note: #—one year growing period of rose considered for protected and open cultivation; figures in parenthesis indicate percentage increase over open cultivation.
Table 8. Costs# and returns# of capsicum cultivation under protected and open field conditions.
ParticularsProtected Open
Total cost (INR LAKH/acre)3.85
 
0.55
 
Production (kg/acre)14,800
(137%)
6250
Sale price (INR/kg)41.5
(196%)
14
Gross return (INR LAKH/acre)6.14
(600%)
0.88
 
Net return (INR LAKH/acre)2.29
(594%)
0.33
 
Note: #—four month growing period of capsicum considered for protected and open cultivation as well; figures in parenthesis indicate percentage increase over open methods of cultivation.
Table 9. Viability analysis of crop combinations cultivated by the farmers under polyhouses for 0.1 Ha Area.
Crop CombinationFeasibility CriteriaWith Subsidy on Polyhouse and Planting MaterialWith Subsidy on PolyhouseWithout Subsidy
7%10%12%7%10%12%7%10%12%
RoseNPV (INR LAKH)20.1116.1614.0219.6315.6913.5612.528.937.01
B:C ratio1.691.621.581.661.591.551.341.271.23
IRR (%) 61 56 25
PBP (years) 2.34 2.42 4.14
GerberaNPV (INR LAKH)20.7416.9014.8419.7315.9213.8715.3611.679.70
B:C ratio1.691.641.601.641.581.541.431.371.32
IRR (%) 86 68 34
PBP (years) 2.03 2.20 3.24
CarnationNPV (INR LAKH)23.1719.1116.9121.9517.9215.7517.5813.6711.58
B:C ratio1.741.691.661.671.621.591.471.411.37
IRR (%) 126 90 41
PBP (years) 1.48 1.65 2.51
CapsicumNPV INR LAKH)12.9510.559.2512.8710.469.178.506.214.99
B:C ratio1.621.571.541.611.561.531.331.271.23
IRR (%) 85 83 28
PBP (years) 2.07 2.09 4.04
Gerbera-roseNPV (INR LAKH)18.0614.9613.2517.0513.9812.2812.689.738.11
B:C ratio1.691.631.591.621.561.531.401.331.29
IRR (%) 83 66 32
PBP (years) 2.03 2.20 3.24
Carnation-capsicumNPV (INR LAKH)21.4917.8915.9320.2716.7114.7715.9012.4610.59
B:C ratio1.751.711.681.681.631.601.461.401.37
IRR (%) 130 93 41
PBP (years) 1.48 1.65 2.51
Table 10. Feasibility analysis of crop combinations cultivated by the farmers under shade net houses for 0.1 Ha area.
Crop CombinationFeasibility CriteriaWith Subsidy on PolyhouseWithout Subsidy
7%10%12%7%10%12%
CapsicumNPV (INR LAKH)10.088.327.377.525.824.92
B:C ratio1.461.441.421.311.271.24
IRR (%) 135 40
PBP (years) 1.32 3.12
TomatoNPV (INR LAKH)2.551.861.50−0.01−0.62−0.94
B:C ratio1.121.101.090.990.960.94
IRR 29 7
PBP (years) 3.20 9.22
Cucumber-cucumber-cucumberNPV (INR LAKH)7.315.945.214.753.452.75
B:C ratio1.291.271.251.171.141.12
IRR (%) 82 27
PBP (years) 2.13 4.03
Capsicum-tomatoNPV (INR LAKH)6.365.174.533.792.682.08
B:C ratio1.301.281.261.161.121.10
IRR (%) 84 24
PBP (years) 2.12 4.17
Capsicum-cucumber-marigoldNPV (INR LAKH)7.696.295.545.123.803.09
B:C ratio1.391.361.351.231.191.16
IRR 101 30
PBP (years) 2.03 3.39
Cucumber-cucumberNPV (INR LAKH)3.692.832.381.120.34−0.06
B:C ratio1.201.171.161.051.010.99
IRR (%) 39 12
PBP (years) 3.06 8.04
Capsicum-cucumber-cucumber-cucumberNPV (INR LAKH)8.867.286.436.294.793.98
B:C ratio1.381.361.341.241.211.19
IRR (%) 118 35
PBP (years) 1.31 3.20
Tomato-cucumber-cucumberNPV (INR LAKH)3.202.411.990.63−0.07−0.45
B:C ratio1.161.141.131.020.990.97
IRR (%) 34 10
PBP (years) 3.15 8.21
Table 11. Estimated parameters of logit regression model.
VariablesEstimates of the Binary Logit ModelMarginal Effects
CoefficientsZ(dy/dx)Z
Dependent variable: PCT (1: if farmer adopts PCT, 0: otherwise)
Age (years)0.4901.350.0061.33
Education (years)2.002 *1.920.025 **2.02
Farm size (ha) −1.081−0.92−0.013−0.90
Household size (No)1.2251.510.0151.51
Ln_Income (INR)4.481 **2.080.056 **2.17
Loan (1 = yes, 0 = otherwise) −0.337−0.12−0.004−0.12
Subsidy (1 = yes, 0 = otherwise)10.65 **2.070.133 **2.14
Distance from market (km) −0.050−0.86−0.001−0.86
Extension contact (1 = yes, 0 = otherwise)1.7510.680.0220.71
Risk orientation index34.05 **2.310.427 ***2.62
District (1 = Pune, 0 = otherwise)−1.660−0.73−0.020−0.72
Constant−124.0 **−2.21
LR chi2(11)254.56
Pseudo R20.935
Prob > chi20.001
Observations (n)200
Note: *** p < 0.01, ** p < 0.05, * p < 0.1; PCT—Protected cultivation technology.
Publisher’s Note: MDPI stays neutral with regard to jurisdictional claims in published maps and institutional affiliations.

