Article

Association between Perceptions of Personal Income and National Security: Evidence from the Baltic States

by
Gitana Dudzevičiūtė
*,
Dalia Prakapienė
and
Vida Česnuitytė
General Jonas Žemaitis Military Academy of Lithuania, LT-10322 Vilnius, Lithuania
*
Author to whom correspondence should be addressed.
Sustainability 2022, 14(12), 7387; https://doi.org/10.3390/su14127387
Submission received: 14 May 2022 / Revised: 30 May 2022 / Accepted: 13 June 2022 / Published: 16 June 2022
(This article belongs to the Special Issue Economic Inequality, Regional Disparities and Sustainable Development)

Abstract

:
The purpose of this investigation is to explore the effect of objective and subjective personal income on perceived national security in the Baltic states, including Lithuania, Latvia, and Estonia. A representative quantitative survey was conducted in three Baltic countries in August 2021. The fieldwork was carried out by the public opinion and market research company Baltic Surveys. The sampling method in the three countries was the same: the probability multi-stage structural method, based on criteria of geographical region, size of settlement, gender, and age. The survey involved more than 1000 respondents per country. Multivariate statistical analysis, including correlation analysis and linear regression analysis was performed. The percentage distribution of the variable on the perception of safety reveals that more than half of the respondents in all Baltic countries agreed that they feel safe living in their own country. Moreover, it is notable that the feeling of safety in Estonia is higher than in the other two countries. Meanwhile, in Lithuania, the evaluation of the feeling of safety is lower than in Estonia and Latvia. The association of the feeling of safety in the country with the subjective perception of income is stronger than the objective income. Additionally, it is important to note that absence of financial difficulties, happiness with current income, and not worrying too much about spending on necessities are the strongest determinants for perceived security in each Baltic country. The findings that have been drawn from this investigation could be applied to ensure both national and economic security and the achievement of the Sustainable Development Goals 2030, such as no poverty (1SDG) and reduced inequalities (10 SDG).

1. Introduction

The concept of national security is quite broad and encompasses the diverse perspectives of scholars. National security is often interpreted as a multifaceted systemic construct covering many variables or areas of activity. It must, admittedly, be noted that with the development of the concept of national security, security was mostly measured in terms of military power and capabilities. This concept is broadly in line with the traditional (realism) approach [1]. However, over time, the concept of national security content has expanded. Buzan [2] attempted to broaden the scope of security, stating that security studies should not be limited to the military aspect, and proposed five aspects of security: military, environmental, economic, political, and societal [2]. Holmes [3] uses the concept of nonmilitary national security and has expanded the list of key security areas to include areas such as political security, economic security, energy and natural resources security, homeland security, cybersecurity, human security, and environmental security. Such a holistic conception of national security was supported by Chandra and Bhonsle [4], who stated that there is no area of public life that would not affect national security. Therefore, no single area of socio-economic life can be considered hierarchically as a determinant of national security. The concept of national security is inseparable from individual security. Buzan [2] states that the essence of individual security lies in the context of the links and contradictions between personal security and state security. The state is the main source of public security. Individual security is often associated with economic security, which is one of the key components of national security. It should be noted that security at the individual level is further subdivided into objective and subjective security, which can be measured by objective and subjective indicators, respectively. However, these concepts are not very clearly defined in the scientific context. According to Nussbaum and Sen [5], objective security refers to reports of factual conditions and overt behavior, whereas subjective security stands for measurement of attitudes. In the field of security research, these concepts are perceived as: objective security means being safe and subjective security means feeling safe [2,6]. However, the image formed in the public consciousness does not always coincide with the real, objective situation. It should be noted that economic security of the individual, which is often associated with income [7,8], can also be perceived through the prism of subjectivity [9,10,11,12]. Citizens are at the center of national security strategies, but little is known about the interrelation between any individual’s objective and subjective financial well-being and his/her perception of national security. This paper presents a unique examination of public perceptions of national security based on personal income as a key factor in economic security. Thus, the study examines how an individual in a society evaluates his/her individual and national security from the individual’s objective and subjective perspectives.
The aim of the research is to explore the interrelation of personal income with the perception of national security in the Baltic states, namely Lithuania, Latvia, and Estonia. A low level of income of an individual limits his/her consumption, which can have negative consequences, including lack of opportunities to participate in public life, social exclusion, and sometimes existential problems [13]. Low income levels, poverty, and social exclusion are among the most critical areas in the Baltics. These areas are inseparable from national security. Unresolved social problems can, in the long run, transform into riots, conflicts that endanger the well-being, health, and lives of members of a society. Therefore, the economic security of the individual, which is often assessed through the prism of income, is closely linked to national security. There is a lack of research in the scientific context to assess the links between an individual’s income and the perception of national security.
The investigation includes the following sections: literature review, methodological approach, research results and discussion, and, finally, conclusions.

2. Literature Review

2.1. Aspects of National Security

In a more general sense, the concept of national security is associated with the ability of a state to preserve its independent identity and functional integrity against forces it considers hostile [3,14]. Kośmider [15] provides an even broader view of national security, stating that national security can be understood as an area of knowledge that not only explains the mechanisms of governing the provision of order and stability of human communities, but also as the art and science of effective survival in time and space. It is therefore important in this context to emphasize the importance of the previously stated objective and subjective security. Janušauskienė et al. [16] singled out several variations when analyzing the possible options of the objective and subjective security relationship. The first is a situation where objective and subjective security overlap and, in both cases, it is safe: the individual is and feels safe. The second is a situation where objective and subjective security do not overlap: objectively, it is not safe, but the individual feels safe. The third is a situation where objective and subjective security do not overlap, but this is the opposite of the above: it is objectively safe, but the individual does not feel safe. The fourth is a situation where objective and subjective security overlap and in both cases, it is not safe: the lack of security is objective and the individual does not feel safe. This is supported by Banasik [17], who states that security becomes dependent on the subject matter, perception of threats, protected values, and the measures used to provide it. When it comes to the concept of security and its impact on society, we inevitably face a negative aspect—threats [17], which arise for everyone in both the internal and external environment. However, the threat ceases to be associated only with war. Perceptions of threat and security cover a much wider range of factors: natural disasters, the spread of viruses, criminal activities, cyber attacks, health, personal security, social guarantees, living standards, etc. In other words, perceptions of security are related to citizens’ feelings about the risks associated with security incidents and the magnitude of their consequences [18]. Such experiences shape an individual’s attitude and behavior—a reaction to certain situations.
Given that those reactions, behaviors, or perceptions of a situation may be completely different for each individual, and relate to real or imagined threats, the study in this article focuses on the analysis of subjective perceptions of threats. Subjective security researchers note that perceptions of security threats are often determined by an individual’s personal experience of daily life [19,20]: the social safety nets provided by the family, community, and welfare state; experience with a range of socioeconomic risks, including lack of income and wealth, educational qualifications and employment [21], as well as evaluation of criteria such as government effectiveness, trust in power, and individual security [12]. According to Wills-Herrera et al. [22], perceptions of insecurity are manifested to the person as fears of losing control of their lives, loss of property, loss of social relationships, or even loss of their life.
However, when analyzing individual subjective safety, it is apparent that it is not appropriate to analyze this phenomenon as a separate element, as it is part of a larger system. This is supported by Varga [23], who states that it is necessary to examine security in a comprehensive, multidimensional manner, a standpoint that takes into account human and individual security as well. Sajeva [24] stated that security, hardly achievable individually, is the result of more holistic thinking. Individual security and freedom imply the security and freedom of all. Development, well-being, security, and freedom are strictly interrelated. It is likely that a positive outcome can be achieved through the effective management of national security, which depends largely on political decisions that affect the social, economic, and political areas. Security is ensured through the prism of the common functioning of institutions and society, that is, cooperation that creates a sense of stability for both individuals and social groups and directly relates to fulfilling very important conditions of completeness, suitability, exclusiveness, feasibility, and acceptability [25]. Research has established that among the domains contributing significantly to the well-being of individuals is satisfaction with current and future security [26]. It must be acknowledged that factors such as economic prosperity, democracy, and the commitment of the state to guarantee a decent life for everyone are important for ensuring national security [27]. In other words, it relates to the specific policies pursued by the state and the activities of its institutions, which should ensure the socio-economic well-being and the security of its citizens.

2.2. Economic Security and its Association with National Security

In the last decades, in the process of globalization and economic integration, the connection between economic and national security has become increasingly closer and more obvious [28,29,30]. The Baltic countries are no exception—Lithuania, Latvia, and Estonia, where economic security is identified as one of the priorities of national security policy.
The concept of economic security originated in economics and political science. As early as the 1930s, the concept of economic security that developed in the United States has always been important and has become increasingly important in the face of economic problems [31]. To date, there is no unified concept of economic security; therefore, in the scientific literature [28,30,31,32,33,34,35], the concepts of international organizations and institutions [36,37] and the remarks by politicians are dominated by different approaches to economic security. Researchers [38] acknowledge that areas of national and economic security are complex, encompassing a number of interrelated factors, with close causal links. Dudin et al. [39] state that economic security can be described as the complicated indicative system that includes national interests in the sphere of the economy, as well as threats and threshold values of economic security indicators. Retter et al. [30] explain threats to national security through “risk vectors” that highlight the ways in which economic factors and national security components interact. Although national security is still traditionally perceived through the prism of military conflicts [1], it is increasingly recognized that economic factors, such as income, employment, realization of skills and abilities, social exclusion, poverty, etc., have an important impact on the well-being of the individual and society, and the concepts of “development” and “stability” of the economy are associated with ensuring these factors [40].
Rothschild [41] proposed extending the concept of security from nations to the security of individuals. The International Labour Office [36] also paid special attention to the economic security of the individual. Economic security is based on an individual’s social security, which is linked to access to basic needs infrastructure for work, health, housing, education, information, and social security. According to International Labour Office [36], all human beings need a sense of security, stability, and a sense of direction. Individuals who lack security in themselves, in their families, and in their workplaces tend to become socially irresponsible. At the individual level, economic security includes income security, labor market security, employment security, work security, skills security, job security, and voice representation security [36]. According to Tamošiūnienė and Munteanu [32], economic security is a priority element of modern national security that can emerge in any modern society. The views of the aforementioned researchers are in line with those of the International Labour Office [36], and they recommend distinguishing between two approaches to economic security: individual and macroeconomic. An individual approach to economic security is linked to a person’s stable income to maintain a certain standard of living in the present and for the foreseeable future. The macroeconomic approach to security includes the country’s economic vulnerability and level of resistance. According to Kosny and Piotrowska [13], when describing the situation of households, the problem of economic security is often associated with poverty. Low household income limits consumption, which has negative consequences, including lack of opportunities to participate in social life, social exclusion, and sometimes existential problems. According to scientists, in the context of economic security, the key issue is not the level of consumption, but ensuring its stability. For most people, the ability to maintain their current income level is far more important than the opportunity to increase their income in the future. Lack of income and financial resources make households more vulnerable, which is a concern for the state’s national security. Economic security enables individuals to plan and invest in their future, encourages innovation, reinforces social connections and builds trust in others and in institutions [37].
Some scholars [33,34,35] single out the financial security component when examining aspects of economic security. In the scientific investigation of Piotrowska [33], financial security of a household is defined as the ability to achieve the income necessary for covering needs and for accumulating financial reserves to call on in case of unfavorable accidents, such as job loss, sickness, or family breakdown. As Ahmad and Sabri [35] point out, financial security involves a number of areas, including consumer spending, saving, use of credit, retirement planning, and investments. A causal relationship exists between increases in financial security and consumer life satisfaction. Financial security ensures the ability to resist successfully against internal and external threats [34]. Related studies show that income not only allows individuals to purchase goods and services [42,43] but it also goes hand in hand with happiness and life satisfaction [44,45,46], which are linked to better national economic performance [45,46].
According to the United Nations [37], public feelings and perception of security often draw on an individual’s past experience. Negative experiences of economic shocks create insecurity, which can be caused by actual risks or can be based on public perceptions. As Stevens and Vaughan-Williams [47] revealed, there is uncertainty about the reasons for any individual’s perception of threats. Their investigation has shown that the British public perceive the most threats at the global level and the least at the community and personal levels. Moreover, the kinds of threats they identify as community or personal tend to differ from global or national. A study by Schyns [48] examined individual and contextual determinants of life satisfaction in 42 countries. The findings showed that the economic prosperity of a nation contributed to a person’s life-satisfaction level. Moreover, the investigation found that poor individuals living in poor countries were less satisfied with their lives than poor individuals living in affluent countries. Even more, poor people varied more in their life satisfaction than rich people. In terms of both national and economic security, a gap exists between the reality of security and the individual’s perception of security [49]. According to Inglehart and Norris [21], feelings of insecurity are stronger among the most vulnerable groups in society, such as the elderly, the poor, women, and the less educated.
Security is both a reality and feeling. These two aspects are interrelated and they affect each other, although they do not always overlap [18]. According to Stoetman [49], the reality of security is more mathematical, based on the probability of different risks. The feeling of security is based on individuals’ psychological reactions to both risks and countermeasures. The same problem arises when examining the concept of welfare. As Delhey et al. [50] have pointed out earlier, the welfare of the individual and society can be perceived both through objective factors (income and income distribution) and through subjective ones (income satisfaction). In terms of the distinction between objective and subjective security, security images formed in an individual’s consciousness do not necessarily coincide with the objective reality of security. As a result, people may feel safe in situations of complete insecurity and, conversely, they can feel insecure even in the safest environment [16]. Berger-Schmitt and Noll [51], in their working paper, presented a German quality-of-life approach combining objective living conditions (work, health, and social relations) and subjective well-being (evaluations of living conditions), which includes cognitive and affective components. Based on this approach, four typologies of welfare are distinguished in societies. The combination, which includes objectively good living conditions and high subjective well-being, is called well-being. Good living conditions and low subjective well-being is described as dissonance. Poor living conditions and high subjective well-being is called adaptation. Poor living conditions and low subjective well-being is denoted as deprivation [51]. Subjective well-being associated with happiness, as has been defined by Veenhoven [52], is the degree to which an individual favorably assesses the overall quality of his/her life as a whole [53]. Vladisavljević and Mentus [11] state that life satisfaction is more related to the material living conditions, such as income, unemployment, and housing conditions, while affective well-being is more related to nonmaterial indicators of well-being, such as perceived health, personal security, and social connections.
In summary, economic security is one of the key components of national security. Areas of national and economic security are complex, encompassing a number of interrelated factors, with close correlations and causal links. An objective and subjective perception of income plays an important role in achieving a sense of security. Despite the summarized advances in understanding of national and economic security, we know little about the effect of objective and subjective income on perceived national security. Therefore, the following chapters focus on the aforementioned aspects.

3. Methodological Approach

In the empirical research, the following hypothesis is formulated: both objective and subjective living conditions, represented by personal income, are significant determinants influencing sense of national security among the population. At the same time, objective living conditions (personal income) is a more important determinant for the sense of national security than subjective living conditions. Aiming to test the hypothesis and to identify exact determinants influencing the sense of national security in the population, a representative quantitative survey in three Baltic countries—Estonia (further in text—EE), Lithuania (further in text—LT), and Latvia (further in text—LV) was conducted in August 2021. The fieldwork was carried out by the public opinion and market research company Baltic Surveys. The general population considered in the sampling differ in the countries was: in Estonia—habitants 15 years old and above, in Lithuania and Latvia—18 years old and above. Nevertheless, the sampling method in all three countries was the same—the probability multi-stage structural method [54], based on criteria of geographical region, size of settlement, gender, and age. This way, in Estonia, 1003 respondents, in Lithuania, 1006 respondents, and, in Latvia, 1017 respondents were questioned. After some manipulations with the variables necessary for the international comparative analysis, as well for optimization of analysis and interpretation of the results, one database with 3026 cases in total was created and explored. For correction of the empirical data in accordance to the initial representative sample in each country, weights were applied in all calculations.
The research instrument consists of eight main questions and, additionally, questions on socio-demographic characteristics. Among the former, the first question concerns perception of national security and is formulated in the form of statement: “I feel safe living in my own country.” With the 5-point scale, 1 = totally disagree and 5 = totally agree.
The next six questions concern subjective living conditions, represented by perception of personal income. These questions are also formulated in the form of statements, and the respondents are asked to evaluate them with the above-mentioned 5-point scale. The statements are the following:
(a)
I am happy with my current income.
(b)
My current income allows me to purchase food and other necessities without worrying too much about expenses.
(c)
I have no financial difficulties in paying utilities, rent, bank loans, leasing, and other liabilities.
(d)
I can spend money on leisure, travel, entertainment, and development.
(e)
My current income allows me to set aside part of my income for savings.
(f)
I can afford to help other people asking for financial help.
For the identification of objective living conditions, one question is formulated on income per household (further in the text—HH) member per month. Because of the sensitivity of the question, the respondents were asked to mark an interval into which income of their HH falls. In the standard questionnaires suggested for the respondents in Estonia, Lithuania, and Latvia, these intervals differ, though in this investigation they were regrouped and coded into three following intervals: 1 = Up to EUR 500, 2 = EUR 501–EUR 1000 Euro, and 3 = EUR 1001 and above. The most optimal for the international comparison and interpretation of the results intervals were selected. The additional measure 9 = N/N means that for various reasons there is no answer.
Variables based on all above-described questions were explanatory (or independent) variables in the analysis.
Among socio-demographic characteristics, the first concerns the age of respondents. The respondents were asked to write the number of their actual years of age. This way, in Estonia, respondents indicated ages between 15 and 93 years; in Lithuania, respondents indicated ages between 18 and 90 years; and in Latvia respondents indicated ages between 18 and 75 years. In this research, age numbers were regrouped and coded into three following intervals: 1 = up to 29 years old, 2 = 30–49 years old, and 3 = 50 years old and above. The most optimal age intervals were selected.
Next, the respondents were asked about their education level. An extended scale of education levels was suggested in the questionnaire. In this research, for the optimization of analysis and interpretation of the results, the scale is regrouped and coded into three following groups: 1 = basic or lower education, 2 = secondary and/or professional education, and 3 = university.
The next socio-demographic characteristic is household size. The respondents were asked to indicate the number of persons who live in their HH. This way, in Estonia, respondents indicated a number between 1 and 10 or more persons; in Lithuania, respondents indicated a number between 1 and 8. In this research, for the optimization of analysis and interpretation of the results, these numbers were regrouped and coded into the following intervals: 1 = live alone, 2 = two persons, 3 = three persons, and 4 = four or more persons.
The last socio-demographic characteristic is the size of the settlement where the respondent lives. The respondents were asked to mark on three measures: 1 = big city, 2 = another city, and 3 = village. The category “big city” included cities like Tallinn, Tartu, Pärnu, Narva, and Kohtla-Järve in Estonia, while in Lithuania and Latvia, this category included the capital cities only, i.e., Vilnius in Lithuania and Riga in Latvia.
Variables based on all above-described socio-demographic characteristics were control variables in the analysis. Analysis of the empirical data starts from the descriptive statistics [54,55]. Due to the limitation of the volume of the paper, the descriptive statistics are not discussed and only presented in Appendix A Table A1 and Table A2. For all variables, distribution frequencies are presented in percentages. When it was reasonable, for selected variables, particularly for evaluations of perception of national security, and subjective living conditions, means of the values were calculated. For comparison of selected means, the ANOVA test was run. The latter test compares the mean values of two or more measures; the higher the value of the Fisher (F) coefficient, the higher the difference between the compared measures; and, conversely, when the value of F approaches zero that means a difference between the measures’ means does not exist [56].
To test the hypothesis, a specific econometric model [54] was created:
Y = a + b1 × X1 + b2 × X2+ …+ b11 × X11,
where a is constant (y-intersect); Y—dependent variable (“I feel safe living in my own country.”); X1—explanatory (or independent) variable related to the statement (a); X2—explanatory variable related to the statement (b); X3—explanatory variable related to the statement (c); X4—explanatory variable related to the statement (d); X5—explanatory variable related to the statement (e); X6—explanatory variable related to the statement (f); X7—explanatory variable related to income per HH/per month; X8—control variable related to age of respondent; X9—control variable related to education level of respondent; X10—control variable related to household size, and X11—control variable related to size of the settlement, b1,…,b11—regression coefficients of the according variables Xi, when i = 1,…11.
Accordingly, a multivariate statistical analysis was conducted [56,57]. First, the method of correlation analysis was used to check the normality of distributions of dependent and explanatory variables, and the linearity of possible association between them. In general, correlation analysis measures the strength and direction of association between variables, among which may be rank order (ordinal and interval-ratio) variables [55,56]. The results of the correlation analysis (r) ranges from −1 to 1. The absolute values of r indicate the strength of the linear association between the two variables: r is closer to 1 where a stronger relationship exists, and r is closer to zero where a weaker relationship exists. Meanwhile, the signs ‘+’ or ‘−’show the direction of this relationship: a figure of ‘+1’ means that the two variables have a perfect positive association, while ‘−1’ means that the two variables have a perfect negative association, and zero indicates no association between the two measured variables. In our research, the Pearson correlation was carried out among the variables of perceptions of national security, and variables on objective and subjective living conditions. The results (Table 1) revealed the existence of a linear association between the variables; therefore, analysis moved to linear regression analysis.
In general, the method of linear regression analysis measures how much a dependent variable depends on explanatory and control variables [55,56,58]. In this investigation, eight linear regression analysis models were carried out. Prior to the application of regression, collinearity diagnostics to test a possible problem of multicollinearity were conducted [56,58]. Four main measures were taken into consideration: eigenvalue, condition index, tolerance, and a variance inflation factor (VIF). According to the literature [56,58], the closer to 0 measures of eigenvalue, the higher the intercorrelation of the predictors, and the possibility that a small change in the data values may mean large changes in the results of estimations. A condition index greater than 15 indicates a possible problem with collinearity; an index greater than 30 means a serious problem of collinearity. The closer to 0 measure of tolerance, and the higher the possibility of multicollinearity, and the inflation of the standard error of the regression coefficients. A variance inflation factor greater than 2 usually means a problematic situation with the multicollinearity. In our research, the measures of eigenvalue vary between 0.034 and 10.753; and measures of the condition index vary between 1.000 and 14.716. That means that a problem of multicollinearity does not exist, though measures of tolerance (varying between 0.289 and 0.957) and VIF (varying between 1.045 and 3.466) reveal some risk of the multicollinearity. To avoid such a problem, manipulations with the explanatory variables are continued by application of the factor analysis method.
In general, the method of factor analysis helps to model (or rearrange) the observed variables as linear functions into the “factors” [56,57]. For extraction of factors in our research, the principal components method was used, based on a fixed number of factors (n = 3), and Varimax rotation with Kaiser normalization. The results of the factor analysis were saved as new variables in the empirical database. The first factor F1 is titled “Perception of income via possibilities/activities beyond the HH” and is mostly associated with the statements: “I can afford to help other people asking for financial help”, “My current income allows me to set aside part of my income for savings”, and “I can spend money on leisure, travel, entertainment, and development” (Appendix A Table A3). The second factor F2 is titled “Perception of income based on material conditions to fulfil daily needs” and is mostly associated with the statements: “I have no financial difficulties in paying utilities, rent, bank loans, leasing, and other liabilities” and “My current income allows me to purchase food and other necessities without worrying too much about expenses.” The third factor F3 is titled “Unconditional perception of income” and is mostly associated with the statement: “I am happy with my current income.”
The latter three new variables were included into the improved econometric model:
Y = a + b1 × X1 + b2 × X2+ … + b8 × X8,
where a is constant (y-intersect); Y—dependent variable (“I feel safe living in my own country.”); X1—explanatory variable based on factor F1; X2—explanatory variable based on factor F2; X3—explanatory variable based on factor F3; X4—explanatory variable related to income per HH/per month; X5—control variable related to age of respondent; X6—control variable related to education level of respondent; X7—control variable related to household size, and X8—control variable related to size of the settlement, b1,…,b8—regression coefficients of the according variables Xi, when i = 1,…8.
Now, measures of eigenvalue vary between 0.040 and 5.671; and the measures of the condition index vary between 1.000 and 11.852, i.e., it is less than 15 (Appendix A Table A4). The measures of tolerance vary between 0.697 and 0.974, i.e., rather distant from 0; meanwhile measures of the VIF vary between 1.026 and 1.436, i.e., no one measure exceeds 2 (Appendix A Table A5). That means manipulations with factor analysis let us avoid risk of the multicollinearity.
Next, we conducted linear regression analysis with total cases, as well as separately for each analyzed country (Table 2). The dependent variable in all these models is the same—perception of national security expressed by the statement, “I feel safe living in my own country.” Meanwhile, independent variables in some regression analysis models are explanatory variables only (Model 1, Model 3, Model 5, and Model 7), while in other regression models control variables included additionally (Model 2, Model 4, Model 6, and Model 8). For inclusion of exploratory and control variables into the regression models, an enter method was applied. The latter method means all variables are entered into the model in a single step [55]. An interpretation of regression results is similar to interpretation of correlation results: the result of the regression analysis, in our case—standardized coefficient beta (β) ranges from −1 to 1; the closer β is to −1 or 1, the stronger the dependent variable depends on the explanatory variable; and the closer β to zero, the less the dependent variable depends on the explanatory variable. The signs ‘+’ or ‘-’show the direction of this relationship of dependence: a figure of ‘+1′ means perfect positive dependence, ‘−1′ means perfect negative dependence, and zero indicates no dependence between the two measured variables.

4. Research Results and Discussion

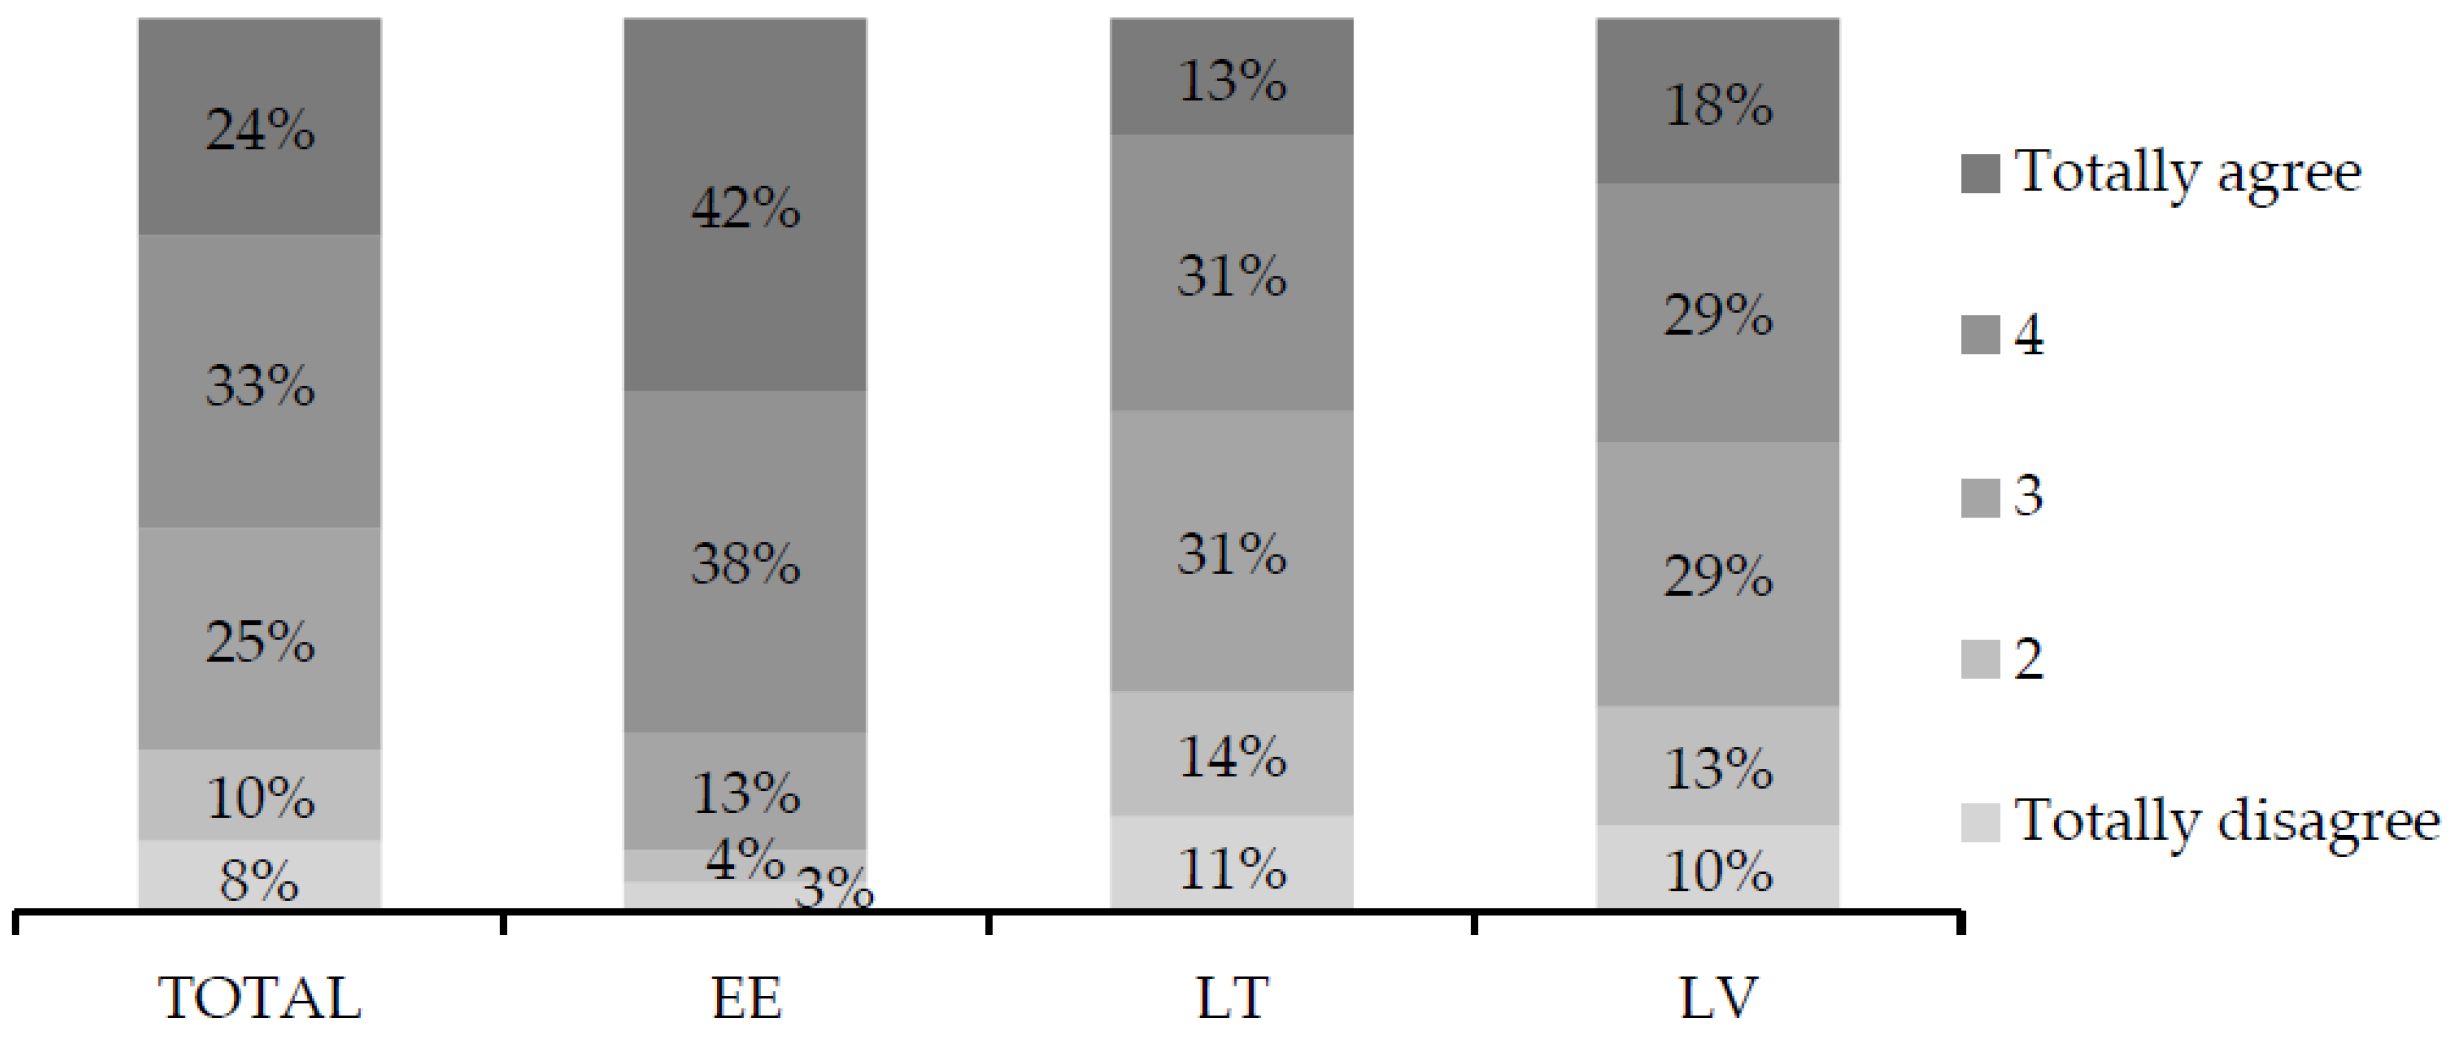
The percentage distribution of the variable on perception of national security reveals that more than half of the respondents in all the Baltic countries agreed that they feel safe living in their own country and, among all the respondents, 24% totally agree with such a statement (Figure 1). Only 8% of the respondents stated that they totally disagree about feeling safe living in their own country.
The total mean of evaluations in the 5-point scale (where 1 = totally disagree and 5 = totally agree) is 3.6. Results in separate countries show that population opinions differ somewhat: in Estonia the mean measure is equal to 4.1, in Lithuania it is 3.2, and in Latvia 3.3. Meanwhile, the ANOVA test shows that such a difference is rather big and statistically significant (F = 187.983, p < 0.001). The latter results point to a need for the hypothesis to be tested precisely, considering not only total measures but also measures for each country (Estonia, Lithuania, and Latvia) individually.
Furthermore, for analysis of the association between the perception of national security and actual (or objective) income, as well as subjective perception of income, the Pearson correlation analysis has been conducted. The results provided in Table 1 show positive associations between feeling safe in the country and both objective and subjective perceptions of personal income. All measures are statistically significant. Therefore, it can be stated: the higher the objective perception of personal income, the more people feel safe in their country; and, conversely, the lower the objective perception of personal income, the less people feel safe in their own country.
The results of correlation analysis (Table 1) also show the strongest association between the feeling of safety and the subjective perception of income, particularly, happiness with their own current income (r = 0.344) and having no financial difficulties in paying utilities, rent, bank loans, leasing, and other liabilities (r = 0.343). A lower, but still rather strong association is between feeling safe in the country and having income that allows an individual to purchase food and other necessities without worrying too much about expenses (r = 0.315), with the possibility of spending money on leisure, travel, entertainment, and development (r = 0.300). Meanwhile, feeling safe in one’s own country is associated with an objective perception of income (r = 0.206), with current income that allows them to set aside part of their income for savings (r = 0.264), as well with the possibility of helping other people asking for financial help (r = 0.227). These associations are rather weak, but still statistically significant. That is, the association of the feeling of safety in the country with the subjective perception of income is stronger than the objective perception of income. On the other hand, among subjective perceptions of personal income, some individuals more strongly than others associate this with a feeling of safety in the country. It seems that considerations related to the current situation, and the possibility of fulfilling individual and/or HH needs, are among the more important subjective living conditions for a feeling of safety.
The above results of the ANOVA test and 
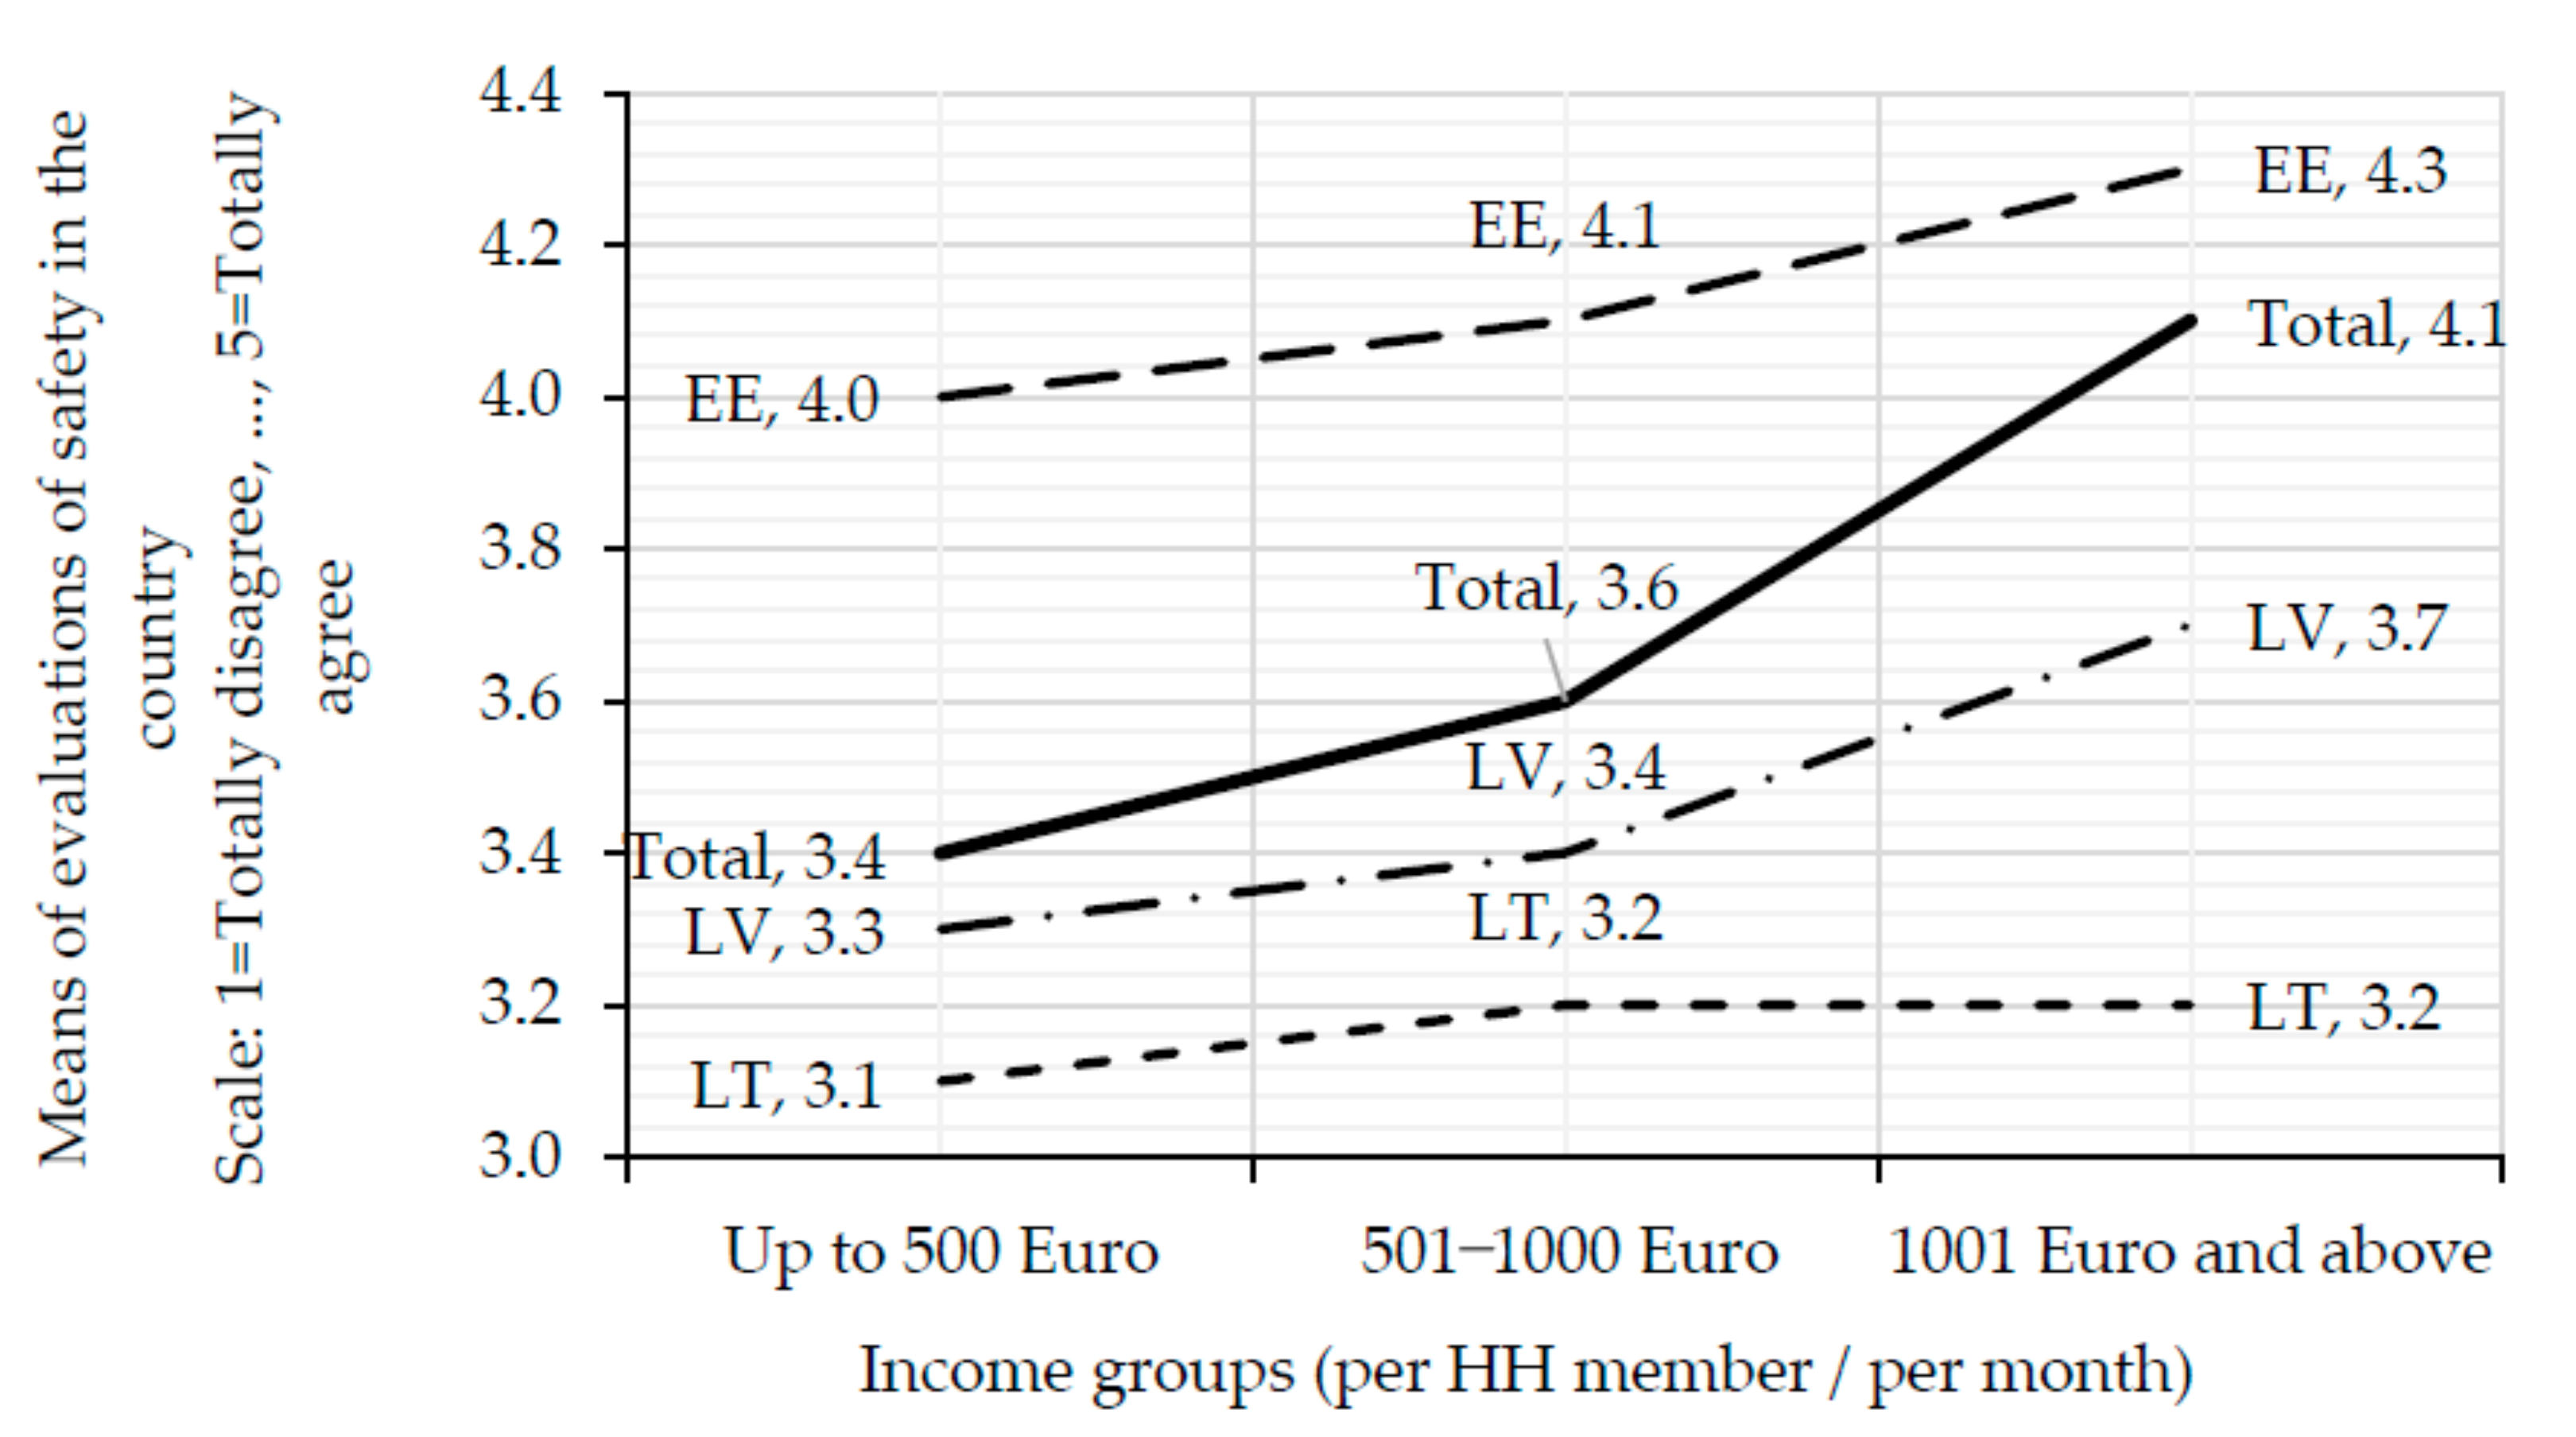
Table 1 strengthen the case for the hypothesis to be tested precisely and separately for each country selected for analysis. Therefore, for each country the means of evaluation of feeling safe in the country according to income per HH member/per month were calculated (Figure 2). The results, first of all, show that evaluations of feeling safe are independent of income and are highest in Estonia, close to average in Latvia, and lowest in Lithuania. On the other hand, a linear increase in a feeling of safety evaluations together with an increase in income is evident in Estonia (means from 4.0 to 4.3) and Latvia (means from 3.3 to 3.7). Meanwhile, in Lithuania, such an increase in safety evaluations is not so evident (means from 3.1 to 3.2), although even such a small increase is associated with an increase in income. So, it could be presumed that a feeling of safety does depend on measures of objective personal income.
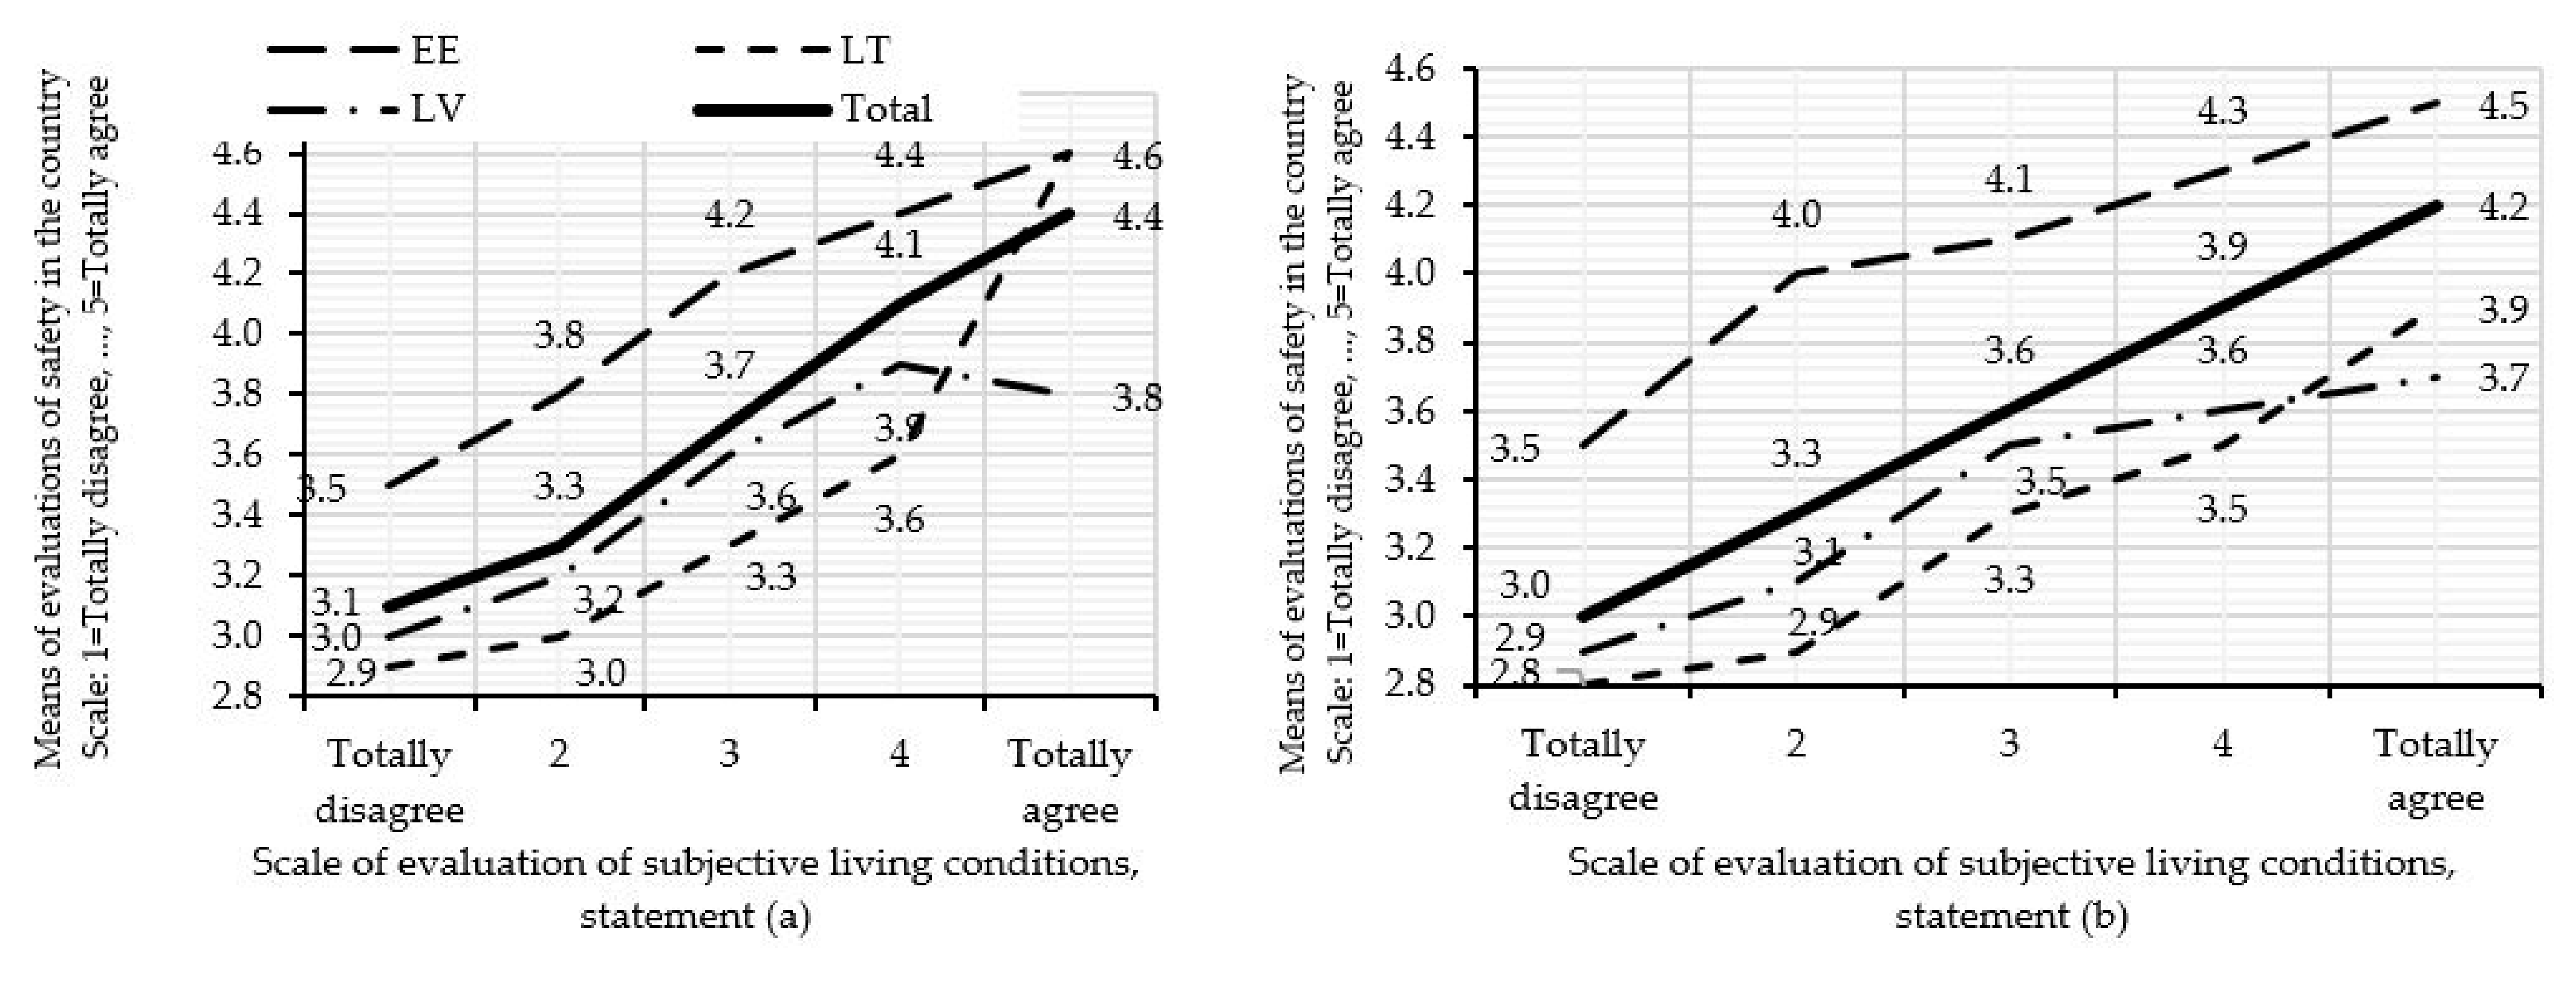
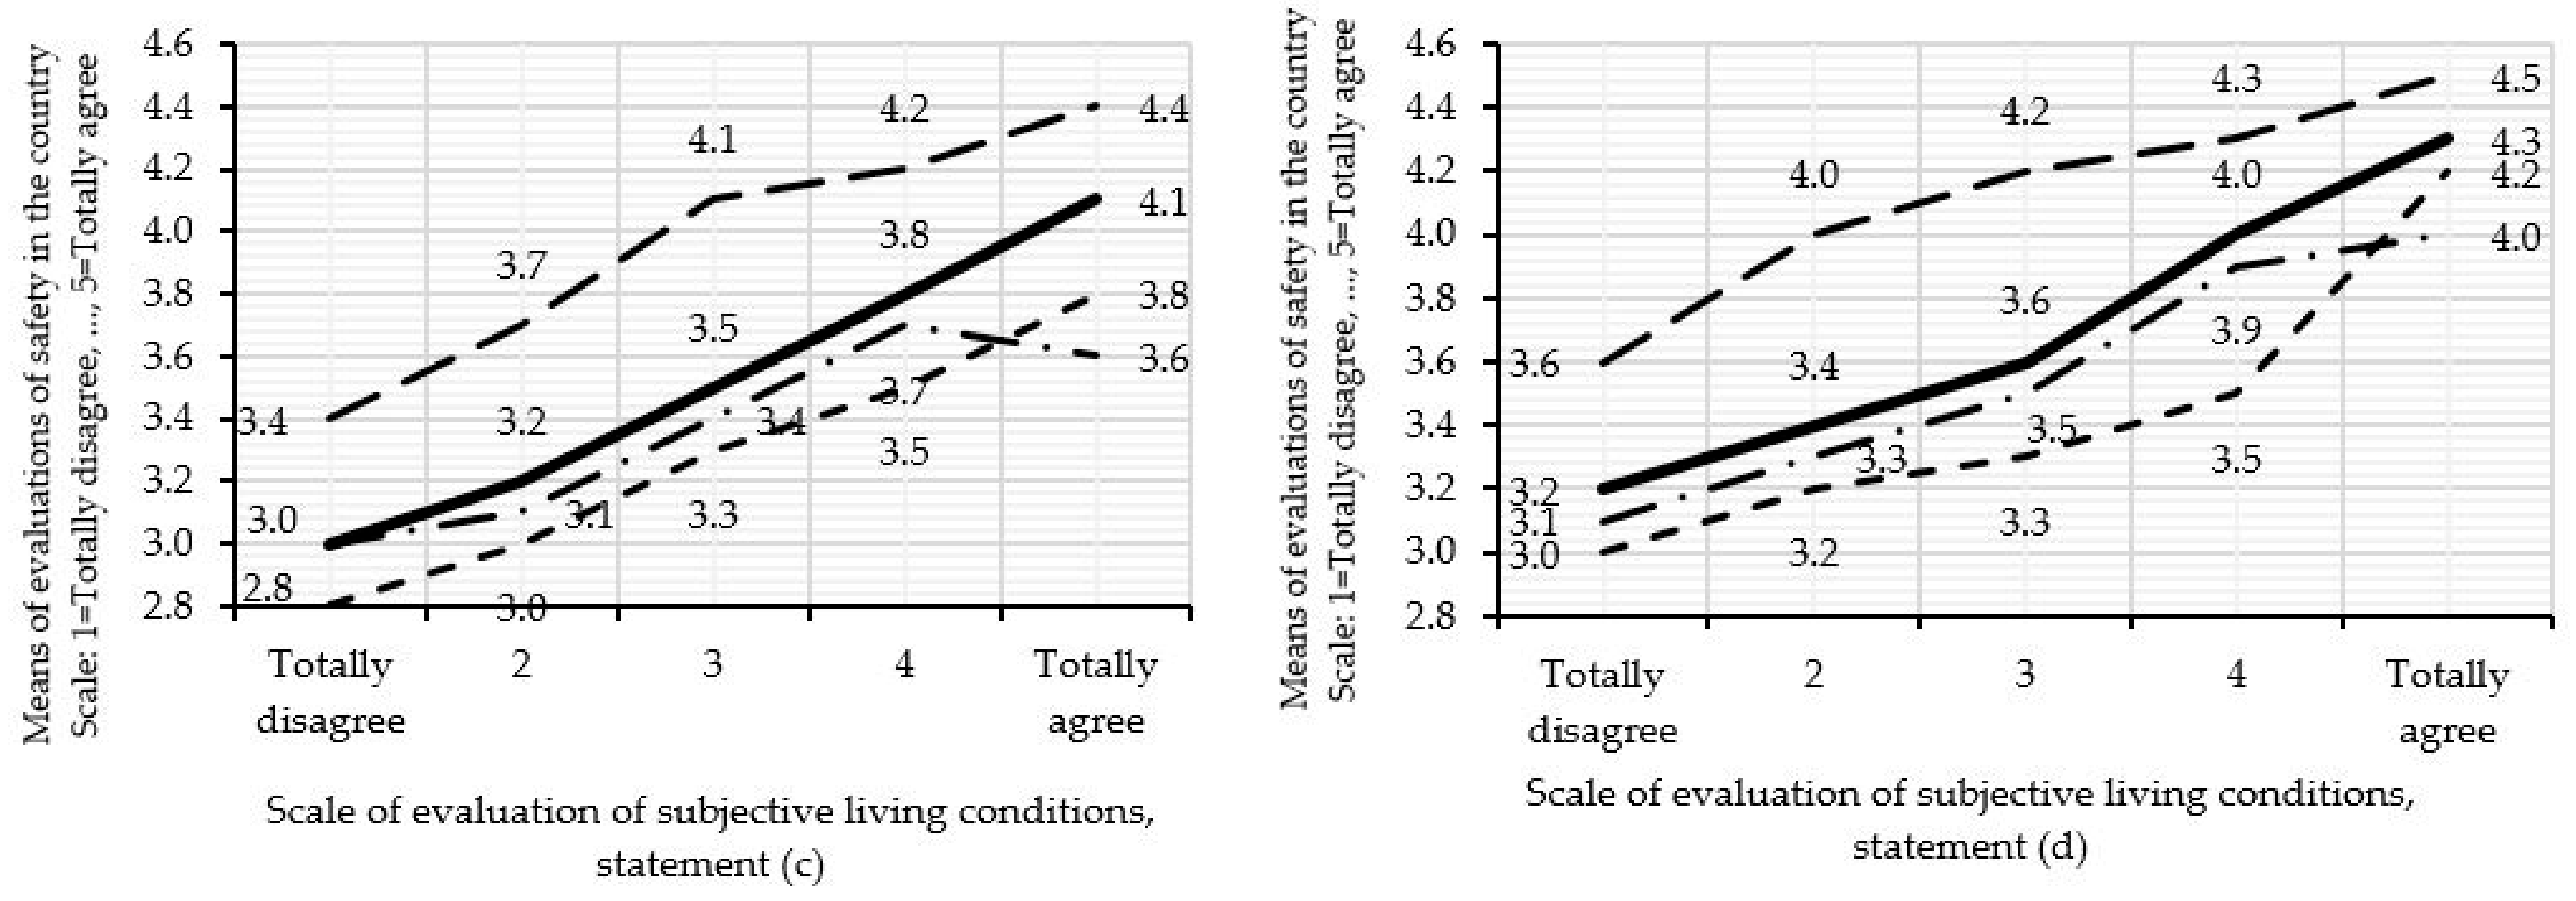
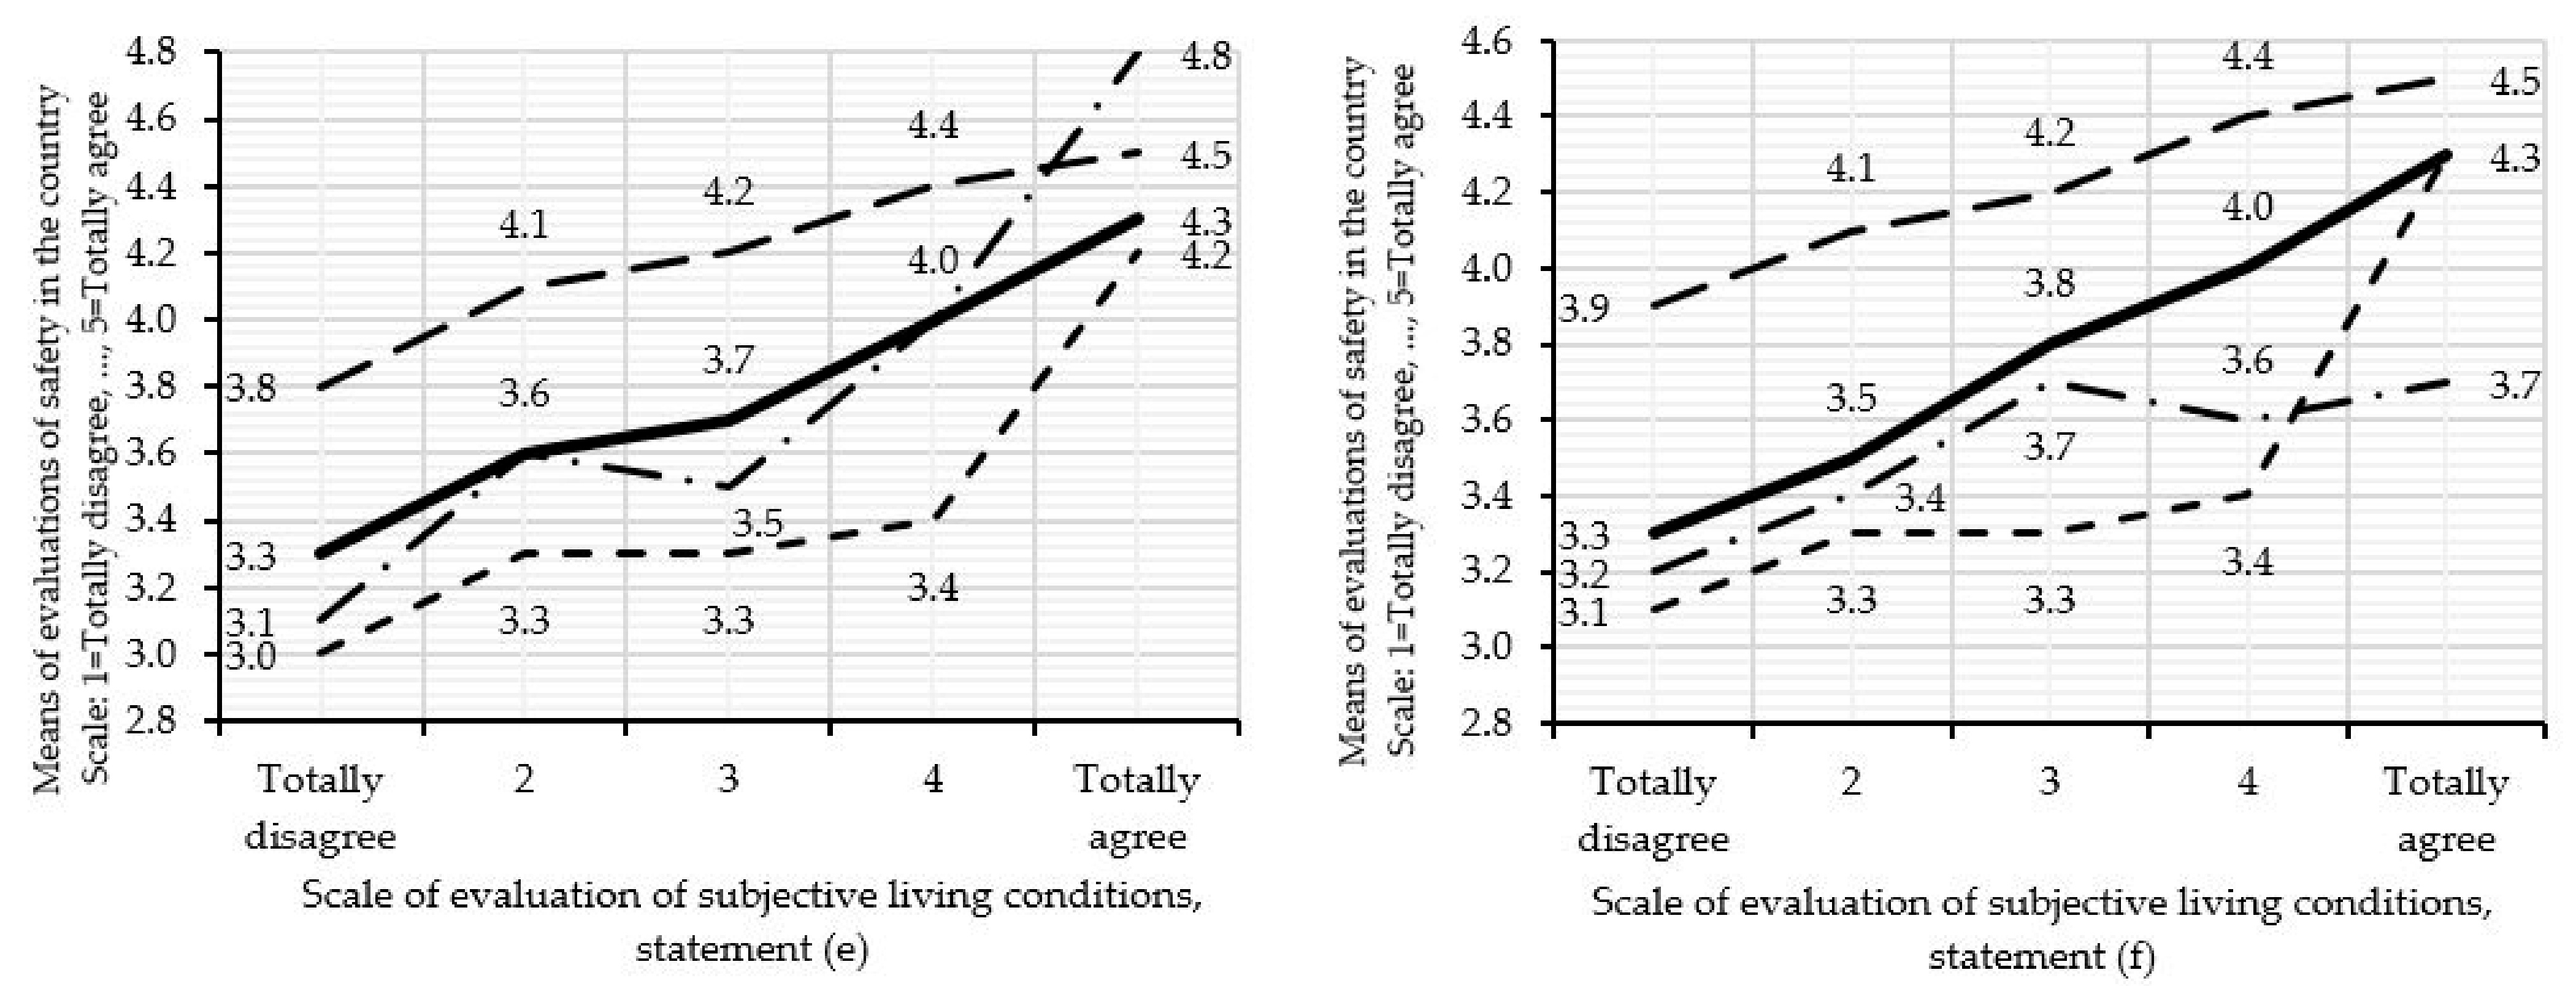
Furthermore, the association between the feeling of safety and the subjective perception of personal income in each Baltic country is reviewed. The results provided in Figure 3 show an evident general trend: the higher the evaluation of a particular statement related to subjective perception of income, the higher the evaluation of the feeling of safety in the country. At the same time, it is evident that the evaluation of the feeling of safety in Estonia is higher than in the other two countries; meanwhile, in Lithuania, conversely, the evaluation of the feeling of safety is lower than in the other two countries. On the other hand, precise analysis shows that, in Latvia, evaluations of the feeling of safety often vary, especially in the high point of subjective perception of income. Even so, the above-mentioned linear association between the feeling of safety and subjective living conditions represented by personal income remains.
For identification of the determinants that influence the feeling of safety in the Baltic countries, linear regression analysis has been conducted (Table 2). Results of the regression analysis for all the Baltic countries allow us to state that the feeling of safety statistically significantly depends as much on subjective perception of income as on objective personal income (Model 1 in Table 2). On another hand, feeling safety stronger than on other explanatory variables depends on the factor F2, “Perception of income based on material conditions to fulfil daily needs” (β = 0.254, p < 0.001) and less than on other variables in the Model 1, feeling safety depends on income per HH member/per month (β = 0.052, p < 0.05). All β coefficients are positive and let us state: as more people agree with the statements on personal income, the more they feel safe living in their home country, and, in opposite, as less people agree with the statements on personal income, the less they feel safe living in their home country.
Inclusion of control variables into the regression model enhances the influence of the F1, “Perception of income via possibilities/activities beyond the HH” (β = 0.133, p < 0.001), and F2, “Perception of income based on material conditions to fulfil daily needs“ (β = 0.262, p < 0.001), but weakens the influence of the objective income per HH member/per month (β = 0.045, p < 0.001) (Model 2 in Table 2). Positive β coefficients, again, reveal that the more positive perception of the personal income, the more positive perception of safety in the country, and the opposite, although there is an additional, even if not strong, influence of the size of the settlement that indicates that the bigger the cities, the more positive feeling of safety in own country, and the opposite (β = −0.055, p < 0.01).
Considering the differences among the countries identified in the above-described findings, it was decided to review the influence of objective and subjective perceptions of living conditions, as well as the socio-demographic characteristics of feeling safe in each of the three Baltic countries. For these reasons, six regression analysis models were constructed (Models 3–8 in Table 2). The results show that the determinants related to the subjective perception of personal income always, in all six models, remain influential on feeling safe in the country. Meanwhile, objective income per HH member/per month does not influence perception of safety in the countries. At the same time, these determinants become less strong after inclusion of control variables based on socio-demographic characteristics. That is, the mentioned determinants are influential, though at different levels among various groups of populations. The trend is common to the Baltic countries such as Estonia and Lithuania, but not in Latvia.
In Estonia, the most influential is F2, “Perception of income based on material conditions to fulfil daily needs” (β = 0.283, p < 0.001), and less influential is F1, “Perception of income via possibilities/activities beyond the HH” (β = 0.144, p < 0.001) (Model 3 in Table 2). Inclusion of control variables into the regression model enhances the influence of the F1, “Perception of income via possibilities/activities beyond the HH” (β = 0.150, p < 0.001), and F3, “Unconditional perception of income” (β = 0.251, p < 0.001), but somewhat weakens the influence of the F2, “Perception of income based on material conditions to fulfil daily needs” (β = 0.280, p < 0.001) (Model 4 in Table 2). The latter trend is mostly related to the education level of the population: the higher the education level, the more positive the feeling of safety in the country, and the opposite (β = 0.080, p < 0.05). The relationship is not strong, though it is statistically significant.
In Lithuania, again, the most influential is F2, “Perception of income based on material conditions to fulfil daily needs” (β = 0.245, p < 0.001), and the less influential is F1, “Perception of income via possibilities/activities beyond the HH” (β = 0.085, p < 0.05) (Model 5 in Table 2). Inclusion of control variables into the regression model slightly enhances the influence of the F1, “Perception of income via possibilities/activities beyond the HH” (β = 0.090, p < 0.05) and F3, “Unconditional perception of income” (β = 0.234, p < 0.001), but weakens the influence of the F2, “Perception of income based on material conditions to fulfil daily needs” (β = 0.253, p < 0.001) (Model 6 in Table 2). The latter trend is related to the size of the settlement and the bigger the city, the more it is related to the positive feeling of safety in the country, and the opposite (β = −0.097, p < 0.01).
In Latvia, the most influential is F3, “Unconditional perception of income” (β = 0.221, p < 0.001) and the less influential is F1, “Perception of income via possibilities/activities beyond the HH” (β = 0.118, p < 0.05) (Model 7 in Table 2). Inclusion of control variables into the regression model makes absolutely minimal changes in F1, “Perception of income via possibilities/activities beyond the HH” and F3, “Unconditional perception of income”, and it can be stated that socio-demographic characteristics do not have any influence on the relationship between feeling safe in the country and objective or subjective perceptions of living conditions.
As the authors mentioned in the introduction of this article, there is a lack of research examining the impact of the income of the population on perceived national security. Therefore, we can compare only some of the obtained results with only certain insights of other studies. The results of the investigation reveal that more than half of the respondents in the three Baltic countries—Lithuania, Latvia, and Estonia—agreed that they feel safe living in their own country. The results of this research in some sense converge with the findings by Janušauskienė et al. [16], stating that 63 percent of Lithuanians say they feel safe. Socio-demographic characteristics, such as size of the settlement and education, make the strongest influence on perceived security in the Baltic states, especially in Estonia and Lithuania. Meanwhile, the findings of Janušauskienė et al. [16] highlight the age of the respondents as the factor influencing the perception of security in Lithuania. Moreover, the results of the study showed that the objective and subjective incomes of society play a significant role in the context of national security. In the previous study, Janušauskienė et al. [16] provided a very similar insight, stating that people who are more affluent feel safer than those who are poor. Additionally, the results demonstrate that the association of the feeling of safety in the country with subjective perception of living conditions is stronger than objective perception. This finding reflects the attitudes of Stoetman [49] and Janušauskienė et al. [16], revealing that a gap exists between the reality of security and the individuals’ perceptions of security. According to Cialani and Mortazavi [43], subjective measures capture the economic utility level reflecting an individual’s satisfaction, derived through the maximization of the consumption of goods, services, and leisure within budgetary constraints. Moreover, income not only allows individuals to purchase goods and services [42,43] but it also goes hand in hand with happiness and life satisfaction [44,59,60]. Additionally, research results have revealed that three determinants, relating to the statements (a) “I am happy with my current income,” (b) “My current income allows me to purchase food and other necessities without worrying too much about expenses,” and (c) “I have no financial difficulties in paying utilities, rent, bank loans, leasing, and other liabilities” are the most influential on perception of security. Particular attention should therefore be paid to reducing poverty and social exclusion. This insight of the study directly responds to the critical indicators—income inequalities and poverty—identified in the reports of the European Commission [61,62] in Lithuania and Latvia. These indicators also relate to sustainable development goals, such as elimination of poverty (1SDG) and reduced inequalities (10 SDG). It should be noted that this study was limited to revealing the links between economic security indicators related to the income of the population and security perceptions; it did not examine respondents’ attitudes toward other security factors, such as political security, energy and natural resources security, homeland security, cybersecurity, human security, and environmental security [3] and their impact on national security. Given the holistic approach to national security and the fact that there is no area of public life that would not affect national security [4], in the long run it would be appropriate to extend the study by linking the insights gained to the activities of the authorities responsible for ensuring public and national security. Only cooperation between state authorities and the public could strengthen both the objective and the subjective senses of national security of the society. That is even more so when modern challenges and threats call for measures to reduce the likelihood of adverse events occurring. Government decisions on effective socioeconomic measures could help find a way out of poverty and income inequality and, at the same time, they could ensure a sense of security for the population.

5. Conclusions

Economic security is one of the key components of national security. The areas of security are complex, encompassing a number of interrelated factors, with close correlations and causal links. An objective and subjective perception of income plays an important role in achieving a sense of security. The authors of this investigation focus on the effect of objective and subjective individuals’ incomes on perceived national security in the Baltic countries.
The percentage distribution of the variable on the perception of safety reveals that more than half of the respondents in all Baltic countries agreed that they feel safe living in their own country. Only 8% of the respondents stated that they totally disagreed about feeling safe.
The results of the investigation reveal that evaluations of feeling safe independently of income are highest in Estonia, close to average in Latvia, and lowest in Lithuania.
Empirical data collected in the representative survey confirm the hypothesis that both objective and subjective perceptions of living conditions are significant determinants influencing a sense of safety in populations. Moreover, it can be stated that the higher the levels of objective and subjective perceptions of personal income, the more people feel safe in their country. In contrast, the lower the objective and subjective perceptions of personal income, the less people feel safe in their country.
Notwithstanding, the second part of the hypothesis should be rejected because empirical research reveals that subjective, but not objective, living conditions expressed in personal income are a more important determinant for the perceived security in the countries under consideration. Among the subjective living conditions, identified as determinants of feeling safe in the country, the most strong are happiness with their own current incomes and having no financial difficulties in paying utilities, rent, bank loans, leasing, and other liabilities, and, also, in purchasing food and other necessities without worrying too much about expenses. That is, the feeling of safety is strongly and positively associated with the subjective perception of an income that allows the fulfilment of daily personal and household needs. Less influential determinants related to subjective perception of income vary from country to country and depend on the list of possible determinants. There are few determinants that exert less influence on feeling safe in the country: these are associated with the subjective perception of living conditions like having a current income that makes it possible to set aside part of the income for savings, being able to spend money on leisure, travel, entertainment, and development, and being able to help other people who are asking for financial help.
Finally, it is to be noted that socio-demographic characteristics have had statistically significant but rather weak impact on objective and subjective perceptions of living conditions in the context of feeling safe in the country. Among such characteristics, the most significant are size of the settlement and educational level.
The insights of this investigation could be applied to ensure both national and economic security and the achievement of the Sustainable Development Goals 2030, such as elimination of poverty (1SDG) and reduced inequalities (10 SDG). Poverty and inequality are areas where government action and solutions are particularly needed in the Baltic states. People who are more affluent feel safer than those who are poor. A person’s relationship with the state is shaped first and foremost by the satisfaction of their individual needs. The study’s insights show that to ensure a sense of security in the country, particular attention needs to be paid to tackling the problems of poverty and inequalities.
It should be noted that this study is limited to revealing the impact of economic security indicators related to people’s incomes on perceptions of national security. It did not explore respondents’ perceptions of other security factors such as political security, energy and natural resource security, cyber security, environmental security, and other factors. Given the holistic approach to national security, it would also be useful to extend the survey in the future to reveal the impact of the Russian invasion into Ukraine on the perception of national security.

Author Contributions

Conceptualization, G.D., D.P. and V.Č.; methodology, V.Č.; software, V.Č.; validation, V.Č. and G.D; formal analysis, G.D. and D.P.; investigation, V.Č; resources, G.D.; data curation, V.Č.; writing—original draft preparation, G.D., D.P. and V.Č.; writing—review and editing, V.Č. and G.D.; visualization, V.Č. and D.P; supervision, G.D. All authors have read and agreed to the published version of the manuscript.

Funding

The current work was funded by the Study Support Project (2021–2024), order No V-827, 17 December 2020, General Jonas Žemaitis Military Academy of Lithuania, Vilnius, Lithuania.

Institutional Review Board Statement

The public opinion survey was conducted by “Baltic Survey Ltd”, which is corporate member of ESOMAR and conducts all projects including public opinion polls in strict adherence to ICC/ESOMAR International Code on Market and Social Research.

Informed Consent Statement

The public opinion survey was conducted in strict adherence to ICC/ESOMAR International Code on Market and Social Research.

Data Availability Statement

The research uses data from the public opinion survey conducted by “Baltic Survey Ltd”.

Conflicts of Interest

The authors declare no conflict of interest.

Appendix A

Table A1. Percentage distributions and means of objective living conditions and subjective living conditions by countries.
TotalCountries
EELTLV
Objective Living Conditions
Income per HH Member/per Month
Up to EUR 50039%19%39%58%
EUR 501–100032%39%32%26%
EUR 1001 and above10%24%3%2%
N/N19%19%26%14%
Total100%100%100%100%
Subjective living conditions
I am happy with my current income.
1 = Totally disagree 27%17%24%39%
2 20%14%24%21%
3 30%34%33%23%
4 17%24%15%12%
5 = Totally agree 6%11%4%5%
Total 100%100%100%100%
Mean 2.73.12.72.3
My current income allows me to purchase food and other necessities without worrying too much about expenses.
1 = Totally disagree 21%16%18%27%
2 18%14%22%18%
3 29%26%35%25%
4 19%22%19%18%
5 = Totally agree 13%22%6%12%
Total 100%100%100%100%
Mean 3.03.32.82.8
I have no financial difficulties in paying utilities, rent, bank loans, leasing, and other liabilities.
1 = Totally disagree 20%12%18%28%
2 16%8%21%18%
3 24%19%33%20%
4 21%24%20%20%
5 = Totally agree 19%37%8%14%
Total 100%100%100%100%
Mean 3.23.82.92.9
I can spend money on leisure, travel, entertainment, and development.
1 = Totally disagree 35%25%29%53%
2 20%16%27%18%
3 21%21%26%15%
4 15%21%14%9%
5 = Totally agree 9%17%4%5%
Total 100%100%100%100%
Mean 2.53.12.42.1
My current income allows me to set aside part of my income for savings.
1 = Totally disagree 47%35%42%63%
2 18%15%25%15%
3 17%20%21%11%
4 11%16%11%7%
5 = Totally agree 7%14%3%4%
Total 100%100%100%100%
Mean 2.32.72.21.9
I can afford to help other people asking for financial help.
1 = Totally disagree 53%43%56%63%
2 17%15%23%14%
3 16%20%14%13%
4 9%13%5%7%
5 = Totally agree 5%9%2%3%
Total 100%100%100%100%
Mean 2.12.61.92.0
Source: Authors’ elaboration based on representative survey, 2021.
Table A2. Percentage distributions of socio-demographic characteristics of the respondents by countries.
TotalCountries
EELTLV
Age groups
Up to 29 years old17%18%17%16%
30–49 years old36%36%32%40%
50 years old and above47%47%51%44%
Total100%100%100%100%
Education level
Basic or lower education9%13%6%8%
Secondary and/or professional education67%62%74%66%
University24%26%19%27%
Total100%100%100%100%
Household size
Live alone22%22%21%23%
Two persons36%36%38%34%
Three persons22%20%23%22%
Four or more persons20%22%18%21%
Total100%100%100%100%
Size of the settlement
Big city42%50%43%33%
Other city26%19%25%35%
Village32%31%33%31%
Total100%100%100%100%
Source: Authors’ elaboration based on representative survey, 2021.
Table A3. Results of the factor analysis conducted for variables on subjective perception of personal income.
Variables in the Factor AnalysisFactors Identified
F1: Perception of Income via Possibilities/Activities beyond the HHF2: Perception of Income Based on Material Conditions to Fulfil Daily NeedsF3: Unconditional Perception of Income
I can afford to help other people asking for financial help.0.8690.2570.146
My current income allows me to set aside part of my income for savings.0.8030.2740.353
I can spend money on leisure, travel, entertainment, and development.0.6960.4440.350
I have no financial difficulties in paying utilities, rent, bank loans, leasing, and other liabilities.0.3250.8770.221
My current income allows me to purchase food and other necessities without worrying too much about expenses.0.3230.7360.449
I am happy with my current income.0.3240.3560.859
Note: Extraction method: principal component analysis. Rotation method: Varimax with Kaiser normalization. Source: Authors’ elaboration based on representative survey, 2021.
Table A4. Collinearity diagnostics for explanatory and control variables included in the linear regression analysis conducted for each analyzed country.
Dependent Variable: I Feel Safe Living in My Own Country
TotalEELTLV
Model 1Model 2Model 1Model 2Model 3Model 4Model 5Model 6
EigenvalueCondition IndexEigenvalueCondition IndexEigenvalueCondition IndexEigenvalueCondition IndexEigenvalueCondition IndexEigenvalueCondition IndexEigenvalueCondition IndexEigenvalueCondition Index
1 1.938 1.000 5.449 1.000 2.293 1.000 5.671 1.000 2.045 1.000 5.549 1.000 2.043 1.000 5.581 1.000
2 1.011 1.384 1.045 2.284 1.027 1.494 1.048 2.326 1.128 1.346 1.134 2.212 1.065 1.385 1.070 2.284
3 1.001 1.392 1.002 2.332 0.820 1.673 0.950 2.443 0.948 1.469 0.978 2.382 0.942 1.473 0.955 2.417
4 0.991 1.399 0.992 2.343 0.813 1.680 0.819 2.632 0.826 1.573 0.843 2.566 0.896 1.510 0.908 2.479
5 0.058 5.769 0.181 5.491 0.047 6.978 0.181 5.599 0.054 6.177 0.178 5.578 0.054 6.131 0.184 5.501
6 0.167 5.712 0.169 5.799 0.167 5.759 0.146 6.188
7 0.098 7.441 0.089 7.972 0.100 7.452 0.095 7.680
8 0.051 10.319 0.056 10.107 0.040 11.852 0.047 10.888
9 0.047 10.767 0.054 10.248 0.042 11.494 0.043 11.393
Source: Authors’ elaboration based on representative survey, 2021.
Table A5. Measures of collinearity statistics on explanatory and control variables included in the linear regression analysis.
Dependent Variable: I Feel Safe Living in My Own Country
TotalEELTLV
Model 1Model 2Model 3Model 4Model 5Model 6Model 7Model 8
ToleranceVIFToleranceVIFToleranceVIFToleranceVIFToleranceVIFToleranceVIFToleranceVIFToleranceVIF
F1: Perception of income via possibilities/activities beyond the HH 0.8511.1750.8291.2070.8851.1290.8611.1610.8621.1610.8341.1980.8771.1410.8331.201
F2: Perception of income based on material conditions to fulfil daily needs 0.9171.0910.8941.1190.9301.0760.9031.1070.9281.0780.9121.0970.9371.0680.8861.129
F3: Unconditional perception of income 0.9541.0480.9511.0520.9481.0550.9341.0710.9701.0310.9621.0400.9741.0260.9711.029
Income per HH member/per month 0.7601.3160.6971.4360.8071.2400.7481.3380.8421.1880.7111.4070.8341.1990.7491.335
Age groups 0.8241.214 0.8151.227 0.7371.356 0.8421.188
Education level 0.9151.093 0.9091.100 0.8741.144 0.8581.166
Household size 0.8191.221 0.8661.155 0.7441.343 0.7991.252
Size of the settlement 0.9621.039 0.9551.047 0.9241.082 0.9561.046
Source: Authors’ elaboration based on representative survey, 2021.

References

  1. Hama, H.H. State Security, Societal Security, and Human Security. Jadavpur J. Int. Relat. 2017, 21, 1–19. [Google Scholar] [CrossRef]
  2. Buzan, B. People, States & Fear: An Agenda for International Security Studies in the Post-Cold War Era; ECPR Press: Colchester, UK, 2008. [Google Scholar]
  3. Holmes, K.R. What Is National Security? In 2015 Index of U.S. Military Strength Assessing America’s Ability to Provide for the Common Defense; Wood, D.L., Ed.; The Heritage Foundation: Washington, DC, USA, 2015; pp. 17–26. [Google Scholar]
  4. Chandr, S.; Bhonsle, R. National Security: Concept, Measurement and Management. Strateg. Anal. 2015, 39, 337–359. [Google Scholar] [CrossRef]
  5. Nussbaum, M.; Sen, M.A. The Quality of Life; Oxford University Press: Oxford, UK, 1993. [Google Scholar] [CrossRef]
  6. Vileikienė, E.; Janušauskienė, D. Subjective Security in a Volatile Geopolitical Situation: Does Lithuanian Society Feel Safe? J. Balt. Secur. 2016, 2, 109–143. [Google Scholar] [CrossRef] [Green Version]
  7. Bohnke, P.; Kohler, U. Well-Being and Inequality; WZB Discussion Paper No. SP I 2008–201; Berlin Social Science Research Center: Berlin, Germany, 2008. [Google Scholar]
  8. Bellani, L.; D’Ambrosio, C. Deprivation, social exclusion and subjective well-being. Soc. Indic. Res. 2011, 104, 67–86. [Google Scholar] [CrossRef]
  9. Mau, S.; Mewes, J.; Schöneck, N.M. What determines subjective socio-economic insecurity? Context and class in comparative perspective. Socio-Econ. Rev. 2012, 10, 655–682. [Google Scholar] [CrossRef]
  10. Diener, E.; Lucas, R.E.; Oishi, S. Advances and Open Questions in the Science of Subjective Well-Being. Collabra Psychol. 2018, 4, 15. [Google Scholar] [CrossRef] [Green Version]
  11. Vladisavljević, M.; Mentus, V. The Structure of Subjective Well-Being and Its Relation to Objective Well-Being Indicators: Evidence from EU-SILC for Serbia. Psychol. Rep. 2019, 122, 36–60. [Google Scholar] [CrossRef]
  12. Ilinykh, S.A.; Tevlukova, O.U.; Rovbel, S.V. Living Standards as an Object of Municipal Government: A Study of Objective and Subjective Indicators. Public Policy Adm. 2020, 19, 219–230. [Google Scholar]
  13. Kosny, M.; Piotrowska, M. Assessment of Economic Security of Households Based on a Scenario Analysis. Economies 2019, 7, 85. [Google Scholar] [CrossRef] [Green Version]
  14. Buzan, B. Regions and Powers: The Structure of International Security; Cambridge University Press: Cambridge, UK, 2003. [Google Scholar]
  15. Kośmider, T. Determinants of the Process of Creating National Security. J. Secur. Sustain. Issues 2021, 11, 287–299. [Google Scholar] [CrossRef]
  16. Janušauskienė, D.; Vileikienė, E.; Nevinskaitė, L.; Gečienė-Janulionė, I. Ar Lietuvos Gyventojai Jaučiasi Saugūs? Subjektyvus Saugumas Kintančiame Geopolitiniame Kontekste; Do Lithuanians Feel Safe? Subjective Security in a Changing Geopolitical Context; Socialinių Tyrimų Institutas: Vilnius, Lithuania, 2017; Available online: https://www.lstc.lt/wp-content/uploads/2019/10/Ar_gyventojai_jauciasi_saugus.pdf (accessed on 11 April 2022).
  17. Banasik, M. Dilemmas of security perception. Sci. J. Mil. Univ. Land Forces 2018, 50, 5–15. [Google Scholar] [CrossRef]
  18. Chaparro, L.F.; Pulido, C.; Rudas, J.; Victyorino, J.; Reyes, A.M.; Estrada, C.; Narvaez, L.A.; Gomez, F. Quantifying Perception of Security Through Social Media and Its Relationship With Crime. IEEE Access 2021, 9, 139201–139213. [Google Scholar] [CrossRef]
  19. Bajc, V.; de Lindt, W. (Eds.) Security and Everyday Life, 1st ed.; Routledge: New York, NY, USA; London, UK, 2011. [Google Scholar] [CrossRef]
  20. Bajc, V. Sociological Reflections on Security through Surveillance. Sociol. Forum 2013, 28, 615–623. Available online: http://www.jstor.org/stable/43653899 (accessed on 11 April 2022). [CrossRef]
  21. Inglehart, R.F.; Norris, P. The four horsemen of the apocalypse: Understanding human security. Scand. Political Stud. 2012, 35, 71–96. [Google Scholar] [CrossRef]
  22. Wills-Herrera, E.; Orozco, L.E.; Forero-Pineda, C.; Pardo, O.; Andonova, V. The relationship between perceptions of insecurity, social capital and subjective well-being: Empirical evidences from areas of rural conflict in Colombia. J. Socio-Econ. 2011, 40, 88–96. [Google Scholar] [CrossRef]
  23. Varga, T.C. Security perception and security policy in Central Europe, 1989–2019. Def. Secur. Anal. 2021, 37, 1–8. [Google Scholar] [CrossRef]
  24. Sajeva, M. Security, Quality of Life and Development: A Holistic Approach. In Quality of Life in Italy; Social Indicators Research Series; Maggino, F., Nuvolati, G., Eds.; Springer: Dordrecht, The Netherlands, 2012; Volume 48, pp. 194–224. [Google Scholar] [CrossRef]
  25. Wiśniewski, R. Notion of Strategic National Security Management. Secur. Def. Q. 2018, 20, 18–41. [Google Scholar] [CrossRef]
  26. Webb, D.; Wills-Herrera, E. (Eds.) Introduction. In Subjective Well-Being and Security; Social Indicators Research Series; Springer: Dordrecht, The Netherlands, 2012; Volume 46. [Google Scholar] [CrossRef]
  27. Aidukaitė, J.; Bogdanova, N.; Guogis, A. Gerovės Valstybės Raida Lietuvoje: Mitas ar Realybė? Monografija; Creation of the Welfare State in Lithuania: Myth or Reality? Monography; Lietuvos Socialinių Tyrimų Centras: Vilnius, Lithuania, 2012; p. 412. [Google Scholar]
  28. Šimašius, R.; Vilpišauskas, R. The Concept of Economic Security and the Principles of Economic Security Policy in Lithuania. Lith. Annu. Strateg. Rev. 2005, 3, 249–266. [Google Scholar] [CrossRef]
  29. Asghari, M. National Security and Economic Growth. Iran. Econ. Rev. 2017, 21, 905–924. [Google Scholar]
  30. Retter, L.; Frinking, E.J.; Hoorens, S.; Lynch, A.; Nederveen, F.; Phillips, W.D. Relationships between the Economy and National Security: Analysis and Considerations for Economic Security Policy in the Netherlands; RAND Corporation: Santa Monica, CA, USA; Cambridge, UK, 2020; Available online: www.rand.org/pubs/research_reports/RR4287.html (accessed on 11 April 2022).
  31. Simanavicius, A.; Subonytė, J.; Simanavičienė, Ž. Perception of Economic Security. Public Secur. Public Order 2019, 22, 158–171. [Google Scholar] [CrossRef]
  32. Tamošiūnienė, R.; Munteanu, C. Modern Approaches in Quantifying Economic Security. Case Sudy of Estonia, Latvia, Lithuania and Republic of Moldova. J. Secur. Sustain. Issues 2015, 4, 596–610. [Google Scholar]
  33. Piotrowska, M. The impact of consumer behavior on financial security of households in Poland. Contaduría Adm. Account. Manag. 2017, 62, 461–504. Available online: www.cya.unam.mx/index.php/cya/article/view/1253 (accessed on 11 April 2022). [CrossRef]
  34. Country’s Economic Security Concept: Theoretical Insights. Available online: https://repository.mruni.eu/handle/007/16031 (accessed on 11 April 2022).
  35. Ahmad, S.Y.; Sabri, M.F. Understanding Financial Security from Consumer’s Perspective: A Review of Literature. Int. J. Humanit. Soc. Sci. 2014, 4, 110–117. [Google Scholar]
  36. International Labour Office. Economic Security for a Better World; International Labour Office: Geneva, Switzerland, 2014; Available online: https://www.social-protection.org/gimi/gess/RessourcePDF.action?ressource.ressourceId=8670 (accessed on 11 April 2022).
  37. United Nations. A New Global Deal Must Promote Economic Security; United Nations: New York, NY, USA, 2021; Available online: www.un.org/development/desa/dpad/wp-content/uploads/sites/45/publication/PB_90.pdf (accessed on 11 April 2022).
  38. Arefieva, O.; Tulchynska, S.; Popelo, O.; Arefiev, S.; Tkachenko, T. The Economic Security System in the Conditions of the Powers Transformation. IJCSNS Int. J. Comput. Sci. Netw. Secur. 2021, 21, 35–42. [Google Scholar]
  39. Dudin, M.N.; Fedorova, I.J.; Ploticina, L.A.; Tokmurzin, T.M.; Belyaeva, M.V.; Ilyin, A.B. International Practices to Improve Economic Security. Eur. Res. Stud. J. 2018, 21, 459–467. [Google Scholar]
  40. Vasileva, I.; Morozova, N.; Evseev, A. Institutional Components of Economic Security and Their Transformation. Adv. Econ. Bus. Manag. Res. 2020, 139, 224–228. [Google Scholar]
  41. Rothschild, E. What is security? Daedalus 1995, 124, 53–98. [Google Scholar]
  42. Howell, R.T.; Howell, C.J. The relation of economic status to subjective well-being in developing countries: A meta-analysis. Psychol. Bull. 2008, 134, 536–560. [Google Scholar] [CrossRef]
  43. Cialani, C.; Mortazavi, R. The effect of objective income and perceived economic resources on self-rated health. Int. J. Equity Health 2020, 19, 196. [Google Scholar] [CrossRef]
  44. Boyce, C.J.; Brown, G.D.; Moore, S.C. Money and happiness: Rank of income, not income, affects life satisfaction. Psychol. Sci. 2010, 21, 471–475. [Google Scholar] [CrossRef] [Green Version]
  45. Deaton, A. Income, health and wellbeing around the world: Evidence from the Gallup world poll. J. Econ. Perspect. 2008, 22, 53–72. [Google Scholar] [CrossRef] [Green Version]
  46. Ruggeri, K.; Garcia-Garzon, E.; Maguire, Á.; Huppert, F.A. Well-being is more than happiness and life satisfaction: A multidimensional analysis of 21 countries. Health Qual. Life Outcomes 2020, 18, 192. [Google Scholar] [CrossRef]
  47. Stevens, D.; Vaughan-Williams, N. Citizens and Security Threats: Issues, Perceptions and Consequences beyond the National Frame. Br. J. Political Sci. 2014, 46, 149–175. [Google Scholar] [CrossRef] [Green Version]
  48. Schyns, P. Wealth of Nations, Individual Income and Life Satisfaktion in 42 Countries: A Multilevel Approach. Soc. Indic. Res. 2002, 60, 5–40. [Google Scholar] [CrossRef]
  49. Stoetman, A. Perception of Security. How Our Brains Can Fool Us. Strategic Monitor 2019–2020. 2021. Available online: www.clingendael.org/pub/2019/strategic-monitor-2019-2020/perceptions-of-security/ (accessed on 11 April 2022).
  50. Delhey, J.; Böhnke, P.; Habich, R.; Zapf, W. Quality of Life in a European Perspective: The Euromodule as a New Instrument for Comparative Welfare Research. Soc. Indic. Res. 2002, 58, 163–176. [Google Scholar] [CrossRef]
  51. Berger-Schmitt, R.; Noll, H.H. Conceptual Framework and Structure of a European System and Social Indicators; EU Reporting Working Paper; European Commission: Brussels, Belgium, 2000; Volume 9, p. 73. [Google Scholar]
  52. Veenhoven, R. The Concept of Happiness. In Conditions of Happiness; Springer: Dordrecht, The Netherlands, 1984. [Google Scholar] [CrossRef]
  53. Voukelatou, V.; Gabrielli, L.; Miliou, I.; Cresci, S.; Sharma, R.; Tesconi, M.; Pappalardo, L. Measuring objective and subjective well-being: Dimensions and data sources. Int. J. Data Sci. Anal. 2021, 11, 279–309. [Google Scholar] [CrossRef]
  54. Clark, T.; Foster, L.; Sloan, L.; Bryman, A. Social Research Methods, 6th ed.; Oxford University Press: Oxford, UK, 2021. [Google Scholar]
  55. Freedman, D.A. Statistical Models and Causal Inference: A Dialogue with the Social Sciences, 1st ed.; Cambridge University Press: Cambridge, UK, 2011. [Google Scholar]
  56. Gelman, A. Regression and Other Stories: Analytical Methods for Social Research; Cambridge University Press: Cambridge, UK, 2020. [Google Scholar]
  57. Kennedy, P. A Guide to Econometrics, 6th ed.; Wiley-Blackwell: Hoboken, NJ, USA, 2008. [Google Scholar]
  58. Frankfort-Nachmias, C.; Leon-Guerrero, A.; Georgiann, D. Social Statistics for a Diverse Society; SAGE Publications, Inc.: Thousand Oaks, CA, USA, 2020. [Google Scholar]
  59. European Commission. Commission Staff Working Document. Country Report Lithuania. Communication from the Commission to the European Parliament, the European Council, the Council, the European Central Bank and the Eurogroup. 2020 European Semester: Assessment of Progress on Structural Reforms, Prevention and Correction of Macroeconomic Imbalances, and Results of In-Depth Reviews under Regulation (EU) No 1176/2011. 2020. Available online: https://ec.europa.eu/info/sites/default/files/2020-european_semester_country-report-lithuania_en.pdf (accessed on 11 April 2022).
  60. Ng, W.; Diener, E. What matters to the rich and the poor? Subjective well-being, financial satisfaction, and postmaterialist needs across the world. J. Personal. Soc. Psychol. 2014, 107, 326–338. [Google Scholar] [CrossRef]
  61. Ngamaba, K.H. Determinants of subjective well-being in representative samples of nations. Eur. J. Public Health 2017, 27, 377–382. [Google Scholar] [CrossRef] [Green Version]
  62. European Commission. Commission Staff Working Document. Country Report Latvia. Communication from the Commission to the European Parliament, the European Council, the Council, the European Central Bank and the Eurogroup. 2020 European Semester: Assessment of Progress on Structural Reforms, Prevention and Correction of Macroeconomic Imbalances, and Results of In-Depth Reviews under Regulation (EU) No 1176/2011. 2020. Available online: https://ec.europa.eu/info/sites/default/files/2020-european_semester_country-report-latvia_en.pdf (accessed on 11 April 2022).
Figure 1. Percentage distributions of opinions on the statement “I feel safe living in my own country” in three Baltic countries. Evaluation scale: 1 = totally disagree,…, 5 = totally agree. Source: Authors’ elaboration based on representative survey, 2021.
Sustainability 14 07387 g001
Figure 2. Means of evaluations of the statement “I feel safe living in my own country” according to objective income in the Baltic countries. Evaluation scale: 1 = totally disagree,…, 5 = totally agree. Source: Authors’ elaboration based on representative survey, 2021.
Sustainability 14 07387 g002
Figure 3. Means of evaluations on the statement “I feel safe living in my own country” according to subjective perception of income in three Baltic countries. Evaluation scale: 1 = totally disagree,…, 5 = totally agree. Note: statements on subjective perception of income are the following: (a) I am happy with my current income; (b) My current income allows me to purchase food and other necessities without worrying too much about expenses; (c) I have no financial difficulties in paying utilities, rent, bank loans, leasing, and other liabilities; (d) I can spend money on leisure, travel, entertainment, and development; (e) My current income allows me to set aside part of my for savings; and (f) I can afford to help other people asking for financial help. Source: Authors’ elaboration based on representative survey, 2021.
Sustainability 14 07387 g003aSustainability 14 07387 g003bSustainability 14 07387 g003c
Table 1. Association between perception of safety in the country and measures of objective and subjective perception of personal income: results of the Pearson correlation in three Baltic countries.
I Feel Safe Living in My Country
Income per HH member/per month 0.206 ***
(a) I am happy with my current income. 0.344 ***
(b) My current income allows me to purchase food and other necessities without worrying too much about expenses. 0.315 ***
(c) I have no financial difficulties in paying utilities, rent, bank loans, leasing, and other liabilities. 0.343 ***
(d) I can spend money on leisure, travel, entertainment, and development. 0.300 ***
(e) My current income allows me to set aside part of my income for savings. 0.264 ***
(f) I can afford to help other people asking for financial help. 0.227 ***
Note: statistical significance: *** p < 0.001. Source: Authors’ elaboration based on representative survey, 2021.
Table 2. Determinants influencing feeling of safety in the Baltic countries. Results of the linear regression analysis (standardized coefficients beta).
Explanatory and Control VariablesDependent Variable: I Feel Safe Living in My Own Country
TotalEELTLV
Model 1Model 2Model 3Model 4Model 5Model 6Model 7Model 8
Constant *** *** *** *** *** *** *** ***
F1: Perception of income via possibilities/activities beyond the HH 0.125***0.133***0.144***0.150***0.085*0.090*0.118***0.117***
F2: Perception of income based on material conditions to fulfil daily needs 0.254***0.262***0.283***0.280***0.245***0.253***0.189***0.189***
F3: Unconditional perception of income 0.214***0.214***0.246***0.251***0.231***0.234***0.221***0.220***
Income per HH member/per month 0.052*0.045*−0.047 −0.063 −0.058 −0.064 −0.042 −0.070
Age groups 0.040 0.045 0.023 −0.022
Education level −0.016 0.080* −0.058 0.045
Household size −0.018 −0.031 −0.046 −0.055
Size of the settlement −0.055** −0.022 −0.097** −0.049
R Square 0.146 0.151 0.153 0.164 0.107 0.122 0.186 0.193
Note: statistical significance: *** p < 0.001; ** p < 0.01; * p < 0.05. Source: Authors’ elaboration based on representative survey, 2021.
Publisher’s Note: MDPI stays neutral with regard to jurisdictional claims in published maps and institutional affiliations.

