
Which Fabric/Scale Is Better for Transit-Oriented Urban Design: Case Studies in a Developing Country


Abstract
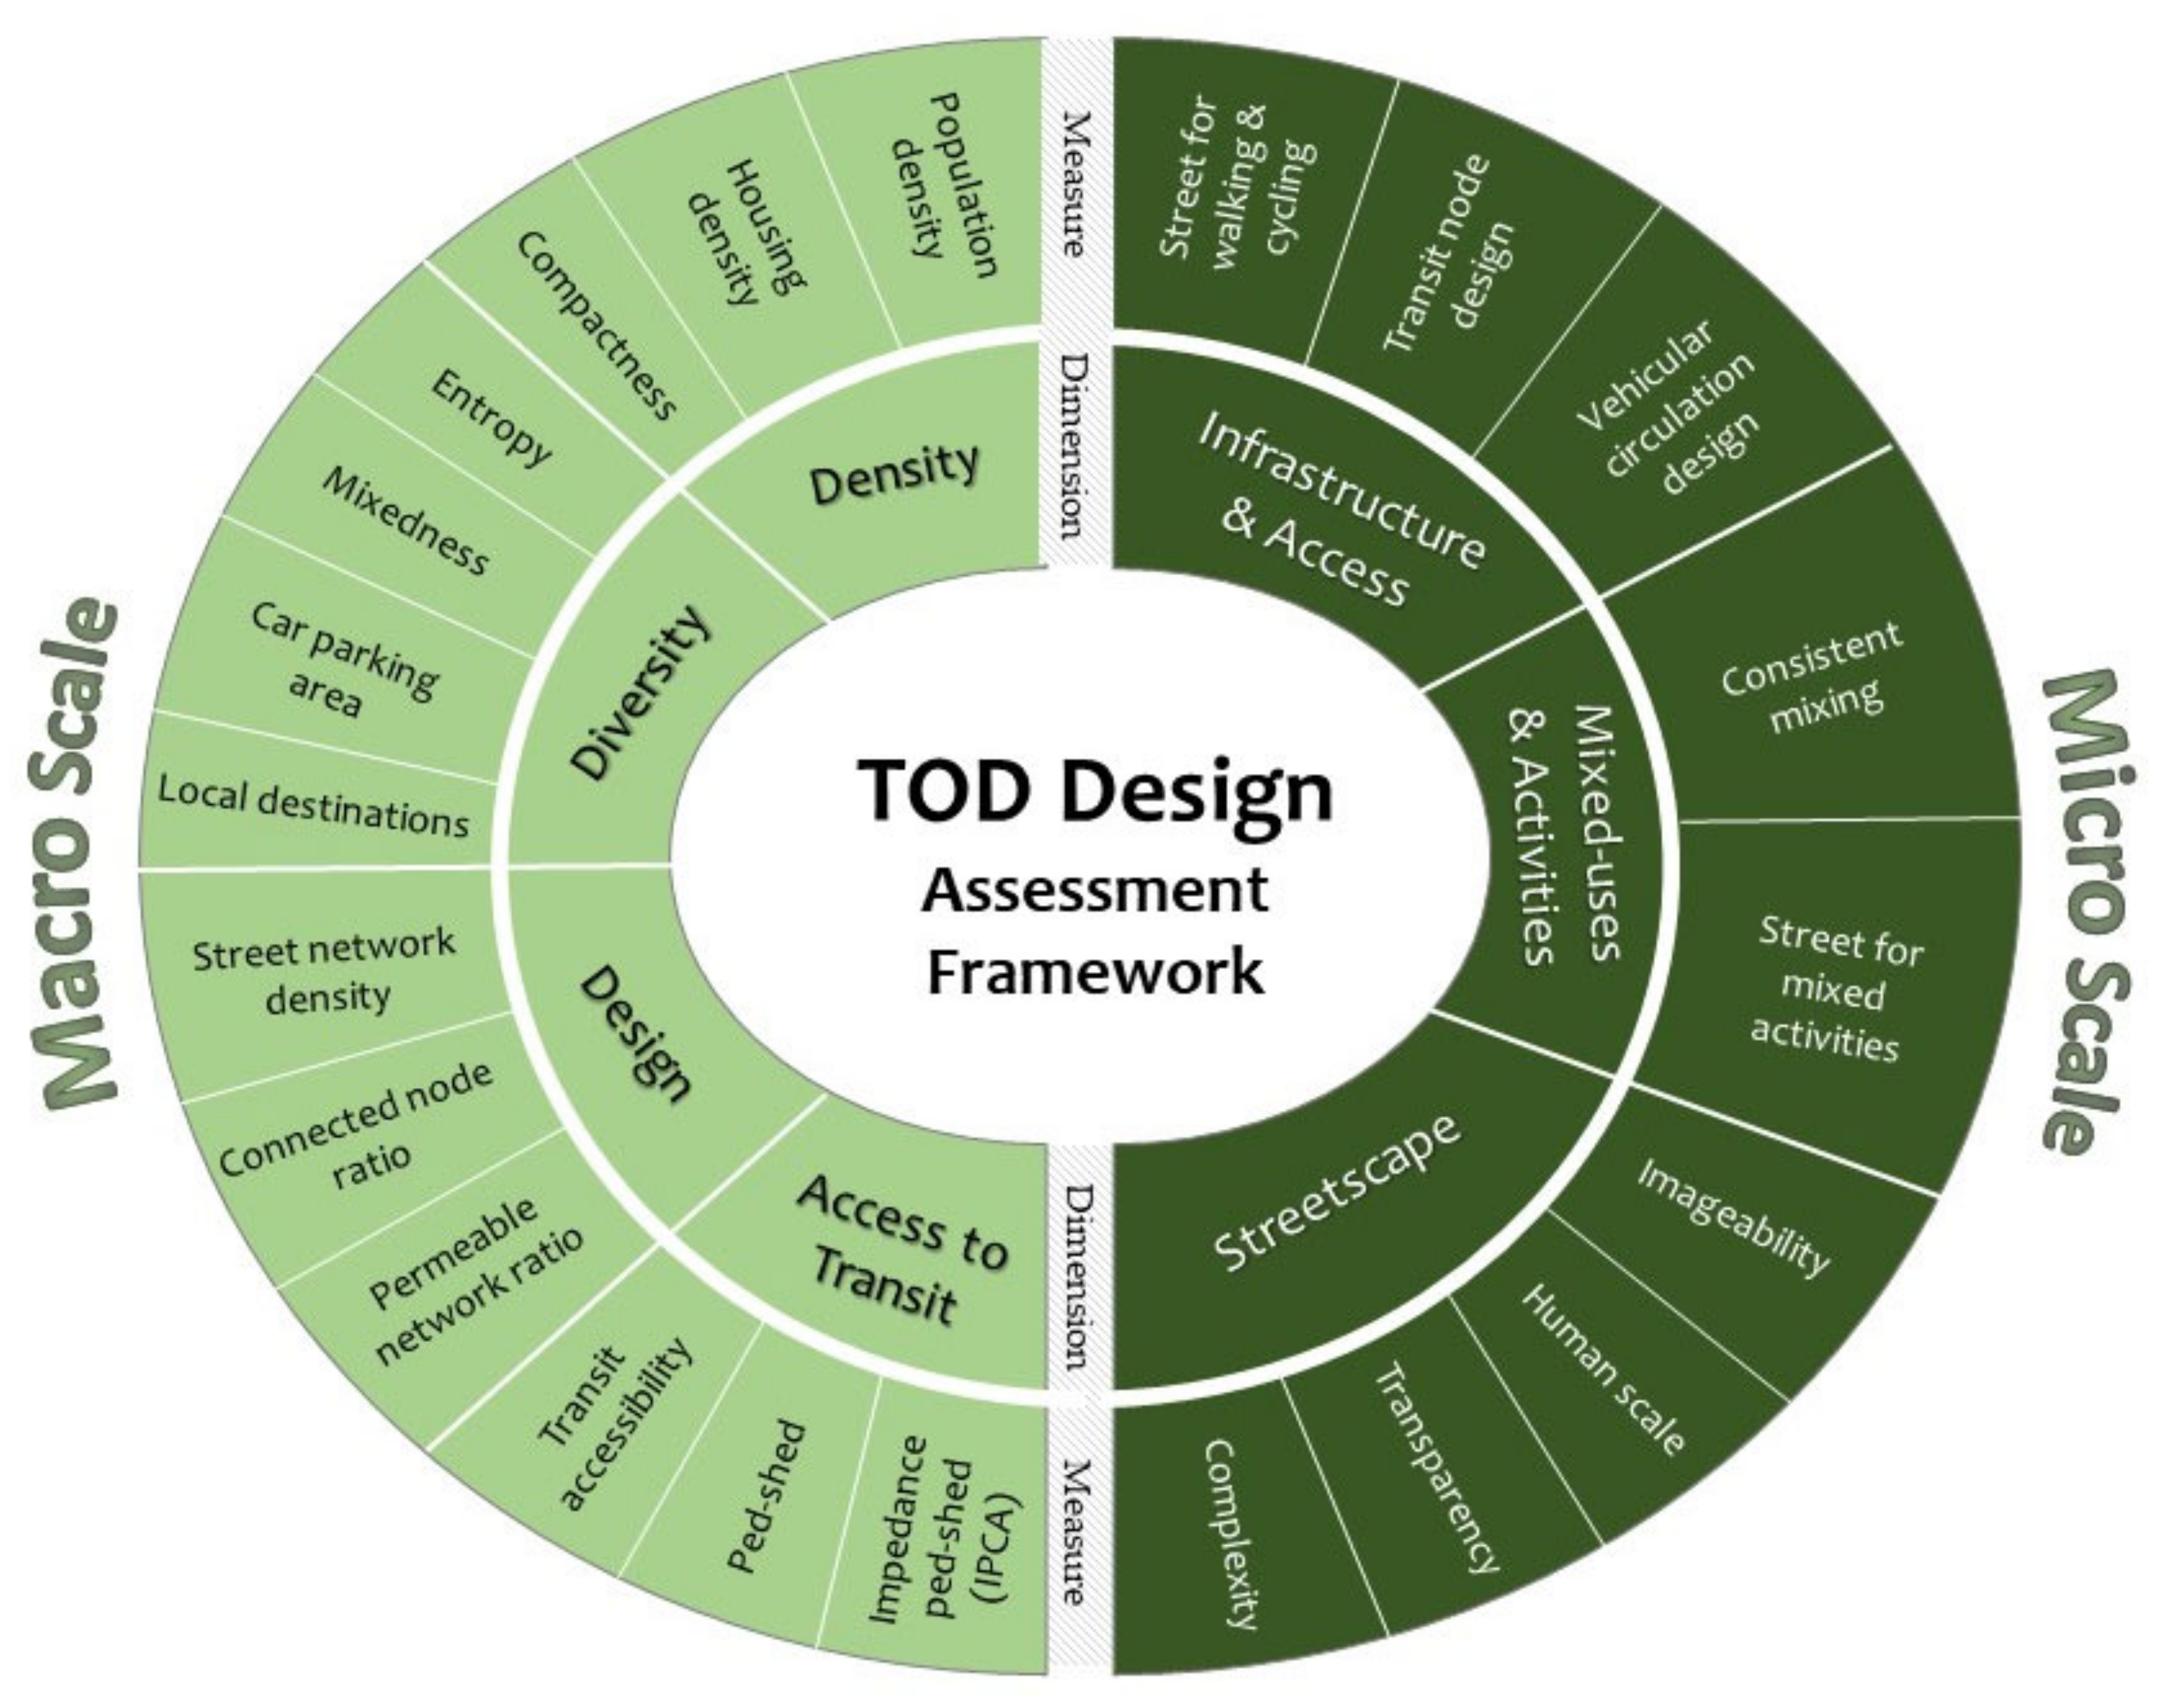
:1. Introduction
- Which design dimensions/qualities in Iranian cities are most likely to stymie or encourage TOD?
- Which types of existing Iranian urban fabrics best enable TOD design morphologically?
- What are the differences in designing TODs between neighbourhood (macrolevel) and streetscape (microlevel) characteristics?
2. Data and Methods
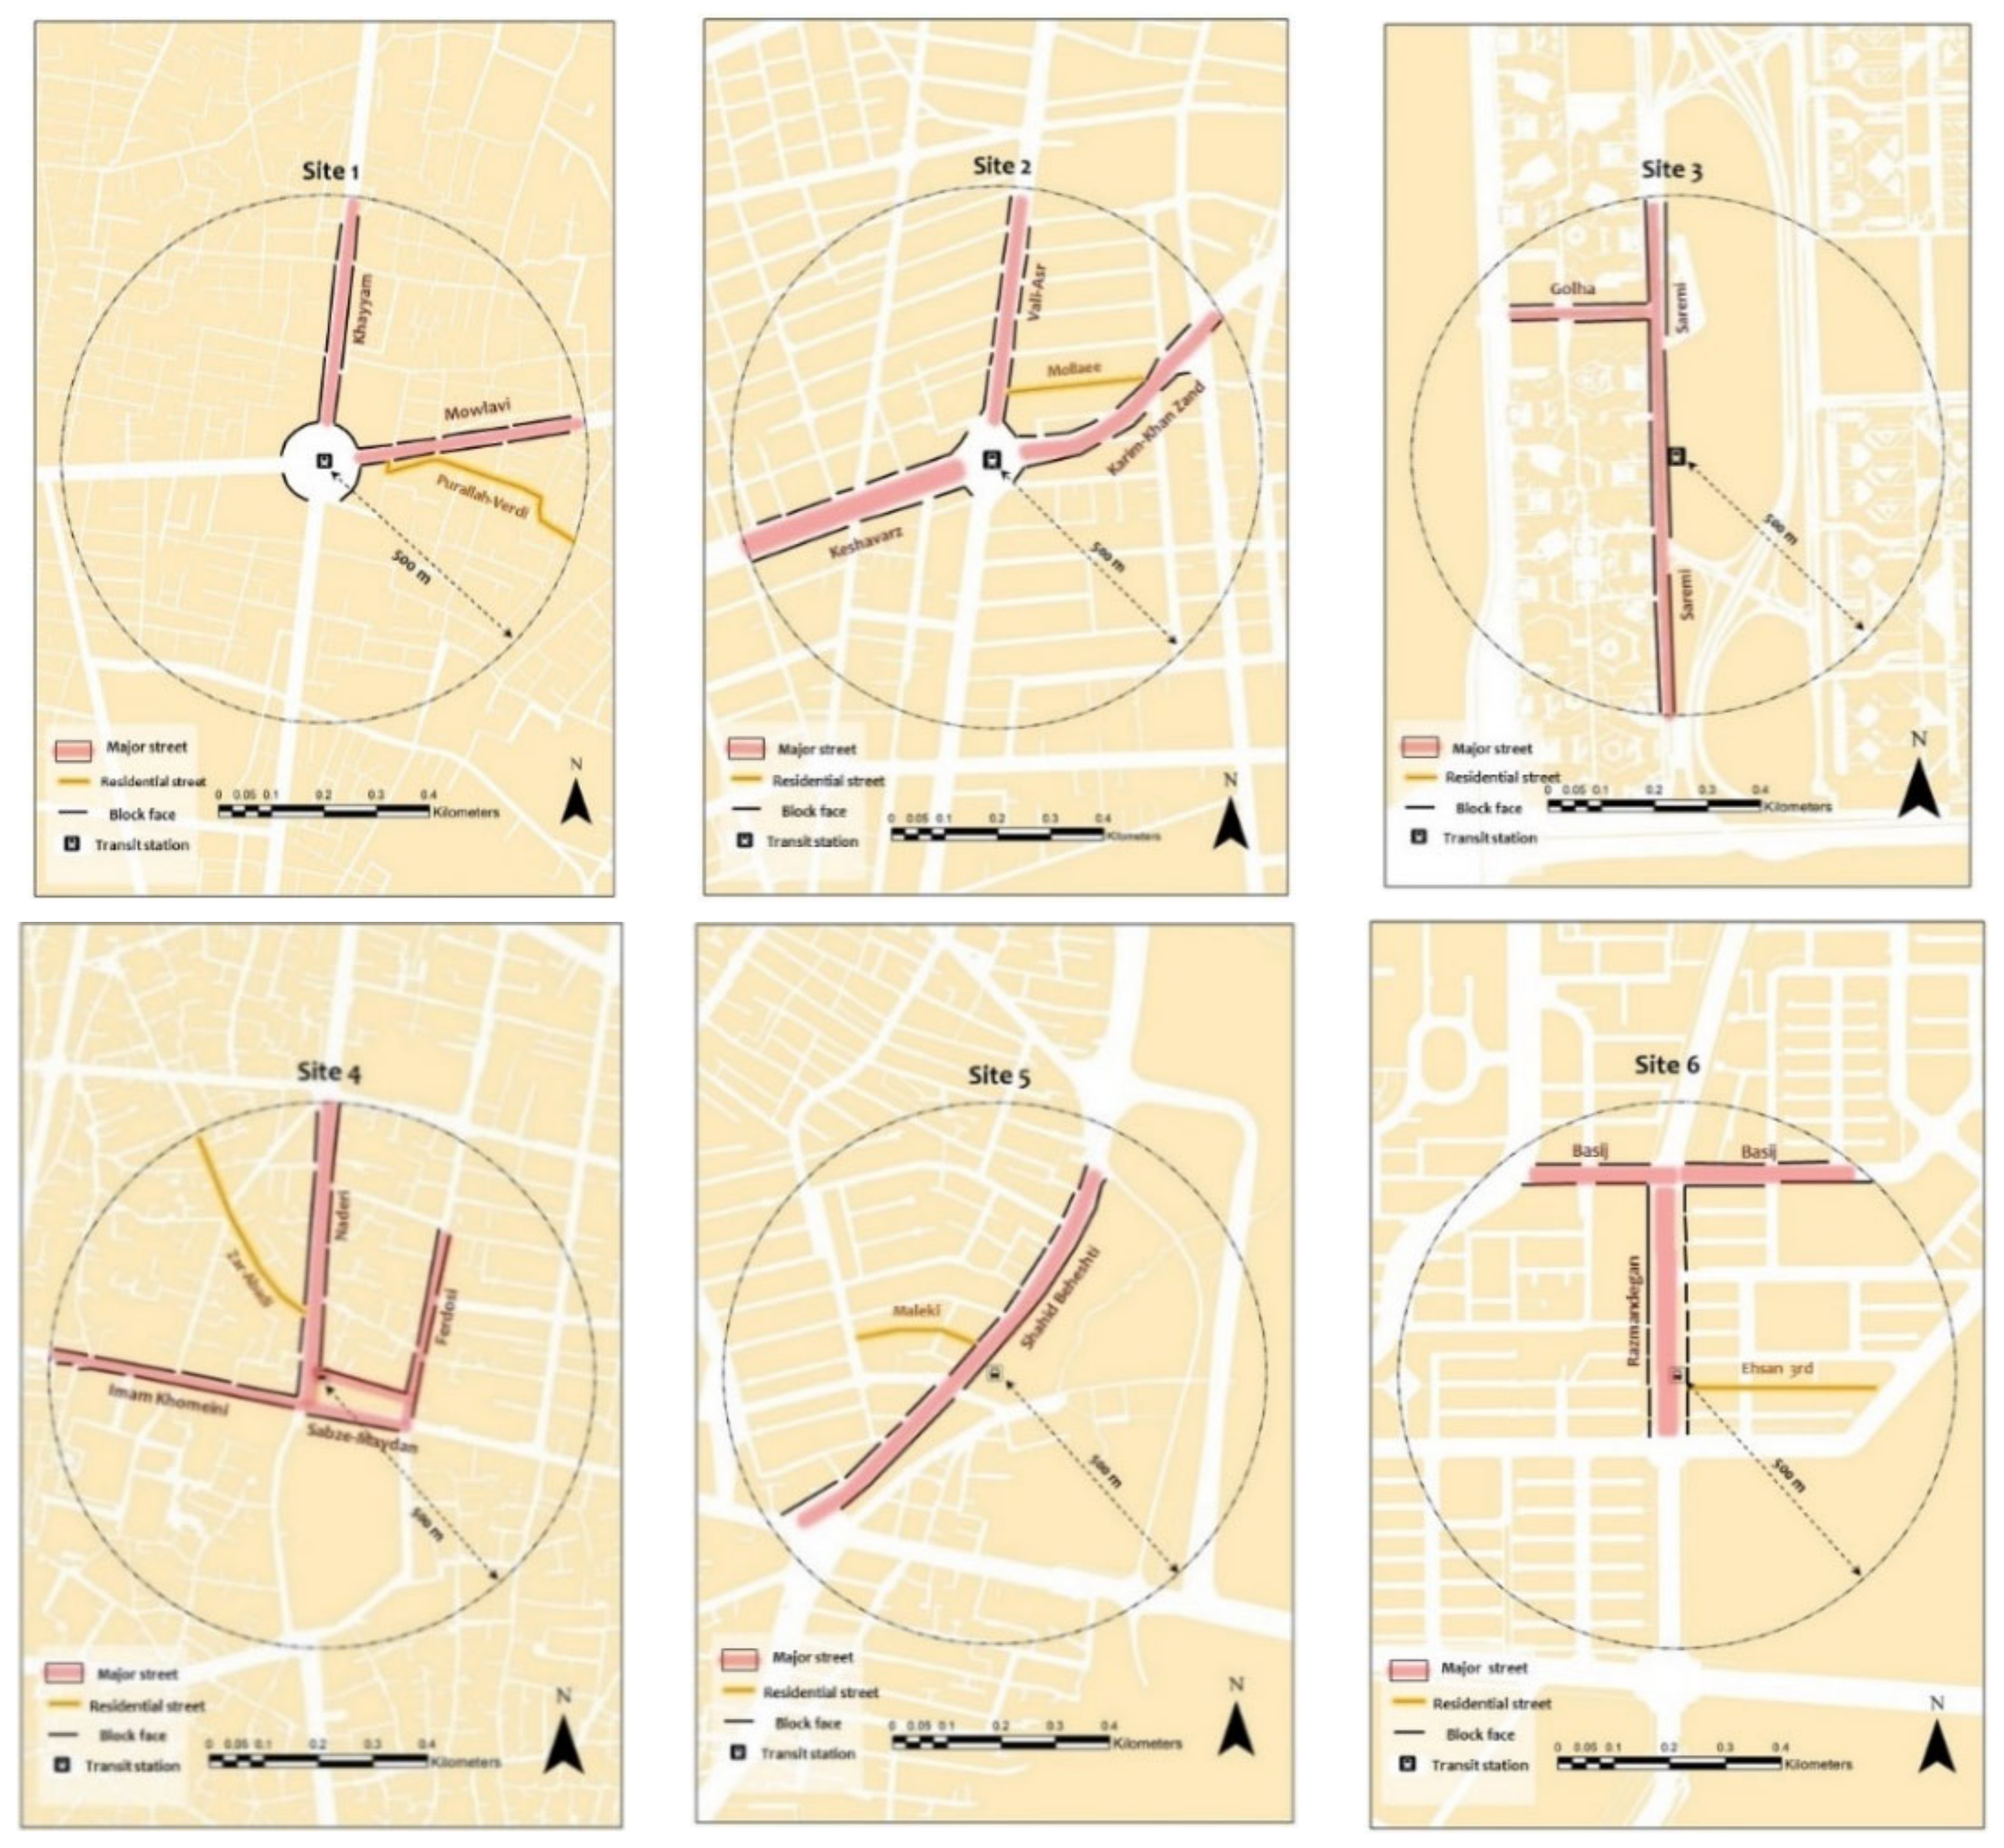
2.1. Case Study Research Method
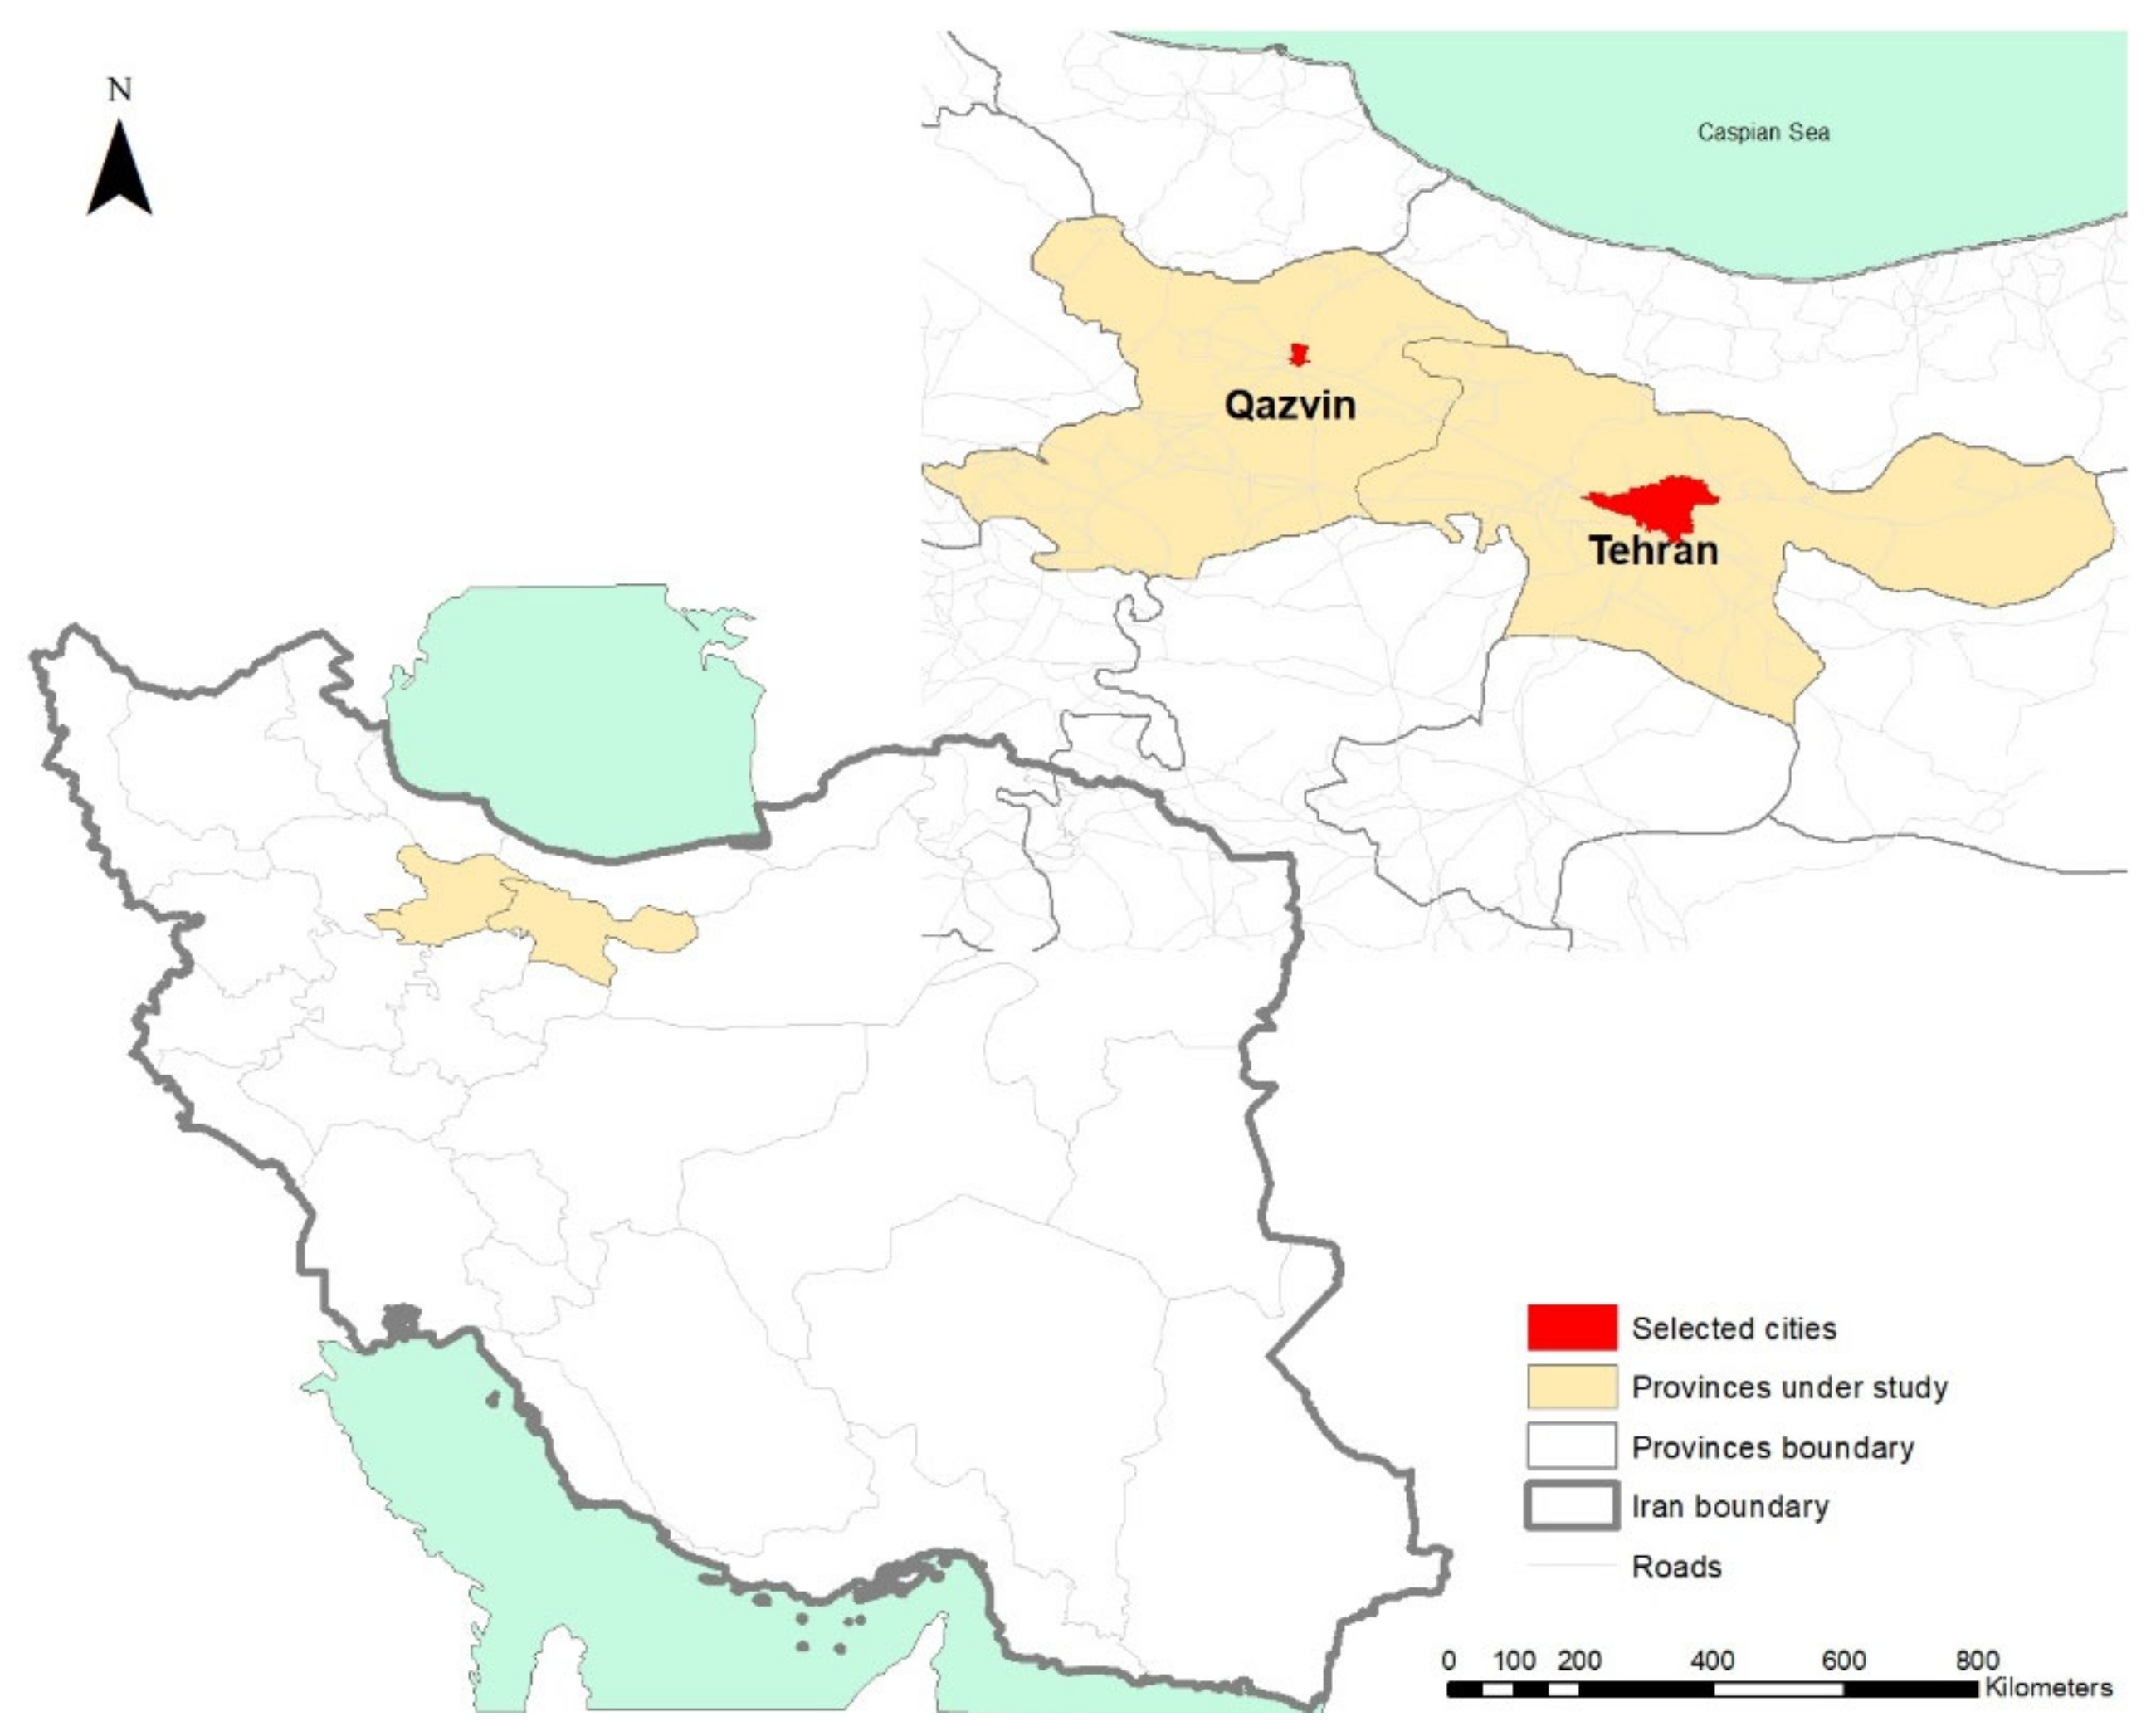
2.2. Study Area
2.3. Data Collection and Analysis
- Macroscale mapping and GIS analysis. National census tracts, local statistics yearbooks, city planning papers, formal governing maps and GIS data in use, technical plans and reports, and academic research schemes were used as data sources in this study. Among the macroscale measures, population and housing densities were estimated by census tract data (2011) published by the Statistics Centre of Iran [67]. Spatial data were obtained from databases of the Tehran and Qazvin master plans released by Tehran municipality and the local department of MRUD in Qazvin. In addition, the date for land areas allocated to Off-street parking (i.e., car parking area) and the number of PT stations (i.e., Transit accessibility) were obtained from the most recent edition of the statistical yearbook for the Tehran and Qazvin municipalities and updated with open-source data (Open Street Map). Similarly, Open Street Map was used to obtain local destinations. In this study, Arc GIS 10.8 was used to retrieve and analyse the acquired spatial information.
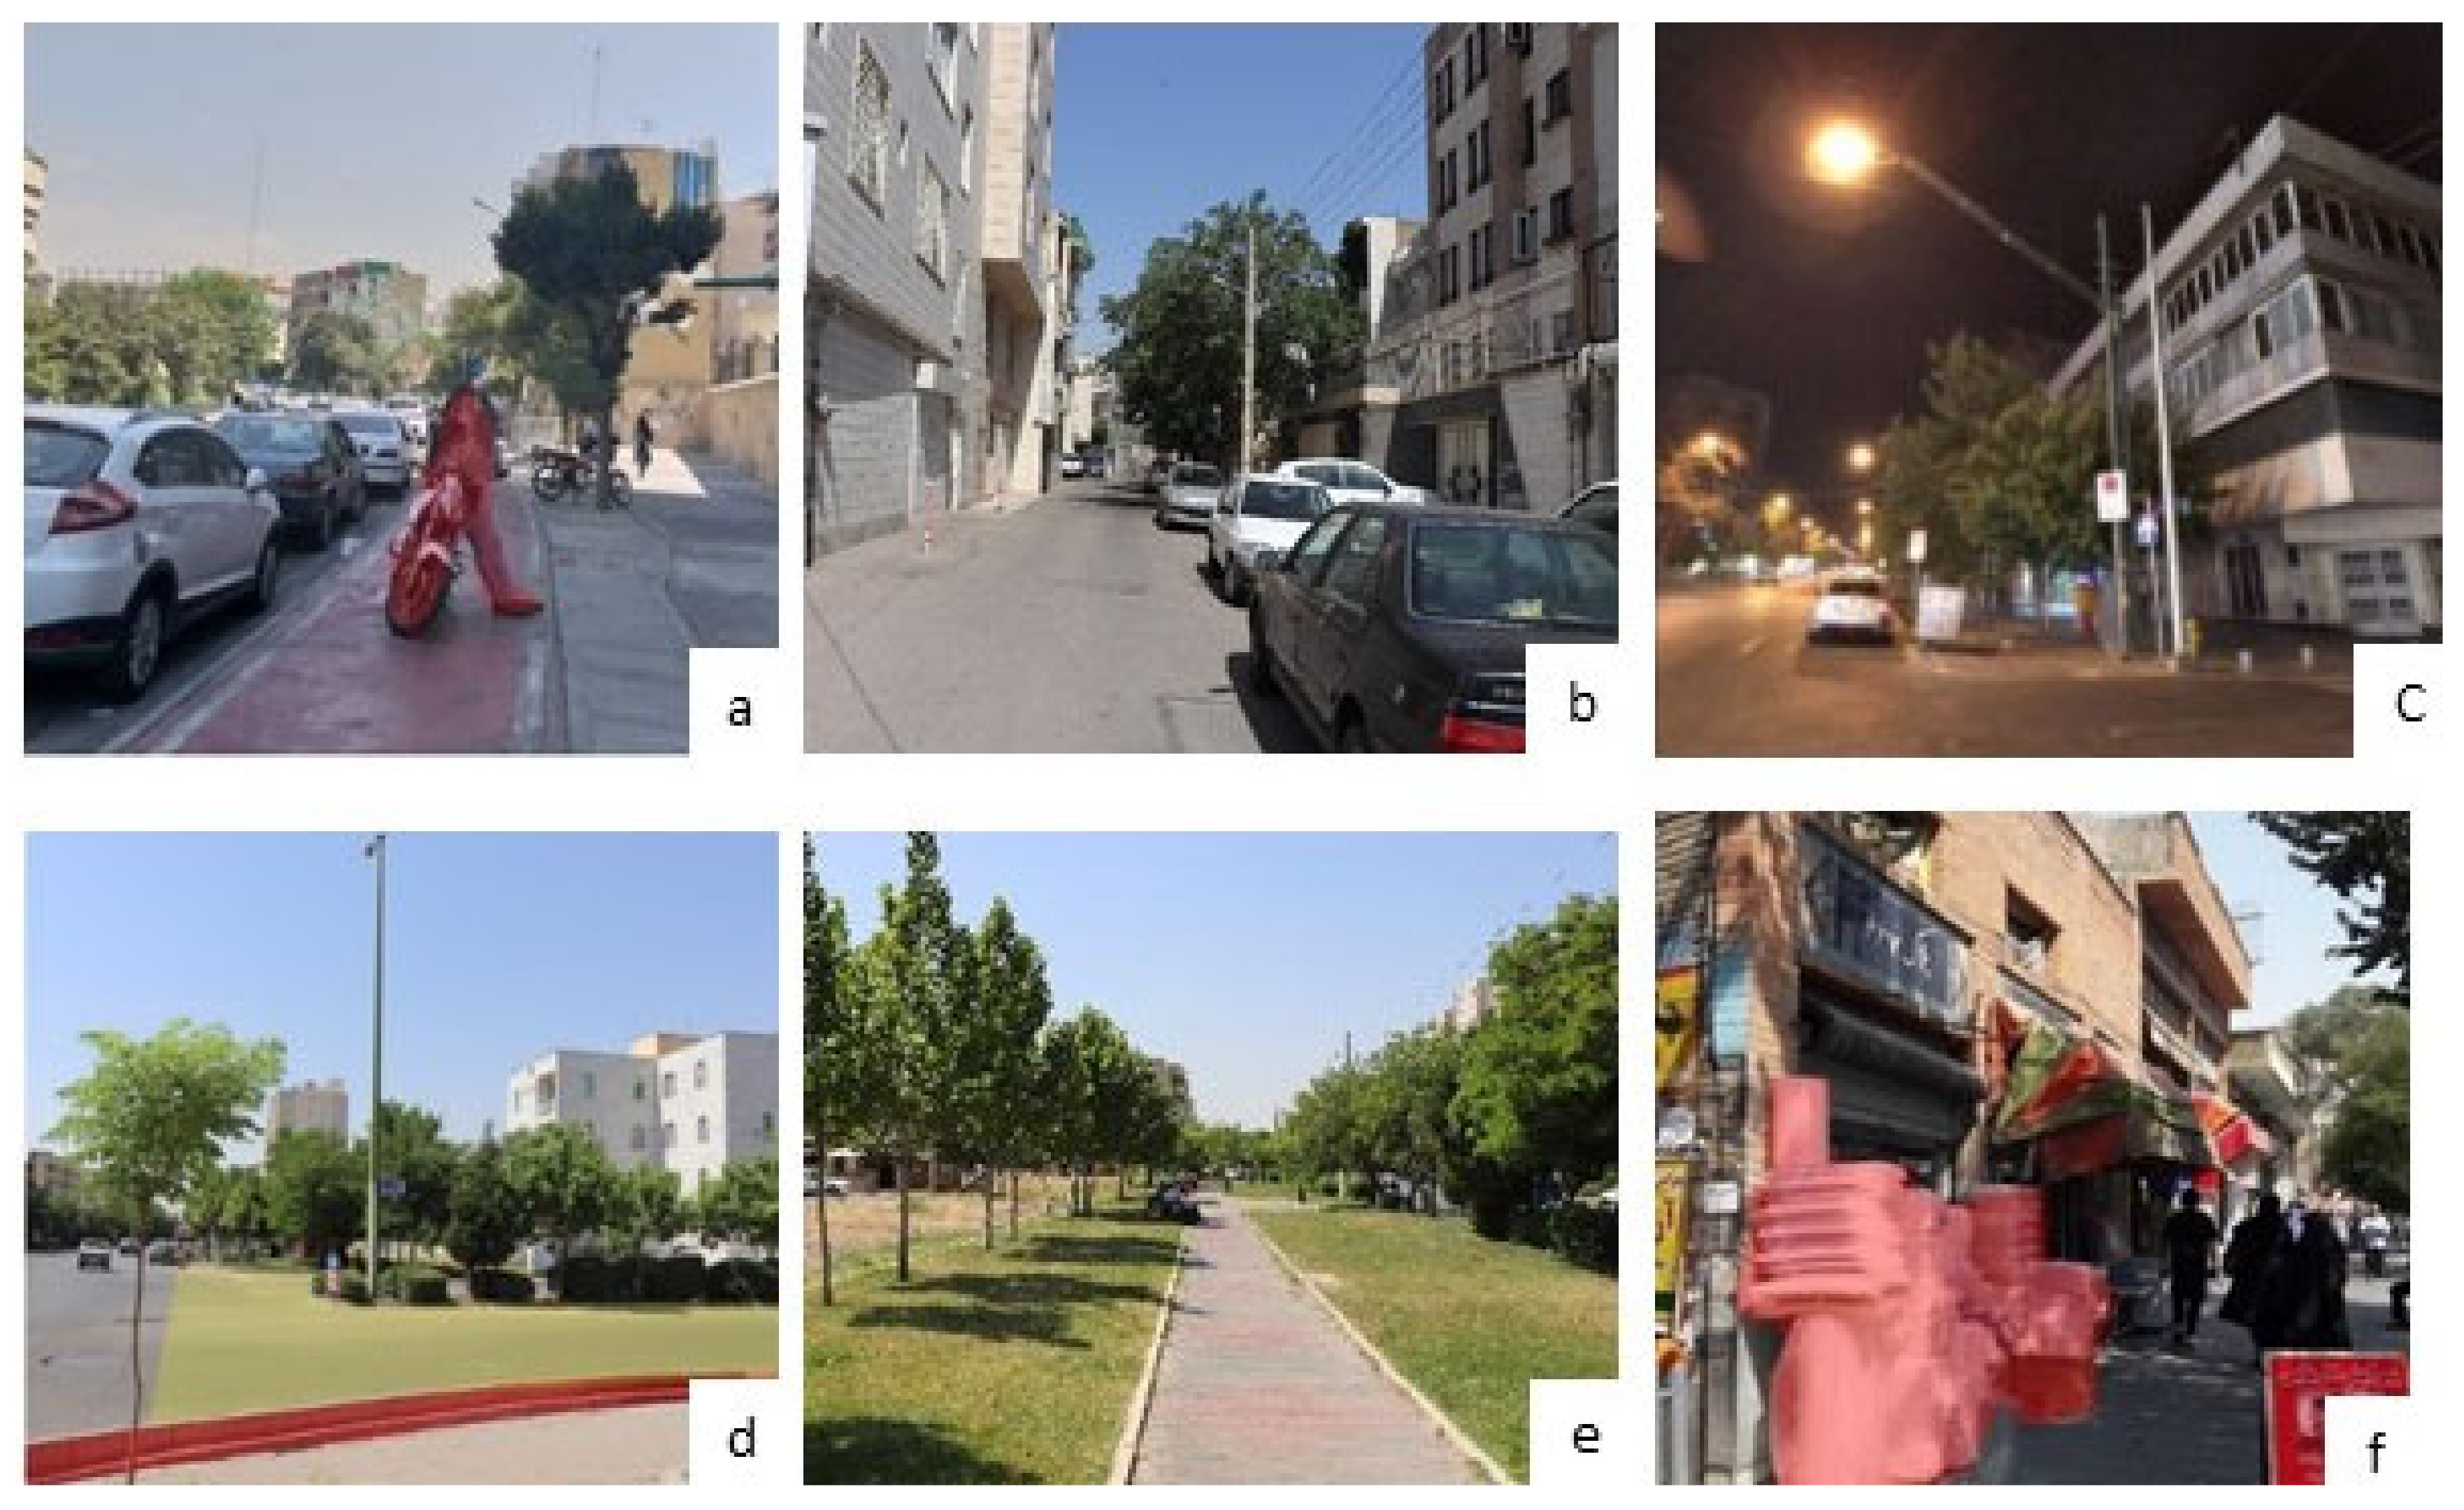
- Direct microscale observation. The required data were gathered by personally observing the selected streets. There were two data collecting rounds (June 2019 and August–September 2020) with three trained observers. To and from the stations, the observers walked the whole length of each street within a 500 m buffer (i.e., walk-by observation). In addition to the fixed-route observation, unstructured observation was undertaken to gather information on specific subjects or places. The streets were monitored on weekdays during morning and evening peak hours (7 a.m.–9 a.m. and 6 p.m.–8 p.m.) for a total of 4 days, with the goal of recording utmost human activity and vehicular traffic behaviour within the street’s built environment. The overall weather quality was appropriate with no wind, rain, or snow. The observations ranged in length from 20 to 60 min for each street, depending on site conditions. Snapping field notes and taking photographs (handheld and fixed-point picturing) were principal means to capture data. Google Street View 360° pictures were also used limitedly in Tehran where accessible.
3. Results and Discussion
3.1. Station Area-Level Design
3.1.1. Density
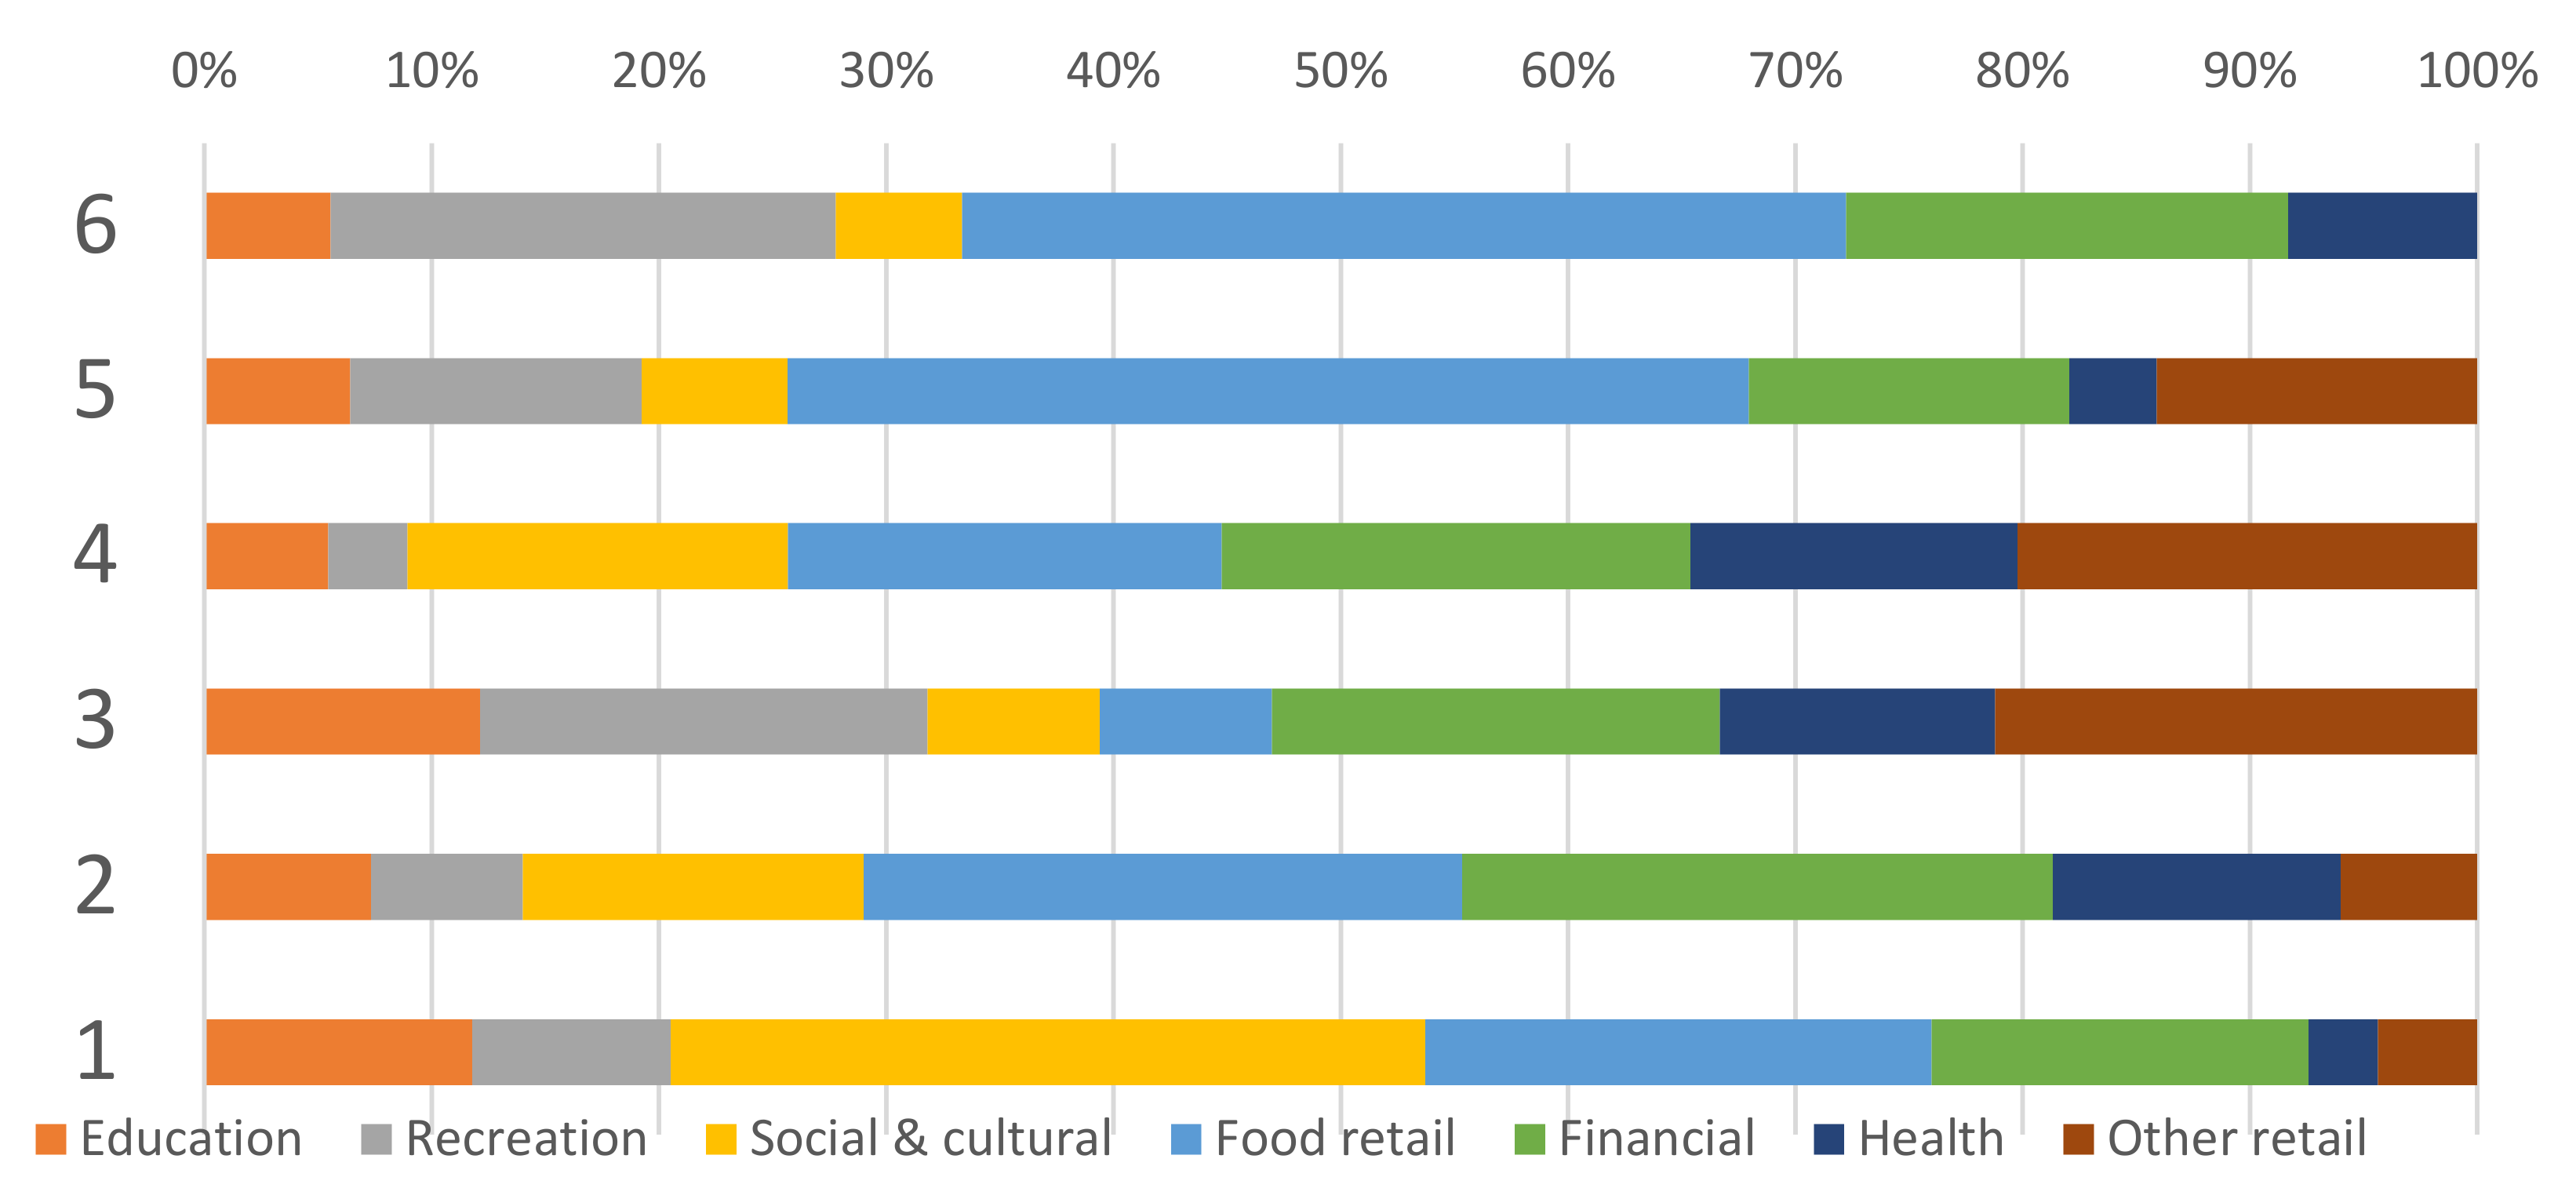
3.1.2. Diversity
3.1.3. Design
3.1.4. Access to Transit
3.2. Street-Level Design
3.2.1. Infrastructure and Access
3.2.2. Mixed Uses and Activities at Street Level
3.2.3. Streetscape
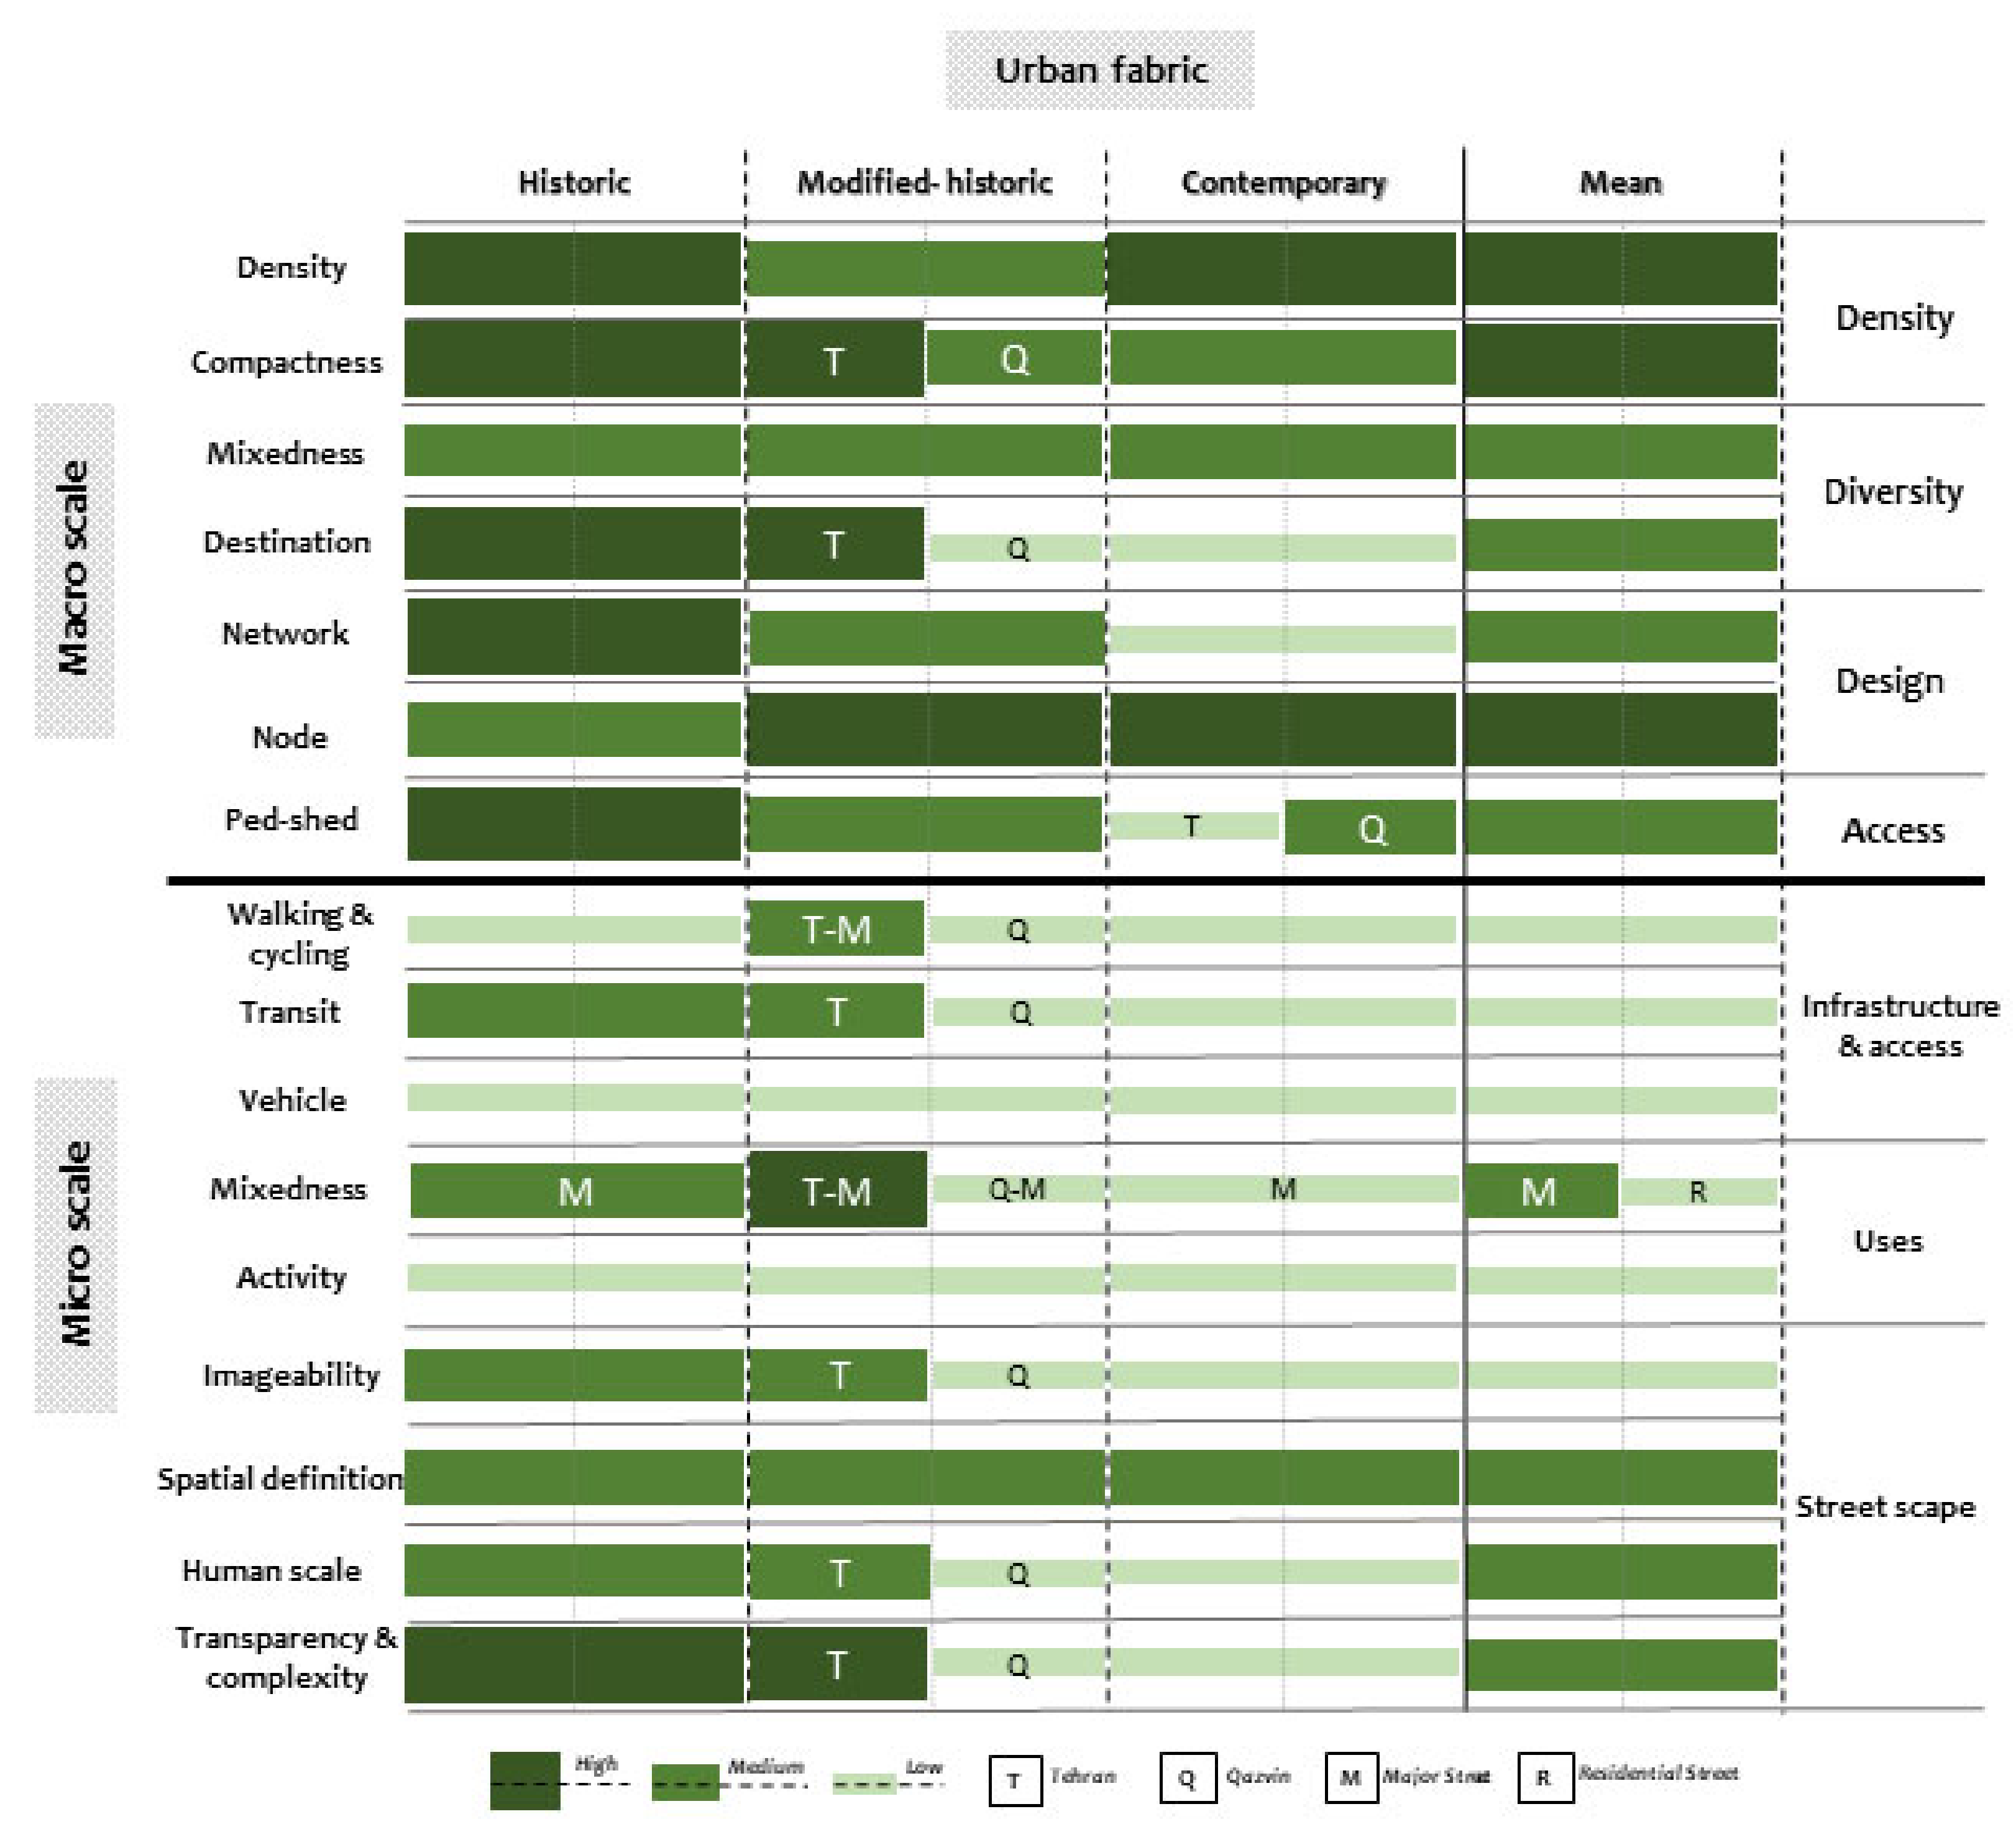
3.3. Synthesis: An Inter-Scale Analysis of Urban Forms
4. Conclusions, Implications, and Future Work
Author Contributions
Funding
Acknowledgments
Conflicts of Interest
References
- Renne, J.L.; Hamidi, S.; Ewing, R. Transit commuting, the network accessibility effect, and the built environment in station areas across the United States. Res. Transp. Econ. 2016, 60, 35–43. [Google Scholar] [CrossRef]
- World Commission on Environment and Development. Our Common Future; Oxford University Press: New York, NY, USA, 1987. [Google Scholar]
- Medved, P. A Contribution to the structural model of autonomous sustainable neighbourhoods: New socio-economical basis for sustainable urban planning. J. Clean. Prod. 2016, 120, 21–30. [Google Scholar] [CrossRef]
- Jacobson, J.; Forsyth, A. Seven American TODs: Good practices for urban design in Transit-Oriented Development projects. J. Transp. Land Use 2008, 1, 51–88. [Google Scholar] [CrossRef] [Green Version]
- Calthorpe, P. Next American Metropolis: Ecology, Community, and the American Dream; Princeton Architectural Press: Princeton, NJ, USA, 1993. [Google Scholar]
- Ewing, R. Pedestrian- and Transit-Friendly Design: A Primer for Smart Growth; American Planning Association: Tallahassee, FL, USA, 1996. [Google Scholar]
- TCRP (Transit Cooperative Research Program). The Role of Transit in Creating Livable Metropolitan Communities; Transportation Research Board: New York, NY, USA, 1997. [Google Scholar]
- TCRP (Transit Cooperative Research Program). Transit Oriented Development and Joint Development in the United States: A Literature Review; Transportation Research Board: New York, NY, USA, 2002. [Google Scholar]
- Dunphy, R.; Deborah, M.; Pawlukiewicz, M. Ten Principles for Successful Development around Transit; ULI—The Urban Land Institute: Washington, DC, USA, 2003. [Google Scholar]
- Ewing, R.; Bartholomew, K. Pedestrian- and Transit-Oriented Design; Urban Land Institute: Washington, DC, USA, 2013. [Google Scholar]
- Pojani, D.; Stead, D. Transit-Oriented Design in the Netherlands. J. Plan. Educ. Res. 2015, 35, 131–144. [Google Scholar] [CrossRef]
- Kong, W.; Pojani, D. Transit-oriented Street design in Beijing. J. Urban Des. 2017, 22, 388–410. [Google Scholar] [CrossRef]
- Southworth, M. Designing the Walkable City. J. Urban Plan. Dev. 2005, 131, 246–257. [Google Scholar] [CrossRef]
- Maxwell, J. Designing for “Life between Building”: Modeling the Relationship between Streetscape Qualities and Pedestrian Activity in Glassgow, Scotland. Doctoral Dissertation, University of Strathclyde, Glasgow, UK, 2016. [Google Scholar]
- Lamour, Q.; Morelli, A.; Marins, K. Improving walkability in a TOD context: Spatial strategies that enhance walking in the Belém neighbourhood, in São Paulo, Brazil. Case Stud. Transp. Policy 2019, 7, 280–292. [Google Scholar] [CrossRef]
- Koo, B.; Guhathakurta, S.; Botchwey, N. How are Neighborhood and Street-Level Walkability Factors Associated with Walking Behaviors? A Big Data Approach Using Street View Images. Environ. Behav. 2021, 54, 211–241. [Google Scholar] [CrossRef]
- Cervero, R.; Kockelman, K. Travel demand and the 3Ds: Density, diversity, and design. Transp. Res. Part D Transp. Environ. 1997, 2, 199–219. [Google Scholar] [CrossRef]
- Ewing, R.; Cervero, R. Travel and the Built Environment: A Synthesis. Transp. Res. Rec. J. Transp. Res. Board 2001, 76, 265–294. [Google Scholar] [CrossRef] [Green Version]
- Ewing, R.; Cervero, R. Travel and the Built Environment: A Meta-Analysis. J. Am. Plan. Assoc. 2010, 76, 265–294. [Google Scholar] [CrossRef]
- Brownson, R.; Hoehner, C.; Kristen Day, M.; Forsyth, A.; Sallis, J. Measuring the Built Environment for Physical Activity; State of the Science. Am. J. Prev. Med. 2009, 36, S99–S123. [Google Scholar] [CrossRef] [Green Version]
- Jeffrey, D.; Boulangé, C.; Giles-Corti, B.; Washington, S.; Gunn, L. Using walkability measures to identify train stations with the potential to become transit oriented developments located in walkable neighbourhoods. J. Transp. Geogr. 2019, 76, 221–231. [Google Scholar] [CrossRef]
- Institute for Transportation and Development Policy. TOD Standard V3.0; ITDP: New York, NY, USA, 2017. [Google Scholar]
- Zhang, Y.; Guindon, B. Using satellite remote sensing to survey transport-related urban sustainability; Part 1: Methodologies for indicator quantification. Int. J. Appl. Earth Obs. Geoinf. 2006, 8, 149–164. [Google Scholar]
- Witten, K.; Pearce, J.; Day, P. Neighbourhood Destination Accessibility Index: A GIS tool for measuring infrastructure support for neighbourhood physical activity. Environ. Plan. A 2011, 43, 205–223. [Google Scholar] [CrossRef]
- Dvorak, B.; Li, W.; Newman, G.; Zhan, X.; Zhao, J.; Zhu, X. Multimodal Transportation Systems and Transit Oriented Development: Concepts for Bryan-College Station, Texas, and Texas A&M University; Department of Urban Planning and Landscape Architecture, College of Architecture, Texas A&M University: College Station, TX, USA, 2015. [Google Scholar]
- Schlossberg, M.; Brown, N. Comparing Transit Oriented Developments Based on Walkability Indicators. J. Transp. Res. Board 2004, 1887, 34–42. [Google Scholar] [CrossRef]
- Ewing, R.; Handy, S. Measuring the Unmeasurable: Urban Design Qualities Related to Walkability. J. Urban Des. 2009, 14, 65–84. [Google Scholar] [CrossRef]
- Singh, Y.; Lukman, A.; Flacke, J.; Zuidgeest, M.; Van Maarseveen, M. Measuring TOD around transit nodes—Towards TOD policy. Transp. Policy 2017, 56, 96–111. [Google Scholar] [CrossRef]
- Ameli, S.; Hamidi, S.; Garfinkel-Castro, A.; Ewing, R. Do Better Urban Design Qualities Lead to More Walking in Salt Lake City, Utah? J. Urban Des. 2015, 20, 393–410. [Google Scholar] [CrossRef]
- Bivina, G.; Gupta, A.; Parida, M. Walk Accessibility to Metro Stations: An analysis based on Meso- or Microscale Built Environment Factors. Sustain. Cities Soc. 2020, 55, 102047. [Google Scholar] [CrossRef]
- Ortega, E.; Martin, B.; Lopez-Lambas, M.; Soria-Lara, J. Evaluating the impact of urban design scenarios on walking accessibility: The case of the Madrid ‘Centro’ district. Sustain. Cities Soc. 2021, 74, 103156. [Google Scholar] [CrossRef]
- Stojanovski, T. Urban design and public transportation—Public spaces, visual proximity and Transit-Oriented Development (TOD). J. Urban Des. 2019, 25, 134–154. [Google Scholar] [CrossRef]
- Soltani, A.; Pojani, D.; Askari, S.; Masoumi, H.E. Socio-demographic and built environment determinants of car use among older adults in Iran. J. Transp. Geogr. 2018, 68, 109–117. [Google Scholar] [CrossRef] [Green Version]
- Sharifi, A.; Murayama, A. Changes in the traditional urban form and the social sustainability of contemporary cities: A case study of Iranian cities. Habitat Int. 2013, 38, 126–134. [Google Scholar] [CrossRef]
- Motealleh, P.; Zolfaghari, M.; Parsaee, M. Investigating climate responsive solutions in vernacular architecture of Bushehr city. Housing and Building National Research Center. HBRC J. 2018, 14, 215–223. [Google Scholar] [CrossRef]
- Moghadam Baboli, F.; Ibrahim, N.; Sharif, D. Design Characteristics and Adaptive Role of the Traditional Courtyard Houses in the Moderate Climate of Iran. Procedia Soc. Behav. Sci. 2015, 201, 213–223. [Google Scholar] [CrossRef] [Green Version]
- Khalili, M.; Amindeldar, S. Traditional solutions in low energy buildings of hot-arid regions of Iran. Sustain. Cities Soc. 2014, 13, 171–181. [Google Scholar] [CrossRef]
- Jamei, E.; Ahmadi, K.; Chau, H.; Seyedmahmoudian, M.; Horan, B.; Stojcevski, A. Urban Design and Walkability: Lessons Learnt from Iranian Traditional Cities. Sustainability 2021, 13, 5731. [Google Scholar] [CrossRef]
- Soltani, A. Iran. In The Urban Transport Crisis in Emerging Economies, 1st ed.; Pojani, D., Stead, D., Eds.; Springer: Cham, Switzerland, 2017; pp. 127–143. [Google Scholar]
- Noohi Tehrani, A. Morphology of Yazd Urban Textures and Their Comparison. J. Appl. Environ. Biol. Sci. 2016, 6, 71–82. [Google Scholar]
- Mirzakhani, A.; Turró, M.; Jalilisadrabad, S. Key stakeholders and operation processes in the regeneration of historical urban fabrics in Iran. Cities 2021, 118, 103362. [Google Scholar] [CrossRef]
- Rashid, Y.; Rashid, A.; Warraich, M.; Sameen Sabir, S.; Waseem, A. Case Study Method: A Step-by-Step Guide for Business Researchers. Int. J. Qual. Method 2019, 18, 1609406919862424. [Google Scholar] [CrossRef] [Green Version]
- Forsyth, A.; Jacobson, J.; Thering, K. Six Assessments of the Same Places: Comparing Views of Urban Design. J. Urban Des. 2010, 15, 21–48. [Google Scholar] [CrossRef]
- Rodríguez, D.; Brisson, E.; Estupiñán, N. The relationship between segment-level built environment attributes and pedestrian activity around Bogota’s BRT stations. Transp. Res. Part D 2009, 14, 470–478. [Google Scholar] [CrossRef]
- Rodriguez, D.; Vergel-Tovar, C. Urban development around bus rapid transit stops in seven cities in Latin-America. J. Urban. 2017, 11, 175–201. [Google Scholar] [CrossRef]
- Talen, E.; Jeong, H. Does the classic American main street still exist? An exploratory look. J. Urban Des. 2018, 24, 78–98. [Google Scholar] [CrossRef]
- Taleai, M.; Taheri Amiri, E. Spatial multi-criteria and multi-scale evaluation of walkability potential at street segment level: A case study of Tehran. Sustain. Cities Soc. 2017, 31, 37–50. [Google Scholar] [CrossRef]
- Yin, R. Case Study Research: Design and Methods; SAGE Publications: Thousand Oaks, CA, USA, 2013. [Google Scholar]
- Almughairy, A. Reinventing Urban Space in Riyadh’s Neighborhoods. J. Archit. Plan. Res. 2017, 34, 295–308. [Google Scholar]
- Baxter, P.; Jack, S. Qualitative Case Study Methodology: Study Design and Implementation for Novice Researchers. Qual. Rep. 2008, 13, 544–559. [Google Scholar] [CrossRef]
- Watson, V. Shifting Approaches to Planning Theory: Global North and South. Urban Plan. 2016, 1, 32–41. [Google Scholar] [CrossRef]
- Healey, P. Urban Complexity and Spatial Strategies: Towards a Relational Planning for Our Times, 1st ed.; Routledge: London, UK, 2006. [Google Scholar] [CrossRef]
- Mitic-Radulovic, A.; Lalovic, K. Multi-Level Perspective on Sustainability Transition towards Nature-Based Solutions and Co-Creation in Urban Planning of Belgrade, Serbia. Sustainability 2021, 13, 7576. [Google Scholar] [CrossRef]
- Sergio Andrés, V. Housing Informality beyond The Urban Poor: Spatialities, Public Institutions, and Social Injustice in Rich Settlements of Bogotá; Gran Sasso Science Institute: Italy, Rome, 2021; Available online: https://iris.gssi.it/retrieve/dfe4cef7-4d1a-ea31-e053-6605fe0a48e4/2021_PhDThesis_Vieda%20Martinez.pdf (accessed on 5 May 2022).
- McCombes, S. Case Study Definition, Examples & Methods. Retrieved from Scribbr. Available online: https://www.scribbr.com/methodology/case-study/ (accessed on 5 May 2022).
- Farthing, S. Research Design in Urban Planning: A Student’s Guide; SAGE Publications Ltd: Thousand Oaks, CA, USA, 2016. [Google Scholar] [CrossRef]
- Mirmoghtadaee, M.; Abdi, M. A National Guideline for Transit-Oriented Development: Challenges and Prospects for the Iranian Edition. Space Ontol. Int. J. 2021, in press. [Google Scholar]
- Mirmoghtadaee, M.; Haghverdian, F.; Salehi Moghadam, A. Guideline for Transit Oriented Development for Medium-Sized Cities; BHRC: Tehran, Iran, 2021. (In Persian) [Google Scholar]
- SCI (Statistical Centre of Iran). The Detailed Results of Iranian National Census 2016; I.R.I.: Tehran, Iran, 2018. [Google Scholar]
- Demographia. Demographia World Urban Areas (Built Up Urban Areas or World Agglomerations). Retrieved from Demographia. 25 June 2020. Available online: http://demographia.com/db-worldua.pdf (accessed on 7 July 2020).
- Road and Urban Development Organization of Qazvin. City Development Strategy of Qazvin. Sharestan Consultant Engineering; Road and Urban Development Organization of Qazvin: Qazvin, Iran, 2010. [Google Scholar]
- Terhan Municipality. Statistical Yearbook 2018–2019; Telecommunication and Information Technology Organization: Tehran, Iran, 2019. [Google Scholar]
- Tehran Municipality. Tehran Statistical Yearbook; Information and Communication Technology Organization of Tehran Municipality: Tehran, Iran, 2019. [Google Scholar]
- Hosseinali, F.; Alesheikh, A.; Nourian, F. Agent-based modeling of urban land-use development, case study: Simulating future scenarios of Qazvin city. Cities 2013, 31, 105–113. [Google Scholar] [CrossRef]
- HCUPA. Tehran City Master Plan Document; Ministry of Road and Urban Development: Tehran, Iran, 2007.
- Road and Urban Development Organization of Qazvin. Qazvin City and Hinterland Comprehensive Plan; Urban Development Organization of Qazvin: Qazvin, Iran, 2015. [Google Scholar]
- SCI (Statistical Centre of Iran). Tehran Census Tract Data; SCI: Tehran, Iran, 2011. [Google Scholar]
- Davies, L. Urban Design Compendium; English Partnerships, the Housing Corporation: London, UK, 2000. [Google Scholar]
- Canepa, B. Bursting the Bubble; Determining the Transit-Oriented Development’s Walkable Limits. J. Transp. Res. Board 2007, 1992, 28–34. [Google Scholar] [CrossRef] [Green Version]
- Abdi, M. What the newcomers to transit-oriented development are confronted with? Evidence from Iranian policy and planning. J. Transp. Geogr. 2021, 92, 103005. [Google Scholar] [CrossRef]
- Marshall, S. The Street: Integrating Transport and Urban Environment. In Handbook of Transport and the Environment; Hensher, D.A., Button, K.J., Eds.; Emerald Group Publishing Limited: Bingley, UK, 2003; Volume 4, pp. 771–786. [Google Scholar]
- Lacofano, D.; Malhotra, M. Streets Reconsidered: Inclusive Design for the Public Realm, 1st ed.; Routledge: New York, NY, USA, 2019. [Google Scholar]
- Southworth, M.; Ben-Joseph, E. Streets and the Shaping of Towns and Cities; Island Press: Washington, DC, USA, 2003. [Google Scholar]
- Bahrainy, H.; Khosravi, H. The impact of urban design features and qualities on walkability and health in under-construction environments: The case of Hashtgerd New Town in Iran. Cities 2013, 31, 17–28. [Google Scholar] [CrossRef]
- Suzuki, H.; Cervero, R.; Iuchi, K. Transforming Cities with Transit: Transit and Land-Use Integration for Sustainable Urban Development; World Bank: Washington, DC, USA, 2013. [Google Scholar]
- Cervero, R. Linking urban transport and land use in developing countries. J. Transp. Land Use 2013, 6, 7–24. [Google Scholar] [CrossRef] [Green Version]
- Abdi, M.; Lamíquiz-Daudén, P. Transit-oriented development in developing countries: A qualitative meta-synthesis of its policy, planning and implementation challenges. Int. J. Sustain. Transp. 2020, 16, 195–221. [Google Scholar] [CrossRef]
- Deng, T.; Nelson, J. Bus Rapid Transit implementation in Beijing: An evaluation of performance and impacts. Res. Transp. Econ. 2013, 39, 108–113. [Google Scholar] [CrossRef]
- Thomas, A.; Deakin, E. Land Use Challenges to Implementing Transit-Oriented Development in China: Case Study of Jinan, Shandong Province. J. Transp. Res. Board 2008, 2077, 80–86. [Google Scholar] [CrossRef]
- Salzberg, A.; Mehndiratta, S.; Liu, Z. Urban Rail Development in China; The Challenges Ahead. J. Transp. Res. Board 2012, 2275, 49–57. [Google Scholar] [CrossRef]
- Wu, I.; Pojani, D. Obstacles to the creation of successful bus rapid transit systems: The case of Bangkok. Res. Transp. Econ. 2016, 60, 44–53. [Google Scholar] [CrossRef]
- Babalik-Sutcliffe, E.; Cengiz, E. Bus Rapid Transit System in Istanbul: A Success Story or Flawed Planning Decision? Transp. Rev. 2015, 35, 792–813. [Google Scholar] [CrossRef]
- François Doulet, J.; Delpirou, A.; Delaunay, T. Taking advantage of a historic opportunity? A critical review of the literature on TOD in China. J. Transp. Land Use 2017, 10, 77–92. [Google Scholar]
- Yang, L.; Dam, K.; Majumdar, A.; Anvari, B.; Ochieng, W.; Zhang, L. Integrated design of transport infrastructure and public spaces considering human behavior: A review of state-of-the-art methods and tools. Front. Archit. Res. 2019, 8, 429–453. [Google Scholar] [CrossRef]
- Su, S.; Zhou, H.; Xu, M.; Ru, H.; Wang, W.; Weng, M. Auditing street walkability and associated social inequalities for planning implications. J. Transp. Geogr. 2019, 74, 62–76. [Google Scholar] [CrossRef]
- Lamíquiz, P.; López-Domínguez, J. Effects of built environment on walking at the neighbourhood scale. A new role for street networks by modelling their configurational accessibility? Transp. Res. Part A 2015, 74, 148–163. [Google Scholar] [CrossRef] [Green Version]
- Soltani, A. Social and urban form determinants of vehicle ownership; evidence from a developing country. Transp. Res. Part A Policy Pract. 2017, 96, 90–100. [Google Scholar] [CrossRef]
- Cubukcu, E.; Mensi, B.; Horoz, C. The Relation Between Urban Morphology and Physical Environmental Qualities: Comparing Walkability in Neighborhoods via Analyses of Spatial Statistics and Indices of Graph Theory and Space Syntax. J. Nat. Appl. Sci. 2019, 23, 658–665. [Google Scholar] [CrossRef] [Green Version]
- Scorza, F.; Fortunato, G.; Carbone, R.; Murgante, B.; Pontrandolfi, P. Increasing Urban Walkability through Citizens’ Participation Processes. Sustainability 2021, 13, 5835. [Google Scholar] [CrossRef]
- Bierbaum, A.; Vincent, J. Putting Schools on the Map: Linking Transit-Oriented Development, Households with Children, and Schools. J. Transp. Res. Board 2013, 2357, 77–85. [Google Scholar] [CrossRef]


| City | Population * (n) | Population Density (pp/km2) ** | Annual Population Growth: (Birth and Migration) (%) * | Mode Share (%) *** | ||||
|---|---|---|---|---|---|---|---|---|
| Private Car | Taxi | Bus | BRT | Subway | ||||
| Tehran | 8,693,706 | 8000 | +1.50 | 51 | 23 | 9 | 7 | 10 |
| Qazvin | 402,748 | 9000 | +5.54 | 48 | 25 | 27 | 0 | 0 |
| Dimension | Measure | Urban Fabric | ||||||||
|---|---|---|---|---|---|---|---|---|---|---|
| Historic | Modified Historic | Contemporary | ||||||||
| Tehran (Site 1) | Qazvin (Site 4) | Mean | Tehran (Site 2) | Qazvin (Site 5) | Mean | Tehran (Site 3) | Qazvin (Site 6) | Mean | ||
| Density | Gross population density (pp/ha) | 173.84 | 154.03 | 163.93 | 107.99 | 81.16 | 94.57 | 123.17 | 105.59 | 114.38 |
| Net population density (pp/ha) | 416.49 | 340.07 | 378.28 | 313.32 | 315.67 | 314.49 | 1223.12 | 389.71 | 806.42 | |
| Gross housing density (du/ha) | 52.02 | 45.16 | 48.59 | 30.47 | 23.32 | 26.89 | 41.20 | 25.48 | 33.34 | |
| Net housing density (du/ha) | 124.61 | 99.70 | 112.15 | 88.42 | 90.70 | 89.56 | 409.14 | 94.05 | 251.60 | |
| Compactness (%) | 98 | 97 | 97.5 | 98 | 61 | 79.5 | 93 | 84 | 88.50 | |
| Dimension | Measure | Urban Fabric | ||||||||
|---|---|---|---|---|---|---|---|---|---|---|
| Historic | Modified Historic | Contemporary | ||||||||
| Tehran (Site 1) | Qazvin (Site 4) | Mean | Tehran (Site 2) | Qazvin (Site 5) | Mean | Tehran (Site 3) | Qazvin (Site 6) | Mean | ||
| Diversity | Entropy | 0.79 | 0.69 | 0.74 | 0.74 | 0.68 | 0.71 | 0.80 | 0.80 | 0.8 |
| Mixedness | 0.44 | 0.38 | 0.41 | 0.50 | 0.34 | 0.42 | 0.84 | 0.50 | 0.67 | |
| Car parking area (ha) | 2.27 | 3.30 | 2.78 | 1.72 | 0.92 | 1.32 | 0.83 | 0.00 | 0.42 | |
| Local destinations (#) | 229 | 257 | 243 | 300 | 78 | 189 | 66 | 36 | 51 | |
| Dimension | Measure | Urban Fabric | ||||||||
|---|---|---|---|---|---|---|---|---|---|---|
| Historic | Modified Historic | Contemporary | ||||||||
| Tehran (Site 1) | Qazvin (Site 4) | Mean | Tehran (Site 2) | Qazvin (Site 5) | Mean | Tehran (Site 3) | Qazvin (Site 6) | Mean | ||
| Design | Street pattern (ground map) |  |  | - |  |  | - |  |  | - |
| Land occupation share of built-up area (%) | 75.48 | 73.16 | 74.32 | 69.68 | 39.11 | 54.40 | 64.51 | 55.08 | 59.80 | |
| Mean residential parcel area (m2) | 156 | 183 | 169.50 | 320 | 205 | 262.50 | 3954 | 261 | 2107.5 | |
| Number of blocks included | 326 | 333 | 329.50 | 348 | 188 | 268.00 | 40 | 202 | 121.00 | |
| Mean block area (m2) | 8009 | 7339 | 7674.0 | 6508 | 8454 | 7481.0 | 60,673 | 11,480 | 36,076.5 | |
| Street network density (km/km2) | 27.64 | 26.52 | 27.08 | 20.37 | 15.85 | 18.11 | 14.95 | 15.40 | 15.18 | |
| Connected node ratio (%) | 62 | 62 | 62.00 | 76 | 69 | 72.50 | 76 | 82 | 79.00 | |
| Permeable network ratio (n per km2) | 14.63 | 13.88 | 14.26 | 7.67 | 9.26 | 8.47 | 5.49 | 7.24 | 6.37 | |
| Dimension | Measure | Urban Fabric | ||||||||
|---|---|---|---|---|---|---|---|---|---|---|
| Historic | Modified Historic | Contemporary | ||||||||
| Tehran (Site 1) | Qazvin (Site 4) | Mean | Tehran (Site 2) | Qazvin (Site 5) | Mean | Tehran (Site 3) | Qazvin (Site 6) | Mean | ||
| Access to transit | Ped-Shed * |  |  | - |  |  | - |  |  | - |
| Transit accessibility (n per km2) | 10.3 | 17.1 | 13.7 | 11.8 | 3.5 | 7.6 | 15.1 | 12.6 | 13.8 | |
| Ped-Shed (%) | 78 | 91 | 84.5 | 72 | 74 | 73 | 42 | 63 | 52.5 | |
| IPCA (%) | - | 42 | 42 | 68 | 51 | 59.5 | 35 | - | 35 | |
 station buffer;
  Ped-Shed;
  transit station.
| Measure | Indicator | Historic | Modified Historic | Contemporary | |||
|---|---|---|---|---|---|---|---|
| Site 1 | Site 4 | Site 2 | Site 5 | Site 3 | Site 6 | ||
| Street for walking and cycling | Walkway and cycleway attributes | 2.7 | 3.3 | 3.6 | 3.0 | 2.3 | 3.6 |
| Facilities for walkers and cyclists | 2.4 | 2.3 | 3.0 | 1.9 | 1.5 | 1.8 | |
| Maintenance and cleanliness quality | 2.4 | 2.7 | 4.1 | 3.8 | 3.3 | 3.7 | |
| Transit node design | Transit station amenities and design | 3.6 | 2.4 | 3.6 | 2.8 | 2.8 | 1.2 |
| Transit node as a community centre | 3.7 | 4.7 | 4.3 | 1.9 | 1.0 | 1.3 | |
| Integration with street | 3.7 | 3.3 | 4 | 2 | 1.7 | 1.3 | |
| Vehicular circulation design | Parking design | 1.8 | 2 | 1.8 | 1.0 | 1.0 | 1.8 |
| Traffic impact | 1.3 | 1.5 | 1.5 | 1.0 | 1.0 | 1.0 | |
| Measure | Observation | Sample Street Observation | |
|---|---|---|---|
| Central (Sites 1, 2, 4) | Peripheral (Site 3, 5, 6) | ||
| Consistent mixing |
|  Image 1. Vali-asr, Site 2 |  Image 2. Basij St., Site 6 |
| Mixed activities |
|  Image 3. Vali-asr St., Site 1 |  Image 4. Golha St., Site 3 |
| Street Feature | Urban Fabric | |||||||||||||
|---|---|---|---|---|---|---|---|---|---|---|---|---|---|---|
| Historic | Modified Historic | Contemporary | ||||||||||||
| Khayyam (Tehran) | Mowlavi (Tehran) | Imam (Qazvin) | Naderi (Qazvin) | Ferdosi (Qazvin) | Vali-Asr (Tehran) | Keshavarz (Tehran) | Karim-Khan (Tehran) | Shahid-Beheshti (Qazvin) | Saremi (Tehran) | Golha (Tehran) | Razmandegan (Qazvin) | Basij (Qazvin) | ||
| Imageability | Courtyard, park, and plaza | 0 | 0 | 0 | 1 | 0 | 0 | 2 | 0 | 2 | 1 | 2 | 2 | 1 |
| Natural landscape | 0 | 0 | 0 | 1 | 0 | 0 | 1 | 0 | 0 | 1 | 0 | 0 | 0 | |
| Noise | 3 | 3 | 2 | 3 | 3 | 3 | 3 | 3 | 3 | 2 | 2 | 2 | 1 | |
| Specific building form | 1 | 2 | 2 | 2 | 0 | 1 | 1 | 1 | 0 | 1 | 0 | 0 | 0 | |
| Identifiable building | 3 | 3 | 3 | 3 | 3 | 3 | 3 | 2 | 1 | 0 | 2 | 1 | 1 | |
| Historic building | 1 | 1 | 1 | 0 | 0 | 0 | 0 | 0 | 0 | 0 | 0 | 0 | 0 | |
| Human scale | Small planter | 1 | 1 | 1 | 2 | 1 | 2 | 2 | 1 | 1 | 1 | 0 | 1 | 2 |
| Furniture | 2 | 3 | 2 | 3 | 2 | 3 | 3 | 2 | 1 | 1 | 0 | 1 | 1 | |
| Street-level windows | 3 | 3 | 3 | 3 | 3 | 3 | 3 | 1 | 1 | 0 | 2 | 1 | 1 | |
| Pavement texture | 2 | 1 | 2 | 2 | 2 | 3 | 2 | 1 | 0 | 2 | 1 | 2 | 2 | |
| Parked cars | 2 | 2 | 1 | 2 | 2 | 2 | 2 | 3 | 2 | 2 | 3 | 2 | 1 | |
| Building details | 2 | 2 | 2 | 1 | 1 | 1 | 1 | 1 | 1 | 0 | 1 | 1 | 1 | |
| Building height | 1 | 1 | 1 | 1 | 1 | 2 | 2 | 2 | 1 | 2 | 1 | 2 | 2 | |
| Transparency | Street-level windows | 3 | 3 | 3 | 3 | 3 | 3 | 3 | 1 | 1 | 0 | 2 | 1 | 1 |
| Façade continuity | 3 | 3 | 3 | 2 | 3 | 3 | 3 | 2 | 1 | 1 | 2 | 2 | 2 | |
| Active uses | 3 | 2 | 3 | 3 | 3 | 2 | 2 | 1 | 0 | 0 | 2 | 1 | 1 | |
| Street vendor | 1 | 2 | 2 | 2 | 1 | 2 | 1 | 0 | 0 | 0 | 0 | 0 | 0 | |
| Street trees | 3 | 2 | 3 | 3 | 2 | 2 | 3 | 2 | 2 | 1 | 0 | 2 | 3 | |
| Building details | 2 | 1 | 1 | 1 | 1 | 1 | 1 | 0 | 0 | 0 | 1 | 1 | 0 | |
| Complexity | Building type and number | 3 | 2 | 2 | 3 | 2 | 3 | 2 | 2 | 3 | 1 | 1 | 2 | 1 |
| Architectural diversity | 2 | 2 | 1 | 2 | 1 | 3 | 2 | 3 | 1 | 1 | 0 | 1 | 1 | |
| Building ornamentation | 2 | 2 | 1 | 2 | 2 | 2 | 2 | 2 | 1 | 1 | 1 | 1 | 1 | |
| Light and shade by trees | 3 | 3 | 3 | 2 | 2 | 2 | 3 | 1 | 2 | 1 | 0 | 2 | 2 | |
| Street furniture | 2 | 3 | 2 | 3 | 2 | 3 | 3 | 2 | 1 | 1 | 0 | 1 | 1 | |
| Signage | 2 | 3 | 2 | 3 | 2 | 3 | 3 | 2 | 1 | 1 | 2 | 0 | 0 | |
 none;
none;  low;
low;  moderate;
  high.
high.| Synthesis Map | Urban Fabric | ||
|---|---|---|---|
| Historic | Modified Historic | Contemporary | |
| Street network and activities |  |  |  |
| Notes | Commercial ribbons along main streets, as along with centred retails (Bazaar) | A higher number of large-scale facilities along with small-scale services oriented to major streets in this form | Distributed facilities throughout new developments |
Publisher’s Note: MDPI stays neutral with regard to jurisdictional claims in published maps and institutional affiliations. |
© 2022 by the authors. Licensee MDPI, Basel, Switzerland. This article is an open access article distributed under the terms and conditions of the Creative Commons Attribution (CC BY) license (https://creativecommons.org/licenses/by/4.0/).
Share and Cite
Abdi, M.H.; Soltani, A. Which Fabric/Scale Is Better for Transit-Oriented Urban Design: Case Studies in a Developing Country. Sustainability 2022, 14, 7338. https://doi.org/10.3390/su14127338
Abdi MH, Soltani A. Which Fabric/Scale Is Better for Transit-Oriented Urban Design: Case Studies in a Developing Country. Sustainability. 2022; 14(12):7338. https://doi.org/10.3390/su14127338
Chicago/Turabian StyleAbdi, Mohammad Hamed, and Ali Soltani. 2022. "Which Fabric/Scale Is Better for Transit-Oriented Urban Design: Case Studies in a Developing Country" Sustainability 14, no. 12: 7338. https://doi.org/10.3390/su14127338