Article

Fatigue Crack Propagation and Life Analysis of Stud Connectors in Steel-Concrete Composite Structures

1
School of Civil Engineering, Central South University of Forestry and Technology, Changsha 410004, China
2
School of Civil Engineering, Changsha University of Science & Technology, Changsha 410114, China
*
Author to whom correspondence should be addressed.
Sustainability 2022, 14(12), 7253; https://doi.org/10.3390/su14127253
Submission received: 14 May 2022 / Revised: 3 June 2022 / Accepted: 10 June 2022 / Published: 14 June 2022

Abstract

:
To investigate the fatigue performance of the stud connectors of steel-concrete structures, fatigue crack propagation analysis and fatigue life calculation were carried out. Firstly, the finite element model with the initial crack based on linear elastic fracture mechanics (LEFM) was established, and the parameter analysis of the stress intensity factors (SIFs) of the studs and cracks with different geometric sizes was performed. Then, the propagation with mixed-type fatigue crack and I-type fatigue crack of the stud were calculated, and the variation of effective SIFs with the fatigue crack depth was analyzed. Finally, the flow chart of stud fatigue life evaluation which considers crack initiation and stable propagation was presented, and the short stud of steel-UHPC composite structures was taken as an example and verified. The calculation results show that the fatigue crack propagation type and the initial crack have an obvious influence on the fatigue life of the stud. It has acceptable accuracy that the fatigue life of short stud in UHPC simulated by considering the crack initiation. The critical damage parameters are greatly affected by the fatigue stress amplitude, and the initiation life of fatigue crack can account for more than 90% of the total fatigue life. This paper can provide a reference for evaluating the fatigue performance of studs in steel-concrete composite structures. Accurate evaluation of the fatigue life of stud connectors conforms to the concept of sustainable development.

1. Introduction

The fatigue of metal materials is an important factor affecting the service life and operation safety of steel bridge structures [1]. On account of the influence of material properties and welding quality, the initiation and propagation of microscopic cracks under cyclic loading is an intractable problem. The engineering practice shows that it is difficult to detect the microscopic cracks with naked eyes at the beginning of fatigue cracking [2]. August Wöhler put forward the concept of stress amplitude-fatigue frequency curve [3]. In the subsequent fatigue design, the nominal stress amplitude of the structure is controlled in a reasonable range [4,5,6,7], and the different fatigue strengths of welded joints were classified by the standard [8]. The essence of limiting the stress amplitude is to make the stress amplitude less than the threshold of microcrack propagation.
The steel-concrete composite structure is widely applied in bridge construction because of its superior performance and convenient construction [9]. Researchers have carried out extensive studies on its performance. Whitworth et al. [10] used neural network technology to optimize the embodied energy of composite beams. Similarly, Xiang et al. [11] proposed a life-cycle simulation method of temperature field and temperature effect of steel-concrete composite bridge deck system through the BP-LSTM algorithm. Gunes et al. [1] investigated the fatigue behavior of welded joints of steel-concrete composite beams with full depth transverse stiffeners through repeated loading tests. Welded joints are one of the important parts of steel-concrete composite structures with various numbers and styles, and the welding details with eccentric load or residual stress are prone to fatigue cracking [12]. Recent accident studies show that deformation fatigue caused by welding defects between studs and steel beams is one of the causes of the collapse of metro overpasses in Mexico City [13]. The stud connector is an important component of steel-composite structures which are welded to steel plates and encased in cast concrete. However, it is difficult to carry out evaluate fatigue cracks without destructive detection owing to the coverage of concrete [14].
As mentioned above, for the fatigue assessment of the stud connectors, it is to predict the fatigue life under different conditions by fitting the nominal shear stress amplitude and fatigue action times. However, in the operation of the bridge, it is located multi-axis composite stress mode that the stud not only bears shear stress but also bears a certain tension, especially for the short studs in the steel-UHPC composite structure. Therefore, the traditional S-N method has certain limitations in evaluating the fatigue performance of stud connectors with different types and application scenarios. Under the background of the new materials and new structures in the increasing application of steel-concrete composite structures [15,16], the formulas obtained by experimental fitting are difficult to apply to different types and materials of studs. Lee et al. [17] found that the fatigue life of large diameter studs which with diameters over 30 mm was lower than the predicted value of existing specifications through the fatigue test. Xu et al. [18] proved that the rubber sleeve would reduce the shear stiffness of the stud and lead to the reduction of fatigue life. Cao et al. [19] conducted a push-out test on the short stud in steel-UHPC composite structure and found that it had slightly superior fatigue performance compared with the stud in ordinary concrete. In recent years, with the development of the finite element method, the linear elastic fracture mechanics (LEFM) method has been widely used in fatigue performance evaluation in the engineering field. Yang [20] analyzed the mechanical properties and asymmetric fracture conditions of the column top plate in shallowly buried coal seam by using the fracture mechanics method. Wang et al. [21] analyzed the fatigue performance of the studs in the composite beam based on the LFEM method. However, the initiation life of fatigue cracks has a significant effect on the fatigue performance of the studs, and the research on the studs in composite structures based on the fracture mechanics method remains to be further studied.
This study performed the fatigue crack propagation analysis and fatigue life evaluation of stud connectors. Firstly, a finite element model of studs with initial cracks was established based on LEFM. Then, the influence of different size parameters of the stud and initial crack on SIFs was studied. The fatigue crack propagation of stud connectors was analyzed, and the characteristics of three-dimensional fatigue crack and the variation of SIFs were investigated. A hypothesis of I-type fatigue crack propagation was proposed and compared with mixed-type fatigue crack propagation. Based on the above analysis, a fatigue assessment flow chart was proposed which considers the fatigue initiation life and stable propagation life. The critical damage plane method was used to calculate the fatigue vulnerable element and the corresponding critical plane of the stud for obtaining the fatigue crack initiation life of the stud. The stable propagation life of the stud was obtained by substituting the simplified SIFs into the Paris formula. Finally, the total fatigue life of short studs in UHPC was obtained and the calculation results were compared with the test results and those of the specification.

2. Fatigue Propagation Analysis of Stud Connectors

2.1. Analysis Method of LEFM

As one of the most important components in the connection between steel and concrete, a large number of experiments have been carried out on the fatigue performance of stud connectors. At present, researches on the fatigue performance of stud connectors follow the S-N curve method of metal fatigue analysis, and it is determine the relationship between fatigue stress amplitude and fatigue life in the form of logarithmic formula by fitting a large number of experiment data. However, the application of the S-N curve method has certain limitations which can only evaluate the whole life of materials and do not distinguish the initial crack initiation from the macroscopic crack propagation process. On the other hand, for stud connectors, the data of fatigue action times and nominal stress amplitude are obtained by the push-out test or beam test, which is required to involve the structural level rather than the metal material of the stud itself. Engineering projects show that although the S-N curve method is conservative in structural design, structural fatigue fracture still occupies the majority of structural failure cases, which is detrimental to the sustainable development of bridge engineering. The LEFM method, a mechanical analysis method used to study the conditions for initiation of crack propagation and the law of crack propagation in cracked members has continuously developed in recent years. At the level of standardization, the shipping industry has currently required an LNG Type B cargo compartment to execute cracking expansion analysis based on the LEFM method [22]. At the application level of the engineering structure, engineering critical assessment (ECA) is applied to analyze existing cracks to support maintenance decision-making and formulate inspection schemes [23].
Based on the above description and discussion, the fatigue crack propagation of stud connectors was analyzed by the finite element method of LEFM in this study, and the variation of SIFs during the propagation process was studied. The M-integral method was adopted to calculate the SIFs [24], which were co-simulated by fracture mechanics software Franc 3D and general finite element software Abaqus. The method of co-simulation is shown in Figure 1, and the specific operation process is as follows: First, the structure was modeled by Abaqus software version 6.20 (crack-free FE model), and the material properties, boundary conditions, and contact relationships were defined. Then, fatigue cracks were introduced into the initial defect positions of stud connectors as shown in Figure 1 and the semi-elliptic cracked FE model was established.
After the initial cracks were introduced, the mesh of the sub-model needs to be redivided, which used a variety of types of elements as shown in Figure 2. To be specific, the tetrahedral element was adopted to divide the global mesh. The elements of the crack tip were composed of three-ring, the 15-node singular element, and the 20-node hexahedral element were adopted to define the inner ring and outer ring, respectively. The pentahedral element was adopted between the outer ring and the global mesh for transition. After the above steps were completed, the calculations of the finite element were performed. The program automatically imported the calculation results into Franc 3D through Python script files, and the stress–strain field and displacement calculation results of the crack tip were processed, three types of SIFs (open, slide, and tear) were obtained, respectively. By defining the fatigue crack propagation parameters and the propagation step, redefining the crack surface, and dividing the mesh, the crack can be propagated. The Abaqus software was used for calculation again, and the cycle was followed until the set critical size was reached. Due to the large computational workload of the experimental model, the region to be performed for crack propagation analysis was defined as a sub-model, the sub-model was meshed separately with tetrahedron element and then assembled with the original model. The establishment of a sub-model greatly improves the computational efficiency of fatigue crack propagation analysis.

2.2. Finite Element Modeling

The push-out test is usually adopted to analyze the static and fatigue properties of stud connectors in steel-concrete composite structures. In this study, the specimens were designed according to the standard of Eurocode 4 [5,25], which is composed of I-steel plates, stud connectors, concrete plates, and structural steel bars. Two studs are arranged on each side of the steel plate by arc welding, 4 in total. The transverse spacing of the studs is 80 mm, and the detailed size and layout of the specimen are shown in Figure 3. To study the fracture mechanical properties of different sizes of studs, three stud parameters with different diameters and four different lengths were set. The detailed dimensions of the stud and welded collar refer to the specification of the cylindrical head stud [26]. Only a quarter of the models were built based on the symmetry of the specimens. The C3D8R element was used for concrete, steel beams, and studs. The truss element was used to define steel bars. The relation definition of the contact between the stud and concrete is important for calculation. In this paper, the contact between the two materials was set as face-to-face contact to simulate the combined action between those two materials. The tangential direction was set as a penalty function (the friction coefficient was taken as 0.4), and the normal direction was set as hard contact.
Material parameters for concrete, I-steel, stud connectors, and reinforcement in the model are defined separately as follows, and the type of material is noted in parentheses. The yield strength and ultimate strength of the stud connector (ML-15) are 442 MPa and 525 MPa, respectively. The yield strength and ultimate strength of the I-steel (Q345) are 352 MPa and 495 MPa, respectively, and the yield strength of the structural reinforcement bar (HPB300) is 365 MPa. The elastic modulus of all steel was set at 2.06 × 10⁵ MPa. The plastic damage model is adopted for the material properties of concrete (C50), and the parameters and calculation formulas of uniaxial tension and compression are given in the literature [27]. The uniaxial tension parameters include the parameter value αt of concrete uniaxial tensile stress–strain curve drop pair. The representative value ft,r of uniaxial tensile strength of concrete; The peak tensile strain εt,r of concrete corresponds to the representative value of uniaxial tensile strength. The uniaxial compression parameters include elastic modulus Ec of concrete, parameter value αc of the descending section of the stress–strain curve of concrete under uniaxial compression, and representative value fc,r of uniaxial compressive strength of concrete. The peak tensile strain εc,r of concrete corresponds to the representative value of uniaxial compressive strength. Table 1 shows the values of the above parameters.

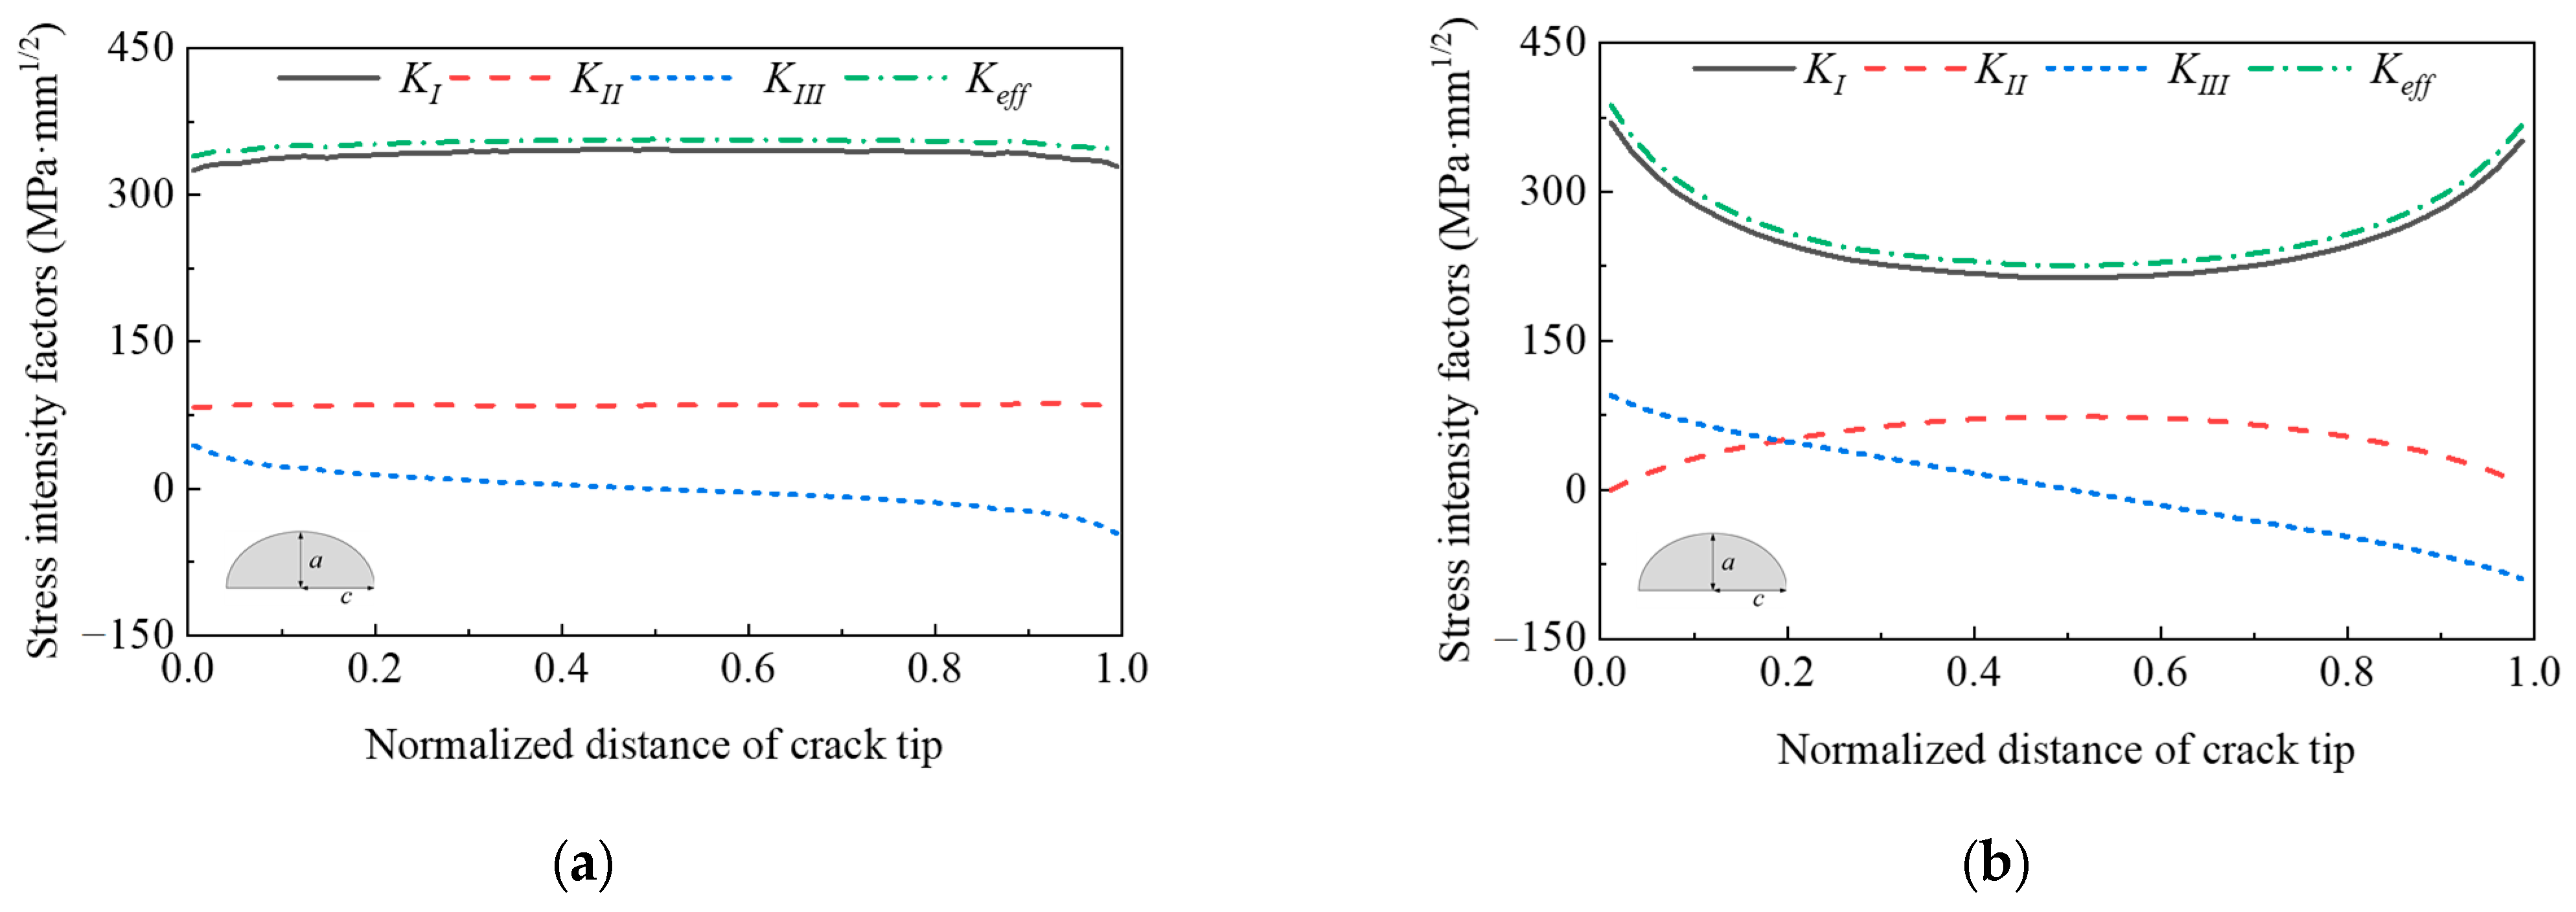
2.3. Analysis of SIFs

The fatigue fracture modes of stud connectors mainly include the following three types. One is the damage to welded collar caused by welding quality. The second is fatigue crack until failure in the stud shank is produced in the case of good welding quality. The third is the fatigue damage caused by initial defects in the interface between the stud shank and welded collar due to welding quality. The third type of initial defect is more likely to be caused. For the third case, the initial crack was introduced, and the fatigue crack propagation was analyzed in this study.
In the British Standards Guide BS 7910 [23], the initial crack is defined as a semi-elliptical shape, its geometric parameters are defined by long half-degree length c and short half-axis depth a, and the ratio between a and c was defined as the shape ratio of crack. Before the fatigue crack propagation analysis, the influence of the initial crack and stud with different sizes on the SIF was calculated. As mentioned above, there were three different diameters (13 mm, 16 mm, and 19 mm), four different lengths (50 mm, 70 mm, 90 mm, and 110 mm), and five different shape ratios of initial crack (0.2, 0.4, 0.6, 0.8 and 1.0) were selected to analyze. The value of displacement loading was taken as 0.1 mm, and the initial crack depth a was set as 0.15 mm.
A series of calculations were performed through co-simulation presented in Figure 1. It is found that the SIFs of studs with different diameters under different shape ratios of initial crack are complex types dominated by the type I (open) SIFs, and the shape ratios of initial crack not only affect the size of the SIFs but also the distribution characteristics. Effective SIF (Keff) is used to evaluate the SIFs of complex fatigue crack, which is calculated by Equation (1), where the v represents Poisson’s ratio and was taken as 0.3. Figure 4 shows the distribution of SIFs with an a/c ratio of 0.2 and 1, respectively. Two characteristics are presented. One is the convex distribution with the maximum value at the center of the crack tip as shown in Figure 4a, and the other is the concave distribution with the maximum value at the two endpoints as shown in Figure 4b. It indicates that the driving force of fatigue crack propagation at the crack tip is different depending on the initial defect.
To facilitate the analysis of the influence of different parameters, the comparison of Keff combining the stud length, diameter, and crack shape ratio is shown in Figure 5, which are compared to the values of Keff/Keff,max, the Keff,max represents the extreme value in each set of data. It can be seen from the figure that the Keff at the midpoint of the crack front is larger than the endpoint value for a crack with a small shape (long and narrow crack). The influence of crack shape ratio on different sizes of the stud is obvious, and the Keff of the initial crack is almost not affected by the length of the stud.
K e f f = ( K I 2 + K I I 2 + K I I I 2 / ( 1 v ) ) 1 / 2

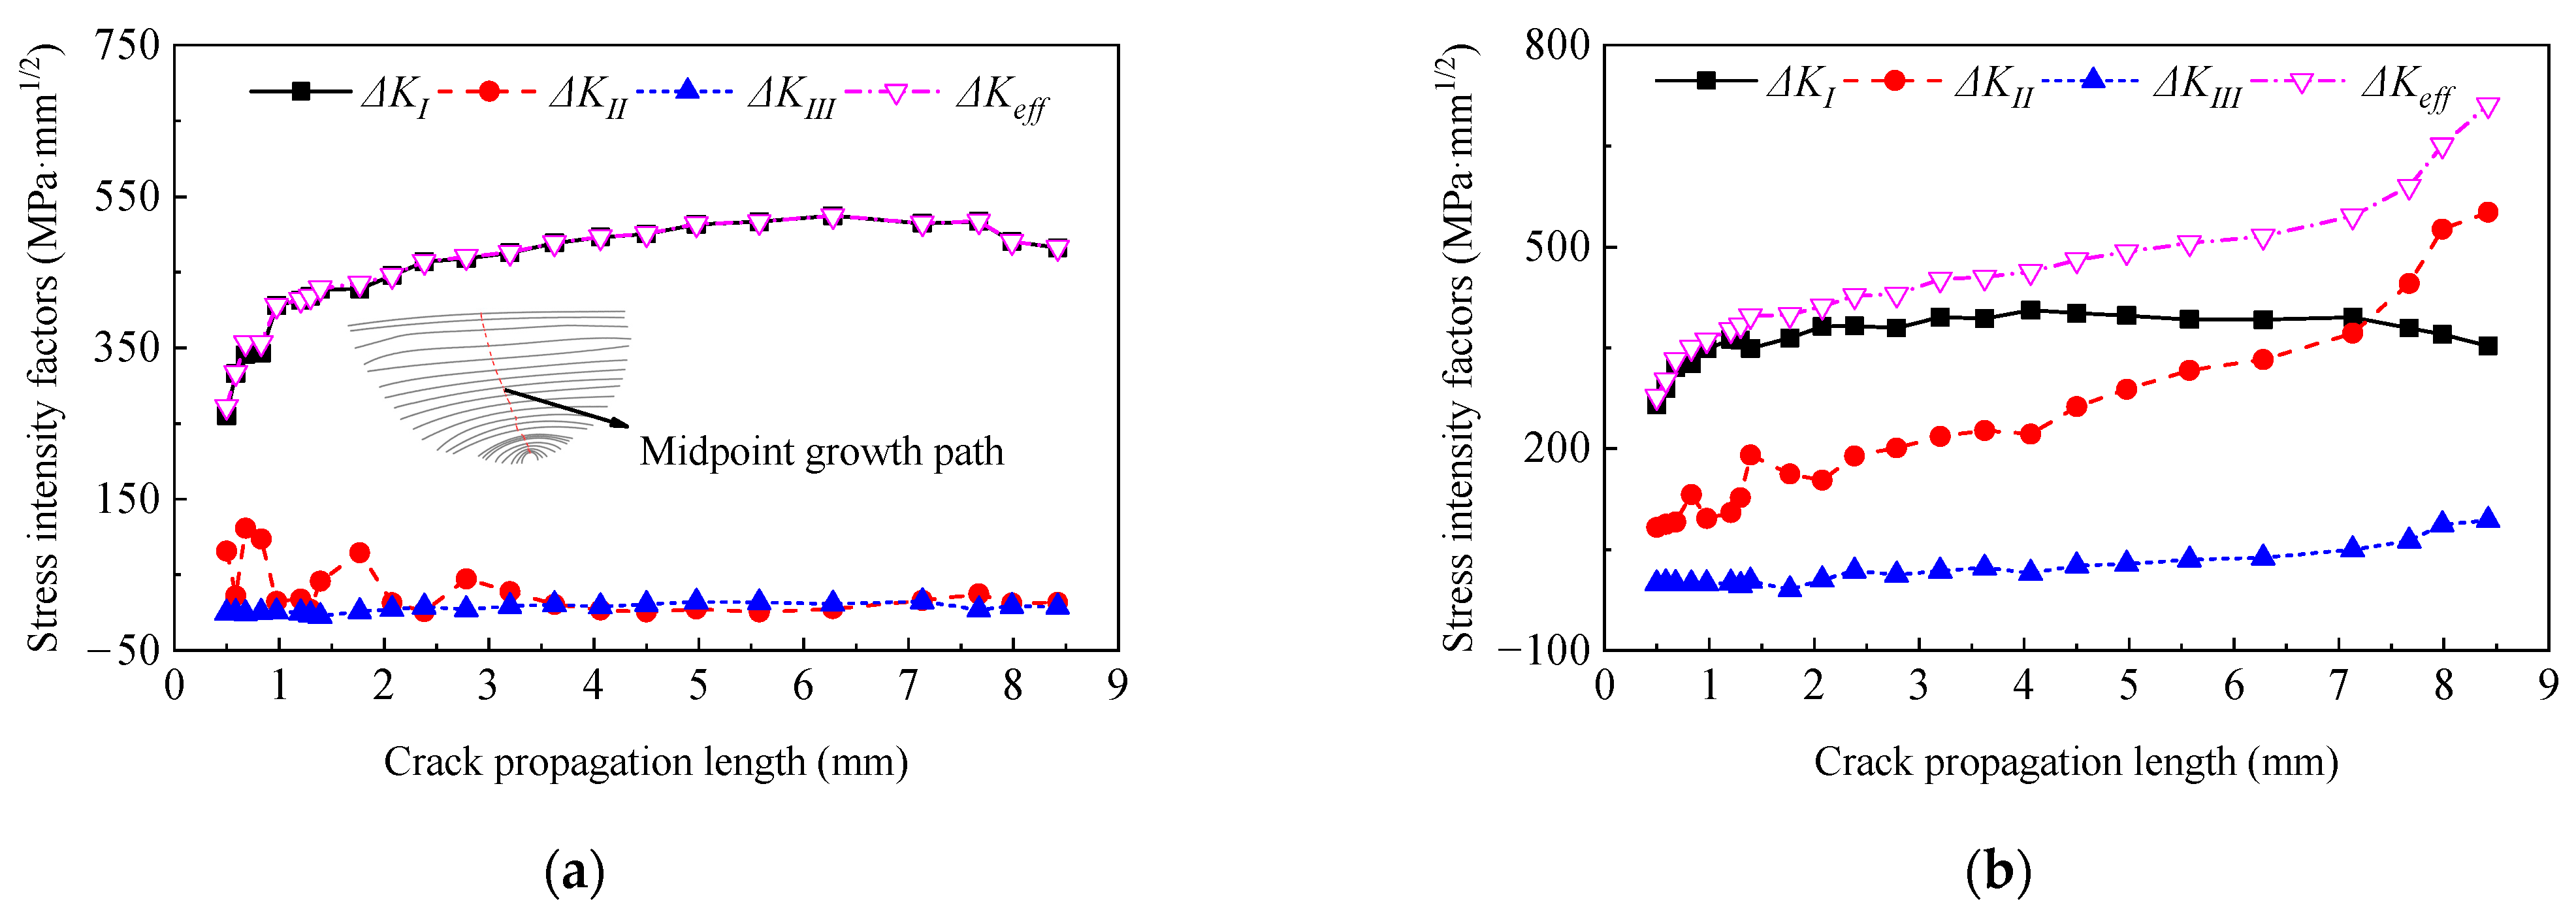
2.4. Analysis of Fatigue Crack Propagation

According to the above analysis, the finite element simulation of fatigue crack propagation for the stud was performed. The model with a diameter of 13 mm and a length of 70 mm in the above analysis was used for fatigue crack propagation analysis, and the nominal stress amplitude of the stud was 120 MPa with the upper limit of stress, which was taken as 150 MPa. The method in Figure 1 and instructions on the official website of the software Franc 3D was used for the calculation [28]. The propagation angle of a mixed-type fatigue crack was calculated by the maximum circumferential tensile stress criterion (MTS), and the calculation formula is shown in Equation (2). It is worth noting that a series of fracture mechanics parameters must be defined before fatigue crack propagation calculations are performed. In the simulation of fatigue crack propagation, it is generally considered that the initial crack belongs to an engineering detectable crack and is no more than 0.5 mm, previous studies indicate that the value of a0 in LEFM theory should not be less than 0.1 mm. By defining the fatigue crack as the most unfavorable case with a = c = 0.5 mm, Zhang et al. [29] analyzed the fatigue crack propagation in the double-sided welding details of steel bridge decks effectively. In this paper, this typical shape of the initial crack was introduced for calculation. In addition, other parameter settings of fracture mechanics in Zhang’s study were referred to. The fatigue crack propagation is determined by the threshold of SIFs (ΔKth). The crack propagates when the amplitude of effective SIF is greater than the threshold (ΔK > ΔKth). Otherwise, the expansion stops, and the threshold was taken as 63 MPa·mm1/2. The critical value of SIFs is the fracture toughness (KIC) of the material. The crack propagation is in the stage of rapid expansion when the maximum value of SIF (Kmax) is close to the KIC, and until the Kmax at the crack tip reaches the fracture toughness, and the material appears unstable fracture. The Paris formula is usually used to describe the law of fatigue crack propagation. However, there is a lack of data related to the fatigue properties of the stud material. C and m are both material parameters characterizing crack propagation characteristics. Referring to the study performed by Xu et al. [30], C and m were set to 4.74 × 10⁻¹⁴ MPa·mm1/2 and 3, respectively.
θ M T S = 2 arctan ( K I 4 K I I ± 1 4 ( K I K I I ) 2 + 8 )
The propagation path and spatial state diagram of the crack surface as shown in Figure 6 were obtained. It can be seen from the figure that the fatigue crack has a fast speed along the length direction at the initial stage of propagation, and eventually develops into almost a straight line which is consistent with the test results conducted by Oehlers et al. [31]. Similar to the experimental results, the fatigue cracks obtained by finite element simulation also tend to develop toward the steel plate. The available experimental results indicate the dip angle of fatigue crack initiation at the interface between the stud shank and the weld collar [31,32]. For the convenience of calculation, the following analysis assumes that the initial fatigue crack of the stud extends only along the surface perpendicular to the stud shank.
Based on the above discussion and assumptions, the calculation results of SIFs based on maximum circumferential tensile stress criterion (3D) and plane extension (2D) are compared, as shown in Figure 7. The essence of these two methods is mixed-type crack propagation and I-typed crack propagation. For the 3D extended model, the KI always plays a dominant role in the extended process, while the contribution of the other two SIFs types to the Keff amplitude is almost negligible. The KI is changing rapidly at the crack propagation initial stage, and as the crack expands the SIFs of the open type are stable. In the end, KI tends to decrease at the shear capacity critical position of the stud. Similarly for the model in which cracks were assumed to propagate along the plane, the KI is dominant in the early stage of crack propagation and tends to be stable. However, when the midpoint of the fatigue crack tip extended to the center of the stud section, the KII began to surpass the KI and the increase rate was fast. Meanwhile, the amplitude of the Keff also kept increasing gradually.
The ratio of ΔKIII and ΔKII to ΔKI with the change of crack propagation depth is summarized in Figure 8a. It directly shows the dominant relationship of complex SIFs with different propagation models and initial crack sizes, and the case where a0 = 0.2 and a0/c0 = 1.0 was also calculated. As can be seen from the figure that when the expansion depth is close to the size of the stud radius, the ΔKIIKI both exceeds 1.0 under the plane expansion model in the case of a0 = 0.2 and a0 = 0.5. The effective SIF amplitudes of the two different extended models were compared, as shown in Figure 8b. It is found that the ΔKeff along the depth direction differs little in the early stage of fatigue crack propagation. However, the ΔKeff of the 2D model increases gradually when the crack propagation depth is greater than the radius of the stud, which could lead to a certain difference in the calculation of fatigue life values of the assumed propagation model.
To clarify the difference between the calculation results of mixed-type crack propagation and I-type crack propagation, the difference in effective SIF amplitude (ΔKeff,diff) between the two propagation models with a0 = 0.5 mm and the curve of crack depth versus the number of cycles is presented in Figure 9. Referring to Figure 9a, the ΔKeff of the mixed-type crack propagation model is larger than that of the I-type crack propagation model before the fatigue crack depth reaches the stud radius. After that, the situation was reversed. In the final form of the extension, the ΔKeff of the I-type crack propagation model is 32.2% higher than the mixed-type crack propagation model. The fatigue life can be obtained by accumulative action times of each crack propagation step with crack depth, as shown in Figure 9b. It can be found that the calculation result of the I-type crack propagation model is 7.2% higher than that of the mixed-type crack propagation model. The fatigue life of the model with an initial crack depth of 0.2 is 3.14% higher than that of the model with an initial crack depth of 0.5 under the same I-type crack propagation model. From the above analysis, it can be concluded that both the initial crack and the fatigue propagation mode have a significant influence on the fatigue life of the stud connector.

3. Simplified Calculation Method for Fatigue Life of Stud Connectors

Although the fatigue crack propagation pattern of the stud was obtained according to the method above, since the stud connector is wrapped in concrete, and the contact between different materials with the complex element, the non-convergence of the calculation was quite frequent, which lead to a situation that it is still difficult for the fatigue to crack propagation calculation. Meanwhile, the fatigue crack propagation parameters for fatigue life calculation of the stud material still need to be determined by a lot of experiments. To evaluate the fatigue life of stud effectively, instead of only calculating the number of fatigue actions from the nominal stress amplitude according to the S-N curve, a relatively simple calculation method needs to be developed. Based on the above calculation, for fatigue crack propagation at the interface of stud shank and welded collar, the variation trend of SIFs under mixed-type crack propagation is not different from that of I-type crack propagation, in which the differences mainly exist in the post-cracking stage. Therefore, the study on the fatigue life of rubber-sleeved studs conducted by Xu et al. [30] was referred to in the study, and the fatigue crack propagation was simplified. Based on the classic S-N curve method, fatigue crack initiation life and macroscopic crack propagation life were considered, and the fatigue performance of the stud can be evaluated by the simplified fatigue calculation method of fracture mechanics. On the whole, the fatigue crack propagation process of stud connectors can be divided into the initial crack initiation stage (stage I), the fatigue crack stable propagation stage (stage II), and the crack unstable propagation stage (stage III). Stage III develops rapidly which is the last stage of fatigue failure, and it is acceptable not to be counted in the overall fatigue life. Therefore, the fatigue life (Nf) of the stud in this research was obtained by calculating the sum of the initiation life (Nstage I) and the stable propagation life (Nstage II) of crack. The Smith–Watson–Topper (SWT) critical plane damage method [33] for multiaxial fatigue was applied to calculate the crack initiation life Nstage I, and the stable extension life Nstage II was calculated by the LEFM method. The flow chart of stud fatigue life assessment is presented in Figure 10.
The stud shear connector is subjected to shear force, bending moment, and axial load under the action of fatigue load in the concrete deck, and it is in the multi-axial stress–strain state, which can also be seen from the distribution characteristics of the complex SIFs. Therefore, the critical damage plane method of multiaxial fatigue life prediction was used to calculate the most unfavorable plane direction, and the initiation life Nstage I of the stud. The SWT parameters are used to analyze multiaxial stress problems as shown in Equation (3). The product in Equation (3) is a characterization of strain energy which is considered that the critical plane direction is the direction in which the SWT parameter value of a point reaches its maximum. In general, for the critical plane method, the position of the critical plane is determined by the stress and strain parameters of the integral point of the element, it is usually located in the stress–strain concentrated area, for members subjected to complex stresses, and the fatigue crack propagates in the most unfavorable plane of the element.
D = Δ ε 2 σ max
where Δε and σmax represent the normal strain amplitude and maximum normal stress of each fatigue load cycle, respectively, and at the critical plane, the damage parameter reaches its maximum value.
After SWT parameters related to fatigue life are obtained, the fatigue crack initiation life can be calculated by Equation (4) [34]. Referring to the study performed by Xu et al. [30], the parameters σ f and ε f in the formula were set to 350 MPa and 0.0715, respectively, while b and c were set to −0.07 and −0.4, respectively.
Δ ε 2 σ max = ( σ f ) E ( N s t a g e   I ) 2 b + σ f ε f ( N s t a g e   I ) b + c
where b and c represent the fatigue strength index and fatigue ductility index, respectively. σ f and ε f represent fatigue strength coefficient and fatigue ductility coefficient, respectively.
As mentioned above, the most unfavorable position needs to be determined before fatigue life calculation and analysis, and then the maximum SWT parameter and its corresponding critical plane direction were calculated. To be specific, firstly, the stress distribution of the stud connector in the steel-concrete specimen was calculated, and the most unfavorable position under fatigue load was preliminarily determined. Then, SWT parameters of the element at the most unfavorable position were evaluated. Finally, the normal stress–strain component of any plane was obtained through the coordinate transformation matrix as shown in Figure 11. The coordinate transformation formula is shown in Equation (5). In Figure 11, the coordinate system before transformation is xyz, and a new coordinate system xyz′ is obtained after a coordinate transformation. Based on the above calculation of the most unfavorable position and the corresponding critical plane of fatigue crack, the fatigue initiation life of the stud was calculated according to Equation (4).
σ = σ x x n x 2 + σ y y n y 2 + σ z z n z 2 + 2 τ x y n x n y + 2 τ y z n y n z + 2 τ x z n x n z ε = ε x x n x 2 + ε y y n y 2 + ε z z n z 2 + 2 γ x y n x n y + 2 γ y z n y n z + 2 γ x z n x n z
In Equation (5), σ and ε represent the normal stress and strain after the transformation plane, nx, ny, and nz represent the cosine of the angle between the post-transformation coordinate system and the pre-transformation coordinate system, respectively. The calculation formula is as follows. Firstly, the stress and strain components in Equation (5) were extracted from the calculation results of the finite element model, and the angle parameters θ and φ in Equation (6) were successively evaluated from 0° to 180° which was separated by 10°. Then, the direction cosine value was calculated through Equation (6) and substituted into Equation (5). Finally, the normal stress and strain after coordinate transformation were obtained, which were used for the subsequent calculation of SWT parameters and fatigue life.
n x = cos θ sin φ n y = sin θ sin φ n z = cos φ
where θ is the angle between the x-axis and the plane normal vector projection on the xy plane, and φ is the angle between the plane normal vector and the z-axis.
The LEFM method was used to calculate the stable extended fatigue life (Nstage II) of the stud. Based on the above finite element calculation of fracture mechanics, the SIF was simplified and obtained by Equation (5), it was assumed that a linear correlation with the fatigue crack depth, and then the fatigue life was calculated through Equation (6). The values of C and m were taken as 4.74 × 10⁻¹⁴ and 3.0, respectively [32]. The initial crack a0 is generally obtained by non-destructive testing, and the initial crack a0 of the stud was set as 2 mm in this study.
K = F σ π a
N s t a g e   I I   =   a 0 a f d a C ( Δ K ) m
where F represents the geometric modification coefficient of fatigue crack, which was calculated according to 1.12 in this study. σ represents the stress of the structure without initial crack, a0 represents the initial fatigue crack depth, and af represents the crack depth under fatigue failure.
The shear resistance of a stud under fatigue load is mainly determined by the shear area of the stud shank. Before the initial fatigue crack appeared, the shear resistance area was the circular section area A of the stud with diameter d, As the crack expanded under fatigue load, the shear resistance area of the stud decreased continuously, and, finally, decreased to the ultimate shear resistance area Af corresponding to the upper limit of the fatigue load amplitude Pmax (Equation (9)). Therefore, the fatigue crack depth af in fatigue failure can be calculated by Equation (10), and fu is the ultimate tensile strength of the stud material.
A f = P max f u
A f A = 1 a f d

4. Analysis of Calculation Examples

4.1. Model Establishment

The fatigue experiment of short stud connectors in a steel-UHPC composite structure was performed by Cao et al. [19], and it was set as a calculated example to verify the effectiveness of the above method. The finite element model was established regarding the push-out test which was according to the standard of Eurocode 4 [5]. Specific parameter settings are as follows. The UHPC deck was taken as 50 mm, I section steel with a thickness of 12 mm. The spacing of ordinary steel bars is 50 mm × 55 mm. Four short studs with diameters of 13 mm and 35 mm in height were arranged on each side of I-shaped steel, with a horizontal and vertical spacing of 110 mm and 200 mm, respectively. The elastic modulus of steel was set to 2.06 × 10⁵ MPa. The yield strength and ultimate strength of stud and I-shaped steels were 345 MPa and 430 MPa, respectively, the yield strength and ultimate strength of steel were 335 MPa and 400 MPa, respectively, and the Poisson’s ratio of steel was set to 0.3. The compressive strength of the UHPC was taken as 129.1 MPa, and the initial elastic modulus was set to 42.6 GPa. It is similar to the finite element model for fatigue crack progradation, the example model consists of a UHPC plate, short stud, I-shaped steel plate, and structural steel bar. The modeling method was consistent with the previous model and not described here, the difference lies in the definition of constitutive relations for UHPC materials, which was explained here. The tension and compression stress–strain curves of UHPC were referred to in Figure 12. The specific parameters were set according to the experimental results in the literature [35,36,37], and the calculation formula is shown in Figure 12. Based on the principle of energy equivalence, the damage factor D of UHPC under tension and compression was defined by Equation (11). The parameter meanings of the formula in the Figure 12 are as follows. Εt0 represents strain at peak tension, ft represents average stress during strain hardening, εtp represents ultimate strain under tension, lc represents the extension distance measured by the specimen, wp represents crack width parameter, p represents the parameters obtained by axial tension test fitting, fc represents the compressive strength, ξ represents the ratio of compressive strain value to compressive peak strain, and ε0 represents peak strain in compression.
D = 1 σ E 0 ε

4.2. Verification of Load-Slip Curves

Firstly, the static performance of the stud connector obtained by the finite element method was verified. Three push-out specimens (SAT-1~SAT-3) with the same parameters were carried out by Cao et al. [19], and the slip and ultimate bearing capacity of the stud were recorded. The comparison between the load-slip curve calculated by the finite element model and the test results is shown in Figure 13. It can be concluded from Figure 13 that the results calculated by the finite element model are consistent with the measured load-slip curve, and the results are most similar to those of specimen SAT-2. The stud in the UHPC deck of the static performance is mainly divided into two stages, at the beginning of the load, a load of stud-slip can be regarded as a linear correlation, and then the stud material yields strength after the interface slip velocity gradually accelerated, until you reach the limit strength stud shear failure occurs, these characteristics are also reflected in the finite element calculation results. The yield load and ultimate load measured in the experiment are 400 kN and 496 kN, respectively. Comparatively, the yield load calculated by the finite element method is relatively small which are 376 kN and 456 kN, respectively. The errors between the finite element model and experiment are 6% and 2%, respectively, which is acceptable for the prediction of the shear bearing capacity of the stud connectors. The above analysis shows that the calculation results of the finite element are in good agreement with the experimental results. The verification of the static experiment model provides the basis for the following calculation, and the fatigue life values calculated in Figure 10 are verified by the fatigue test results below.

4.3. Calculation of SWT Parameters

In this study, fatigue life calculations and analyses of six specimens (N1~N6) were performed. The failure modes observed in stud fatigue tests in UHPC are summarized in the following two cases [19]. One case is that the fatigue crack source of the first condition appears at the welded collar of the stud with the steel plate. With the repeated action of the fatigue load, the crack gradually extends on the steel plate and forms a small concave surface. In the second case, the fatigue crack appears at the interface of the stud shank and welded collar, which can be regarded as the cross-section of the stud was gradually penetrated by the crack along with the transverse expansion until the shear limit of the stud was reached. As mentioned above, the stress at the intersection of the stud shank and welded collar is the most unfavorable, which is preliminarily determined as the fatigue crack location. For simplicity, SWT parameters for the entire fatigue detail region described in Figure 10 were not calculated here. Therefore, taking specimen N1 as an example, the calculation process proposed in Figure 10 was listed as follows. The SWT parameters at the interface between stud shank and welded were calculated, where the stress is concentrated, and the distance between the angles on each plane was set to 10°. The SWT parameter result of each plane of the most unfavorable element is shown in Figure 14. The angle θ and φ of the most unfavorable plane of the maximum parameter are calculated, which are 90° and 20°, respectively. In subsequent analysis, it was determined that the fatigue crack developed from the plane corresponding to this position. The data obtained above analysis is listed as follows, the SWT parameter value is 74,460, the normal vector of the critical plane for the global plane is (−0.000272, 0.342, 0.940), the normal strain amplitude Δε is 915 με, the maximum normal stress σmax is 166.8 MPa, and the normal stress amplitude is 135.1 MPa.

4.4. Calculation of Fatigue Life

SWT parameter and normal stress amplitude Δσ were obtained according to the above calculation, the initiation life (Nstage I) and the stable propagation life (Nstage II) of crack can be calculated by Equations (4) and (8). As shown in Table 2, the fatigue test results (Ne) and calculation results (Nf) of specimens N1~N5 are summarized, the relationship between stress amplitude and fatigue life of stud is usually expressed by logarithmic relation. The error between logNe and logNf ranges from 0.5% to 7.7%, and the results of logNe/logNf range from 0.98 to 1.04, which shows that the calculated results have a good correlation with the experimental data. By further calculation, the correlation coefficient between the calculated results in this paper with the experimental results is 0.9955. The above analysis shows that the method of predicting the fatigue life by considering the fatigue initiation life and stable extension life of the stud is feasible. Among all the specimens, the predicted results of N1 were closest to the experimental values.
Statistical analysis can be carried out on the relationship of action times under different fatigue load amplitudes through data fitting, and the S-N curve of short stud in steel-UHPC composite structure can be established. The design specification [5,6,7] is also guided by the S-N curve formula which is shown in Equation (12), and the parameter values in the formulas of different specifications are comprehensively given in Table 3. The parameter values obtained by the fatigue experiment results of specimens N1~N5 are also given in Table 3, and its survival rate is 95% which ensures the safety of the prediction [19].
m log Δ τ + log N = C
where N represents the number of fatigue loads, Δτ represents the amplitude of the nominal shear stress on the stud, and C′ and m′ represent the parameters obtained by fitting the experimental data (Table 3).
The stud fatigue life values in UHPC with different elastic modulus and compressive strength were calculated, and the material was set as UHPC with the elastic modulus of 43 GPa and compressive strength of 170.9 MPa as described in the literature [35]. The SWT damage value of the most unfavorable element of the stud was calculated as shown in Figure 15. It can be seen from the figure that SWT damage patterns of different intensities are similar in distribution, and the maximum SWT damage value was 71,810 which is lower than the value of the N1 specimen with the compressive strength of 129.1 MPa. The calculated fatigue initiation life value is 12.59 million times, and the stable extended life value is 892,000 times after changing the material parameters of UHPC. Figure 16 presents the ratio of SWT parameters of UHPC with different compressive strengths, and it is that only the values with θ = 90° and φ = 20° were compared for convenience. Based on the above discussion, it can be seen that there are certain differences in the fatigue performance of studs in concrete with different strengths, and the ratio is almost uniform except for a few points, especially when φ = 20°.
The experiment results of specimens N1~N6 and the curve formula obtained by fitting were drawn, as shown in Figure 17. The normalized curves in Table 3 and the results calculated in this paper were also shown in Figure 17 for comparison. It can be seen that the fatigue life of short studs in UHPC is outside the predicted curve derived from fitting the experimental data. For the N1 specimen, the fatigue stress amplitude is 94 MPa, the fatigue life value obtained in the test is 11.787 million times, and the result calculated by Eurocode 4 [5] is 1.412 million times, the difference in fatigue life values was caused by the larger elastic modulus and constraint action of UHPC. According to the data in Table 2, it can be found that the initial fatigue crack initiation life accounts for a large proportion of the whole fatigue life, up to 93%. It accounts for a larger proportion of the whole fatigue life for stud connectors that are subjected to small fatigue stress amplitude as shown in Figure 18. It is indicated that a considerable part of the time is in the initial fatigue crack initiation stage of the stud in the actual bridge operation. However, the fatigue failure occurs relatively quickly after the fatigue crack expands to the stage of steady propagation which is detrimental to the safety of the structure. Therefore, for the sustainable operation of steel-UHPC composite bridges, it is particularly important to detect the fatigue cracks in the welding details of stud connectors. Meanwhile, the fatigue stress amplitude is the key parameter to determine the fatigue crack propagation life of stud connectors.

5. Conclusions and Observations

In this study, the LEFM method was used to calculate the fatigue crack propagation of the stud connectors in the steel-concrete composite structure, and the characteristics of SIFs were analyzed. Combined with the simplified analysis method of the fatigue crack of the stud, the fatigue life of the stud in the UHPC deck was calculated. The research conclusions are as follows.
(a)
It belongs to the complex crack of the stud connector which is dominated by the open type SIF. The distribution of SIFs is different under the different crack shapes, and the extreme value of Keff is greatly affected by the depth and width of the crack, but not significantly affected by the length of the stud.
(b)
The fatigue crack surface of the stud connector can be obtained by three-dimensional fatigue propagation. It is semi-elliptical in the early stage of the fatigue crack propagation, and the crack front gradually develops into a straight line in the later stage. The midpoint of the fatigue crack front grows faster, and the fatigue crack surface tends to incline toward the I-beam.
(c)
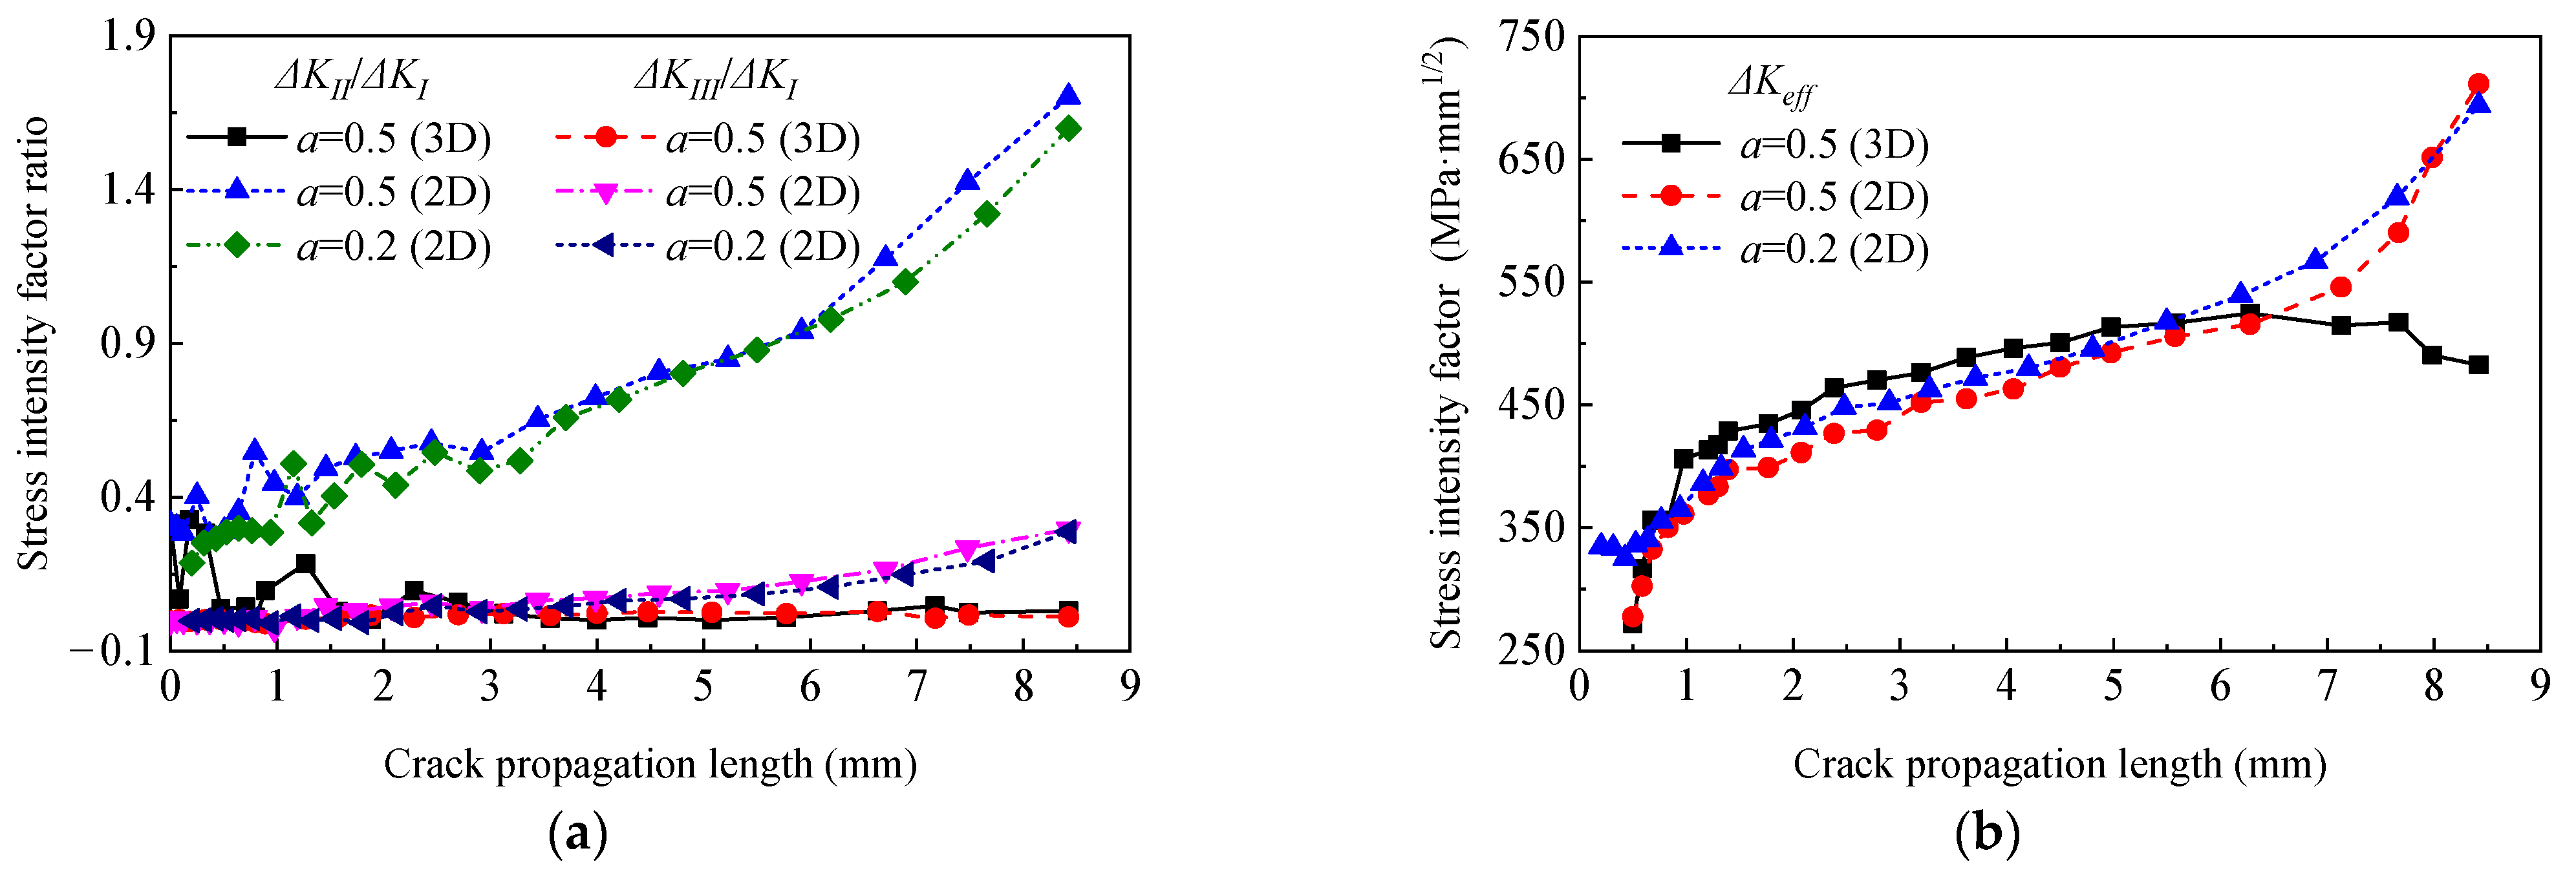
There is little difference between the ΔKeff of the I-type crack propagation and that of the mixed-type crack propagation in the early stage of fatigue propagation. However, the ΔKeff of the I-type crack propagation model increases gradually after the crack propagates through half of the stud section, which leads to a certain difference in the number of effects calculated by the two methods in the late fatigue propagation period. The fatigue life of the I-type crack propagation model is 7.2% higher than that of the mixed-type crack propagation model.
(d)
The calculation method of crack initiation life is considered by simplifying SIF and combining the SWT critical damage plane method. Compared with the experimental values, it is proved that the calculated values of fatigue life of stud connectors provide better predictive values. In addition to the stress amplitude of the traditional S-N curve, different material sizes, material properties, and contact characteristics of structures can also be taken into account by the calculation method in this paper combined with finite element modeling. It can effectively evaluate the fatigue life of stud connectors in steel-concrete composite structures.
(e)
The proportion of crack initiation life in the fatigue life of stud connectors in UHPC is different under different stress amplitudes, and the compressive strength of UHPC also affects the fatigue life of stud connectors. In the whole process of fatigue failure, the initiation life of fatigue crack accounts for a large proportion, up to more than 90%. The fatigue stress amplitude is the key parameter to determine the fatigue crack propagation life of stud connectors.

Author Contributions

Conceptualization, D.W. and B.T.; Data curation, B.T. and S.X.; Funding acquisition, D.W.; Investigation, S.X. and X.W.; Methodology, D.W. and B.T.; Project administration, D.W. and B.T.; Resources, D.W.; Software, B.T., S.X., and X.W.; Supervision, D.W. and S.X.; Validation, D.W. and B.T.; Writing—original draft, B.T. and X.W.; Writing—review & editing, D.W. and S.X. All authors have read and agreed to the published version of the manuscript.

Funding

This research was funded by the National Natural Science Foundation of China (Grant no. 51878072), the Science and Technology Program of Hunan Province (Grant no. 2020RC4049), and the Science Research Start Foundation for Bring in Talents of the Central South University of Forestry and Technology (Grant no. ZK2021YJ036).

Institutional Review Board Statement

Not applicable.

Informed Consent Statement

Not applicable.

Data Availability Statement

Not applicable.

Conflicts of Interest

The authors declare that they have no known competing financial interests or personal relationships that could appear to influence the work reported in this paper.

References

  1. Gunes, B.; Ilki, A.; Kemal, O.N. Determination of monitoring parameters for fatigue behavior of steel-concrete composite bridge girders with welded full depth transverse stiffeners. Sustainability 2019, 12, 283. [Google Scholar] [CrossRef] [Green Version]
  2. Lim, Y.Y.; Soh, C.K. Electro-mechanical impedance (EMI)-based incipient crack monitoring and critical crack identification of beam structures. Res. Nondestruct. Eval. 2014, 25, 82–98. [Google Scholar] [CrossRef]
  3. Wöhler, A. Versuche zur Ermittlung der auf die Eisenbahnwagenachsen einwirkenden Kräfte und die Widerstandsfähigkeit der Wagen-Achsen. Z. Bauwes. 1860, 10, 583–614. [Google Scholar]
  4. Freudenthal, A.M.; Gumbel, E. Physical and statistical aspects of fatigue. Adv. Appl. Mech. 1956, 4, 117–158. [Google Scholar]
  5. CEN. EN 1922-1-1 Eurocode 2: Design of Concrete Structures–Part 1-1: General Rules and Rules for Buildings; European Committee for Standardization: Brussels, Belgium, 2005. [Google Scholar]
  6. JSSC. Guidelines for Performance-Based Design of Steel-Concrete Hybrid Structures; Japan Society of Civil Engineers: Tokyo, Japan, 2002. [Google Scholar]
  7. AASHTO. AASHTO LRFD Bridge Design Specifications; American Association of State Highway: Washington, DC, USA, 2012. [Google Scholar]
  8. Huang, Y.; Zhang, Q.; Bao, Y.; Bu, Y. Fatigue assessment of longitudinal rib-to-crossbeam welded joints in orthotropic steel bridge decks. J. Constr. Steel Res. 2019, 159, 53–66. [Google Scholar] [CrossRef]
  9. Wang, D.; Liu, Y.; Liu, Y. 3D temperature gradient effect on a steel-concrete composite deck in a suspension bridge with field monitoring data. Struct. Control Health Monit. 2018, 25, e2179. [Google Scholar] [CrossRef]
  10. Whitworth, A.H.; Tsavdaridis, K.D. Genetic Algorithm for Embodied Energy Optimisation of Steel-Concrete Composite Beams. Sustainability 2020, 12, 3102. [Google Scholar] [CrossRef] [Green Version]
  11. Xiang, S.; Wang, D.; Yang, L.; Tan, B. Study on the life cycle simulation method of the temperature field and temperature effect of a steel–concrete composite bridge deck system. Meas. Control 2021, 54, 1068–1081. [Google Scholar] [CrossRef]
  12. Cheng, Z.; Zhang, Q.; Bao, Y.; Deng, P.; Wei, C.; Li, M. Flexural behavior of corrugated steel-UHPC composite bridge decks. Eng. Struct. 2021, 246, 113066. [Google Scholar] [CrossRef]
  13. Mexico City Metro Overpass Collapse. Available online: https://en.wikipedia.org/wiki/Mexico_City_Metro_overpass_collapse (accessed on 12 May 2022).
  14. Ovuoba, B.; Prinz, G.S. Investigation of residual fatigue life in shear studs of existing composite bridge girders following decades of traffic loading. Eng. Struct. 2018, 161, 134–145. [Google Scholar] [CrossRef]
  15. Ferreira, F.P.V.; Tsavdaridis, K.D.; Martins, C.H.; De Nardin, S. Steel-Concrete Composite Beams with Precast Hollow-Core Slabs: A Sustainable Solution. Sustainability 2021, 13, 4230. [Google Scholar] [CrossRef]
  16. Li, C.; Lei, Z.; Feng, Z.; He, W.; Tan, L. Research on static performance of lightweight STC-steel composite deck. J. Transp. Sci. Eng. 2021, 37, 26–33. (In Chinese) [Google Scholar] [CrossRef]
  17. Lee, P.G.; Shim, C.S.; Chang, S.P. Static and fatigue behavior of large stud shear connectors for steel–concrete composite bridges. J. Constr. Steel Res. 2005, 61, 1270–1285. [Google Scholar] [CrossRef]
  18. Xu, X.; Zhou, X.; Liu, Y. Behavior of rubber-sleeved stud shear connectors under fatigue loading. Constr. Build. Mater. 2020, 244, 118386. [Google Scholar] [CrossRef]
  19. Cao, J.; Shao, X.; Deng, L.; Gan, Y. Static and fatigue behavior of short-headed studs embedded in a thin ultrahigh-performance concrete layer. J. Bridge Eng. 2017, 22, 04017005. [Google Scholar] [CrossRef]
  20. Yang, D. Analysis of Fracture Mechanics Theory of the First Fracture Mechanism of Main Roof and Support Resistance with Large Mining Height in a Shallow Coal Seam. Sustainability 2021, 13, 1678. [Google Scholar] [CrossRef]
  21. Wang, Y.; Nie, J. Fatigue behavior of studs in a composite beam based on fracture mechanics. J. Tsinghua Univ. 2009, 49, 1467–1470. (In Chinese) [Google Scholar] [CrossRef]
  22. Wolfe, R.J.; Vanderveldt, H.; Henn, A.E. Some considerations of fracture mechanics applications in ships design, construction and operation. Eng. Fract. Mech. 1975, 7, 565. [Google Scholar] [CrossRef]
  23. BSI. BS 7910; 2013+A1:2015 Guide to Methods for Assessing the Acceptability of Flaws in Metallic Structures. BSI Standards Limited: London, UK, 2015.
  24. Wang, D.; Tan, B.; Wang, L.; Chen, F.; Xiang, S. Numerical Study on Stress Intensity Factors for Stud Connectors of Steel–Concrete Connection. Int. J. Steel Struct. 2021, 21, 1775–1789. [Google Scholar] [CrossRef]
  25. Wang, B.; Huang, Q.; Liu, X. Comparison of Static and Fatigue Behaviors between Stud and Perfobond Shear Connectors. KSCE J. Civ. Eng. 2018, 23, 217–227. [Google Scholar] [CrossRef]
  26. GB/T 10433-2002; Cheese Head Studs for Arc Stud Welding. China Standards Press: Beijing, China, 2002.
  27. GB50010-2010; Code for Design of Concrete Structures. Ministry of Housing and Urban-Rural Development of the People’s Republic of China (MOHURD): Beijing, China, 2011.
  28. Fracture Analysis Consultants, Inc. Available online: http://fracanalysis.com/software.html (accessed on 7 March 2021).
  29. Zhang, Q.; Guo, Y.; Li, J.; Yuan, D.; Bu, Y. Fatigue Crack Propagation Characteristics of Double-sided Welded Joints between Steel Bridge Decks and Longitudinal Ribs. China J. Highw. Transp. 2019, 32, 49–56. [Google Scholar] [CrossRef]
  30. Xu, X.; Zhou, X.; Liu, Y. Fatigue life prediction of rubber-sleeved stud shear connectors under shear load based on finite element simulation. Eng. Struct. 2021, 227, 111449. [Google Scholar] [CrossRef]
  31. Oehlers, D.J.; Seracino, R.; Yeo, M.F. Fatigue behaviour of composite steel and concrete beams with stud shear connections. Prog. Struct. Eng. Mater. 2000, 2, 187–195. [Google Scholar] [CrossRef]
  32. Hanswille, G.; Porsch, M.; Ustundag, C. Resistance of headed studs subjected to fatigue loading: Part I: Experimental study. J. Constr. Steel Res. 2007, 63, 475–484. [Google Scholar] [CrossRef]
  33. Smith, R.N.; Watson, P.; Topper, T.H. A stress-strain function for the fatigue of metals. J. Mater. 1970, 5, 767–778. [Google Scholar]
  34. Kujawski, D. A deviatoric version of the SWT parameter. Int. J. Fatigue 2014, 67, 95–102. [Google Scholar] [CrossRef]
  35. Zhang, Z.; Shao, X.; Li, W.; Zhu, P.; Chen, H. Axial tensile behavior test of ultra high performance concrete. China J. Highw. Transp. 2015, 28, 50. (In Chinese) [Google Scholar] [CrossRef]
  36. Li, L.; Fan, X.; Shi, X.; Shao, X. Experimental study on flexural behavior of large-scale prestressed UHPC T-shaped beam. China Civ. Eng. J. 2018, 51, 84–94. (In Chinese) [Google Scholar] [CrossRef]
  37. Yang, J.; Fang, Z. Research on stress-strain relation of ultra high performance concrete. J. Concr. 2008, 7, 11–15. (In Chinese) [Google Scholar]
Figure 1. Flow chart of co-simulation.
Sustainability 14 07253 g001
Figure 2. Mesh division of crack tip.
Sustainability 14 07253 g002
Figure 3. Specimen layout and geometric size. (a) Front view; (b) side view; (c) vertical view.
Sustainability 14 07253 g003
Figure 4. Complex SIFs distribution along with crack tips. (a) a/c = 0.2; (b) a/c = 1.0.
Sustainability 14 07253 g004
Figure 5. Comparison of Keff/Keff,max under different sizes of stud and crack. (a) Ratio of stud height and crack shape; (b) ratio of stud diameter and crack shape.
Sustainability 14 07253 g005
Figure 6. The spatial shape of crack propagation.
Sustainability 14 07253 g006
Figure 7. Crack propagation length-SIFs curve. (a) MTS extended model (3D); (b) planar extended model (2D).
Sustainability 14 07253 g007
Figure 8. Variation curves of SIFs. (a) ΔKIIKI and ΔKIIIKI; (b) ΔKeff.
Sustainability 14 07253 g008
Figure 9. The difference between mixed-type crack propagation and I-type crack propagation. (a) ΔKeff,diff; (b) crack depth versus the number of cycles.
Sustainability 14 07253 g009
Figure 10. Flow chart of stud fatigue life assessment.
Sustainability 14 07253 g010
Figure 11. Schematic diagram of any plane position.
Sustainability 14 07253 g011
Figure 12. Stress–strain curve of UHPC material. (a) Tensile stress–strain curve; (b) compression stress–strain curve.
Sustainability 14 07253 g012
Figure 13. Comparison of load slip curves of studs.
Sustainability 14 07253 g013
Figure 14. SWT parameter diagram of stud shank-weld collar interface.
Sustainability 14 07253 g014
Figure 15. SWT parameter diagram of stud in UHPC with different strengths.
Sustainability 14 07253 g015
Figure 16. SWT parameter ratio of UHPC with different compressive strength.
Sustainability 14 07253 g016
Figure 17. S-N curve of short stud in UHPC.
Sustainability 14 07253 g017
Figure 18. Bar diagram of the fatigue life.
Sustainability 14 07253 g018
Table 1. Material properties of concrete.
Strength Gradeαtft,rεt,r/10−4αcfc,rεc,r/10−3
C501.952.51.072.48501.92
Table 2. Fatigue life calculation results.
NumberFmaxFminΔFτmaxτminΔτNeNstage INstage IINflogNe/logNf
N1 112222100115219411,787,0009,883,7001,299,13611,182,8361.00
N215127124143261171,130,0001,206,000398,7251,604,7250.98
N316229133152271251,688,000600,000392,224992,2241.04
N41753114316530135441,000243,000224,643467,6430.99
N51752115416520145620,000221,000185,308406,3081.03
N6 1122221001152194/12,590,000892,00013,482,000/
1 N1 and N6 were consistent except that the material parameters of UHPC were set differently.
Table 3. Parameters of the S-N curve formula.
Source of Parameter DatamC
Eurocode 4 [5]821.935
JSCE [6]8.5523.42
AASHTO [7]1026.15
N1~N5 [19]822.3587
Publisher’s Note: MDPI stays neutral with regard to jurisdictional claims in published maps and institutional affiliations.

