Article

Dynamic Evolution Analysis of Complex Topology and Node Importance in Shenzhen Metro Network from 2004 to 2021

1
Institute of Emergency Science Research, China Coal Research Institute, Beijing 100013, China
2
China Coal Technology & Engineering Group, Beijing 100013, China
3
Shenzhen Metro Group Co., Ltd., Shenzhen 518026, China
*
Authors to whom correspondence should be addressed.
Sustainability 2022, 14(12), 7234; https://doi.org/10.3390/su14127234
Submission received: 6 May 2022 / Revised: 3 June 2022 / Accepted: 11 June 2022 / Published: 13 June 2022

Abstract

:
With the prosperous development of the urban metro network, the characteristics of the topological structure and node importance are changing dynamically. Most studies focus on static comparisons, and dynamic evolution research is rarely conducted. It is necessary to track the dynamic evolution mechanism of the metro network from the perspective of development. In this paper, the Shenzhen Metro Network (SZMN) topology from 2004 to 2021 was first modeled in Space L. Five kinds of node centralities in eight periods were measured. Then, the dynamic evolution characteristics of the SZMN network topology and node centralities were compared. Finally, an improved multi-attribute decision-making method (MADM) was used to evaluate the node importance, and the spatiotemporal-evolution mechanism of the node importance was discussed qualitatively and quantitatively. The results show that, with the spatiotemporal evolution of the SZMN, the nodes became more and more intensive, and the network tended to be assortative. The different kinds of node centralities changed variously over time. Moreover, the node importance of the SZMN gradually dispersed from the core area of Chegongmiao–Futian to the direction of the Airport and Shenzhen North. The node importance evolves dynamically over time, and it is closely related to the changes in the node type, surrounding nodes and whole network environment. This study reveals the dynamic evolution mechanism of the complex topology and node importance in the SZMN, which can provide scientific suggestions and decision support for the planning, construction, operation management and resilient sustainable development of the urban metro.

1. Introduction

At present, urban-rail-transit (URT) networks are being vigorously constructed and developed in many countries and regions in the world to alleviate the increasingly serious issue of urban traffic congestion. As an important and modern urban public transport means in daily traveling, the reasonable planning, operation and development of URT contribute to the sustainability of the whole urban public transport system. The metro system is characterized by high speed, punctuality, a large volume of traffic, a long distance, safety, efficiency, environmental protection, and little influence from the outside. It undertakes a large number of passenger transportation tasks and is an important infrastructure guarantee for the normal operation of the city. Nowadays, the metro construction is booming prosperously, and the line network is being increasingly developed. By 31 December 2021, 50 cities in the Chinese Mainland had opened rail transit systems, with 283 lines in operation, and a total length of 9206.8 km. Among them, the operation length of the metro is 7209.7 km and it accounts for 78.3% [1]. A total of 24 cities have line networks of 100 km or more, among which Shanghai Metro and Beijing Subway have gradually formed a super-large line network, and Shenzhen Metro ranks seventh, with a total length of more than 400 km. URT in China has entered a development era of network operation with the characteristics of interconnection and seamless transfer. For the urban metro, the scientific planning of the network scale and the rational distribution of the spatial structure are of great significance to the resilient sustainable development of the urban transportation system [2,3].
The metro system is an intricate network that is composed of multiple nodes and edges [4,5]. The network topology is very important for the metro network, which is the skeleton and foundation of the metro-system operation [6,7]. The interaction of dynamic information between nodes and lines makes the metro network an open nonlinear real-time dynamic complex system [4,8]. With the development of the metro network, new lines appear constantly, station types become more and more diversified and the network topology becomes more and more complex. Accordingly, the redistribution of the passenger flow that is caused by opening new lines causes the spatiotemporal characteristics of the network to constantly change [9,10,11]. Because of this, the topology and node importance in the actual metro network will be different. In view of this, it is necessary to discuss the evolution characteristics and mechanism of the metro network, and the node importance. Then, we can better understand the development law of the metro network at the present stage to provide a solid foundation for the planning and construction of the metro network in the future. Meanwhile, scientific suggestions for the optimization and sustainable development of the metro-network structure can be provided.
Up to now, it has been a mainstream direction to study the spatial topological structure of the metro network by combining complex network theory [12,13], graph theory, mathematical statistics and geographic visualization [14,15,16,17]. Many studies on this topic mainly focus on the following aspects: (1) the topological characteristics of the entire network [18], such as the small-world [19,20] and scale-free [21,22] effects, which are analyzed on the basis of the classical statistical indicators [23] of complex networks, such as the average shortest path length or diameter, network efficiency, density, assortativity [24,25], etc.; (2) the topological features or node importance [26,27] of metro stations, which are evaluated on the basis of the centrality parameters of network nodes [17], such as the degree centrality (DC) [28], betweenness centrality (BC) [29], closeness centrality (CC) [29], eigenvector centrality (EC) [8,28] and PageRank (PR) [30]; (3) the vulnerability [31,32,33,34], robustness [35,36,37] and resilience [38,39,40,41] of the metro-complex network, which are evaluated on the basis of (1) and (2); (4) the dynamic evolution law of a network or node, which is studied, and the rationality of the network development, which is assessed [42,43,44,45]; (5) the characteristics of the metro complex network with weighted passenger flow and traffic flow, which are analyzed [4,8,46].
From the current studies, it can be found that in-depth studies have been conducted on the static network and node characteristics of the metro system, and many achievements have been obtained. However, for the real-time evolution of the metro system, the sustainability of dynamic development is particularly important. In addition, for some cities with prosperous metro constructions, the rationality of subsequent metro-line planning plays a very important role in the sustainable development of the urban public transportation system [2]. Therefore, it is necessary to combine the static and dynamic topology characteristics and expand the research period to a larger scope from the perspective of development, covering the past, present and even the future. It is better to track and judge the development of the metro system according to the opening times of lines so that the analysis results can be more valuable for the construction and planning of the metro system in the future. However, the current research on the node-importance evolution needs to be strengthened and deepened further.
Furthermore, it is more meaningful to pay attention to some important key nodes for the metro operation and safety management. Thus, the node importance needs to be identified and evaluated, which can be achieved based on the widely used node centrality indexes. However, there are some shortcomings and limitations in the indexes. For example, the DC only uses very limited information and cannot effectively identify important link nodes. Information on the entire network structure is used by the BC and CC, but the calculations need to traverse the entire network in advance and they have high computational complexity [47,48,49]. Studies have shown that the multi-attribute decision-making method (MADM) is superior to a single attribute in the validity and rationality of the evaluation results [50,51]. Moreover, the key node importance will change in the process of the network evolution. It is necessary to combine the macronetwork and micronodes. Investigating the real-time dynamic evolution of the metro network from the standpoint of development can help to improve our understanding of the metro network’s sustainability.
In view of the above problems, the dynamic evolution characteristics of complex topology and node importance are studied in this paper, taking the SZMN as the research object. First, according to the opening time, SZMN-complex-network modeling was conducted for all periods of time. Second, the evolution law with the time of the SZMN spatial structure was quantitatively analyzed in combination with some network topology indexes. Third, the dynamic-distribution characteristics of the node centrality were analyzed from different angles, and the development of the network was evaluated. Finally, based on an improved multi-attribute decision algorithm, the identification, ranking and GIS visualization of the node importance were realized. Moreover, the evolution mechanism of the node importance over time was analyzed qualitatively and quantitatively. Furthermore, some key nodes were taken as examples to analyze the influencing factors of the node-importance evolution. The research results on the dynamic evolution of the complex topology and node importance in the Shenzhen Metro Network can provide a scientific basis and decision support for the planning, construction, operation management and sustainable development of the Shenzhen Metro, which has important theoretical and practical significance.
The remainder of this paper is organized as follows: In Section 2, the methodology is described in detail. In Section 3, a numerical analysis and discussions are presented. Finally, the conclusions and future research are summarized in Section 4.

2. Methodology

2.1. Complex Topology Modeling of Metro Network

Compared with several classical complex network Space models [52] (such as Space L/P/C/B, etc.), the Space L model emphasizes the adjacent function of nodes, which is closest to the real metro network. Therefore, Space L was applied in this study to construct the complex topological model of the SZMN.
The SZM initially opened some stations of L-1 and L-4 on 28 December 2004, and these slowly developed into today’s SZMN. From 1 January 2004 to 31 December 2021, the SZM opened 15 new stations. Now, the SZMN owns 12 lines and 289 stations (including some transfer stations). If all the transfer stations only count once, the SZMN has a total of 240 stations. Among a total of 42 transfer stations, one is a four-line transfer station (Chegongmiao), 4 are three-line transfer stations (Futian, Qianwan, Shenzhen North Station and Fumin), and 37 are two-line transfer stations. Here, we number all the stations from top to bottom according to the order of L-1/2/3/4/5/6/7/8/9/10/11/20. For instance, the ID of Luohu Station in L-1 is 0, and Guomao Station’s ID is 1. Moreover, for those transfer stations, the IDs will be the numbers with the smaller lines. Thus, we can number all stations as shown in Figure 1.
In the Space L model, each station represents a node, and v i is the i t h station. The SZMN can be converted into a network ( G = ( V , E ) ), where V = { v i ,   i = 1 , 2 , , N } is the node set, and E = { e i j ,   i , j = 1 , 2 , , N , i j }   is the edge set. e i j = ( v i , v j ) represents the connections that consist of two adjacent nodes ( i , j ) . If two nodes ( i , j ) are adjacent, e i j = 1 ; otherwise, e i j = 0 . Thus, an adjacency matrix ( A = [ a i j ] ) is generated, and the dimension of the A is the network size ( N ). The Space L model of the SZMN is shown exactly in Figure 1.
From the website https://en.wikipedia.org/wiki/Shenzhen_Metro (accessed on 1 January 2022), the specific opening time of the SZMN can be known. The SZMN has evolved into an increasingly complex transportation network over time, and the passenger flow volume has increased year by year (except for the decline in 2020 due to COVID-19). Specifically, only one station opened in 2007, and so the SZMN during 2004–2021 can be divided into eight periods (as shown in Table 1), which each represent the end of the year.

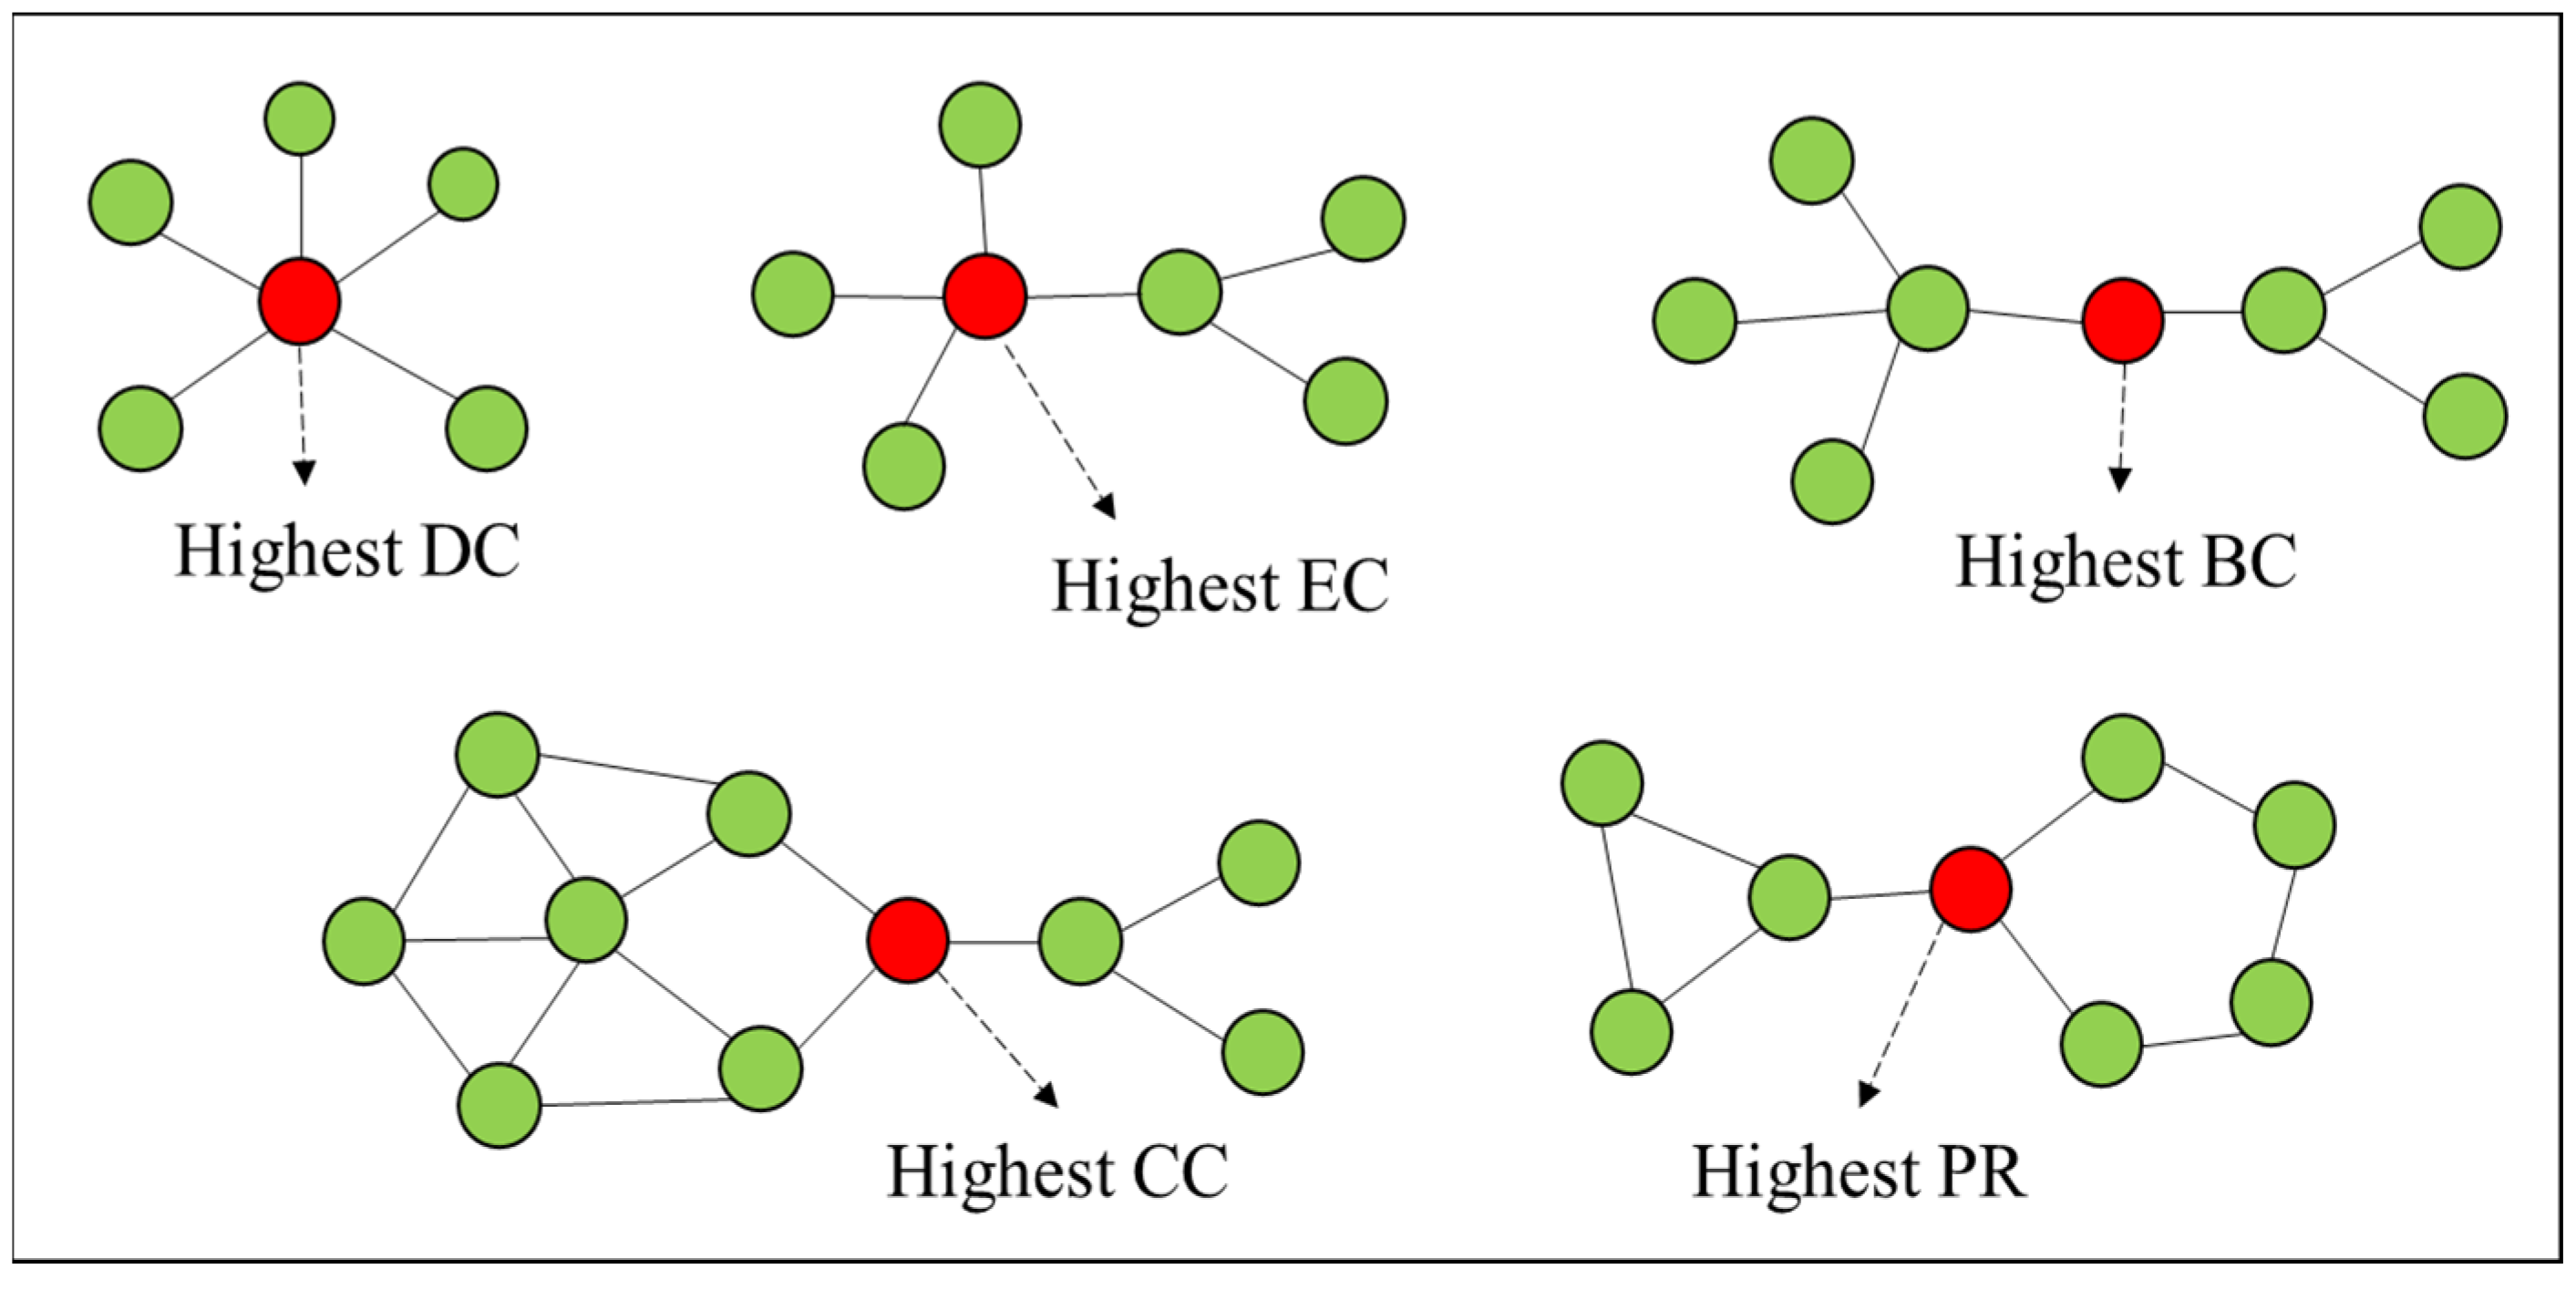
2.2. Statistical Measurement of Node Centrality

In graph theory and complex network analysis, the node centrality measurement is an important and effective method for complex-topological-characteristics analysis and node-importance evaluation. In URT networks, the node centrality refers to the connection degree between the stations in the whole network. So far, many topology indicators, such as DC, EC, BC, CC, PR, etc., have been deeply studied to illustrate the influence of the nodes in the networks from different perspectives. Table 2 shows the corresponding definitions and calculation formulas [46] of five node centralities.
For the EC, if node i and node j are connected, then node j and node i are more important. EC is different from DC. For a high-DC node that usually has many connections, its EC may not be high because the connected nodes may have low ECs. Similarly, a high-EC node may not have a high DC. If it owns a few but significant connectors, then it also can have a high EC. Moreover, the BC emphasizes that if a node (i) is in the multiple shortest paths to other nodes, then the i is the core node and it has a large BC. The CC emphasizes the position of a node in the whole network. Compared with the BC, the CC is closer to the geometric center of a network. Comparatively speaking, DC utilizes only the local characteristics of a network, while BC and CC take advantage of the global characteristics of the network. Furthermore, the PR calculates the node ranking in the graph (G) based on the structure of incoming links. It was originally designed as an algorithm to rank web pages. The PR underlines those nodes with the same degree that may have different importance. It considers incoming links from strongly linked nodes to be more important than those links from nodes with fewer connections. Figure 2 depicts a graphic representation of the five node centralities mentioned above.

2.3. Identification and Ranking of Node Importance

The basic concepts and calculations of node centralities are explained in Section 2.2. These node centralities emphasize the positions and roles of the nodes in the network from different perspectives. However, a single index is insufficient for measuring the node influence. For instance, DC makes use of very limited information and cannot effectively identify the important chain nodes [48,53]. EC utilizes the importance of the adjacent node. There are some disadvantages and limitations for global metrics, such as CC and BC [47]. Moreover, the convergence degree of the PR in the iterative process is affected by the parameter (λ) and the connected state of the nodes. Therefore, it is necessary to seek an MADM method to comprehensively measure the node importance. Here, we selected a common multi-objective decision method with limited options, which is, namely, the Technique for Order of Preference by Similarity to Ideal Solution (TOPSIS) algorithm. The TOPSIS algorithm is currently widely used due to its superiority in the evaluation results [54,55,56], but we need to consider the data-processing problem and the weight of each index.
In this paper, to eliminate the dimensional and magnitude differences between different indexes, a classic min–max normalization approach [57] was chosen for the linear transformation of the original data. Then, the weights could be acquired with the coefficient-of-variation method. Moreover, the weights and normalized data were input into the TOPSIS algorithm for calculation. Finally, the comprehensive node importance (C) could be obtained. The specific steps are as follows:
Step 1: Establish the index evaluation matrix: X N m = [ x i j ] , i = 1 , 2 , , n ;   j = 1 , 2 , , m , where m is the number of evaluation indexes, and x i j represents the j t h index of the i t h node. Normalize all indexes ( X N m ) with the min–max-normalization approach, and make their range into [0, 1]:
x i j * = x i j min 1 k n { x k j } max 1 k n { x k j } min 1 k n { x k j }
Step 2: Calculate the standard deviation ( S j ). If a negative index exists, it should be converted into a positive index by inverting it or acquiring its negative. Calculate the variation coefficient: V j = S j / x j ¯ (i.e., divide the standard deviation of each indicator by its mean). V j is normalized to obtain the weight of each index: W j = { w 1 , w 2 , , w m } .
W j = V j / j = 1 m V j
Step 3: Multiply the columns of the normalized matrix by the weights: Z = S W j ,   z i j = { s i j w j } . For each column Z i of Z , the maximum of Z i (i.e., Z i m a x ) is the i t h dimension of the positive ideal solution ( Z + ), and the minimum of Z i (i.e., Z i m i n ) is the i t h dimension of the negative ideal solution ( Z ). Then, separately calculate the distance D + and D :
D + = j = 1 n ( Z i m a x z i j ) 2
D = j = 1 n ( z i j Z i m i n ) 2
Step 4: Calculate the relative closeness to the ideal solution ( C ), and rank the C according to its value. Finally, the assessment results ( C = { C 1 , C 2 , , C n } ) of all indexes can be output:
C = D + D + + D [ 0 ,   1 ]

3. Numerical Analysis and Discussions

3.1. Dynamic Evolution Analysis of Network Topology

By analyzing the topology structure of each period in the SZMN (as shown in Figure 3), the network characteristics can be obtained and described by several of the parameters in Table 3. These parameters are defined and calculated as follows: N, E and L are the numbers of nodes, edges and lines, respectively. APL is the average shortest path length, which means the average distance between all the pairs of nodes. D is the diameter of the network, and ρ is the density of the network. δ and θ are the local and global efficiencies of the network, respectively. σ is the degree assortativity coefficient. The above parameters can be computed by the programming package Network X in Python. Moreover, we introduced two additional parameters: β and γ . β is the type of network and it can be obtained by β = E / N . γ is the number of loops and it can be calculated with γ = E N + L .
By combining Figure 3 and Table 3, it can be seen that the number of nodes (N), number of edges (E) and number of lines (L) gradually increased from 2004 to 2021, indicating that the network was gradually developing and expanding. Here, the parameter β = E / N is introduced. If β > 1 , then the network tends to be a loop-type network, and the number of loops can be described as γ = E N + L , while if β < 1 , then the network is more likely to be a tree-type network [2]. With the evolution of time, the β gradually increases; that is, the SZMN tended to be a loop network before 2011, and it then developed to a tree network. At the same time, the number of loops increased over time, indicating that the SZMN has been increasingly developed.
The APL and D are used to measure the network distance. What needs illustration is that the results of the APL and D of 2010 cannot be gained because L-3 could not be connected to other lines. There will be errors in the calculation when the graph (G) is not connected. On the whole, the APL showed a fluctuating trend, and then rose to 13.7 in 2021. The D basically remained between 42 and 43 after 2011. The APL is much smaller than the network size (N), indicating the small-world effect [17,58,59] in the SZMN. The network density ( ρ = 2 E / N ( N 1 ) ) is used to describe the intensive degree of interconnecting edges between nodes and it ranges from 0 to 1. Generally speaking, the density of large-scale networks is less than that of small-scale networks. The ρ of the SZMN gradually decreased from 0.111 to 0.096, which indicates that the network nodes were becoming denser and denser.
The local efficiency ( δ ) measures how information is efficiently transmitted through the direct neighbors of a node and it reflects the network’s ability to defend against random attacks to a certain extent. As can be seen from Table 3, the δ before 2011 was 0, and it then decreased from 0.0042 to 0.0024, and finally rose to 0.0036 in 2021. The trend indicates that the information transmission between the nodes was more and more efficient and the fault-tolerant ability was stronger. The global efficiency ( θ ) describes the network’s ability to process information in parallel. The APL and θ measure the global transmission capacity of a network. The shorter the APL and higher the θ , the faster the information transfer rate between nodes. The θ of the SZMN gradually decreased over time, indicating that the global efficiency of the information transmission between the nodes decreased, but the information transmission efficiency of the local network became higher.
The degree assortativity coefficient ( σ ) is used to measure the similarity in the links and the changes in [ 1 ,   1 ] . If a network is assortative in degree (i.e., σ [ 0 ,   1 ] ), then the high-degree nodes tend to connect with the high-degree ones. In contrast, if the network is disassortative (i.e., σ [ 1 ,   0 ] ), then the high-degree nodes tend to be associated with the low-degree ones. The σ results of the SZMN show that the network was assortative in 2011, 2020 and 2021, and that the rest were disassortative. It can be concluded that the similarity in the network connections changed dynamically in the process of the SZMN construction. This is due to the fact that the opening of new lines leads to more low-degree nodes around the high-degree nodes. With the reasonable planning of lines in the future, the SZMN will become more and more assortative.
To sum up, it can be seen from the indexes of the β , γ , APL, D, ρ , δ and σ that the topological structure parameters of the SZMN changed greatly around 2011. This is because all of the lines could be connected through transfer stations, and the network changed from the tree type to the loop type, with the nodes becoming much closer.

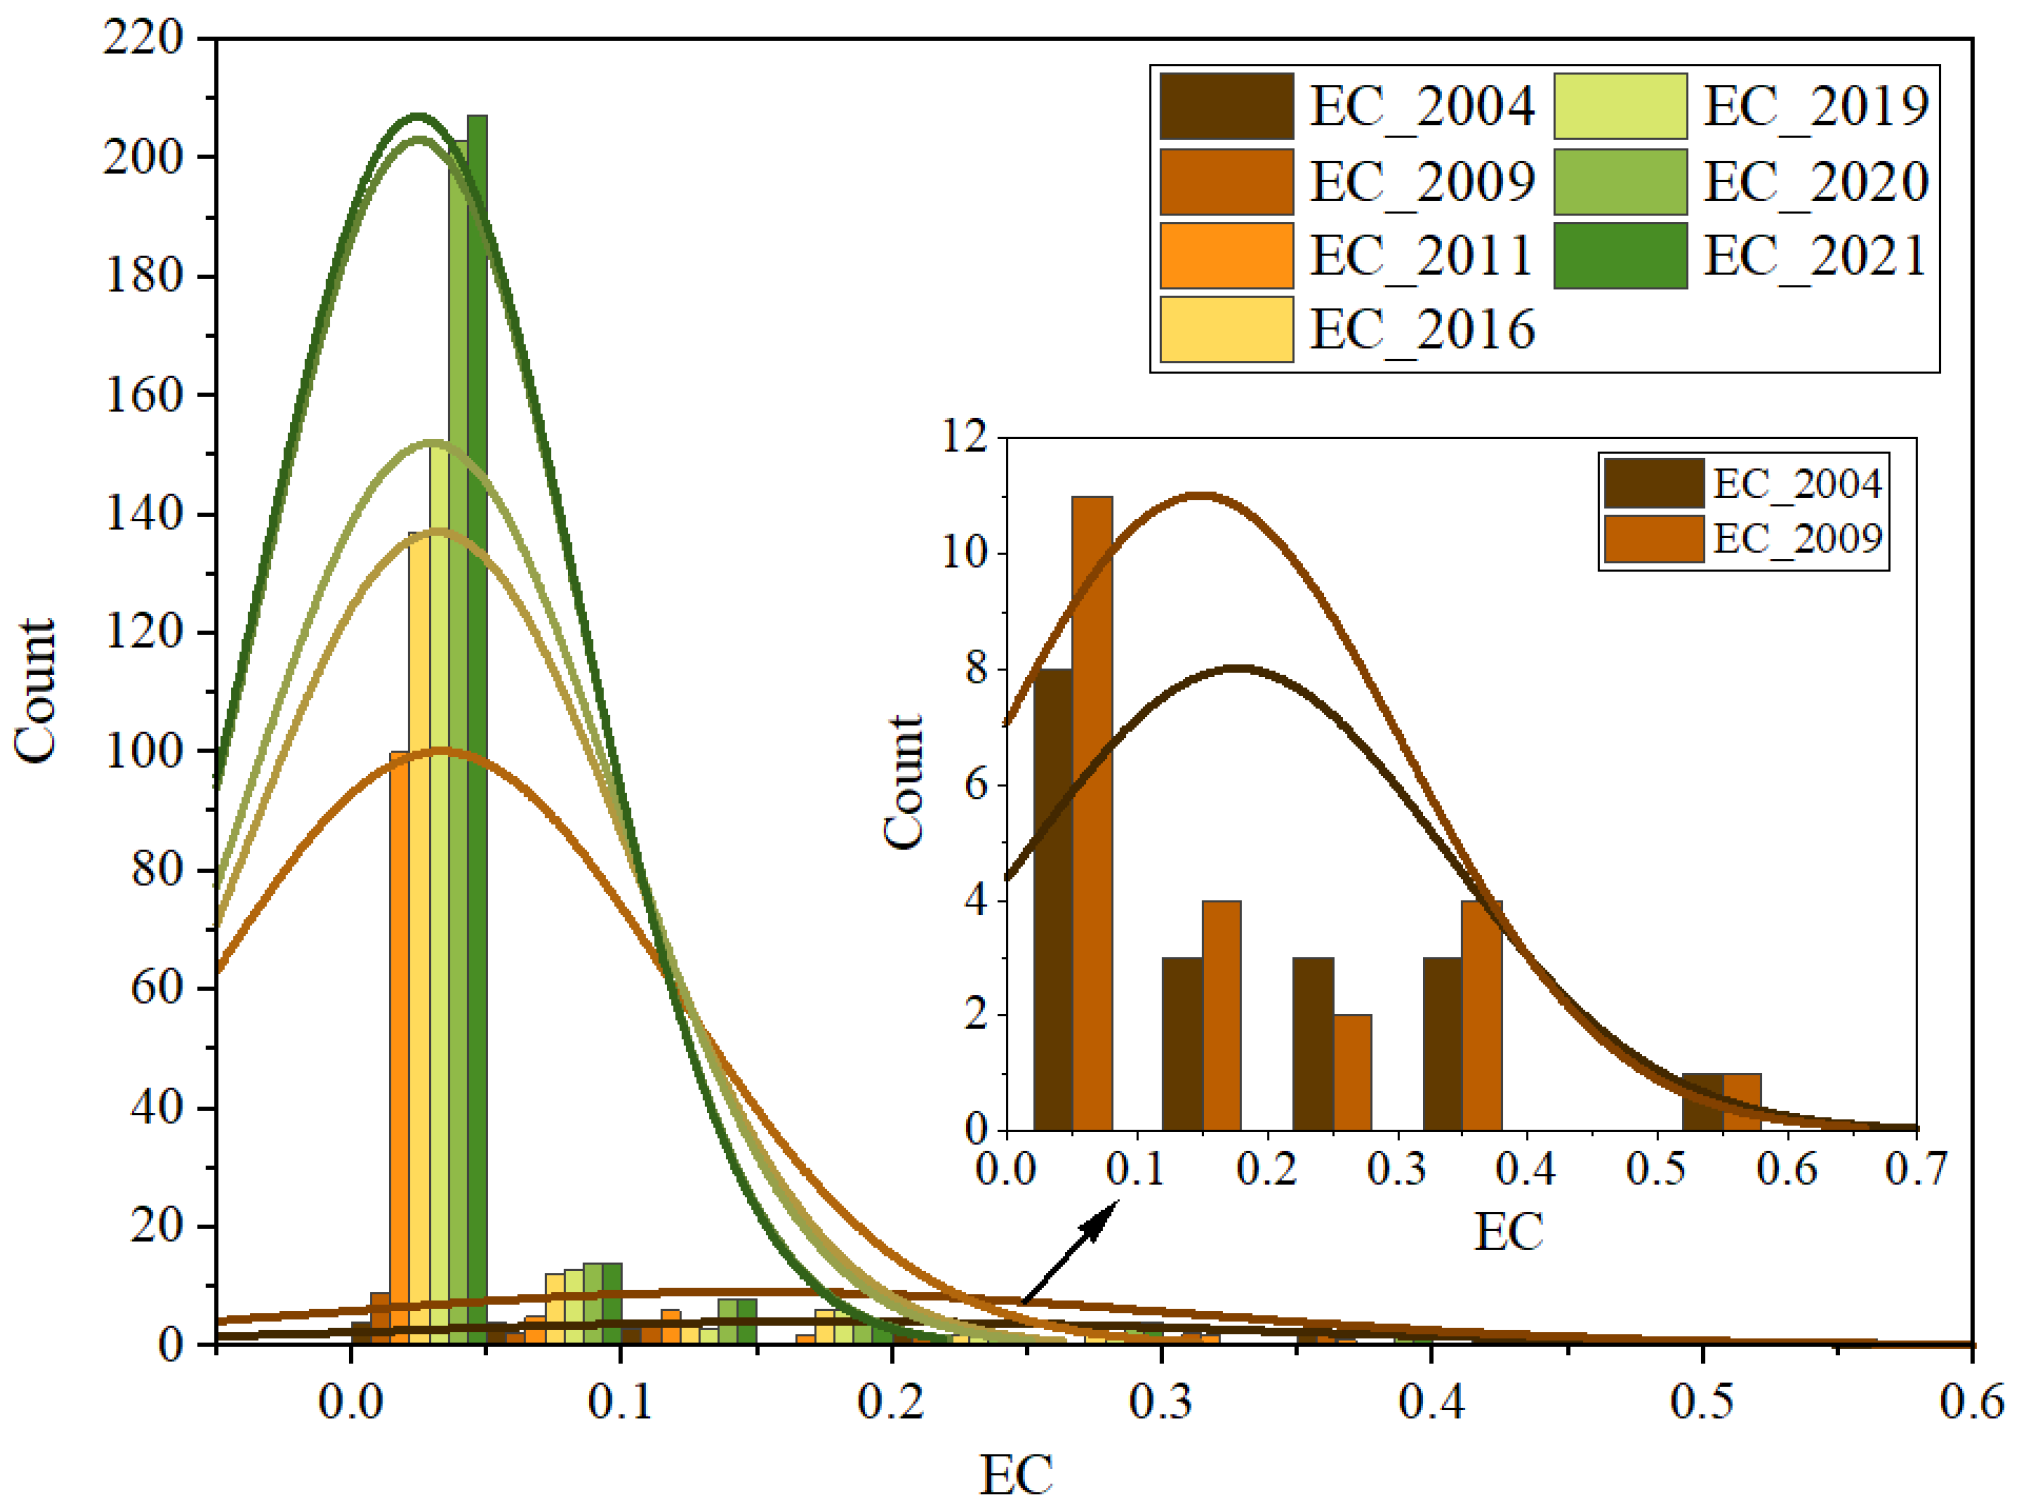
3.2. Dynamic Evolution Analysis of Node Centrality

Based on the node centrality indexes (DC/EC/BC/CC/PR) of the SZMN from 2004 to 2021, the dynamic evolution analysis of the node centrality was carried out. Table 4 shows the average node centralities of the SZMN in each period. In 2010, the EC of the nodes is missing due to the disconnection of the network. It can be clearly seen that, with the time evolution, the D C ¯ , E C ¯ and P R ¯ show trends of annual decline, while the average degree ( k ¯ ) increased year by year. The B C ¯ decreased gradually after a sudden increase in 2011. Moreover, the C C ¯ is different from the other indicators: it increased after a sharp decline in 2010, and then fluctuated slightly. In general, with the expansion of the SZMN, the connection between nodes became closer, and the overall network structure tended to be coordinated.
DC. The D C i is proportional to the importance of the node (i) in the network. Figure 4a shows the frequency-distribution histogram of the node degree ( k i ) in the SZMN at different periods. Nodes with k = 2 account for the highest proportion in each period, indicating that the scale-free characteristics of the SZMN were more obvious. That is, a few hub nodes played leading roles in the network operation. The proportion of nodes with k = 2 changed with an N-type trend over time. Moreover, it reached the maximum of 82.2% in 2011, then dropped to 76.5% in 2016, and finally rose to 78.3% in 2021. In contrast, the proportion of nodes with k = 4 exhibited the И type, with the lowest proportion of 2.04% in 2010, and the highest proportion of 13.3% in 2016. Meanwhile, nodes with k = 8 (namely, four-line transfer stations) began to appear in 2016, and their proportion shows a decreasing trend year by year. In general, the SZMN shows the characteristics of a small-world network with a small number of high-degree nodes (hubs) [16,21,59]. With the development of the network, the SZMN tended to be developed, and the proportion of low-degree nodes gradually decreased. Moreover, after removing the nodes with k = 1 , the fitting result of the accumulative degree clearly shows the truncated power-law distribution ( p ( k ) ~ k λ ) in the log–log coordinate system. The fitting accuracy ( R 2 ) is 0.98 and above (as plotted in Figure 4b). The λ decreased from 7.32 in 2010 to 3.67 in 2016, and then stayed around 3.8. This, combined with the fact that the proportion of nodes with low degrees ( k = 1 ,   2 ) decreased from 94% to 83%, shows that the scale-free [60] and heterogeneous [4] characteristics of the SZMN become more and more evident with the expansion of the network.
EC. For the node (i), the E C i measures the sum of the importance of its adjacent nodes [8]. The frequency-distribution histograms and normal fitting curves of the EC in different periods are plotted in Figure 5. It can be clearly seen that the normal fitting curves of the EC frequency distribution in 2004 and 2009 were flatter, with a larger mean and standard deviation. Based on the EC distribution in each period, we concluded that the EC in the initial stage of the network was generally large and then tended to decrease. However, some key stations, such as Chegongmiao, the Convention & Exhibition Center, Civic Center, Futian, etc., were still high in EC compared with the others at any period, which is owing to the fact that the adjacent nodes around these keys were also more important. Nodes with high ECs tended to make up the key areas of the network.
BC. According to Figure 2, the B C i is used to determine the middlemost node in the network, which plays a bridge role in the network. Nodes with larger BCs represent more critical nodes (such as hub nodes) in the network [4,17,46]. The heat maps of the BC distribution and the frequency-distribution histograms under each period of the SZMN are shown in Figure 6a,b. The nodes with high BCs in each period are multiline transfer stations, and their control over the physical network is stronger than ordinary stations. For example, Chegongmiao Station ( ID = 10 ) became the most critical hub of the whole network after changing from an ordinary station to a four-line transfer station in 2016. Similarly, Futian Station ( ID = 49 ) changed from a two-line transfer station to a three-line transfer station, which resulted in the rise in the status of the network. Based on the BC frequency-distribution histograms of different periods, the network-development period can be divided into two stages, including [ 2004 ,   2011 ] and [ 2016 ,   2021 ] . As plotted in Figure 6b, the normal fitting curves are also divided into two groups according to the shape. Three new lines (L-11/7/9) opened in 2016, and they had greater influences on the entire network topology.
CC. The node (i) has high C C i if the shortest distance to any other node in the graph (G) is small [60]. The CC is closer to the geometric centrality than the BC. From Figure 7a, we can clearly see the heat map of the CC distribution of all the nodes in the SZMN. With the dynamic evolution, the nodes at the geometric center of the network changed from Exhibition Center ( ID = 7 ) to Futian ( ID = 49 ) and Children’s Palace ( ID = 63 ). Moreover, the region formed around these three stations can be considered the geometric center range of the SZMN. However, the center position, in the geometric sense, is not exactly equal to the functional center of the network. It is defective to judge the node importance according to the single centrality index, which is made up in Section 3.3 by integrating the multiple indicators. On the whole, the CCs of all the nodes have almost the same development trend over time. Similar to the DC/EC/BC, the fitting curves of the CC frequency-distribution histogram of all nodes (as shown in Figure 7b) also show oblate and flat trends for 2004 and 2009. Subsequently, the number of nodes increased, and the shortest travel distance from one node to other nodes became shorter. Such a network development trend is reasonable for the time being.
PR. The PR is derived from the webpage rank and is often used to evaluate the webpage optimization, emphasizing that a more important webpage is often referenced by other webpages. In the traffic-complex network, the PR is used to identify the key nodes that have greater impacts on the traffic efficiency in the traffic system [30]. Because the PRs of the nodes in the early stage of the network differed greatly from those in the later stage, the PRs of all nodes in each period were normalized based on Equation (1) for better comparison. Thus, all the PRs of all nodes were between [ 0 ,   1 ] , and the specific results are shown in Figure 8a. With the development of the network, the node with the highest PR was always the Convention & Exhibition Center Station ( ID = 7 ) from 2004 to 2010, and it became Shenzhen North Station ( ID = 94 ) in 2011. From 2016 to 2021, Chegongmiao Station ( ID = 10 ) owns the highest PR due to its four-line transfer ability. It can be seen that the nodes with the highest PRs are all multiline transfer stations. At the same time, these transfer nodes with high DCs and BCs often play greater control roles in the network and affect other nodes around them. Therefore, these key nodes should be managed and controlled to prevent the vulnerability caused by the deliberate attack. The normal fitting curves of the PR frequency distribution shown in Figure 8b are similar to the four index curves mentioned above, which indicates that the network was very unstable in the early stage of construction.

3.3. Dynamic Evolution Analysis of Node Importance

Combined with the centrality-distribution results of all nodes in Section 3.2, and the multi-attribute decision method proposed in Section 2.3, the identification and ranking of the node importance were achieved. In this way, five indicators (DC/EC/BC/CC/PR) of all the nodes in each period of the SZMN could be applied to calculate the node importance (i.e., X N m = [ x i j ] , i = 1 , 2 , , n ;   j = 1 , 2 , , 5 ), and the n in each period is the number of nodes. The weights ( W j ) occupied by the five indicators could be calculated with the discretization coefficient method and they are shown in Table 5. What needs illustration is that four indicators (DC/BC/CC/PR) of all the nodes in 2010 were applied to calculate the node importance (C) due to the missing EC of 2010. Thus, when we take 2010 out of the picture, the weight proportion in the five indicators in descending order is EC, BC, DC, PR and CC. Overall, the five indicators increase at first, then decrease and finally maintain a relatively stable level. Among them, 2010 and 2011 are the two periods that caused large fluctuations in the data.
For a node (i), its node importance ( C i ) evolves dynamically over time, which is closely related to the changes in the node type, surrounding nodes and network environment. The node-importance-ranking results for the SZMN from 2004 to 2021 can be visualized with the GIS heat map and they are shown in Figure 9. The redder the color in the picture, the more important the node. The node with the largest C value in 2004 and 2009, (namely, the most important node) is the Convention & Exhibition Center Station ( ID = 7 ), and, at that time, it was the only two-line transfer station. In 2010, two new lines were opened, and the most important node was the Window of the World station. The Window of the World Station ( ID = 14 ) realized the connection of the three lines and its importance surpassed that of the Convention & Exhibition Center. Since 2011, the network topology has become luxuriant. Opening L-5 in 2011 allowed passengers to reach any station. Thus, Futian Station ( ID = 49 ) became the most important station because it had the most transfer stations around it. With Futian as the center, the area became the core place of the whole network (where the red is more concentrated in Figure 9d).
After opening three new lines (L-11/7/9) in 2016, Chegongmiao Station ( ID = 10 ) changed from an ordinary station to a four-line transfer station and became the core of the entire network topology. Thus, Futian Station turned into the second most important node due to its connection with Chegongmiao. Compared with 2011, the important areas began to extend in the airport direction in 2016. Qianhaiwan Station ( ID = 21 ) showed a dramatic difference in that it transformed from two-line transfer in 2016 to three-line transfer in 2019. Thus, its node importance rose from 22nd to 17th. Moreover, the newly opened L-6/10 in 2020 changed the structural importance of some of the nodes. Among them, the change in Shenzhen North Station ( ID = 94 ) was analogous to Qianhaiwan, and its node importance rose from 35th to 25th. There were few differences in the overall trends in the node importance in 2020 and 2021.
With the spatiotemporal evolution of the network, the importance of the same node may have been variational in different periods. Therefore, for a node (i), we should not directly compare the C i value at different periods. To eliminate the defect, the node-sorting number ( R a n k C i ) is further given the relative value: R a n k C i * = R a n k C i / N k ,   i = 1 , 2 , , n , where N k is the number of nodes in each period, and k = 1 , 2 , , 8 . It is more reasonable to analyze the dynamic evolution law of the node importance based on R a n k C i * . To explain the different influences of the network development on the node importance, the following are some examples for detailed discussions.
The broken-line trends of the node importance of some stations over time are plotted in Figure 10. We can see that the Convention & Exhibition Center Station ( ID = 7 ) played an important role in the whole network from 2004 to 2021, with a relative importance R a n k C 7 *   above 94.4%. Meanwhile, the R a n k C 7 * of Chegongmiao Station ( ID = 10 ) remained above 99.4% after it became a four-line transfer station. The broken lines of R a n k C 7 * and R a n k C 10 * present upward trends analogously in Figure 10. However, the line of the Window of the World Station ( ID = 14 ) increases at first, then decreases and the peak value appears for 2011. Futian Station ( ID = 49 ) emerged in 2011, and its R a n k C 49 * decreases first, and then increases and is maintained above 98.8%. Moreover, the R a n k C i * trend lines of Civic Center Station ( ID = 50 ) and Fumin Station ( ID = 89 ) are similar in shape, and both appear at the lowest point in 2010 and then maintain a high level. Thus, we can conclude that the importance of the different nodes may not be the same in a certain period. At the same time, the importance of the same node may also vary in different periods. Therefore, the comprehensive analysis should be conducted from the perspective of dynamic development when we evaluate the node importance, and conclusions that are drawn only from a certain period may be one-sided.
From the analysis above, we can draw the following conclusions: with the dynamic evolution of the time, the node importance of the SZMN began to disperse gradually from the core area of Chegongmiao–Futian to the direction of the Airport and Shenzhen North (high-speed railway station). The network development was reasonable, and it can avoid the vulnerability caused by deliberate attack. Furthermore, for some nodes, structural changes brought about by opening new lines greatly impacted the node importance. Hence, when evaluating the node importance of the metro, we should not only consider the spatiotemporal development trend of the entire network, but also take into account the changes in the importance of the adjacent nodes [46]. The conclusions drawn by combining various factors are more persuasive.

4. Conclusions and Future Work

In this paper, the dynamic evolution of the complex topology and node importance of the SZMN from 2004 to 2021 are analyzed and deeply discussed. First, the Space L topological network in eight periods of the SZMN were modeled. The node centralities (DC/EC/BC/CC/PR) of all nodes in each period were calculated based on the classical measurement methods. Second, combined with the quantitative comparison of different parameters, the dynamic evolution analysis of the SZMN network topology in eight periods was carried out. Moreover, the centrality differences of diverse nodes in the same period were horizontally analyzed, and the dynamic changes in the node centrality with the periods were longitudinally compared. Finally, the proposed weighted TOPSIS algorithm was used to identify and rank the node importance in the eight periods. The characteristics and mechanism of the spatiotemporal evolution of the node importance are discussed qualitatively and quantitatively. Based on complex network theory, graph theory and mathematical statistical analysis, the macroscopic network and microscopic nodes were combined in this study. The conclusions can be drawn in the following:
(1)
With the spatiotemporal evolution of the network, the SZMN gradually developed from a loop network to a tree network after 2011, and the number of loops grew linearly. The nodes in the SZMN became more and more intensive. Moreover, the proportion of low-degree nodes declined gradually, and the small-world effect was increasingly weakened. For the information transmission between nodes, the global efficiency decreased over time, but the local efficiency became higher. The fault-tolerant ability of the SZMN became stronger and the network became more and more assortative;
(2)
The proportion of high-degree nodes gradually increased, and the scale-free and heterogeneous characteristics of the SZMN become more and more obvious. The nodes with high ECs tended to form the core areas of the network. The nodes with high BCs in each period are all multiline transfer stations, and their control over the physical network is stronger. The three new lines that opened in 2016 (L-11/7/9) had a significant impact on the network topology. The CCs of all the nodes had the same overall development trend over time. Generally, the DCs, BCs and PRs of the transfer stations in the network were usually at a higher level, which should be focused on management to prevent the vulnerability caused by deliberate attack. The shortest travel distance from one node to others became shorter with the network development, and the evolution trend tended to be reasonable;
(3)
In the node-importance evaluation, the multi-attribute decision-making method is better than a single attribute. The EC occupies the highest influence weight of the five indicators. With the evolution over time, the node importance of the SZMN gradually dispersed from the core area of Chegongmiao–Futian to the direction of the Airport and Shenzhen North (high-speed railway station). So far, the network development trend looks rational, and it can avoid the vulnerability caused by deliberate attack. Moreover, the node importance is closely related to the changes in the node type, surrounding nodes and network environment. Thus, we should consider the spatiotemporal development trend of the network and the changes in the importance of adjacent nodes when evaluating the metro node importance.
The research results on the dynamic evolution of the complex topology and node importance of the metro network can provide scientific suggestions and decision support for the planning, construction, operation management and sustainable development of the urban metro. At the same time, for the policies formulated in the daily operation management, future planning and construction process of the Shenzhen Metro, and especially in key station or regional management, large passenger flow control, local and regional policies, etc., this study will play an important role in the subsequent improvement in the policies. This paper has important theoretical and practical significance. However, there are still some limitations in this study that need to be improved. In future work, we need to continue to strengthen the optimization of the node centralities and improve the algorithm of the node-importance evaluation. Next, we should consider more factors, such as passenger flow and train scheduling, and comprehensively assess the dynamic evolution mechanism of the metro network. This study provides some suggestions and references for the resilient sustainability of urban-rail-transit development.

Author Contributions

Conceptualization, Y.M.; methodology, Y.M.; supervision, Q.Q.; resources, W.Z.; visualization, Y.M.; writing—original draft, Y.M.; writing—review and editing, Y.M.; funding acquisition, Q.Q. and J.L. All authors have read and agreed to the published version of the manuscript.

Funding

This research was funded by the Innovation and Entrepreneurship Science and Technology Project of China Coal Research Institute (No. 2021-JSYF-006), and the Innovation and Entrepreneurship Science and Technology Project of China Coal Technology and Engineering Group (No. 2022-2-QN004).

Institutional Review Board Statement

Not applicable.

Informed Consent Statement

Not applicable.

Data Availability Statement

Not applicable.

Conflicts of Interest

The authors declare no conflict of interest with regard to the publication of this paper.

References

  1. Chinese Urban Rail Transit Association. The Annual Statistics and Analysis Report of Urban Rail Transit in 2021. Available online: https://www.camet.org.cn/xhfb/9935 (accessed on 23 April 2022).
  2. Chen, S.; Zhuang, D. Evolution and Evaluation of the Guangzhou Metro Network Topology Based on an Integration of Complex Network Analysis and GIS. Sustainability 2020, 12, 538. [Google Scholar] [CrossRef] [Green Version]
  3. Lin, C.; Wang, K.; Wu, D.; Gong, B. Passenger Flow Prediction Based on Land Use around Metro Stations: A Case Study. Sustainability 2020, 12, 6844. [Google Scholar] [CrossRef]
  4. Feng, J.; Li, X.; Mao, B.; Xu, Q.; Bai, Y. Weighted Complex Network Analysis of the Beijing Subway System: Train and Passenger Flows. Physica A 2017, 474, 213–223. [Google Scholar] [CrossRef]
  5. Lin, P.; Weng, J.; Fu, Y.; Alivanistos, D.; Yin, B. Study on the Topology and Dynamics of the Rail Transit Network Based on Automatic Fare Collection Data. Physica A 2020, 545, 123538. [Google Scholar] [CrossRef]
  6. Xiao, X.; Jia, L.; Wang, Y. Correlation between Heterogeneity and Vulnerability of Subway Networks Based on Passenger Flow. J. Rail Transp. Plan. Manag. 2018, 8, 145–157. [Google Scholar] [CrossRef]
  7. Yang, Z.; Chen, X. Evolution Assessment of Shanghai Urban Rail Transit Network. Physica A 2018, 503, 1263–1274. [Google Scholar] [CrossRef]
  8. Soh, H.; Lim, S.; Zhang, T.; Fu, X.; Lee, G.K.K.; Hung, T.G.G.; Di, P.; Prakasam, S.; Wong, L. Weighted Complex Network Analysis of Travel Routes on the Singapore Public Transportation System. Physica A 2010, 389, 5852–5863. [Google Scholar] [CrossRef]
  9. Meng, Y.; Li, Z.; Zhou, W.; Zhou, Z.; Zhao, X.; Zhong, M. Temporal-Spatial Analysis & Visualization of Passenger Flow after Opening New Railway Lines in Shenzhen Metro. In Proceedings of the 4th ACM SIGSPATIAL International Workshop on Safety and Resilience, Seattle, WA, USA, 6 November 2018; pp. 1–6. [Google Scholar]
  10. Zhou, Y.; Li, Z.; Meng, Y.; Li, Z.; Zhong, M. Analyzing Spatio-Temporal Impacts of Extreme Rainfall Events on Metro Ridership Characteristics. Physica A 2021, 577, 126053. [Google Scholar] [CrossRef]
  11. Zhao, J.; Qu, Q.; Zhang, F.; Xu, C.; Liu, S. Spatio-Temporal Analysis of Passenger Travel Patterns in Massive Smart Card Data. IEEE Trans. Intell. Transp. Syst. 2017, 18, 3135–3146. [Google Scholar] [CrossRef]
  12. Zhang, W.; Fang, C.; Zhou, L.; Zhu, J. Measuring Megaregional Structure in the Pearl River Delta by Mobile Phone Signaling Data: A Complex Network Approach. Cities 2020, 104, 102809. [Google Scholar] [CrossRef]
  13. Zhang, W.; Zhu, J.; Zhao, P. Comparing World City Networks by Language: A Complex-Network Approach. ISPRS Int. J. Geo-Inf. 2021, 10, 219. [Google Scholar] [CrossRef]
  14. Pu, H.; Li, Y.; Ma, C. Topology Analysis of Lanzhou Public Transport Network Based on Double-Layer Complex Network Theory. Physica A 2022, 592, 126694. [Google Scholar] [CrossRef]
  15. Shirai Reyna, O.S.; Flores de la Mota, I.; Rodríguez Vázquez, K. Complex Networks Analysis: Mexico’s City Metro System during the Pandemic of COVID-19. Case Stud. Transp. Pol. 2021, 9, 1459–1466. [Google Scholar] [CrossRef] [PubMed]
  16. González, S.H.; De La Mota, I.F. Applying Complex Network Theory to the Analysis of Mexico City Metro Network (1969–2018). Case Stud. Transp. Pol. 2021, 9, 1344–1357. [Google Scholar] [CrossRef]
  17. Wu, X.; Dong, H.; Tse, C.K.; Ho, I.W.H.; Lau, F.C.M. Analysis of Metro Network Performance from a Complex Network Perspective. Physica A 2018, 492, 553–563. [Google Scholar] [CrossRef]
  18. Meng, Y.; Tian, X.; Li, Z.; Zhou, W.; Zhou, Z.; Zhong, M. Comparison Analysis on Complex Topological Network Models of Urban Rail Transit: A Case Study of Shenzhen Metro in China. Physica A 2020, 559, 125031. [Google Scholar] [CrossRef]
  19. Csányi, G.; Szendrői, B. Fractal–Small-World Dichotomy in Real-World Networks. Phys. Rev. E 2004, 70, 016122. [Google Scholar] [CrossRef] [PubMed] [Green Version]
  20. Chopra, S.S.; Dillon, T.; Bilec, M.M.; Khanna, V. A Network-Based Framework for Assessing Infrastructure Resilience: A Case Study of the London Metro System. J. R. Soc. Interface 2016, 13, 20160113. [Google Scholar] [CrossRef] [Green Version]
  21. Derrible, S.; Kennedy, C. The Complexity and Robustness of Metro Networks. Physica A 2010, 389, 3678–3691. [Google Scholar] [CrossRef]
  22. Li, Q.; Song, L.; List, G.F.; Deng, Y.; Zhou, Z.; Liu, P. A New Approach to Understand Metro Operation Safety by Exploring Metro Operation Hazard Network (MOHN). Saf. Sci. 2017, 93, 50–61. [Google Scholar] [CrossRef]
  23. Yu, W.; Ye, X.; Chen, J.; Yan, X.; Wang, T. Evaluation Indexes and Correlation Analysis of Origination–Destination Travel Time of Nanjing Metro Based on Complex Network Method. Sustainability 2020, 12, 1113. [Google Scholar] [CrossRef] [Green Version]
  24. Newman, M.E.J. Assortative Mixing in Networks. Phys. Rev. Lett. 2002, 89, 208701. [Google Scholar] [CrossRef] [PubMed] [Green Version]
  25. Ju, Y.; Yuan, H.; Li, Z.; Gan, M.; Chen, Y. Multilayer Structures and Resilience Evaluation for Multimode Regional Rail Transit System. IET Intell. Transp. Syst. 2022, 16, 843–859. [Google Scholar] [CrossRef]
  26. Du, Z.; Tang, J.; Qi, Y.; Wang, Y.; Han, C.; Yang, Y. Identifying Critical Nodes in Metro Network Considering Topological Potential: A Case Study in Shenzhen City—China. Physica A 2020, 539, 122926. [Google Scholar] [CrossRef]
  27. Kopsidas, A.; Kepaptsoglou, K. Identification of Critical Stations in a Metro System: A Substitute Complex Network Analysis. Physica A 2022, 596, 127123. [Google Scholar] [CrossRef]
  28. Freeman, L.C. Centrality in Social Networks Conceptual Clarification. Soc. Netw. 1978, 1, 215–239. [Google Scholar] [CrossRef] [Green Version]
  29. Freeman, L.C. A Set of Measures of Centrality Based on Betweenness. Sociometry 1977, 40, 35. [Google Scholar] [CrossRef]
  30. Li, J.; Zheng, P.; Zhang, W. Identifying the Spatial Distribution of Public Transportation Trips by Node and Community Characteristics. Transp. Plan. Technol. 2020, 43, 325–340. [Google Scholar] [CrossRef]
  31. Sun, D.; Zhao, Y.; Lu, Q.-C. Vulnerability Analysis of Urban Rail Transit Networks: A Case Study of Shanghai, China. Sustainability 2015, 7, 6919–6936. [Google Scholar] [CrossRef] [Green Version]
  32. Chen, H.; Zhang, L.; Ran, L. Vulnerability Modeling and Assessment in Urban Transit Systems Considering Disaster Chains: A Weighted Complex Network Approach. Int. J. Disaster Risk Reduct. 2021, 54, 102033. [Google Scholar] [CrossRef]
  33. Wang, Y.; Tian, C. Measure Vulnerability of Metro Network Under Cascading Failure. IEEE Access 2021, 9, 683–692. [Google Scholar] [CrossRef]
  34. Lu, Q.-C.; Zhang, L.; Xu, P.-C.; Cui, X.; Li, J. Modeling Network Vulnerability of Urban Rail Transit under Cascading Failures: A Coupled Map Lattices Approach. Reliab. Eng. Syst. Saf. 2022, 221, 108320. [Google Scholar] [CrossRef]
  35. Gao, C.; Fan, Y.; Jiang, S.; Deng, Y.; Liu, J.; Li, X. Dynamic Robustness Analysis of a Two-Layer Rail Transit Network Model. IEEE Trans. Intell. Transp. Syst. 2021, 1–16. [Google Scholar] [CrossRef]
  36. Shang, W.-L.; Gao, Z.; Daina, N.; Zhang, H.; Long, Y.; Guo, Z.; Ochieng, W.Y. Benchmark Analysis for Robustness of Multi-Scale Urban Road Networks Under Global Disruptions. IEEE Trans. Intell. Transport. Syst. 2022, 1–11. [Google Scholar] [CrossRef]
  37. Frutos Bernal, E.; Martín del Rey, A. Study of the Structural and Robustness Characteristics of Madrid Metro Network. Sustainability 2019, 11, 3486. [Google Scholar] [CrossRef] [Green Version]
  38. Xu, Z.; Chopra, S.S. Network-Based Assessment of Metro Infrastructure with a Spatial–Temporal Resilience Cycle Framework. Reliab. Eng. Syst. Saf. 2022, 223, 108434. [Google Scholar] [CrossRef]
  39. Yin, J.; Ren, X.; Liu, R.; Tang, T.; Su, S. Quantitative Analysis for Resilience-Based Urban Rail Systems: A Hybrid Knowledge-Based and Data-Driven Approach. Reliab. Eng. Syst. Saf. 2022, 219, 108183. [Google Scholar] [CrossRef]
  40. Serdar, M.Z.; Koç, M.; Al-Ghamdi, S.G. Urban Transportation Networks Resilience: Indicators, Disturbances, and Assessment Methods. Sustain. Cities Soc. 2022, 76, 103452. [Google Scholar] [CrossRef]
  41. Liu, Z.; Chen, H.; Liu, E.; Zhang, Q. Evaluating the Dynamic Resilience of the Multi-Mode Public Transit Network for Sustainable Transport. J. Clean. Prod. 2022, 348, 131350. [Google Scholar] [CrossRef]
  42. Cats, O. Topological Evolution of a Metropolitan Rail Transport Network: The Case of Stockholm. J. Transp. Geogr. 2017, 62, 172–183. [Google Scholar] [CrossRef] [Green Version]
  43. Yu, W.; Chen, J.; Yan, X. Space–Time Evolution Analysis of the Nanjing Metro Network Based on a Complex Network. Sustainability 2019, 11, 523. [Google Scholar] [CrossRef] [Green Version]
  44. He, Y.; Xu, Z.; Zhao, Y.; Tsui, K.-L. Dynamic Evolution Analysis of Metro Network Connectivity and Bottleneck Identification: From the Perspective of Individual Cognition. IEEE Access 2019, 7, 2042–2052. [Google Scholar] [CrossRef]
  45. Zhang, L.; Lu, J.; Fu, B.; Li, S. Dynamics Analysis for the Hour-Scale Based Time-Varying Characteristic of Topology Complexity in a Weighted Urban Rail Transit Network. Physica A 2019, 527, 121280. [Google Scholar] [CrossRef]
  46. Meng, Y.; Tian, X.; Li, Z.; Zhou, W.; Zhou, Z.; Zhong, M. Exploring Node Importance Evolution of Weighted Complex Networks in Urban Rail Transit. Physica A 2020, 558, 124925. [Google Scholar] [CrossRef]
  47. Wang, S.; Du, Y.; Deng, Y. A New Measure of Identifying Influential Nodes: Efficiency Centrality. Commun. Nonliear Sci. 2017, 47, 151–163. [Google Scholar] [CrossRef]
  48. Ibnoulouafi, A.; El Haziti, M.; Cherifi, H. M-Centrality: Identifying Key Nodes Based on Global Position and Local Degree Variation. J. Stat. Mech. 2018, 2018, 073407. [Google Scholar] [CrossRef]
  49. Yu, H.; Cao, X.; Liu, Z.; Li, Y. Identifying Key Nodes Based on Improved Structural Holes in Complex Networks. Physica A 2017, 486, 318–327. [Google Scholar] [CrossRef]
  50. Zanakis, S.H.; Solomon, A.; Wishart, N.; Dublish, S. Multi-Attribute Decision Making: A Simulation Comparison of Select Methods. Eur. J. Oper. Res. 1998, 107, 507–529. [Google Scholar] [CrossRef]
  51. Yeh, C.-H. A Problem-Based Selection of Multi-Attribute Decision-Making Methods. Int. Trans. Oper. Res. 2002, 9, 169–181. [Google Scholar] [CrossRef]
  52. Michael Taylor Public Transport Networks. Vulnerability Analysis for Transportation Networks; Elsevier: Amsterdam, The Netherlands, 2017; pp. 175–204. [Google Scholar]
  53. Lv, Z.; Zhao, N.; Xiong, F.; Chen, N. A Novel Measure of Identifying Influential Nodes in Complex Networks. Physica A 2019, 523, 488–497. [Google Scholar] [CrossRef]
  54. Sun, Y.; Yao, P.-Y.; Wan, L.-J.; Shen, J.; Zhong, Y. Ranking Important Nodes in Complex Networks by Simulated Annealing. Chin. Phys. B 2017, 26, 020201. [Google Scholar] [CrossRef]
  55. Du, Y.; Gao, C.; Hu, Y.; Mahadevan, S.; Deng, Y. A New Method of Identifying Influential Nodes in Complex Networks Based on TOPSIS. Physica A 2014, 399, 57–69. [Google Scholar] [CrossRef]
  56. Hu, J.; Du, Y.; Mo, H.; Wei, D.; Deng, Y. A Modified Weighted TOPSIS to Identify Influential Nodes in Complex Networks. Physica A 2016, 444, 73–85. [Google Scholar] [CrossRef]
  57. Mohamad, I.B.; Usman, D. Standardization and Its Effects on K-Means Clustering Algorithm. Res. J. Appl. Sci. Eng. Technol. 2013, 6, 3299–3303. [Google Scholar] [CrossRef]
  58. Watts, D.J.; Strogatz, S.H. Collective Dynamics of ‘Small-World’ Networks. Nature 1998, 393, 440–442. [Google Scholar] [CrossRef]
  59. Latora, V.; Marchiori, M. Is the Boston Subway a Small-World Network? Physica A 2002, 314, 109–113. [Google Scholar] [CrossRef] [Green Version]
  60. Hong, J.; Tamakloe, R.; Lee, S.; Park, D. Exploring the Topological Characteristics of Complex Public Transportation Networks: Focus on Variations in Both Single and Integrated Systems in the Seoul Metropolitan Area. Sustainability 2019, 11, 5404. [Google Scholar] [CrossRef] [Green Version]
Figure 1. Shenzhen Metro System Map in January 2022.
Sustainability 14 07234 g001
Figure 2. Graphical illustration of node centralities.
Sustainability 14 07234 g002
Figure 3. The topology structure of SZMN from 2004 to 2021: (a) 2004; (b) 2009; (c) 2010; (d) 2011; (e) 2016; (f) 2019; (g) 2020; (h) 2021.
Sustainability 14 07234 g003
Figure 4. (a) The frequency-distribution histogram of node degree ( k i ) in SZMN; (b) the truncated power-law distributions of accumulative degree in SZMN.
Sustainability 14 07234 g004
Figure 5. The frequency-distribution histograms and normal fitting curves of EC in SZMN.
Sustainability 14 07234 g005
Figure 6. (a) The heat maps of BC distribution in SZMN; (b) the frequency-distribution histograms of BC distribution in SZMN.
Sustainability 14 07234 g006
Figure 7. (a) The heat maps of CC distribution in SZMN; (b) the frequency-distribution histograms of CC distribution in SZMN.
Sustainability 14 07234 g007
Figure 8. (a) The heat maps of PR distribution in SZMN; (b) the frequency-distribution histograms of PR distribution in SZMN.
Sustainability 14 07234 g008
Figure 9. The heat map of node-importance-ranking results of SZMN from 2004 to 2021: (a) 2004; (b) 2009; (c) 2010; (d) 2011; (e) 2016; (f) 2019; (g) 2020; (h) 2021.
Sustainability 14 07234 g009aSustainability 14 07234 g009b
Figure 10. The broken-line trends of node importance of some stations in SZMN.
Sustainability 14 07234 g010
Table 1. The existing lines in eight periods of SZMN from 2004 to 2021.
No.PeriodsExisting Lines
12004L-1/4
22009L-1/4
32010L-1/2/3/4
42011L-1/2/3/4/5
52016L-1/2/3/4/5/7/9/11
62019L-1/2/3/4/5/7/9/11
72020L-1/2/3/4/5/6/7/8/9/10/11
82021L-1/2/3/4/5/6/7/8/9/10/11/20
Table 2. The definitions and calculations of node centralities.
IndexDefinitionFormula
D C [28] D C measures the total number of connected edges of a node. k i = j N α i j ,   D C i = k i N 1
E C [8,28] E C can identify the different effects of neighbor ones on a node on it. λ e i = j = 1 N α i j e j
e = [ e 1   ,   e 2 , e n ] T
B C [29] B C is the shortest number of paths through a node. B C i = i j k σ j k ( i ) σ j k
C C [29] C C is used to measure the ability of a station to affect another node through the network. C C i = N 1 j = 1 , i j N d i j
P R [30] P R   is used to calculate the ranking of nodes in a graph based on the structure of incoming links. P R ( i ) = ( 1 λ ) 1 n + λ j : j k P R ( j ) d j ¯
Table 3. The topology parameters of SZMN from 2004 to 2021.
PeriodNELβγAPLDρ δ θ σ
2004181720.94415.19140.111100.3179−0.2289
2009222120.95516.16170.090900.2799−0.0194
2010494740.95920.040000.1281−0.0066
201111812651.0681313.62430.01830.00420.12390.1534
201616619081.1453211.64430.01390.00260.1323−0.0431
201918120781.1443411.70430.01270.00240.1292−0.0283
2020236271111.1484613.60420.00980.00370.11100.0603
2021240275121.1464713.70420.00960.00360.10990.0608
Table 4. The average node centralities of SZMN in each period.
Period D C ¯ E C ¯ B C ¯ C C ¯ P R ¯
20040.11110.17630.26180.20360.0556
20090.09090.14750.25800.17150.0455
20100.04000.08540.07190.0204
20110.01830.03280.10880.07710.0085
20160.01390.03150.06490.09150.0060
20190.01270.02940.05980.09080.0055
20200.00980.02480.05380.07830.0042
20210.00960.02440.05340.07760.0042
Table 5. The weights ( W j ) of the five indicators in each period of SZMN.
W j DCECBCCCPR
20040.1390.3530.3030.090.116
20090.1210.4040.290.0870.098
20100.1550.5690.1520.125
20110.0770.650.1660.0490.057
20160.0940.5270.2570.0520.07
20190.090.5210.2740.0490.067
20200.0880.5530.2450.0530.062
20210.0870.5510.2490.0520.061
Publisher’s Note: MDPI stays neutral with regard to jurisdictional claims in published maps and institutional affiliations.

