Article

Does the Impact of Technology Sustain Students’ Satisfaction, Academic and Functional Performance: An Analysis via Interactive and Self-Regulated Learning?

1
Advanced Innovation Center for Future Education, Faculty of Education, Beijing Normal University, Beijing 100875, China
2
Department of Information and Computing, University of Sufism and Modern Sciences, Bhitshah 70140, Sindh, Pakistan
3
Department of Chemical Engineering, Mehran University of Engineering & Technology, Jamshoro 76062, Sindh, Pakistan
4
School of Economics and Management, Beijing University of Technology, Beijing 100021, China
5
Department of Education, University of Sufism and Modern Sciences, Bhitshah 70140, Sindh, Pakistan
6
Department of Business Administration, University of Sufism and Modern Sciences, Bhitshah 70140, Sindh, Pakistan
*
Author to whom correspondence should be addressed.
Sustainability 2022, 14(12), 7226; https://doi.org/10.3390/su14127226
Submission received: 1 April 2022 / Revised: 8 May 2022 / Accepted: 27 May 2022 / Published: 13 June 2022
(This article belongs to the Collection Technology-Enhanced Learning and Teaching: Sustainable Education)

Abstract

:
High-quality academic outcomes are required for students’ educational attainment and promote their desire to learn. However, not all educational sectors boast of the same, leading students to attain inferior outcome performances. The current study examines the impact of technology on student satisfaction, academic, and functional performance via the mediating factors of interactive and self-regulated learning. However, existing works focused less on technology and more on psychological learning factors, rendering mere acceptance of technology, proved to be useless. The present research investigates such mediators with existing technology resources and their impact on students’ overall growth. Research hypotheses are tested through structural equation modeling and applied to the data collected from 302 respondents via a structured questionnaire. In addition, the present study considers the collection of each student’s data across different universities, colleges, vocational and education institutions, mainly where students are involved in/using the technology when it comes to satisfaction, academic, and functional performance. The results indicated that the impact of technology via interactive learning has a significant influence on students’ satisfaction (β = 0.238, p < 0.05), academic performance (β = 0.194, p < 0.05), and functional performance (β = 0.188, p < 0.05). It is also noted that the impact of technology via self-regulated learning has positively contributed to satisfaction, academic, and functional performance. Our findings support the hypothesis and encourage students’ adaptability, engagement, and behavioral interactions stimulating the performance outcomes. The performance outcome of this research presents valuable information for decision-makers to articulate sustainable strategies and tactics in educational sectors.

1. Introduction

In the interim, dawn of capitalism, educational sectors have been reformed and evolved in several uncertain ways. However, the momentum of such reforms in the present day and age is diverse. The fast growth of technology has contributed to eliminating distances among people to ease the learning process; hence, educational sectors are certainly motivated by the capacity and efficacy of digital learning [1]. For example, a study was conducted on 299 undergraduate students with a 71-item survey, which showed that 25% of participants have problems with disruptions from technology. Consequently, incorporating technology without a strategic methodology causes an onerous outcome than otherwise [2]. At the same time, a study suggested that educational sectors must be familiar that it is not about the trappings of adopting technology only [3]. Still, enactment and validation via training and learning strategies are also essential.
Digital learning leads to an era in which artificial intelligence (AI) has become a central element in our lives. AI in engineering and technology does not demand practical, technical knowledge and skills, but “creatively-focused technology fluency” (CFTF) [4]. Moreover, creativity has developed both individual competencies and intrinsic motivation, and it is a recognized construct in technology-enhanced learning [5]. However, there are still challenges: how to teach creativity via different learning factors in digital learning. Creativity infuses students with the desire to learn, be successful, and, maybe above all, attempt something different. Although including such learning factors is a good step towards student achievement, such as (1) adaptive learning [6], (2) self-regulated learning (SRL) [7], (3) online learning (eLearning) [8], (4) mobile learning (mLearning) [9], (5) interactive learning [10], (6) badging and gamification [11], (7) blended learning [12], and (8) virtual reality [13]. Literature in this regard confers that interactive learning and self-regulated learning are key learning factors [1]. It is noted that the selection of a smaller number of learning factors and their delineation to a student is a significant concern, which can lead to unresponsive and undesirable student’ behavior [1,2].
On the contrary, acceptance of technology by educational institutions towards the cause of students’ development, who are the subjects/respondents, is considered an essential part of higher education [14]. Educators are already conscious of the role that educational climate help creates among students, which plays a vital role in student satisfaction, motivation, and academic and social attainment [15]. Many studies have been conducted on technology acceptance in the last two decades, considering the differences in learning orientations or styles [16].
For instance, the factors that can enhance the computer-based assessments of in-class and outside-class computer training. The research was considered a class of some 400 with direct and current experience using computer-based training and assessment for course credit [17]. However, academics are limited as to what kind of ‘educational environment’ they can create per se. They also have to make the best use of the technology for every student, regardless of their satisfaction with technology, engagement, motivation, and learning styles in person and virtually [18].
Alternatively, there may be a need to study how students engage with that technology—what role the impact of technology plays in terms of performance features such as students’ satisfaction, academic, and functional performance? However, a study has been prejudiced with the performance features merely with educational attainment rather than social [19,20]. Overall, there is only one factor of digital learning than hybrid factors compared to our present research model as mentioned in earlier reports [1,18]. For the most part, we also noticed that previous studies were not intended to teach the students per se; instead, they are probably more about the use of technologies around learning [21].
Thereby, we present two methodological contributions to technology acceptance with the adoption of digital learning. First, the Measurement Invariance (MI) study suggests a within-study using the Common Factor Analysis (CFA) [22]. Second, the demonstration of the within-study MI of the Unified Theory of Acceptance and Use of Technology (UTAUT) is validated [23]. In particular, MI is the primary concern in different social and behavioral studies when the sample size includes several populations [24]. Within-study MI is used to group items/variables that differ within unique research, i.e., response count from an individual study contains different categorized item levels [25]. For instance, respondents pertaining highest and lowest educational backgrounds are considered in this research.
Underpinning the aim of the present study as it sheds light on learning and teaching. It ultimately has a clear motivation for teachers by assessing the impact of technology via digital learning in the classrooms. However, technology exists everywhere, wherein academics can choose to use it with the students—or not. It’s their decision and not the decision of the students. For instance, most academics provide black or whiteboard learning, which is familiar with most universities; whether students (or staff) like it, they are all forced to use it [26]. Regardless of their preferences and willingness or how much they engage with the technologies, students (and lecturers) will have to use them [27]. Therefore, our concern in the present research is not restricted to focusing on how well the students tend to engage with the technology only. However, the factors, such as interactive and self-regulated learning, which act as mediators, contribute to successful academic and social attainment outcomes. In this regard, the current research aims to harvest contributions such as:
  • This research examines technology acceptance using learning factors of digital learning.
  • This study presents an empirical analysis to observe the relationship of technology between self-regulated and interactive learning.
  • Students’ engagement with the technology via the mediating role of interactive and self-regulated learning can improve their satisfaction and academic and functional performance.
We used five other constructs (interactive learning, self-regulated learning, satisfaction, academic and functional performance) to establish the within-study MI as per the UTAUT model. Engagement should be the primary concern since engaging the student is bothersome and faced with continuous interruptions because the more students are engaged, the more they learn [28]. The content offered in educational settings has rich importance and instant worth to students to ensure students are getting full attention [29]. Therefore, we refer to ‘technology engagement,’ defined as students in the classroom indulging in a deeper understanding of topics that interest them, working together, and boosting their learning in digital knowledge.
On the contrary, the satisfaction construct is a short-term attitude, and it is assessed using students’ educational experience, services, and facilities [30]. The academic performance construct involves intellectual level, personality, motivation, skills, interests, and the teacher—student relationship [31]. Functional performance refers to applying academic skills in a cumbersome number of methods and various settings [32]. Functional performance can be perceived in how the student is involved in routine daily activities, including communication, activeness, behavior, and social skills. It also consists of daily routine academic and social activities that influence the students’ performance. Hence, it is not restricted to academics only, but contains other concerns associated with the general curriculum standards.
A self-regulated construct is defined as the student’s ability to understand and control the learning environment, including self-monitoring, self-instruction, and goal-oriented [33]. Interactive learning is learning that requires student participation via a set of activities, including group discussions and digital learning [34].
Existing studies have explored two existing models, such as TAM (Technology Acceptance Model) [35], UTAUT as prior technical knowledge, and game-based learning [11], respectively. Since the UTAUT model follows, the constructs reported by [23] are methodologically restricted. Within this perspective, this study has been guided by the research questions (RQ) as follows:
RQ1: How do the students engage with technology via interactive/self-regulated learning to sustain their satisfaction and academic and functional performance?
RQ2: What role does engaging in/using the technology play in academic and social attainment via composite learning factors?

1.1. Preliminaries

Higher education sectors have been capitalizing on assets using Information and Communication Technologies for Developments (ICT4D) to provide education attainment [36]. Further, previous works emphasized digital learning that helps to escalate the possibility of learning, which encompasses the different learning factors mentioned earlier [6,7,8,9,10,11,12,13]. In this paper, we considered the adoption of digital learning using technology involves two theories: (1) TAM and (2) UTAUT. In contrast, these two theories have remained the primary concern and adopted in recent works [17,18]. Whereas, diffusion of technology appraised in the opposite direction from a developed country into a developing country [36]. Consequently, technology adoption is indiscriminating; thus, it is not generalized to developing countries. Therefore, contributing factors and espousal in understanding the technology is still thought-provoking in developing countries [37].
In particular, students in the classroom consider the technology using interactive and self-regulated learning; they allow an exact infrastructure such as a rich mental framework to recognize moral and social responsibilities [38]. For instance, eLearning and mLearning have a strong link with academic research. However, students’ acquaintance related to mLearning may vary since they do not have the same level of perception or interest. Educational sectors persist in dissimilarities in the context of interests across various cultures and historical circumstances [17]. Therefore, this study provides one of the functional performance outcomes of social attainment following the different cultural issues [32]. Constructs and hypotheses are combined to explore the learning factors (interactive and self-regulated learning) and present a correlation between implementation and performance outcomes in educational settings [39].
H1. 
Students engaging with the technology significantly affect their academic performance and satisfaction.
H2. 
Students engaging with the technology significantly influence their functional performance.

1.2. Learning Factors: Interactive and Self-Regulated Learning

Several factors influence a student’s learning like movement, repetition, feedback, stress, and emotions. Novel developments have occurred in recent years via digital learning, but typical issues always plod on. For instance, the attenuation rate of online learning is 75% [40]. Since researchers have recommended a clear motivation, they showed that students’ satisfaction and academic performance reflect perseverance [41]. With this understanding, a student engaging in/using technology receives satisfaction and achieves a successful outcome as a lower drop-out ratio via interactive and self-regulated learning [42]. As a result, self-regulated and interactive learning are reasonable in computation, which is a simple and effective way to improve perseverance. Therefore,
H3. 
Self-regulated learning has a significant direct effect on students’ academic performance and satisfaction.
H4. 
Self-regulated learning has a significant direct influence on students’ functional performance.
H5. 
Interactive learning directly affects students’ satisfaction, academic and functional performance.

1.3. Students Engaging in Technology via Interactive and Self-Regulated Learning

According to the contradictory situation, the authors indicated that technology relies on learning factors to convey communication and content [43,44]. While adhering to the impact of technology might have been neglected. In this regard, the investigation covered the theoretical gap entitled “How user-interface interaction affects the intention to accomplish a task” [45], wherein the authors claimed that learners who interact with the technology are expected to assist or impede other interactions. Similarly, researchers urged toward software for handling interaction affected satisfaction, student-to-student interaction, learning outcome, and academic achievement. However, researchers discovered that the factors such as support and availability prophesied education attainment via self-regulated learning [46]. Therefore, we posit that students engaging in technology influence their performances via composite learning factors such as self-regulated and interactive learning [47].
H6. 
Students engaging in technology via self-regulated learning significantly affect academic performance.
H7. 
Students engaging in technology via self-regulated learning contributed positively and significantly to satisfaction and functional performance.
H8. 
Students engaging in technology via interactive learning contributed significantly to satisfaction, academic and functional performance.
It is noted that the interface is a mediating factor in the mainstream educational settings among all the interactions [48]. Further, it is also indicated that some interactions rely on students’ ability to engage with technology. Therefore, we infer that interactive and self-regulated learning mediates between technology and student satisfaction, academic, functional performance.
H9. 
Self-regulated learning has a positive and significant mediating role between technology and satisfaction, academic performance, and functional performance.
H10. 
Interactive learning has a positive and significant mediating role between technology and satisfaction, academic performance, and functional performance.
The rest of the paper is organized as follows: First, we illustrate the hypothesized model and its validation in an isolated structure model and direct and indirect relations among constructs. Second, we present the discussion according to existing works, limitations, and future works of the current study. Finally, concluding remarks are imparted.

2. Research Model and Methodology

Hypothesized model of this study is presented in Figure 1. Technology engagement plays an independent variable, where mediating factors (interactive and self-regulated learning) mediate the relations between independent and dependent variables (academic performance, functional performance, and students’ satisfaction).

2.1. Sample Selection and Data Analysis

The targeted respondents in this research are included across different countries/continents, thus validating MI within-study; students from China and Pakistan are considered country-wise. At the same time, the rest of the respondents are categorized continent-wise (see Figure 2a). Since the selection of respondents was not biased to a country/continent; therefore, we prefer to include responses from different cultural and geographical backgrounds. The respondents received diverse responses, and we collected a sample size of 302 based on probability-based sampling formula using a margin of error (5%) and a confidence interval of 95%. Demographically, 51.66 were female and 48.34 male, where the age of respondents was categorized in different levels (see Figure 2b). The data was collected through a structured questionnaire (see Supplementary Materials for a questionnaire sample). The respondents’ information, who participated in this research, such as educational background and field of interest, is shown in Figure 3a,b), respectively.

2.2. Measures

Technology engagement contains composite measures, such as that first phase of items, and we analyzed the student learning expertise in digital learning with technology engagement [23]. The essence of computer and technology engagement via self-efficacy, academic/work expectancy, and behavioral intention is assumed as learners’ perception. It shows that assessment related to technology engagement with self-regulated and interactive learning appeared to be an adequate support when forming the learner’s ability. We refer to the investigation, which indicated that learning factors via eLearning events need comprehensive learning with technology to predict academic performance [21].
Similarly, the authors indicated that student perception through interactive learning is based on the expectancy-value theory that stimulates the student’s academic performance and satisfaction [49]. Consequently, we used 14 items in our present structured questionnaires (somewhat revised with the previous research [49]) that were previously tested and validated using technology-based learning for higher education [50]. On the other hand, the remaining 15 items are related to academic performance (6 items), satisfaction (5 items), and functional performance (4 items), respectively.

2.3. Descriptive Statistics

Descriptive statistics of the total sample (see Table 1) present the mean value, standard deviation (S.D), and normality of the constructs. Interactive learning has the highest mean value, while functional performance has the lowest. Similarly, interactive learning has the highest S.D, while functional performance has the lowest. The mean value of interactive learning and functional performance is low due to the respondents included in the sample data associated with high/low socio-economic countries (i.e., Asian, African, and American countries). The skewness measures the degree of lopsidedness in the frequency distribution. In contrast, kurtosis measures the degree of tailedness in the frequency distribution. The data used in this study are standard, as all factors have their skewness, and kurtosis values are lower than ±2, as suggested in existing literature [51].

2.4. Common Method Bias (CMB)

In the cross-sectional data, CMB impacts the performances [52]. We performed Harmon’s one-factor test to analyze the problem of CMB. We retrieved six factors with eigenvalues greater than 1. The first factor was examined at only 26.71% variance, less than 50%. Therefore, it is confirmed that there is no issue with CMB in the data.

2.5. Confirmatory Factor Analysis (CFA)

CFA is performed (see Figure 4) to check the items’ validity, reliability, and loadings. The values in CFA are tested following the model fitness using estimated values as suggested by [53,54]. Such that CMIN/DF is 2.049, which is less than 3. GFI = 0.90, AGFI = 0.87, NFI = 0.90 and TLI = 0.94 are in the acceptable range and show satisfactory model fit. RMR = 0.011 and RMSEA =0.055 provided satisfactory values are less than 0.08.

2.6. Model Validity and Reliability

We considered Average Variance Extracted and Composite Reliability (CR) to evaluate the model validity and reliability. A measure has a good quality in survey research, and one sign of quality is the internal consistency of items. Internal consistency is how the individual items constitute a test that correlates with one another or the total. Reliability is computed using Cronbach’s Alpha [55], CR and AVE [56] as follows:
A V E j = i = 1 k λ i j 2 i = 1 k λ i j 2 + i = 1 k ε i j
C R = ( i = 0 k λ i j 2 ) 2 ( i = 0 k λ i j 2 ) 2 + i = j k ε i j
Table 2 shows convergent validity, discriminant validity, and reliability. All the items are significantly loaded (p < 0.01) with their respective factors, as shown in the column “Estimates” on the left side. Convergent validity obtained satisfactory values (above 0.50) as suggested by [53,54]. Discriminant validity (also known as √AVE) retrieved fair values (above 0.70) for all the items [56]. Composite reliability (CR) also assures the internal consistency of the factors as these factors contain CR values above 0.70 [54]. In addition, Cronbach α provided an acceptable range of values above 0.70 [54].

2.7. Correlation

We performed the Pearson correlation (see Table 3) in SPSS v.21 to test the relations between the variables. We found a significant relation of technology engagement with self-regulated learning (r = 0.226, p < 0.05), with interactive learning (r = 0.292, p < 0.05), with academic performance (r = 0.451, p < 0.05), and with satisfaction (r = 0.217, p < 0.05). However, technology engagement is negatively related to functional performance (r = −0.08, p > 0.05), whereas self-regulated learning has significant relationship with interactive learning (r = 0.659, p < 0.05), academic performance (r = 0.308, p < 0.05), satisfaction (r = 0.218, p < 0.05) and functional performance (r = 0.119, p < 0.05). Similarly, interactive learning has significant relationship with academic performance (r = 0.351, p < 0.05), satisfaction (r = 0.320, p < 0.05), and functional performance (r = 0.211, p < 0.05).

2.8. Structural Models

We first established the direct relations in a separate structural model to express the outcome and exploration of technology engagement via self-regulated and interactive learning. Structural model 1 (see Figure 5a) depicts hypothesis testing via direct relation of technology engagement significantly affects satisfaction and academic performance. In addition, performance has an outcome on academic performance and satisfaction (see Table 4; Structural Model 1), such as (β = 0.199 p < 0.05), (β = 0.393, p < 0.05), which fully supported H1, respectively. Conversely, technology engagement does not significantly affect functional performance, which has not supported H2. Structure model 2 (see Figure 5b) shows that self-regulated learning also significantly influences satisfaction and academic performance. The performance outcome of self-regulated learning (see Table 4; Structural Model 2) on satisfaction (β = 0.187, p < 0.05), and academic performance (β = 0.248, p < 0.05), which fully supported H3, respectively. However, self-regulated learning has not significantly influenced functional performance, not supporting H4.
Similarly, direct relation of interactive learning has significant effect on satisfaction, academic performance, and functional performance as shown in structural model 3 (see Figure 6a). The performance outcome of interactive learning (see Table 4; Structural Model 3) on satisfaction (β = 0.272, p < 0.05), academic performance (β = 0.172, p < 0.05), and functional performance (β = 0.283, p < 0.05), which fully supported H5, respectively.
Structural models 4 and 5 (see Figure 6b and Figure 7a) shows that student having direct relation to technology engagement via self-regulated and interactive learning contributed positively to satisfaction, academic, and functional performance. In particular, result performances (see Table 5; Structure Model 4) indicated that technology engagement via self-regulated learning has a significant influence only on academic performance (β = 0.177, p < 0.05), which fully supported H6. Technology engagement via self-regulated learning has positively contributed to satisfaction (β = 0.154) and functional performance (β = 0.109), partially supporting H7. In contrast, result performances of technology engagement via interactive learning (see Table 5; Structure Model 5) found significant influence on satisfaction (β = 0.238, p < 0.05), academic performance (β = 0.194, p < 0.05), and functional performance (β = 0.188, p < 0.05), which fully supported H8.
Structural Model 6 (see Figure 7b) shows the mediating role of self-regulated and interactive learning between technology engagement and student performance outcome (i.e., satisfaction, academic and functional performance). The result performances (see Table 6) present the direct and indirect effect of technology engagement via self-regulated learning on satisfaction (β = 0.006, p > 0.05), academic performance (β = 0.110, p < 0.05), functional performance (β = −0.020, p > 0.05), which has partially supported H9. In contrast, the direct and indirect effect of technology engagement via interactive learning on satisfaction, academic, and functional performance is significant, such as (β = 0.273, p < 0.05), (β = 0.168, p < 0.05), and (β = 0.253, p < 0.05), respectively, which fully supported H10.

3. Discussion

The proposed research investigates the use of technology with the mediating role of interactive and self-regulated learning that sustains satisfaction, academic and functional performance. The performances are validated in student outcomes, affirming academic and social attainment retention. Previous studies were restricted to a single learning factor (such as mLearning/self-regulated learning/eLearning), which is not adequate for students in higher education [46]. However, it was concluded that sole emphasis on technology usage is misleading [42]. Our primitive concern was to mediate the relation of technology engagement via digital learning. Technology engagement via self-regulated and interactive learning as mediators generates different performance features: (a) between technology engagement and satisfaction, (b) between technology engagement and academic performance, and (c) between technology engagement and functional performance.
Moreover, our purpose was to investigate such mediators with existing technology resources to complete a student’s degree/course. However, existing works focused less on technology, and psychological learning factors were prioritized, rendering mere acceptance of technology. For instance, research followed TAM and UTAUT models and focused on eLearning only [49]. Additionally, a study introduced a scale for measuring the distance between students and learning technology by focusing merely on online distance learning [5]. A study prejudiced that students emphasize eLearning tools canvas, Blackboard, and WebCT [17]. Furthermore, a recent study also conflicted with the idea, and it transpired that the sole focus of technology via a learning factor is misleading [42]. Consequently, we confirmed the belief that students with more than one learning factor in educational sectors can enhance their learning abilities and improve successful outcomes [57,58,59].
In response to research questions RQ 1 and 2, which evolve three main contributions in comparison to intellectualizing technology engagement with learning factors of digital learning, which are as follows:
First, our study confers direct assistance to academic and social attainment from the perspective of student outcomes. This conclusion is linked with the fiction that technology engagement can establish a broader conception than characteristically implemented in digital learning [46]. The number of students endorsing engagement with technology inflicted a weak indicator of academic attainment due to insufficient learning skills [21]. Therefore, this study magnifies data samples of students from different countries/continents of higher education to validate within-study MI. Our findings suggested that composite learning factors could mediate the relationship between technology engagement and students’ performance outcomes. In other words, technology engagement itself is a sign of student motivation, and it is an inspiration rather than the usage of technology that predicts student success, as concluded in the recent works [60,61]. However, the relationship between technology engagement and satisfaction, academic performance, and functional performance are detained when the model’s inspirations exist. Hence, results signify that anticipation of technology engagement with learning factors generates a unique contribution in this study toward student success.
Second, the present study conducted an approach for technology engagement progressively in conjunction with one another, instead emphasizing a mere resource of technology engagement in isolation. Moreover, the intrinsic value of pedagogical factors is raised in educational sectors [15]. For instance, indicators such as clickers, course blogs, keypads, and discussion boards are not considered substantial in student success [43]. As a result, student involvement and ease of access to technology include social media groups for a successful outcome. Each group found significant student success indicators, including student-centric mobile apps, problem-solving using gamification, flipped classroom, conducting assignments via blogs/podcasts, analyzing reading skills via recording and playback, and visual representation [9,10,11,12,13].
Third, this research has demonstrated a deeper assessment of technology engagement adhering to its opportunities and insights. The evaluation of academic students was necessary because the focus is to increase the number of universities rather than the number of students in a university [18]. Still, the level of students’ education, ethnic group, the field of interest, and different age groups is considered in this research during data collection. The sample size has a significant estimate, which renders approximate performance outcomes for students. The performance outcome of this research presents valuable information for decision-makers to articulate sustainable strategies and tactics in educational sectors.
Overall, results following our sample evaluations suggested that students with higher education obtain higher outcomes than those with a less educational background, as reported elsewhere [47]. We added the gender differences, which affect indices of measurement significantly. Additionally, our sample data targeted from one country to another or even within the same country, depending on cities or rural areas.

Limitations and Future Research

We used cross-sectional data in the current study, which inflicted CMB and non-response bias. Researchers in this regard can use longitudinal data to overcome this problem and explore good understandings. We followed self-reported information resulting in CMB. Researchers could implement experiments in the classroom with respect to the current study to explore beneficial insights for further implications in developing countries for higher education. This research is verified in developing countries that may not give fruitful results due to their institutional arrangement. Therefore, researchers from developing/developed countries in the prospect of policymakers are encouraged to test the model in different environmental settings. Moreover, this research is limited to mediating the role of self-regulated and interactive learning between technology engagement and student performance factors. However, other learning factors of digital learning such as adaptive learning, mobile learning, eLearning and blended learning, and technological capabilities can be tested as mediators.

4. Conclusions

This research is conducted to assess students’ academic satisfaction and functional performances. Indeed, the impact of technology via self-regulated and interactive learning has revived little attention in education and social attainment. Our research overcame the gap by observing the intervening role of self-regulated and interactive learning. The performance features are associated with academic performance, and students engaging significantly in face-to-face education or technologies necessarily reflect the cultural environment in which they are socialized. Personal, social, and cultural stories shape students’ engagement. The curricula, learning activities, and technological means used to stimulate student engagement are presented in social, religious, and cultural contexts that define acceptable and valued arguments. In this research, these groups in the structured questionnaire seek success by participating in activities that develop the skills and dispositions necessary to excel in the cultural and social environment.
Additionally, academic commitment and success are described in one cultural and social environment that may differ from one another. Still, a commitment to learning is complex when viewed through socio-cultural lenses. Interactive/self-regulated learning, and mainly construct (i.e., technology engagement), is empathetic and subject to variation, even depending on the age of development.
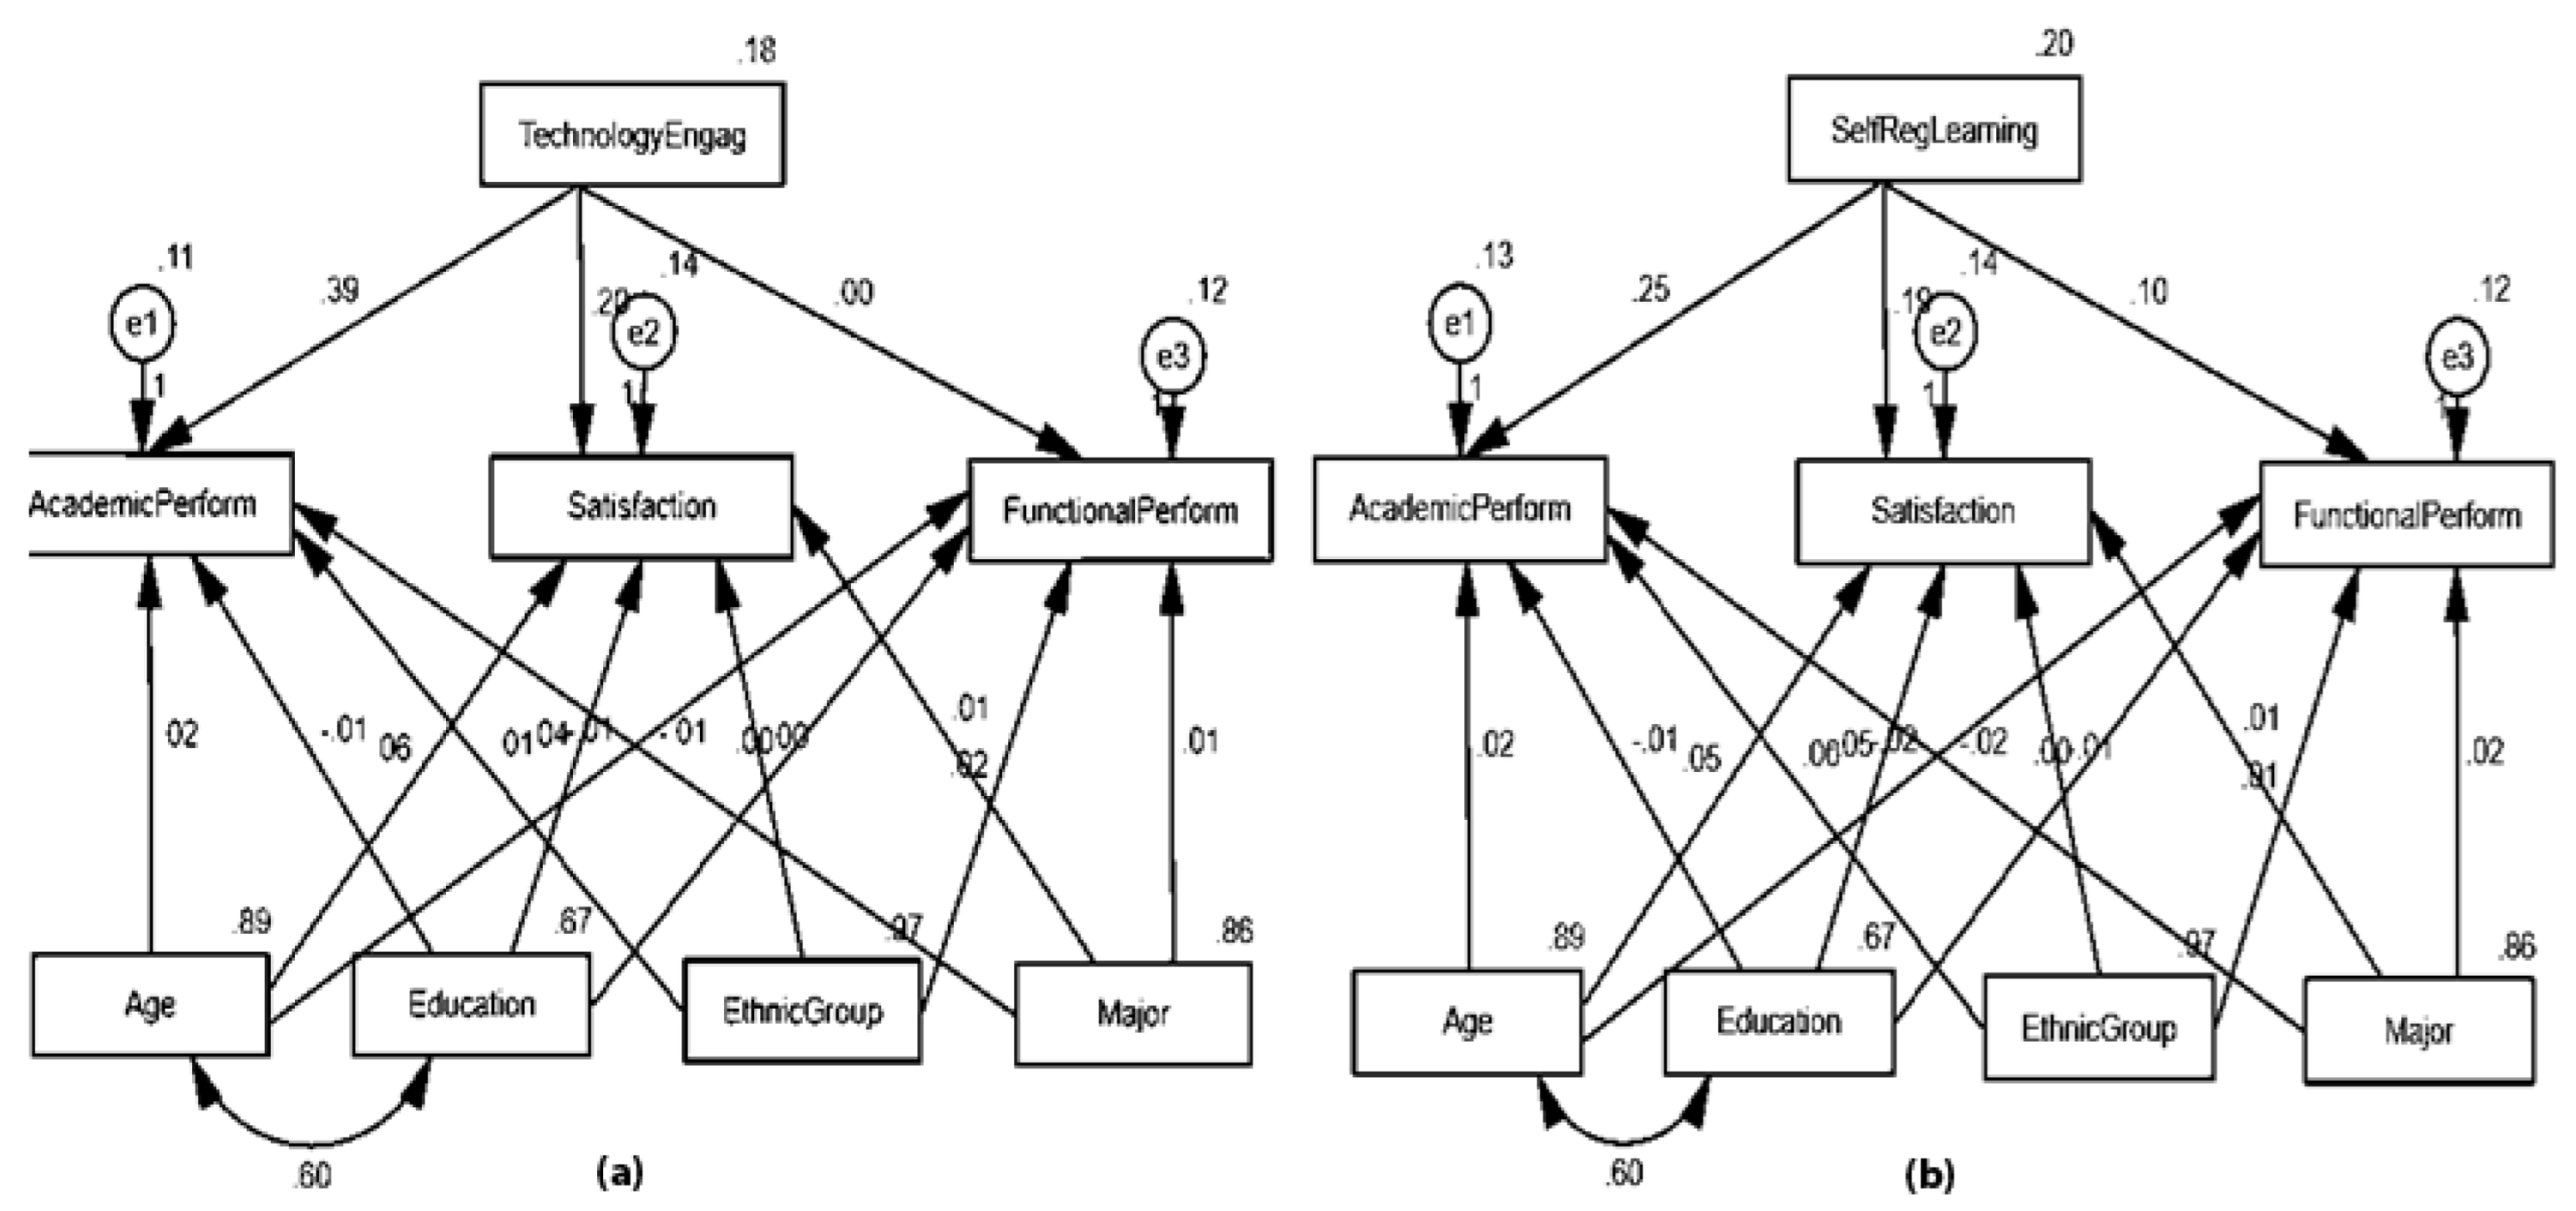
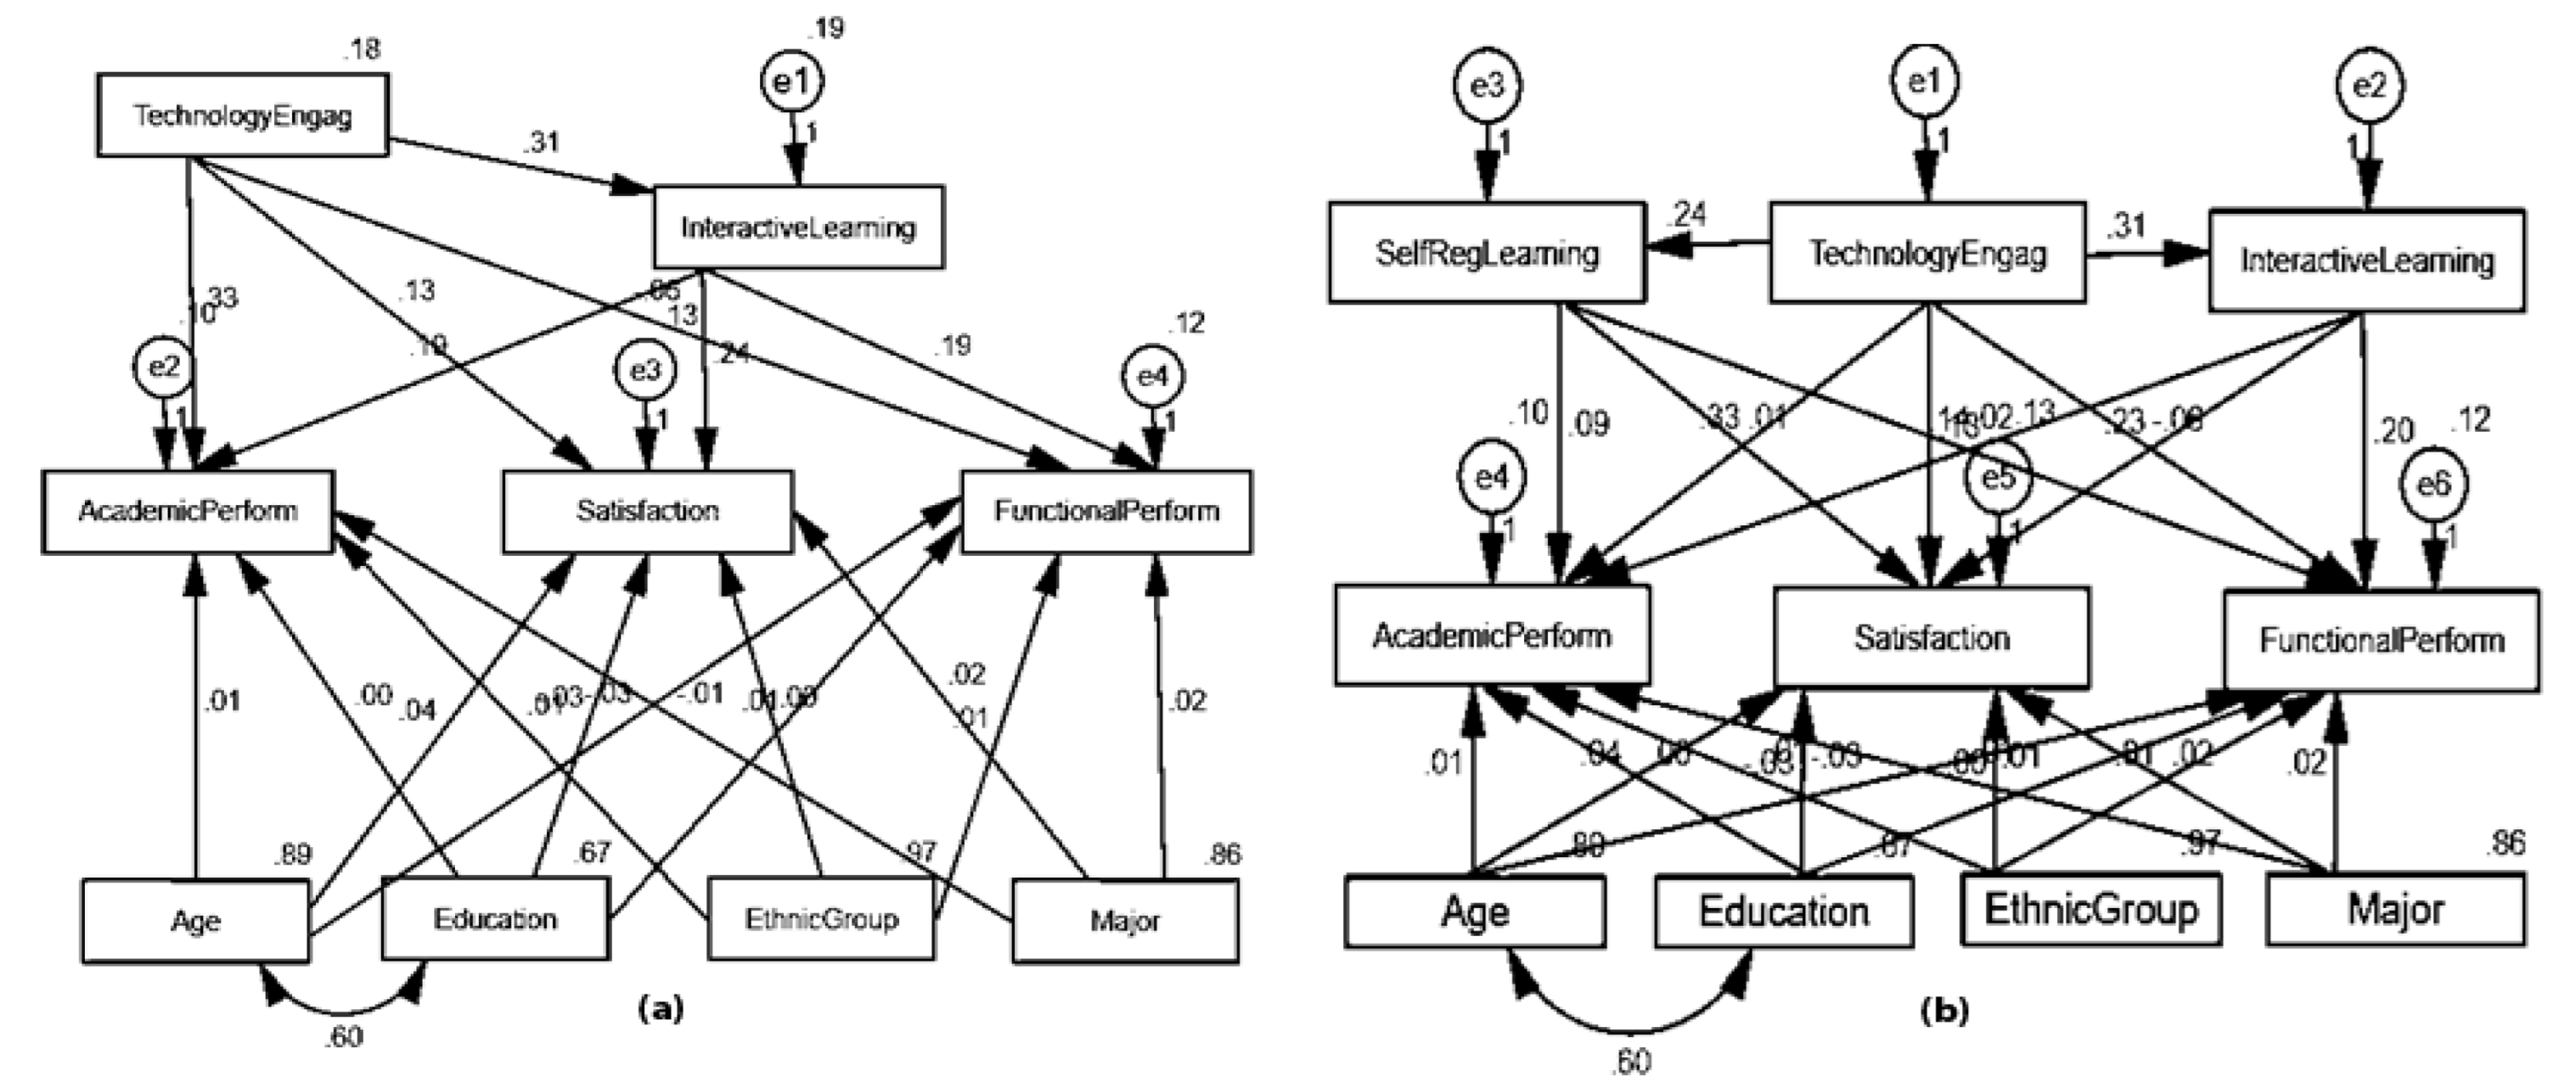
Experimental validation of our model was verified using structured questionnaires from 302 respondents from different universities in developing countries. Hypotheses were tested in AMOS using structural equation modeling and analysis performed in SPSS (v.21). First, we empirically validated the primary model validated. Later, we established the direct and indirect relations in the isolated structural model, such that the hypothesis was found significant while H2 and H4 were not significant. Our findings suggest that sufficient technology resources could expressively contribute to satisfaction and academic performance, but significantly affect functional performance. At the same time, educational sectors were found informal with students’ functional performance via interactive and self-regulated learning.
The present research validated the performances in terms of student outcome, which affirm the retention of academic and social attainment. It was concluded that sole emphasis on technology usage is misleading. Our primitive concern was to mediate the relation of technology engagement via digital learning. Consequently, technology engagement via self-regulated and interactive learning as mediators generates performances: (a) between technology engagement and satisfaction, (b) between technology engagement and academic performance, and (c) between technology engagement and functional performance. Our research also suggests practitioners and administrators emphasize students’ engagement with the technology effectively by dint of learning factors in digital learning.

Supplementary Materials

The following supporting information can be downloaded at: https://www.mdpi.com/article/10.3390/su14127226/s1, questionnaire sample.

Author Contributions

Conceptualization, M.Q.M. and Y.L.; methodology, M.Q.M., P.M. and A.M.; software, M.Q.M.; validation, A.M., M.Q.M. and Y.L.; formal analysis, Y.L., A.R.M., P.M. and S.F.A.S.; investigation, M.Q.M. and Y.L.; resources, Y.L.; data curation, A.M.; writing—original draft preparation, M.Q.M.; writing—review and editing, M.Q.M., A.R.M. and S.F.A.S.; visualization, P.M.; supervision, Y.L.; project administration, Y.L.; funding acquisition, Y.L. All authors have read and agreed to the published version of the manuscript.

Funding

Open Project of the State Key Laboratory of Cognitive Intelligence (No. iED2021-M007), and Fundamental Research Funds for the Central Universities.

Institutional Review Board Statement

Not applicable.

Informed Consent Statement

Not applicable.

Data Availability Statement

Not applicable.

Acknowledgments

The work in this paper is supported by Open Project of the State Key Laboratory of Cognitive Intelligence (No. iED2021-M007), and Fundamental Research Funds for the Central Universities.

Conflicts of Interest

The authors declare no conflict of interest.

References

  1. Blundell, C.N.; Lee, K.-T.; Nykvist, S. Digital Learning in Schools: Conceptualizing the Challenges and Influences on Teacher s. Practice. J. Inf. Technol. Educ. Res. 2016, 15, 535–560. [Google Scholar] [CrossRef] [Green Version]
  2. Gemmill, L.E.; Peterson, M.J. Technology use among college students: Implications for student affairs professionals. NASPA J. 2006, 43, 280–300. [Google Scholar] [CrossRef] [Green Version]
  3. Chukwuedo, S.O.; Ogbuanya, T.C. Potential pathways for proficiency training in computer maintenance technology among prospective electronic technology education graduates. Educ. Train. 2020, 62, 100–115. [Google Scholar] [CrossRef]
  4. Cropley, A. Creativity-focused Technology Education in the Age of Industry 4.0. Creativity Res. J. 2020, 32, 184–191. [Google Scholar] [CrossRef]
  5. Hamada, M.; Hassan, M. Science, An Interactive Learning Environment for Information and Communication Theory. Eurasia J. Math. Sci. Technol. Educ. 2017, 13, 35–59. [Google Scholar]
  6. Wang, S.; Claire, C.; Wei, C.; Richard, T.; Louise, Y.; Linda, S.; Feng, M. When adaptive learning is effective learning: Comparison of an adaptive learning system to teacher-led instruction. Interact. Learn. Environ. 2020, 1–11. [Google Scholar] [CrossRef]
  7. Wong, J.; Martine, B.; Dan, D.; Tim, V.D.Z.; Geert-Jan, H.; Fred, P. Supporting self-regulated learning in online learning environments and MOOCs: A systematic review. Int. J. Hum. Comput. Interact. 2019, 35, 356–373. [Google Scholar] [CrossRef]
  8. Nichols, M. A theory for eLearning. J. Educ. Technol. Soc. 2003, 6, 1–10. [Google Scholar]
  9. Sarrab, M.; Laila, E.; Hamza, A. Mobile learning (m-learning) and educational environments. Int. J. Distrib. Parallel Syst. 2012, 3, 31. [Google Scholar] [CrossRef]
  10. Minka, T.; Picard, R. Interactive learning with a “Society of Models”. Pattern Recognit. 1997, 30, 565–581. [Google Scholar] [CrossRef]
  11. Hamari, J. Do badges increase user activity? A field experiment on the effects of gamification. Comput. Hum. Behav. 2017, 71, 469–478. [Google Scholar] [CrossRef]
  12. Graham, C.R. Blended learning systems. In The handbook of Blended Learning: Global Perspectives, Local Designs, 1; John Wiley & Sons: Hoboken, NJ, USA, 2006; pp. 3–21. [Google Scholar]
  13. Jamei, E.; Mortimer, M.; Seyedmahmoudian, M.; Horan, B.; Stojcevski, A. Investigating the Role of Virtual Reality in Planning for Sustainable Smart Cities. Sustainability 2017, 9, 2006. [Google Scholar] [CrossRef] [Green Version]
  14. Ejdys, J.; Halicka, K. Sustainable Adaptation of New Technology—The Case of Humanoids Used for the Care of Older Adults. Sustainability 2018, 10, 3770. [Google Scholar] [CrossRef] [Green Version]
  15. Smith, J.F.; Skrbiš, Z. A social inequality of motivation? The relationship between beliefs about academic success and young people’s educational attainment. Br. Educ. Res. J. 2017, 43, 441–465. [Google Scholar] [CrossRef]
  16. Mun, Y.Y.; Hwang, Y. Predicting the use of web-based information systems: Self-efficacy, enjoyment, learning goal orientation, and the technology acceptance model. Int. J. Hum.-Comput. Stud. 2003, 59, 431–449. [Google Scholar]
  17. Schneberger, S.; Amoroso, D.L.; Durfee, A. Factors that influence the performance of computer-based assessments: An extension of the technology acceptance model. J. Comput. Inf. Syst. 2008, 48, 74–90. [Google Scholar]
  18. Navarro, O.; Sanchez-Verdejo, F.J.; Anguita, J.M.; Gonzalez, A.L. Motivation of University Students Towards the Use of Information and Communication Technologies and Their Relation to Learning Styles. Int. J. Emerg. Technol. Learn. 2020, 15, 202–218. [Google Scholar] [CrossRef]
  19. Michailidis, N.; Kapravelos, E.; Tsiatsos, T. Interaction Analysis for Supporting Students’ Self-Regulation during Blog-based CSCL Activities. J. Educ. Technol. Soc. 2018, 21, 37–47. [Google Scholar]
  20. Weidlich, J.; Bastiaens, T.J. Technology Matters—The Impact of Transactional Distance on Satisfaction in Online Distance Learning. Int. Rev. Res. Open Distrib. Learn. 2018, 19. [Google Scholar] [CrossRef]
  21. Pardo, A.; Han, F.; Ellis, R.A. Combining University Student Self-Regulated Learning Indicators and Engagement with Online Learning Events to Predict Academic Performance. IEEE Trans. Learn. Technol. 2016, 10, 82–92. [Google Scholar] [CrossRef]
  22. Millsap, R.E.; Kwok, O.-M. Evaluating the Impact of Partial Factorial Invariance on Selection in Two Populations. Psychol. Methods 2004, 9, 93–115. [Google Scholar] [CrossRef] [PubMed]
  23. Parameswaran, S.; Kishore, R.; Li, P. Within-study measurement invariance of the UTAUT instrument: An assessment with user technology engagement variables. Inf. Manag. 2015, 52, 317–336. [Google Scholar] [CrossRef]
  24. Onwuegbuzie, A.; Collins, K. A Typology of Mixed Methods Sampling Designs in Social Science Research. Qual. Rep. 2015, 12, 281–316. [Google Scholar] [CrossRef]
  25. Rast, P.; Zimprich, D.; Van Boxtel, M.; Jolles, J. Factor Structure and Measurement Invariance of the Cognitive Failures Questionnaire Across the Adult Life Span. Assessment 2009, 16, 145–158. [Google Scholar] [CrossRef] [Green Version]
  26. Plott, A.R. Web 2.0 in Blackboard learn: Mind the template. In Proceedings of the 38th Annual ACM SIGUCCS Fall Conference: Navigation and discovery, Norfolk, VA, USA, 24–27 October 2010; pp. 285–286. [Google Scholar]
  27. Yakubu, N.M.; Dasuki, S.I.J. Factors affecting the adoption of e-learning technologies among higher education students in Nigeria: A structural equation modelling approach. Inf. Dev. 2019, 35, 492–502. [Google Scholar] [CrossRef]
  28. Kuh, G.D. What We’re Learning About Student Engagement From NSSE: Benchmarks for Effective Educational Practices. Chang. Mag. High. Learn. 2003, 35, 24–32. [Google Scholar] [CrossRef]
  29. Herrman, J.W. Keeping Their Attention: Innovative Strategies for Nursing Education. J. Contin. Educ. Nurs. 2011, 42, 449–456. [Google Scholar] [CrossRef]
  30. Elliott, K.M.; Shin, D. Student Satisfaction: An alternative approach to assessing this important concept. J. High. Educ. Policy Manag. 2002, 24, 197–209. [Google Scholar] [CrossRef]
  31. Farooq, M.S.; Chaudhry, A.H.; Shafiq, M.; Berhanu, G. Factors affecting students’ quality of academic performance: A case of secondary school level. J. Qual. Technol. Manag. 2011, 7, 1–14. [Google Scholar]
  32. McCoy, S.W.; Effgen, S.K.; Chiarello, L.A.; Jeffries, L.M.; Tezanos, A.V. School-based physical therapy services and student functional performance at school. Dev. Med. Child Neurol. 2018, 60, 1140–1148. [Google Scholar] [CrossRef]
  33. Harris, K.R.; Graham, S. Programmatic Intervention Research: Illustrations from the Evolution of Self-Regulated Strategy Development. Learn. Disabil. Q. 1999, 22, 251–262. [Google Scholar] [CrossRef]
  34. Beck, C.A.; Campbell, M. Interactive learning in a multicultural setting. Christ. Educ. J. 2006, 3, 101–118. [Google Scholar] [CrossRef]
  35. Davis, F.J. Perceived Usefulness, Perceived Ease of Use and Acceptance of Information Technology. MIS Q. 1989, 13, 319. [Google Scholar] [CrossRef] [Green Version]
  36. Seck, A. International technology diffusion and economic growth: Explaining the spillover benefits to developing countries. Struct. Chang. Econ. Dyn. 2012, 23, 437–451. [Google Scholar] [CrossRef]
  37. Cooper, R.N.; Perez, C. Technological Revolutions and Financial Capital: The Dynamics of Bubbles and Golden Ages. Foreign Aff. 2003, 82, 148. [Google Scholar] [CrossRef]
  38. Broadbent, J. Comparing online and blended learner’s self-regulated learning strategies and academic performance. Internet High. Educ. 2017, 33, 24–32. [Google Scholar] [CrossRef]
  39. Loeffler, S.N.; Bohner, A.; Stumpp, J.; Limberger, M.F.; Gidion, G. Investigating and fostering self-regulated learning in higher education using interactive ambulatory assessment. Learn. Individ. Differ. 2019, 71, 43–57. [Google Scholar] [CrossRef]
  40. Croxton, R.A. The role of interactivity in student satisfaction and persistence in online learning. J. Online Learn. Teach. 2014, 10, 314. [Google Scholar]
  41. Chavoshi, A.; Hamidi, H. Social, individual, technological and pedagogical factors influencing mobile learning acceptance in higher education: A case from Iran. Telematics Informatics 2019, 38, 133–165. [Google Scholar] [CrossRef]
  42. Dunn, T.; Kennedy, M. Technology Enhanced Learning in higher education; motivations, engagement and academic achievement. Comput. Educ. 2019, 137, 104–113. [Google Scholar] [CrossRef]
  43. Edmondson, A.C.; Winslow, A.B.; Bohmer, R.M.J.; Pisano, G.P. Learning How and Learning What: Effects of Tacit and Codified Knowledge on Performance Improvement Following Technology Adoption. Decis. Sci. 2003, 34, 197–224. [Google Scholar] [CrossRef]
  44. Tsai, T.-H.; Chang, H.-T.; Chen, Y.-J.; Chang, Y.-S. Determinants of user acceptance of a specific social platform for older adults: An empirical examination of user interface characteristics and behavioral intention. PLoS ONE 2017, 12, e0180102. [Google Scholar] [CrossRef] [PubMed] [Green Version]
  45. Raman, A.; Thannimalai, R. Importance of Technology Leadership for Technology Integration: Gender and Professional Development Perspective. SAGE Open 2019, 9, 2158244019893707. [Google Scholar] [CrossRef]
  46. Kuo, Y.-C.; Walker, A.E.; Schroder, K.E.; Belland, B.R. Interaction, Internet self-efficacy, and self-regulated learning as predictors of student satisfaction in online education courses. Internet High. Educ. 2014, 20, 35–50. [Google Scholar] [CrossRef]
  47. Li, S.; Yamaguchi, S.; Takada, J.-I. The Influence of Interactive Learning Materials on Self-Regulated Learning and Learning Satisfaction of Primary School Teachers in Mongolia. Sustainability 2018, 10, 1093. [Google Scholar] [CrossRef] [Green Version]
  48. Hillman, C.D.; Willis, D.J.; Gunawardena, C.N.J. Learner-interface interaction in distance education: An extension of medicontemporary models and strategies for practitioners. Am. J. Distance Educ. 1994, 8, 30–42. [Google Scholar] [CrossRef]
  49. Cooper, K.; Ashley, M.; Brownell, S.E. Using Expectancy Value Theory as a Framework to Reduce Student Resistance to Active Learning: A Proof of Concept. J. Microbiol. Biol. Educ. 2017, 18. [Google Scholar] [CrossRef] [Green Version]
  50. Doménech-Betoret, F.; Abellán-Roselló, L.; Gómez-Artiga, A. Self-Efficacy, Satisfaction, and Academic Achievement: The Mediator Role of Students’ Expectancy-Value Beliefs. Front. Psychol. 2017, 8, 1193. [Google Scholar] [CrossRef]
  51. George, D. SPSS for Windows Step by Step: A Simple Study Guide and Reference, 17.0 Update, 10/e; Pearson Education India: Noida, India, 2011. [Google Scholar]
  52. Podsakoff, P.M.; Organ, D.W. Self-Reports in Organizational Research: Problems and Prospects. J. Manag. 1986, 12, 531–544. [Google Scholar] [CrossRef]
  53. Kline, R.B. Principles and Practice of Structural Equation Modeling, 4th ed.; The Guilford Press: New York, NY, USA, 2011. [Google Scholar]
  54. Memon, A.; An, Z.Y.; Memon, M.Q. Does financial availability sustain financial, innovative, and environmental performance? Relation via opportunity recognition. Corp. Soc. Responsib. Environ. Manag. 2019, 27, 562–575. [Google Scholar] [CrossRef]
  55. Cronbach, L.J. Coefficient alpha and the internal structure of tests. Psychometrika 1951, 16, 297–334. [Google Scholar] [CrossRef] [Green Version]
  56. Fornell, C.; Larcker, D.F.J. Evaluating structural equation models with unobservable variables and measurement error. J. Mark. Res. 1981, 18, 39–50. [Google Scholar] [CrossRef]
  57. Kashada, A.; Li, H.; Koshadah, O. Analysis Approach to Identify Factors Influencing Digital Learning Technology Adoption and Utilization in Developing Countries. Int. J. Emerg. Technol. Learn. 2018, 13, 48–59. [Google Scholar] [CrossRef] [Green Version]
  58. Shukla, T.; Pilani, I.B.; Dosaya, D.; Nirban, V.S.; Vavilala, M.P. Factors Extraction of Effective Teaching-Learning in Online and Conventional Classrooms. Int. J. Inf. Educ. Technol. 2020, 10, 422–427. [Google Scholar] [CrossRef]
  59. Hamidi, H.; Jahanshaheefard, M. Essential factors for the application of education information system using mobile learning: A case study of students of the university of technology. Telemat. Inform. 2019, 38, 207–224. [Google Scholar] [CrossRef]
  60. Henrie, C.R.; Halverson, L.; Graham, C. Measuring student engagement in technology-mediated learning: A review. Comput. Educ. 2015, 90, 36–53. [Google Scholar] [CrossRef]
  61. Domina, T.; Renzulli, L.; Murray, B.; Garza, A.N.; Perez, L. Remote or Removed: Predicting Successful Engagement with Online Learning during COVID-19. Socius: Sociol. Res. a Dyn. World 2021, 7, 2378023120988200. [Google Scholar] [CrossRef]
Figure 1. Hypothesized model.
Sustainability 14 07226 g001
Figure 2. (a) Respondents from different Ethnic groups, and (b) age of respondents.
Sustainability 14 07226 g002
Figure 3. (a) Education background of respondents, and (b) field of interest of respondents.
Sustainability 14 07226 g003
Figure 4. Measurement model.
Sustainability 14 07226 g004
Figure 5. (a) Hypothesis testing: direct effects of technology engagement, and (b) hypothesis testing: directs effects of self-regulated learning.
Sustainability 14 07226 g005
Figure 6. (a) Hypothesis testing: direct effects of interactive learning, and (b) hypothesis testing: indirect effects of technology engagement via self-regulated learning.
Sustainability 14 07226 g006
Figure 7. (a) Hypothesis testing: indirect effects of technology engagement via interactive learning, and (b) hypothesis testing: direct and indirect effects of technology engagement via self-regulated and interactive learning.
Sustainability 14 07226 g007
Table 1. Descriptive statistic.
NMinimumMaximumMeanStandard DeviationSkewnessKurtosis
TechnologyEngag3023.005.003.52760.423750.188−0.198
SelfRegLearning3023.005.003.64640.44792−0.134−0.182
InteractiveLearning3023.005.003.68540.453050.0570.125
AcademicPerform3023.005.003.16210.37378−0.0681.602
Satisfaction3023.004.003.15300.391100.197−1.546
FunctionalPerform3023.004.003.140.35291−1.3250.199
Table 2. Standardized factor loading, validity, and reliability.
Variables and ItemsEstimatesSum of Squared Loadings ()AVE√AVECRCronbach α
te1<---TechEngag0.801 ***3.5340.5890.7670.8950.899
te2<---TechEngag0.675 ***
te3<---TechEngag0.864 ***
te4<---TechEngag0.707 ***
te5<---TechEngag0.731 ***
te6<---TechEngag0.81 ***
srl1<---SelfRegLearn0.696 ***3.160.6320.7950.8950.908
srl2<---SelfRegLearn0.827 ***
srl3<---SelfRegLearn0.845 ***
srl4<---SelfRegLearn0.849 ***
srl5<---SelfRegLearn0.745 ***
il1<---InterLearn0.89 ***2.0210.6740.8210.8590.844
il2<---InterLearn0.65 ***
il3<---InterLearn0.898 ***
ap1<---AcadPerform0.69 ***3.2080.5340.7310.8730.877
ap2<---AcadPerform0.809 ***
ap3<---AcadPerform0.725 ***
ap4<---AcadPerform0.771 ***
ap5<---AcadPerform0.633 ***
ap6<---AcadPerform0.746 ***
sa1<---Satisfac0.57 ***2.6860.5370.7330.85070.846
sa2<---Satisfac0.739 ***
sa3<---Satisfac0.872 ***
sa4<---Satisfac0.698 ***
sa5<---Satisfac0.753 ***
fp1<---FuncPerform0.702 ***2.4180.6050.7770.8580.854
fp2<---FuncPerform0.861 ***
fp3<---FuncPerform0.683 ***
fp4<---FuncPerform0.847 ***
Note: *** p value (0.001). C.R = Composite reliability, AVE = Average variance extracted.
Table 3. Correlation coefficients.
TechnologyEngagSelfRegLearningInteractiveLearningAcademicPerformSatisfactionFunctionalPerform
TechnologyEngag1
SelfRegLearning0.226 **1
InteractiveLearning0.292 **0.659 **1
AcademicPerform0.451 **0.308 **0.351 **1
Satisfaction0.217 **0.218 **0.320 **0.0911
FunctionalPerform−0.0080.119 *0.211 **0.061−0.0371
** Correlation is significant at the 0.01 level (2-tailed); * Correlation is significant at the 0.05 level (2-tailed).
Table 4. Results performances of Structural Model 1, 2 and 3.
Structure Model 1EstimateC.R.P
Satisfaction<---Education−0.042−0.9940.320
Satisfaction<---EthnicGroup0.0020.0710.943
AcademicPerform<---Education−0.008−0.2100.833
AcademicPerform<---EthnicGroup0.0110.5440.586
AcademicPerform<---Major−0.011−0.5540.580
FunctionalPerform<---Major0.0140.6260.532
FunctionalPerform<---EthnicGroup0.0150.7470.455
Satisfaction<---Age0.0551.4890.136
FunctionalPerform<---Age−0.013−0.3790.704
Satisfaction<---Major0.0120.5180.604
FunctionalPerform<---Education−0.001−0.0230.982
AcademicPerform<---Age0.0210.6430.521
Satisfaction<---TechnologyEngag0.1993.839***
FunctionalPerform<---TechnologyEngag0.000−0.0050.996
AcademicPerform<---TechnologyEngag0.3938.687***
Structure Model 2EstimateC.R.P
Satisfaction<---Education−0.046−1.0780.281
Satisfaction<---EthnicGroup−0.007−0.2960.768
AcademicPerform<---Education−0.013−0.3240.746
AcademicPerform<---EthnicGroup−0.004−0.1920.848
AcademicPerform<---Major−0.015−0.6940.488
FunctionalPerform<---Major0.0180.8410.400
FunctionalPerform<---EthnicGroup0.0140.6890.491
Satisfaction<---Age0.0531.4380.151
FunctionalPerform<---Age−0.019−0.5480.583
Satisfaction<---Major0.0130.5500.582
FunctionalPerform<---Education−0.003−0.0680.946
AcademicPerform<---Age0.0240.6870.492
Satisfaction<---SelfRegLearning0.1873.828***
FunctionalPerform<---SelfRegLearning0.1042.3190.020
AcademicPerform<---SelfRegLearning0.2485.436***
Structure Model 3EstimateC.R.P
Satisfaction<---Education−0.028−0.6850.493
Satisfaction<---EthnicGroup−0.006−0.2770.782
AcademicPerform<---Education0.0060.1610.872
AcademicPerform<---EthnicGroup−0.003−0.1320.895
AcademicPerform<---Major−0.019−0.8720.383
FunctionalPerform<---Major0.0180.8480.396
FunctionalPerform<---EthnicGroup0.0140.7090.478
Satisfaction<---Age0.0401.0980.272
FunctionalPerform<---Age−0.028−0.8410.400
Satisfaction<---Major0.0120.5130.608
FunctionalPerform<---Education0.0080.2130.831
AcademicPerform<---Age0.0120.3640.716
Satisfaction<---InteractiveLearning0.2725.782***
FunctionalPerform<---InteractiveLearning0.1723.942***
AcademicPerform<---InteractiveLearning0.2836.367***
*** denotes the significance level for a given hypothesis test is a value for which a P-value less than or equal to is considered statistically significant. Typical values for are 0.1.
Table 5. Results performances of Structural Model 4 and 5.
Structure Model 4EstimateCRP
SelfRegLearning<---TechnologyEngag0.2394.026***
Satisfaction<---Education−0.045−1.0740.283
Satisfaction<---EthnicGroup−0.001−0.0630.950
AcademicPerform<---Education−0.011−0.3010.764
AcademicPerform<---EthnicGroup0.0070.3800.704
AcademicPerform<---Major−0.005−0.2580.797
FunctionalPerform<---Major0.0170.8090.418
FunctionalPerform<---EthnicGroup0.0130.6510.515
Satisfaction<---Age0.0481.3230.186
FunctionalPerform<---Age−0.018−0.5270.598
Satisfaction<---Major0.0180.7610.447
FunctionalPerform<---Education−0.003−0.0720.943
AcademicPerform<---Age0.0130.4080.683
Satisfaction<---TechnologyEngag0.1653.1470.002
FunctionalPerform<---TechnologyEngag−0.024−0.4990.618
AcademicPerform<---TechnologyEngag0.3547.829***
AcademicPerform<---SelfRegLearning0.1774.132***
Satisfaction<---SelfRegLearning0.1543.1180.002
FunctionalPerform<---SelfRegLearning0.1092.3660.018
Structure Model 5EstimateCRP
InteractiveLearning<---TechnologyEngag0.3135.306***
Satisfaction<---Education−0.030−0.7290.466
Satisfaction<---EthnicGroup−0.002−0.0980.922
AcademicPerform<---Education0.0020.0640.949
AcademicPerform<---EthnicGroup0.0080.4030.687
AcademicPerform<---Major−0.009−0.4340.664
FunctionalPerform<---Major0.0160.7680.442
FunctionalPerform<---EthnicGroup0.0120.6230.533
Satisfaction<---Age0.0371.0440.296
FunctionalPerform<---Age−0.027−0.8120.417
Satisfaction<---Major0.0160.6880.492
FunctionalPerform<---Education0.0090.2320.817
AcademicPerform<---Age0.0060.2000.842
Satisfaction<---TechnologyEngag0.1262.4270.015
FunctionalPerform<---TechnologyEngag−0.057−1.1690.242
AcademicPerform<---TechnologyEngag0.3347.300***
AcademicPerform<---InteractiveLearning0.1944.522***
Satisfaction<---InteractiveLearning0.2384.892***
FunctionalPerform<---InteractiveLearning0.1884.111***
*** denotes the significance level for a given hypothesis test is a value for which a P-value less than or equal to is considered statistically significant. Typical values for are 0.1.
Table 6. Direct and indirect effects of technology engagement: Structure model 6.
HypothesisDirect EffectIndirect EffectTotal Effect
SatisfactionTechnology engagement0.137 (0.019)0.081(0.000)0.218 (0.001)
Academic performanceTechnology engagement0.381 (0.001)0.074(0.000)0.455 (0.001)
Functional performanceTechnology engagement−0.068 (0.247)0.069(0.000)0.002 (0.991)
SatisfactionSelf-regulated learning0.006 (0.871)-0.006 (0.871)
Academic performanceSelf-regulated learning0.110 (0.049)-0.110 (0.049)
Functional performanceSelf-regulated learning−0.020 (0.773)-−0.020 (0.773)
Academic performanceInteractive learning0.168 (0.022)-0.168 (0.022)
SatisfactionInteractive learning0.273 (0.004)-0.273 (0.004)
Functional performanceInteractive learning0.253 (0.002)-0.253 (0.002)
Academic performanceAge0.017 (0.883)-0.017 (0.883)
SatisfactionAge0.090 (0.424)-0.090 (0.424)
Functional performanceAge−0.072 (0.411)-−0.072 (0.411)
Academic performanceEducation−0.005 (0.968)-−0.005 (0.968)
SatisfactionEducation−0.064 (0.545)-−0.064 (0.545)
Functional performanceEducation0.023 (0.771)-0.023 (0.771)
Academic performanceEthnic group0.018 (0.740)-0.018 (0.740)
SatisfactionEthnic group−0.005 (0.934)-−0.005 (0.934)
Functional performanceEthnic group0.035 (0.613)-0.035 (0.613)
Academic performanceMajor−0.016 (0.739)-−0.016 (0.739)
SatisfactionMajor0.038 (0.440)-0.038 (0.440)
Functional performanceMajor0.042 (0.515)-0.042 (0.515)
Publisher’s Note: MDPI stays neutral with regard to jurisdictional claims in published maps and institutional affiliations.

