Article

Modification of Nutrient Requirements for a Four Crop-Based Cropping System to Increase System Productivity, Maintain Soil Fertility, and Achieve Sustainable Intensification

1
Horticulture Research Centre, Bangladesh Agricultural Research Institute, Gazipur 1701, Bangladesh
2
Regional Agricultural Research Station, Bangladesh Agricultural Research Institute, Jashore 7400, Bangladesh
3
Bangladesh Agricultural Research Council, Dhaka 1215, Bangladesh
4
Land Management Group, Centre for Sustainable Farming Systems, Future Food Institute, Murdoch University, Perth, WA 6150, Australia
5
Department of Chemistry, Faculty of Science, Taif University, P.O. Box 11099, Taif 21944, Saudi Arabia
6
Department of Biology, College of Science, Taif University, P.O. Box 11099, Taif 21944, Saudi Arabia
7
International Rice Research Institute, Bangladesh Office, Dhaka 1213, Bangladesh
*
Authors to whom correspondence should be addressed.
Sustainability 2022, 14(12), 7194; https://doi.org/10.3390/su14127194
Submission received: 8 May 2022 / Revised: 3 June 2022 / Accepted: 8 June 2022 / Published: 12 June 2022

Abstract

:
Sustainable and resilient cropping intensity is now a global focus to address the food demand and nutrition security of the growing population. For sustainable intensification, maintaining soil fertility is a key concern. The nutrient management for the recently developed four crop-based cropping system in Bangladesh has not yet been studied. Hence, field experiments were conducted on the nutrient management of the four crop-based cropping system [Aus (pre-monsoon rice), Aman (monsoon rice), lentil, and mungbean] in calcareous soil in Bangladesh during the years of 2016/17 and 2017/18 to determine the appropriate fertilizer management package to improve crop productivity and sustain soil fertility. The experiment had six treatments assigned in a randomized complete block design with three replications. The treatments included T1 = control (without synthetic fertilizer), T2 = 50% recommended dose of fertilizer (RDF), T3 = 75% RDF, T4 = 100% RDF, T5 = 125% RDF, and T6 = farmers’ practice (FP). The results revealed that the 125% RDF significantly contributed to higher yields of all four crops. The rice equivalent yield (REY) was the highest for the fertilizer management of 125% RDF, which was 45.5%, 9.4%, and 12.2% higher than the control (T1), 100% RDF (T4), and FP, respectively. Considering the uptake of nutrients (N, P, K, S, Zn, and B) by the crops in the cropping system, the 125% RDF was superior to the other treatments. The nutrient management practices had a positive influence on the apparent nutrient recovery (ANR) efficiency of the cropping system. The fertilizer management of 125% RDF was also economically more profitable due to the increment in the cost–benefit ratio of 26.8%, 4.4%, and 4.9% over the control, 100% RDF, and FP, respectively. The results indicate that the current fertilizer recommendations and FP for aus, aman, lentil, and mungbean are not adequate for the change from the three crop to the four crop-based pattern, and an increased dose of fertilizer is required to increase the yield of each individual crop as well as the total system’s productivity. The fertilizer use efficiency is also higher for 125% RDF than the 100% RDF and FP indicating that to sustain the soil fertility in the four crop-based system, the current RDF and FP are not sufficient. This finding will help intensive cropping areas in preventing nutrient deficiencies that would lead to a reduction in the crop yield.

1. Introduction

The increasing cropping intensification globally has led to soil nutrient depletion and a large increase in the requirement for nutrients coming from external sources for crop production [1]. The application of fertilizers containing nutrient sources such as nitrogen (N), potassium (K), and phosphorus (P) replenishes some of the nutrients depleted by intensive cropping. However, inadequate use of fertilizers will not replenish other depleted nutrients properly and will have a negative effect on soil health and crop nutritional security [1]. The intensive cropping systems aim for yield maximization, involving the efficient use of all inputs (particularly fertilizers and plant protection chemicals, varieties of crops and livestock, and mechanization). Among the inputs, fertilizer has had a central role in increasing system productivity rapidly for more than four decades around the world [2]. In Bangladesh, in terms of food security for the increasing population and the transformation of agrifood systems, the dominant double-cropping based pattern of rice–rice is becoming less profitable and sustainable. To increase crop productivity in a system, increase land-use efficiency, and achieve a higher economic return and crop diversity, further intensification of cropping is required. Among developing countries, Bangladesh employs cropping intensification for increased crop production in an exemplary way with an average cropping intensity reaching 200%.
Recent research found that a four crop-based cropping system, which includes Aus (pre-monsoon rice, Oryza Sativa L.), Aman (monsoon rice, Oryza Sativa L.), lentil (Lens culinaris), and mungbean (Vigna radiata), was more profitable than the double or triple crop cropping systems [3], and farmers can easily follow this new system. This newly adopted cropping system may increase farm income while creating job opportunities, alleviating poverty, and ultimately creating positive changes in the farmers’ livelihoods. Reports have shown that the four crop-based cropping systems increased the rice equivalent yield up to 20–46% and the gross margin up to 30–41% over the existing lentil–jute–aman rice and boro–fallow–aman rice systems [4,5]. However, to acquire optimal performances in terms of yield, economic return, and soil health under the four crop-based cropping systems, the optimal fertilizer rate should be determined [6].
Various spatial and temporal aspects of soil health and the quality of a crop field greatly depend on the cropping systems followed in the field. If the cropping system contains exotic crops and intensive cultivation, nutrient depletion from the soil occurs quickly, and crop fields need more nutrients from external sources. Cropping systems were initially designed to obtain the maximum yield from agrosystems; however, sustainable and resilient agricultural production is now a major concern. The goal of soil health maintenance is to ensure the cropping system’s long-term viability, high productivity, and environmental sustainability. Soil nutrients such as N, P, K, S, Zn, B, etc., play a key role in improving crop growth, yield, and quality and regulating the supply of nutrients to plants [7]. The intensive cultivation of crops using high-yielding varieties removes more plant nutrients from the soils; therefore, soil fertility is severely depleted [8,9]. In addition, intensive cropping without the adequate replenishment of the removed nutrients and the nutrient loss through leaching, erosion, and gaseous emission cause the depletion of soil organic matter and fertility [10,11]. Therefore, soil fertility deterioration is the major concern in intensive cropping systems [12]. To preserve and sustain the soil fertility and ensure adequate crop yields in intensive cropping systems, proper fertilizer rate determination and management is required. Additionally, the inclusion of leguminous crops in the cropping system increases soil fertility through biological nitrogen fixation and improves the soil structure [13,14,15]. In addition, the incorporation of legume residues increases the organic matter in the soil [16,17], and food legumes also provide human and animal protein [18]. It has been well recognized that a balanced application of macro- and micronutrients are required to ensure high individual crop yields and the system’s productivity [19]. The necessary correction of crop plant nutrition for an intensive cropping system is a routine task, as soil nutrient status varies regularly depending on crop growth, yield targets, crop type, and following plant nutrient management. However, the optimally balanced nutrient requirement in four crop-based intensive cropping systems has not been studied yet. Therefore, the present study was undertaken to modify the doses of fertilizers for the four crop-based cropping systems for the enhancement of productivity and sustainable soil fertility.

2. Materials and Methods

2.1. Description of the Site and Climatic Conditions

During the year 2016/17 and 2017/18, nutrient management on a four cropping system-based (AusAman–Lentil–Mungbean cropping sequence) field trial was conducted in the research field of Regional Agricultural Research Station, Bangladesh Agricultural Research Institute (BARI), Jashore. The experimental site was located at 23°11′14″ N latitude, 89°11′05″ E longitude, and was 16.7 m above sea level. The experimental field’s land type was high (subjected to no flooding during the monsoon season), the soil was calcareous, and the texture was silt loam (15.41% sand, 64.08% silt, and 20.51% clay), relating to the Gopalpur soil series under the agro-ecological zone of the High Ganges River Floodplain (AEZ-11) [20]. The order of the soil is Inceptisol, the suborder is Ochrepts, the subgroup is Aquic Eutrochrepts, and the soil series is Gopalpur. The physiographic unit is Gangetic Alluvium. Before the start of the first crop, soil samples were randomly taken by using a soil auger from five different spots in the experimental field at a depth of 0–15 cm, which is presented in Table 1.
The climate of the trial site is the subtropical type with heavy precipitation, high humidity and temperature, long days and less clear sunshine from April to September, and light precipitation, low humidity and low temperature, and short days and clear sunshine from October to March. The weather data including information on average monthly temperatures, average humidity, and precipitation of the experimental period are presented in Table 2.

2.2. Land Preparation, Experimental Design, Treatment and Layout

For the first crop, the land was prepared by 3–4 passes with a tractor-driven chisel plough and leveled with tractor driven rotavator. Weeds and stubbles were carefully cleared. Following the harvest of the first crop, the plots were prepared for successive crops by 3–4 spading to retain the same layout. The experiments were carried out throughout the year following four crops in a year starting with Aus rice in 2016 (May to August). The second, third, and fourth crops were Aman (July to October), lentil (November to March), and mungbean (March to May), respectively. Every crop in the trial was laid out in a randomized complete block design with three replications. A total of six nutrients management treatments were imposed in every crop such as T1 = control (native nutrient), T2 = 50% recommended dose of fertilizer (RDF) according to Anonymous [20], T3 = 75% RDF, T4 = 100% RDF, T5 = 125% RDF, and T6 = Farmers practice (FP). The fertilizer amounts for each treatment and each crop are presented in Table 3.
Each treatment plot area was 4 m × 3 m in size. Plots were separated by a 50 cm soil bund, with replicated blocks separated by 1 m. Every crop was fertilized with urea, triple super phosphate, muriate of potash, gypsum, zinc sulphate, and boric acid in the N, P, K, S, Zn, and B treatments, respectively.

2.3. Fertilizer Application

For Aus and Aman rice, the calculated amounts of all fertilizers except urea were applied at the time of final plot preparation. Spading was used to incorporate fertilizers into the soil. Both Aus and Aman rice received urea in three equal splits, with the first split administered immediately after seedling establishment, the second split during maximum tillering, and the third split before panicle start. During the final plot preparation for lentil and mungbean, the calculated complete dose of all fertilizers in each treatment was applied, and fertilizers were correctly mixed with soil by spading.

2.4. Seed Sowing/Seedling Transplanting and Harvesting

Healthy seedlings (30 days old) of the Aus rice variety BRRI dhan48 were manually transplanted in each treatment plot on 15 May 2016 and 2017 at a spacing of 20 cm by 15 cm. On 16 August 2016 and 14 August 2017, 30-day old Aman rice (variety BRRI dhan62) seedlings were transplanted by hand in each treatment plot with a 20 cm by 15 cm plant spacing. In each hill of Aus and Aman rice, three seedlings were transplanted, with an equal number of rows and hills per plot. Quality seeds of lentil variety BARI Masur-7 were treated with Provax 200 WP fungicide (Hossain Enterprise C.C. Limited, Dhaka, Bangladesh) at 2.5 g kg−1. Treated lentil seeds were sown on 16 November 2016 and 15 November 2017 continuously in each unit plot with maintaining a raw spacing of 30 cm. On 8 March 2017 and 7 March 2018, healthy and quality seeds of the mungbean variety BARI Mung-6 were sowed consistently in each unit plot with a row-to-row distance of 30 cm. The crop-wise seed rate was Aus 25 kg ha−1, Aman rice was 25 kg ha−1, lentil was 30 kg ha−1, and mungbean was 35 kg ha−1. After maturity, Aus was harvested on 12 August in 2016 and 10 August in 2017, Aman was harvested on 11 November in 2016 and 8 November in 2017, lentil was harvested on 5 March 2017 and 4 March 2018, and mungbean was harvested on 10 May in 2017 and 2018.

2.5. Crop Protection and Management

Thinning of mungbean was performed at 15 days after seed sowing to maintain a plant-to-plant distance of 10 cm. In both rice, weeds were controlled by a manual weeding at 40 days after transplanting. Irrigations were applied in both types of rice as and when required (aman was mostly rainfed rice and applied only 1–3 irrigations but aus was partially rainfed and 3–6 irrigations were required based on the soil and crop conditions). To combat pest and disease, suitable crop protection measures were implemented. At 20 and 40 days following seeding, lentils were weeded twice. The lentil crop was not irrigated. During flowering, fungicide Rovral at the rate of 2 g L−1 ( Auto Crop Care Limited, Dhaka, Bangladesh) was applied three times at a 10-day interval against the Stemphylium blight disease of lentils. Insecticide Karate 2.5 EC at the rate of 2 mL L−1 (Syngenta Bangladesh Limited, Dhaka, Bangladesh) was sprayed two times at intervals of 10 days in the podding stage of lentil to control insect aphids and pod borers. The first and second hand weedings for mungbean were performed at 15 and 40 days after seed sowing (DAS), respectively. After seeding mungbean seeds, a single irrigation was applied. For control of leaf spot and rot diseases, fungicide Bavistin 50% WP (BASF Bangladesh Limited, Dhaka, Bangladesh) was applied twice at a dosage of 2 g L−1 on 25 DAS and 35 DAS. At the flowering and podding stages, the insects (pod borer and thrips) were reduced by spraying three times with the pesticide Karate 2.5 EC at the rate of 2 mL L−1 (Syngenta Bangladesh Limited, Dhaka, Bangladesh)

2.6. Data Collection

Plant height and florets per panicle of Aus and Aman rice were measured in ten plants from each treatment plot at random. Each plot’s mature Aus and Aman rice was harvested and packed separately according to treatment. It was then threshed on the threshing floor. Each plot’s grain and straw were sun-dried separately. Aus and Aman rice grain yields (kg ha−1) and straw yields (kg ha−1) were recorded. Rice thousand grains weight (g) was calculated by randomly selecting 1000 grains from each plot’s amalgamated grain, weighing it with an electronic scale, and converting it to 1000-grain weight after reducing the moisture level to roughly 14%.
From the randomly selected matured 10 plants, data on lentil yield components such as plant height, number of pods per plant, and seeds per pod were measured. The height of the plant was measured above ground and averaged. Every plant’s pods were removed, and the quantity of pods per plant was tallied and averaged. Ten pods were randomly selected from each plot’s composite pods of ten plants. The quantity of seeds per pod was counted and averaged among ten pods.
The seeds of ten plants were then kept in a Polybag according to treatment. The entire plot was then harvested to measure seed and stover/straw yields (kg ha−1). Each plot’s mature plants were gathered and carried to the threshing floor to be sun dried, and seeds were removed using a bamboo stick. The sun-dried stovers were weighed, and the data were translated to kilograms per hectare. Total seeds (seeds of ten plants + seeds of the entire plot) were sun dried and adjusted to a moisture content of roughly 10% based on the value of real moisture recorded by a digital seed moisture meter (Seedburo 1200D, Digital Moisture Tester, Seedburo Equipment Company Limited, USA). Thousand seed weight (g) was determined by counting 500 seeds randomly from composite seeds of each plot and weighing through electronic balance and converting it into 1000-seed weight.
The same approach was used to measure mungbean data (plant height, yield component, and seed yield). Matured above-ground plants from 1 m2 of each plot were picked and sundried for plant biomass. The dried stovers were weighed in kg per hectare. In each treatment plot, mungbean rest stovers were mixed with soil. Using Equation [21], the rice equivalent yield (REY) was calculated as the yield of a single non-rice crop multiplied by the market price of that crop divided by the market price of rice:
REY = Y i e l d   o f   i n d i v i d u a l   n o n   r i c e   c r o p × t h e   m a r k e t   p r i c e   o f   t h a t   c r o p T h e   m a r k e t   p r i c e   o f   r i c e
where REY is the rice equivalent yield, individual non-rice crop yield (kg ha−1), rice crop market price (BDT kg−1), and non-rice crop market price (BDT kg−1) (BDT kg−1).
Production efficiency (PE) was calculated as the ratio of overall system productivity in terms of rice yield equivalent in kg ha−1 to the total system’s duration in days [21].
Agronomic efficiency (AE) was measured using the following equation [22]:
AE = (Yna − Yno)/Nrn
where Yna represents the yield (kg ha−1) from nutrient addition, Yno represents the yield (kg ha−1) from nutrient omission, and Nrn represents the rate of nutrient addition (kg ha−1).

2.7. Soil and Plant Analysis

Standard procedures were used to collect and evaluate post-harvest soil samples (depth of 0–15 cm) from each treatment plot. Following the completion of two cycles of the four crops cropping system, postharvest soil samples were obtained. A glass electrode pH meter was used to determine the pH of the soil using a 1:2.5 soil–water ratio [23]. The wet oxidation method was used to determine soil organic carbon [23]. The micro-Kjeldahl method [24] was used to determine total N content. The Olsen method [25] was used to determine available P. Gupta [24] described the process of extracting exchangeable Ca using a 1 M NH4OAc solution. An Atomic Absorption Spectrophotometer was used to determine the amount of calcium in the extract (Varian, Model SpectrAA 55B, Sydney, Australia). The 1 N NH4OAc techniques were used to determine exchangeable K [23]. Turbidity was used to determine available S using BaCl2 [26]. The diethylenetriamine penta acetic acid (DTPA) technique was used to assess available Zn [27]. The azomethine-H technique was used to determine available B [28]. Ground dry plant and dry grain/seed samples of Aus, Aman, lentil, and mungbean were digested with a di-acid mixture (HNO3–HClO4: 5:1) as described by Piper [28] for the determination of N content (micro-Kjeldahl method); P (spectrophotometer method); K (atomic absorption spectrophotometer method); S (turbidity method using BaCl2 by spectrophotometer); and B. The amount of zinc in the digest was determined using an Atomic Absorption Spectrophotometer (Varian, SpectrAA 55B, Sydney, Australia).

2.8. Determination of Nutrient Uptake

Dry crop yields and nutrient content in grain/seed and dry plants were used to determine nutrient (N, P, K, S, Zn, and B) uptake by all crops. The apparent nutrient recovery efficiency (ANR) was calculated using the following formula [29].
ANR = (   N u t r i e n t   u p t a k e   d u e   t o   n u t r i e n t   a d d i t i o n ,   kg / ha N u t r i e n t   u p t a k e   d u e   t o   n u t r i e n t   o m i s s i o n ,   kg / ha ) ( Q u a n t i t y   o f   n u t r i e n t   a p p l i e d ,   kg / ha ) × 100

2.9. Cost and Return Analysis

For each treatment of all test crops, management costs were computed by summing the expenses of labor, plowing, irrigation, and inputs. Gross return was calculated using the grain/seed yield of Aus, Aman, lentil, and mungbean. Shadow pricing (land rent, for example) was not taken into account. Grain/seed production was multiplied by the unit price (farm gate) of Aus, Aman, lentil, and mungbean to calculate gross return. By removing management costs from the gross return, gross margin was computed. For a hectare of land, the benefit-cost ratio (BCR) was determined using the formula below.
BCR = G r o s s   r e t u r n   T o t a l   p r o d u c t i o n   c o s t

2.10. Statistical Analysis

The combined analyses of two years’ data were not significant; therefore, the average values of yield and yield attributes of the four crops in each treatment were presented. The statistical program Statistix-10 [30] was used to analyze the mean data for yield, yield attributes, and nutrient (N, P, K, S, Ca, Mg, Zn, and B) content and uptake. The least significant difference (LSD) test was used to compare the means of all data at a significant level of p < 0.05.

3. Results

3.1. Aus Rice

3.1.1. Yield and Yield Components of Aus Rice

Yield components and grain yield of aus rice were influenced significantly by fertilizer treatments (Table 4). The highest plant height, florets panicle−1, 1000 grain weight, and grain and straw yield were recorded in the treatment of the application of 125% RDF (T5), which was significantly similar to 100% RDF for all parameters but higher than the FP and other fertilizer management (Table 4).

3.1.2. Nutrient Content in Aus Rice

Except P in grain, other nutrients were affected by the fertilizer management in rice grain and straw (Table 5). The highest value of all nutrients (except grain P) was recorded in the T5 treatment, and the lowest value was recorded from the control treatment (T1). Compared to 100% RDF, the 125% RDF had 0.67 and 2.35% N, 3.19 and 7.5% P, 1.67 and 7.45% K, 2.5 and 3.29% S, 1.2 and 2.42% Zn, and 6.57 and 10% higher B in grain and straw of rice, respectively.

3.1.3. Nutrient Uptake by Aus Rice (Grain + Straw)

Different doses of fertilizers treatments affected the uptake of N, P, K, S, Zn, and B in Aus rice (Table 6). The increase in fertilizer doses increased the uptake of all nutrients but this increment was not always significant. The 100% RDF had a similar uptake to all nutrients except B to 125% RDF. The highest B uptake in rice was recorded in the fertilizer management of 125% RDF.

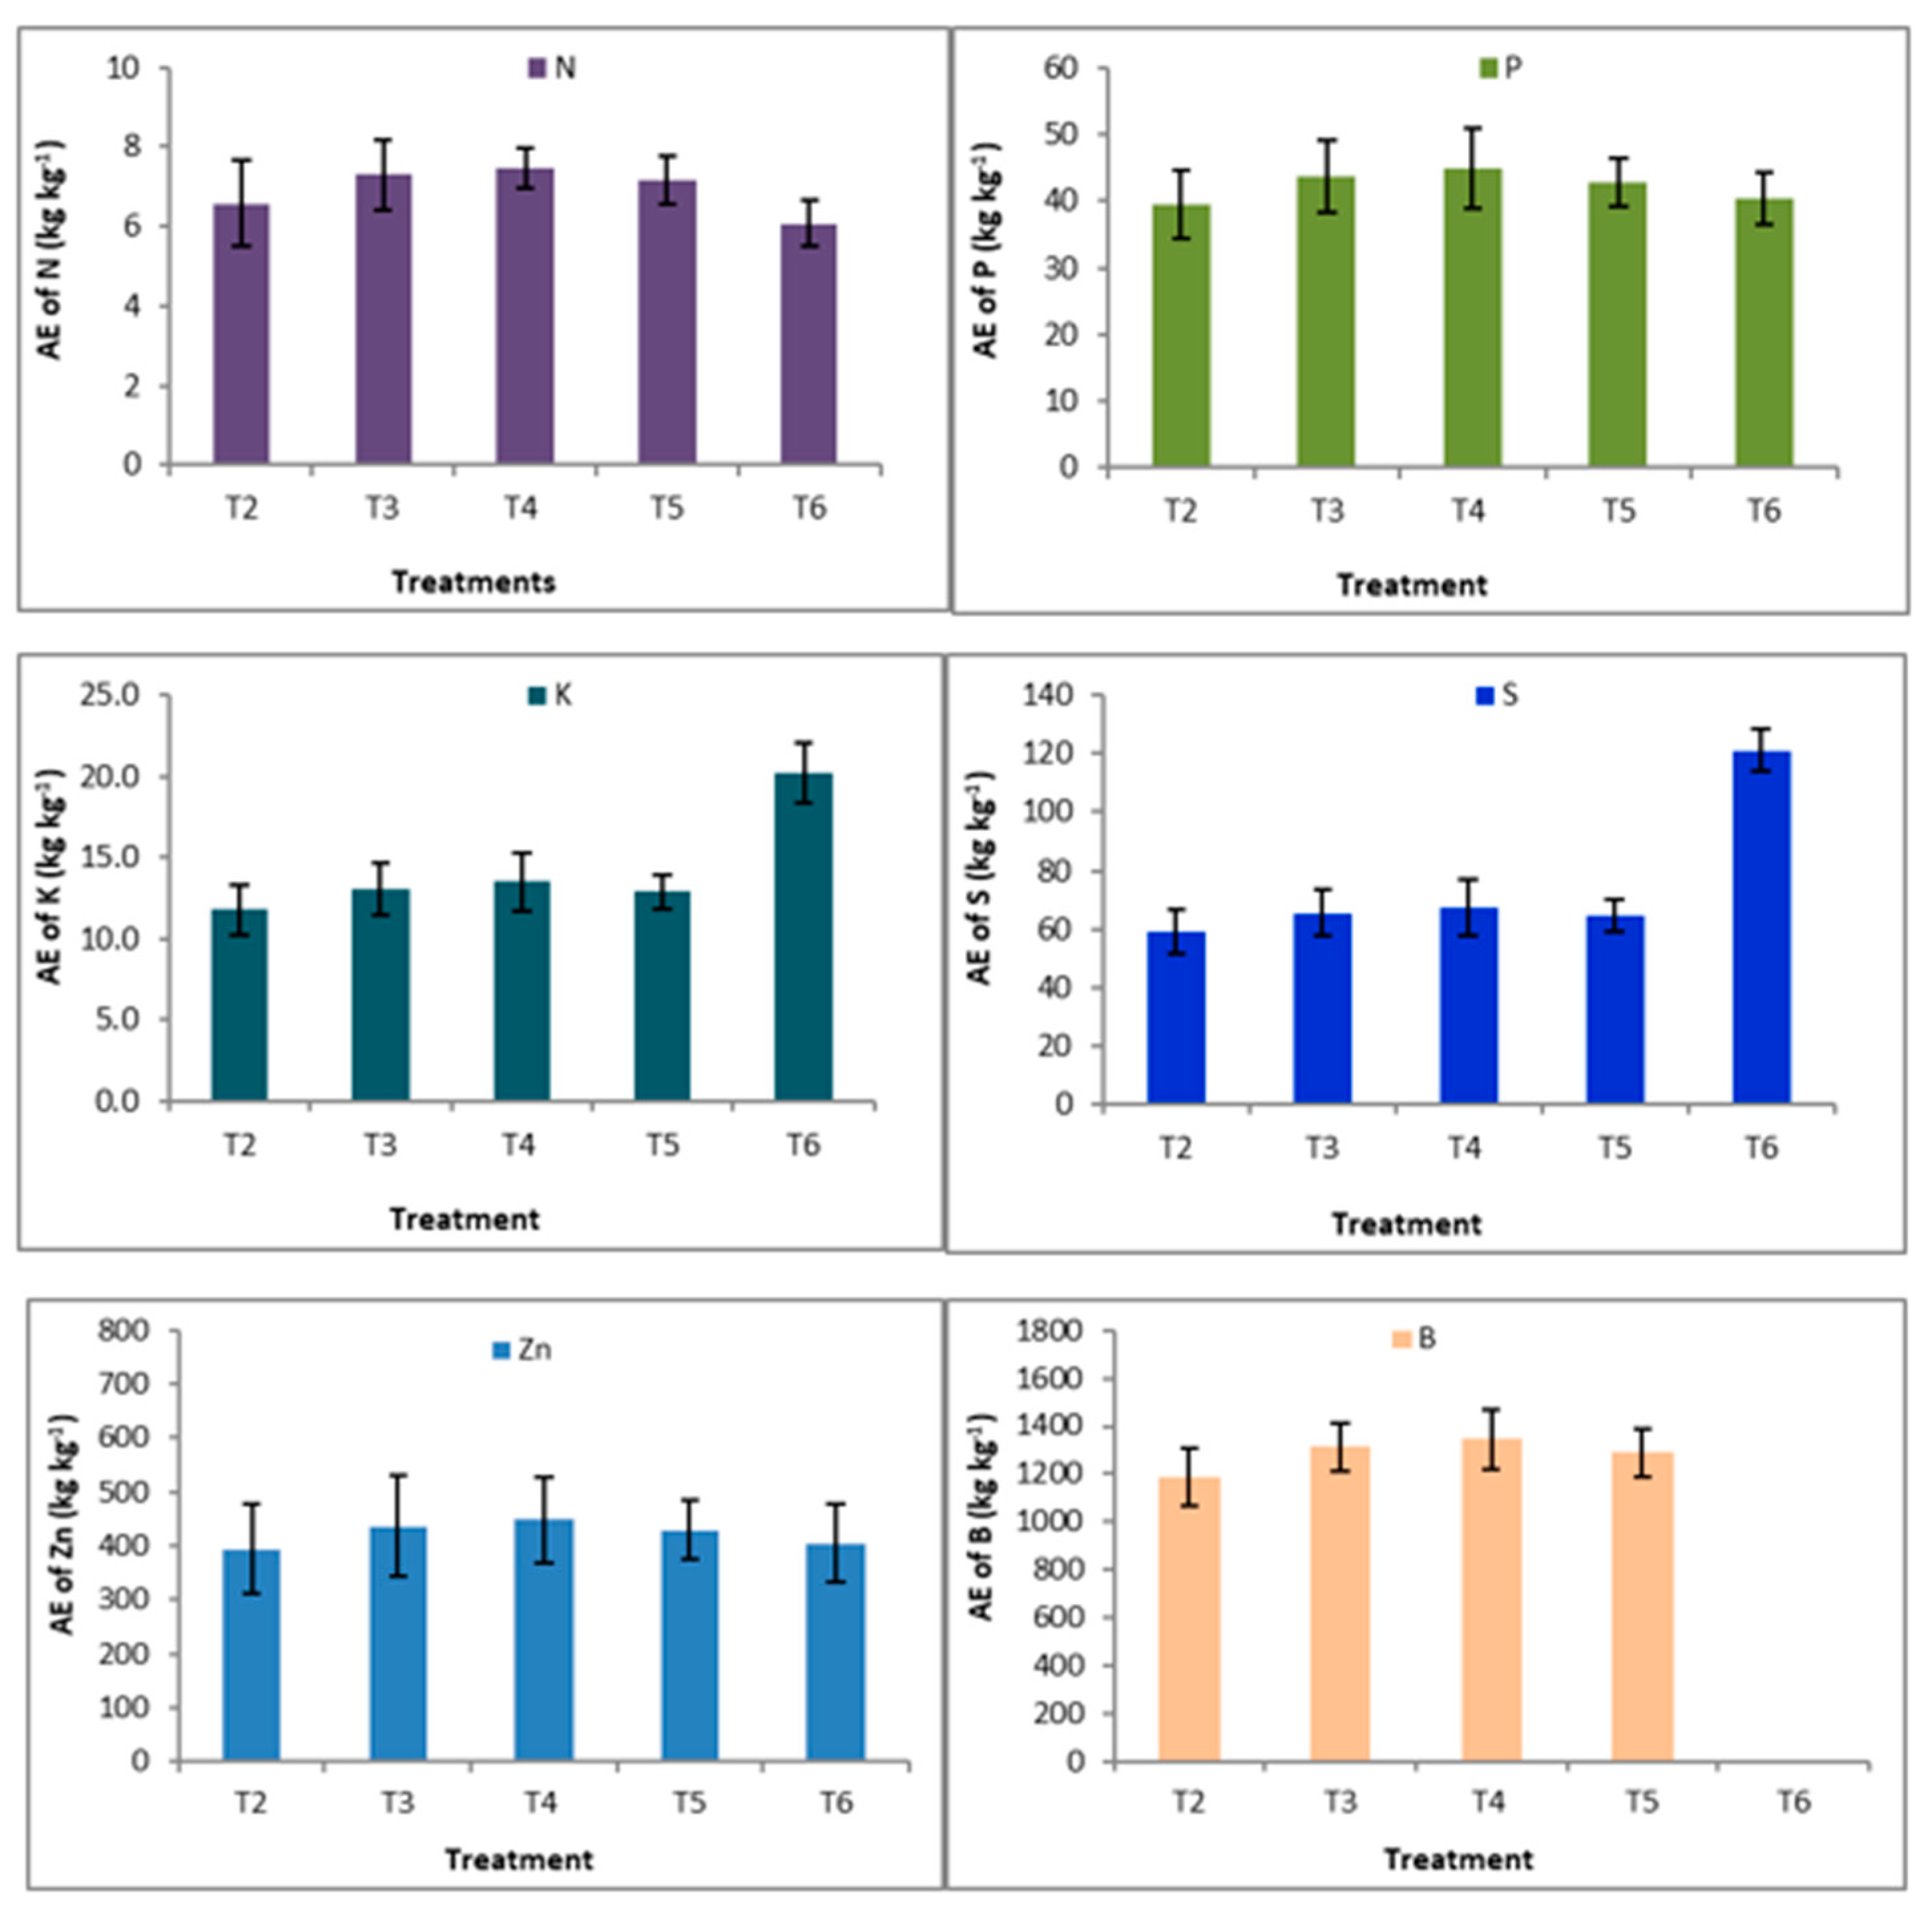
3.1.4. Agronomic Efficiency (AE) of Nutrients in Aus Rice

Different fertilizer treatments influenced the agronomic efficiency of N, P, K, S, Zn, and B in Aus rice (Figure 1). The highest AE of N (13.9 kg kg−1) was recorded in fertilizer treatment of 50% RDF while 100% RDF was recorded as the lowest. Similarly to nutrient N, the highest AEs of P (83.2 kg kg−1), Zn (832 kg kg−1), and B (2496 kg kg−1) were found in the treatment of 50% RDF. The highest AE of K (28.7 kg kg−1) and S (172 kg kg−1) was recorded from the treatment with 100% RDF.

3.2. Aman Rice

3.2.1. Yield and Yield Components of Aman Rice

Yield components and grain yield of aman rice were influenced by fertilizer treatments (Table 7). The highest values of plant height, yield, and yield components were recorded in the treatment of the application of 125% RDF (T5), which was significantly similar to 100% RDF for all parameters (Table 7).

3.2.2. Nutrient Content in Aman Rice

The nutrient content in grain and straw of Aman rice was influenced significantly by different doses of fertilizers except K and S content in grain and P content in straw (Table 8). The maximum nutrient content (except K and S content in grain and P content in straw) was observed in the T5 treatment and the lowest was observed in the control treatment (T1). The percent increments of nutrient contents in 125% RDF over 100% RDF (T4) were 1.65% N in grain and 2.60% N in straw, 4.86% P in grain, 2.51% K in straw, 1.68% S in straw, 1.51% Zn in grain and 0.38% Zn in straw, 8.75% B in grain, and 10.0% B in straw.

3.2.3. Nutrient Uptake by Aman Rice (Grain + Straw)

Different doses of fertilizers application affected the uptake of different nutrients in Aman rice (Table 9). Boosted fertilizer doses up to 125% RDF increased nutrient absorption, but this increase was statistically similar to the 100% RDF (T4) treatment.

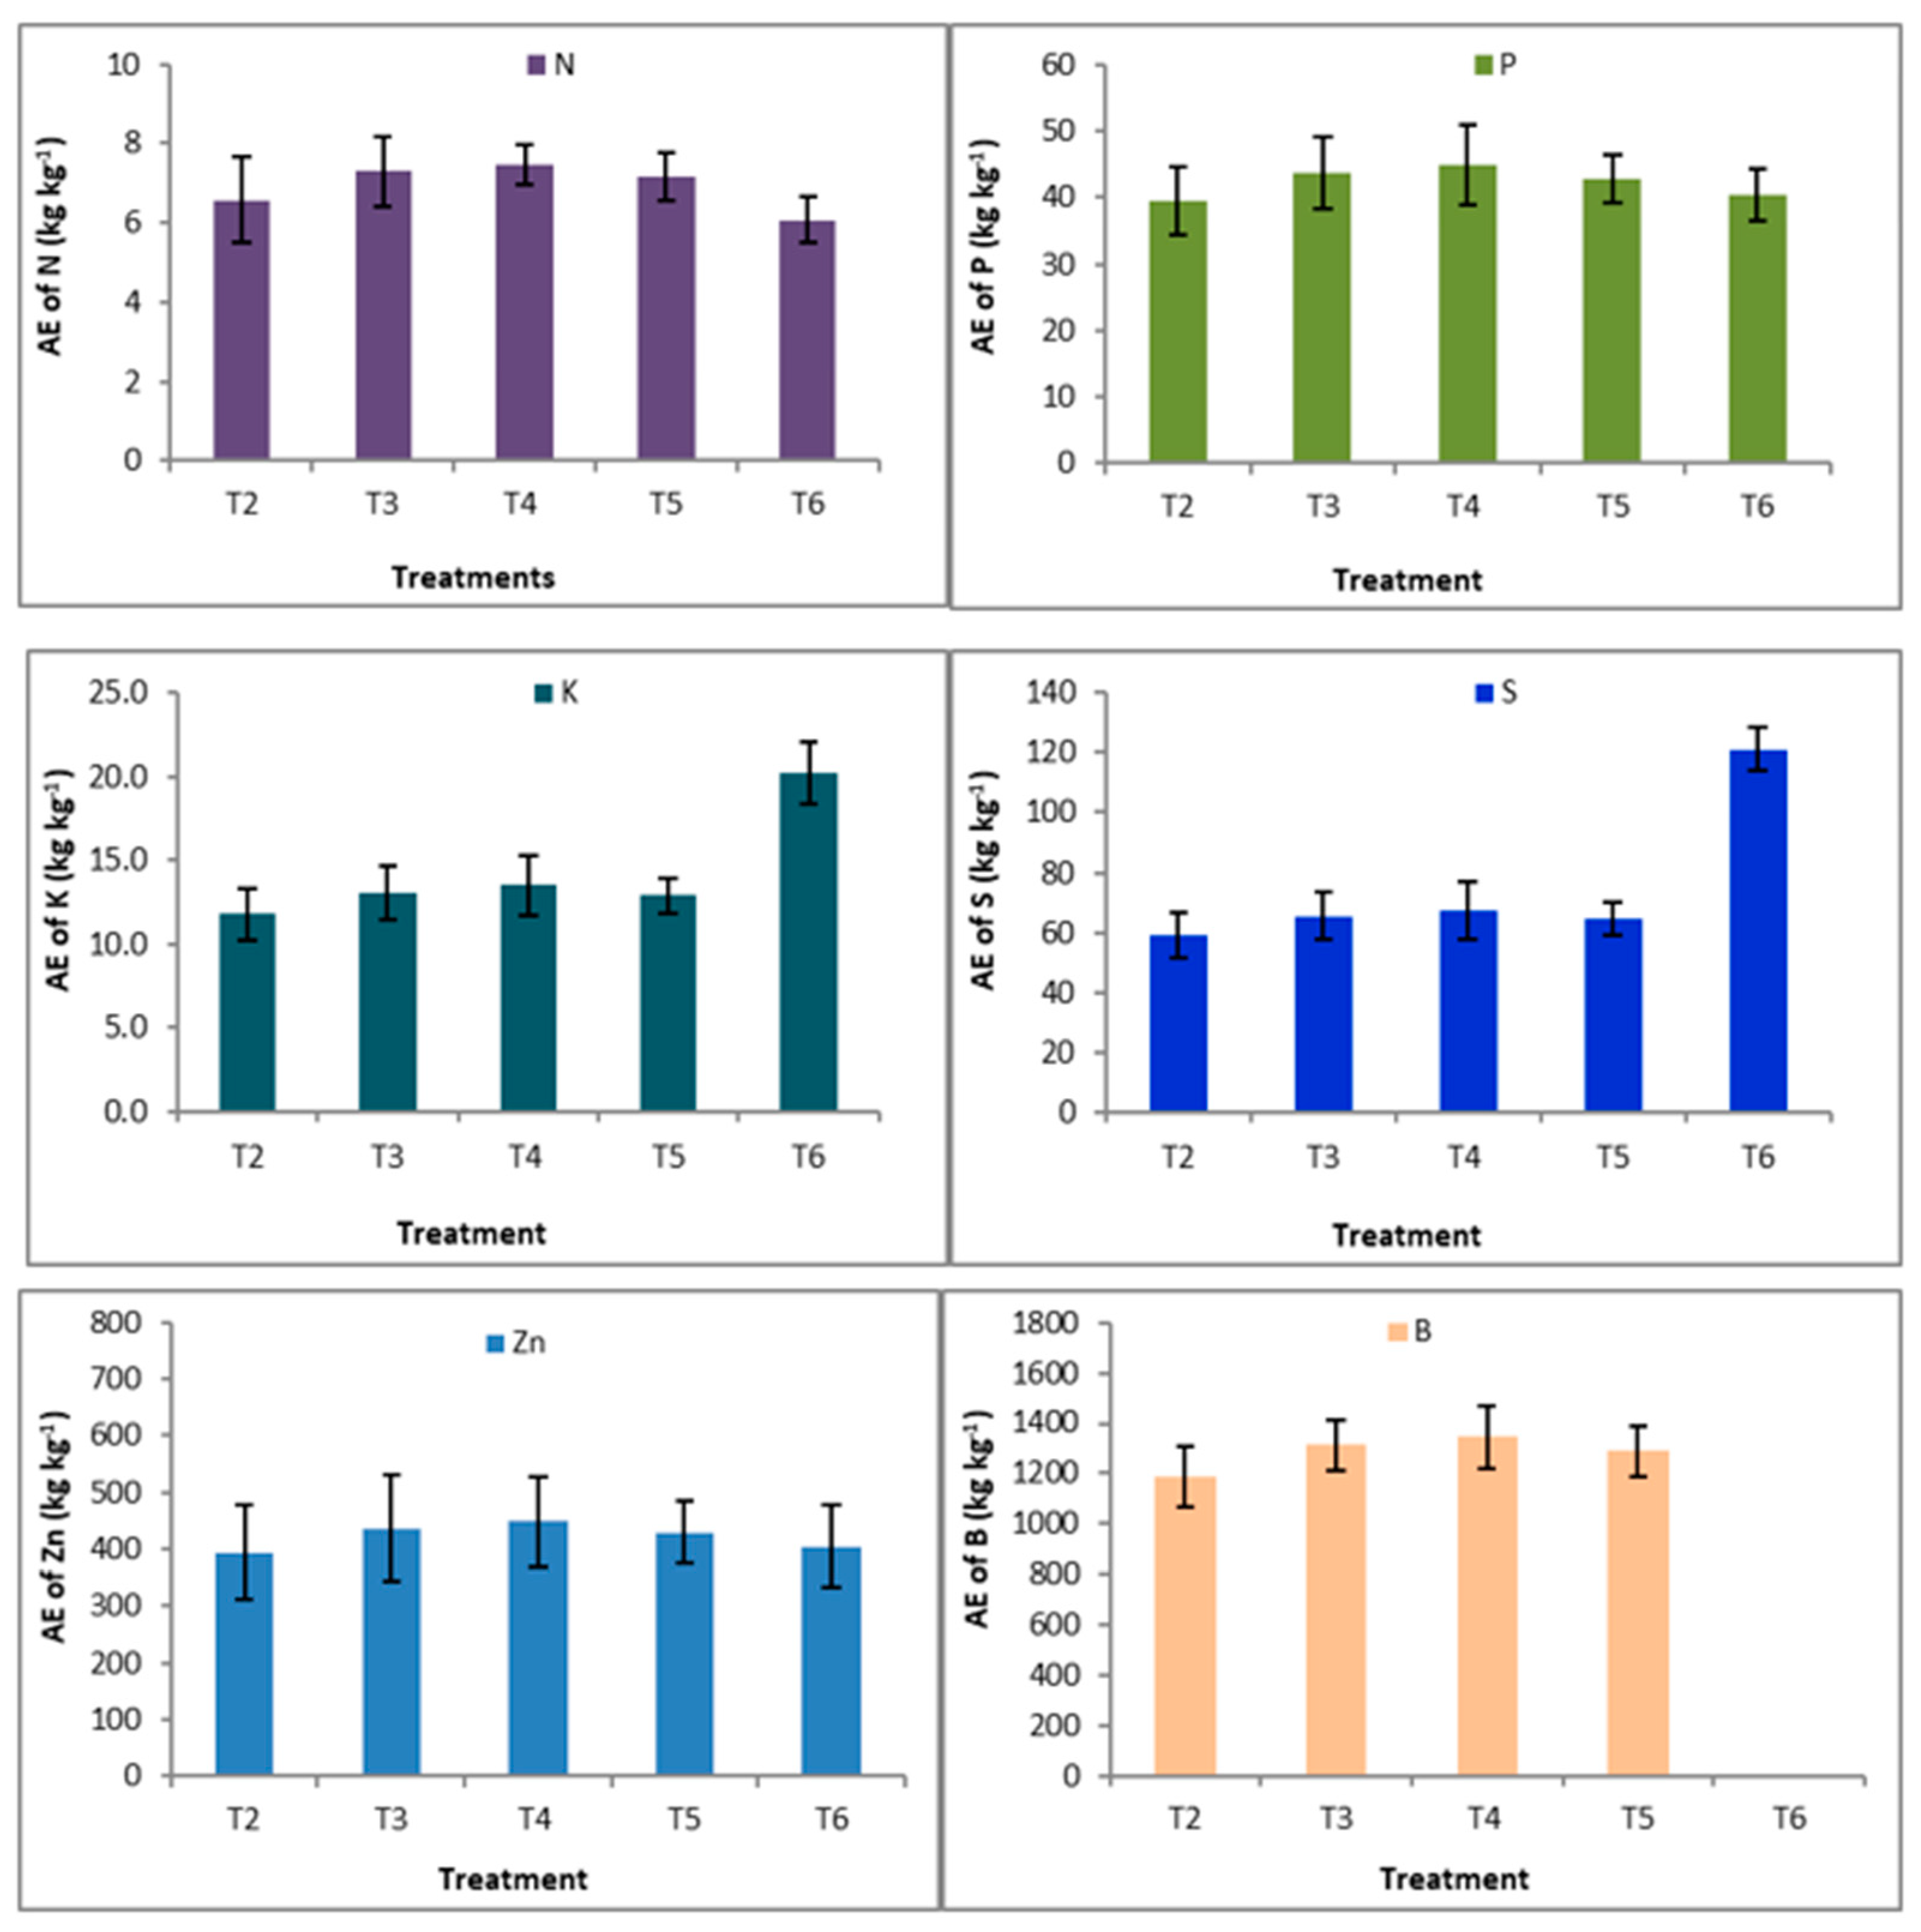
3.2.4. Agronomic Efficiency (AE) of Nutrients in Aman Rice

Fertilizer doses significantly affected the AE of nutrients N, K, S, and Zn but not P and B in Aman rice (Figure 2). The highest AE of N (7.48 kg kg−1) was found in T4 treatment and the minimum was observed in the T6 treatment. The maximum AE of P (44.9 kg kg−1) was recorded in T4 treatment and minimum in T2 treatment. The highest AE of K (20.2 kg kg−1) and S (121 kg kg−1) in Aman rice was noted in T6 treatments and the minimum was noted in the T2 treatment. The highest AE of Zn (448 kg kg−1) and B (1346 kg kg−1) was recorded in the T4 treatment.

3.3. Lentil

3.3.1. Yield and Yield Components of Lentil

The application of different fertilizer doses had a substantial impact on lentil plant height, yield, and yield components (Table 10). Plant height was similar in the 125% RDF, 100% RDF, and FP treatments. The treatment with 125% RDF produced the most pods plant−1, which was much more than the other treatments. Except for control, all treatments had similar thousand seed weights (lower than the other treatments). Treatment with 125% RDF produced the maximum lentil seed yield (1716 kg ha−1). Stover yields followed almost identical patterns to seed yields (Table 10).

3.3.2. Nutrient Content in Lentil

Different doses of fertilizers affected the nutrient content in the seed and stover of lentil (Table 11). Except N and S, all other nutrients were higher for the treatment of 125% RDF. The percent increments of nutrient content in 125% RDF in lentil over 100% RDF were 1.65% and 4.54% for N, 9.25% and 5.63% for P, 7.35% and 6.66% for K, 10.5% and 2.85% for S, 1.11% and 1.29% for Zn, and 3.15% and 3.89% for B in seed and stover.

3.3.3. Nutrient Uptake by Lentil (Seed + Stover)

Fertilizer management affected all of the nutrient’s uptakes by lentil (seed + stover), with the highest value coming from the 125% RDF treatment, which was similar to 100% RDF but greater than all other treatments (Table 12).

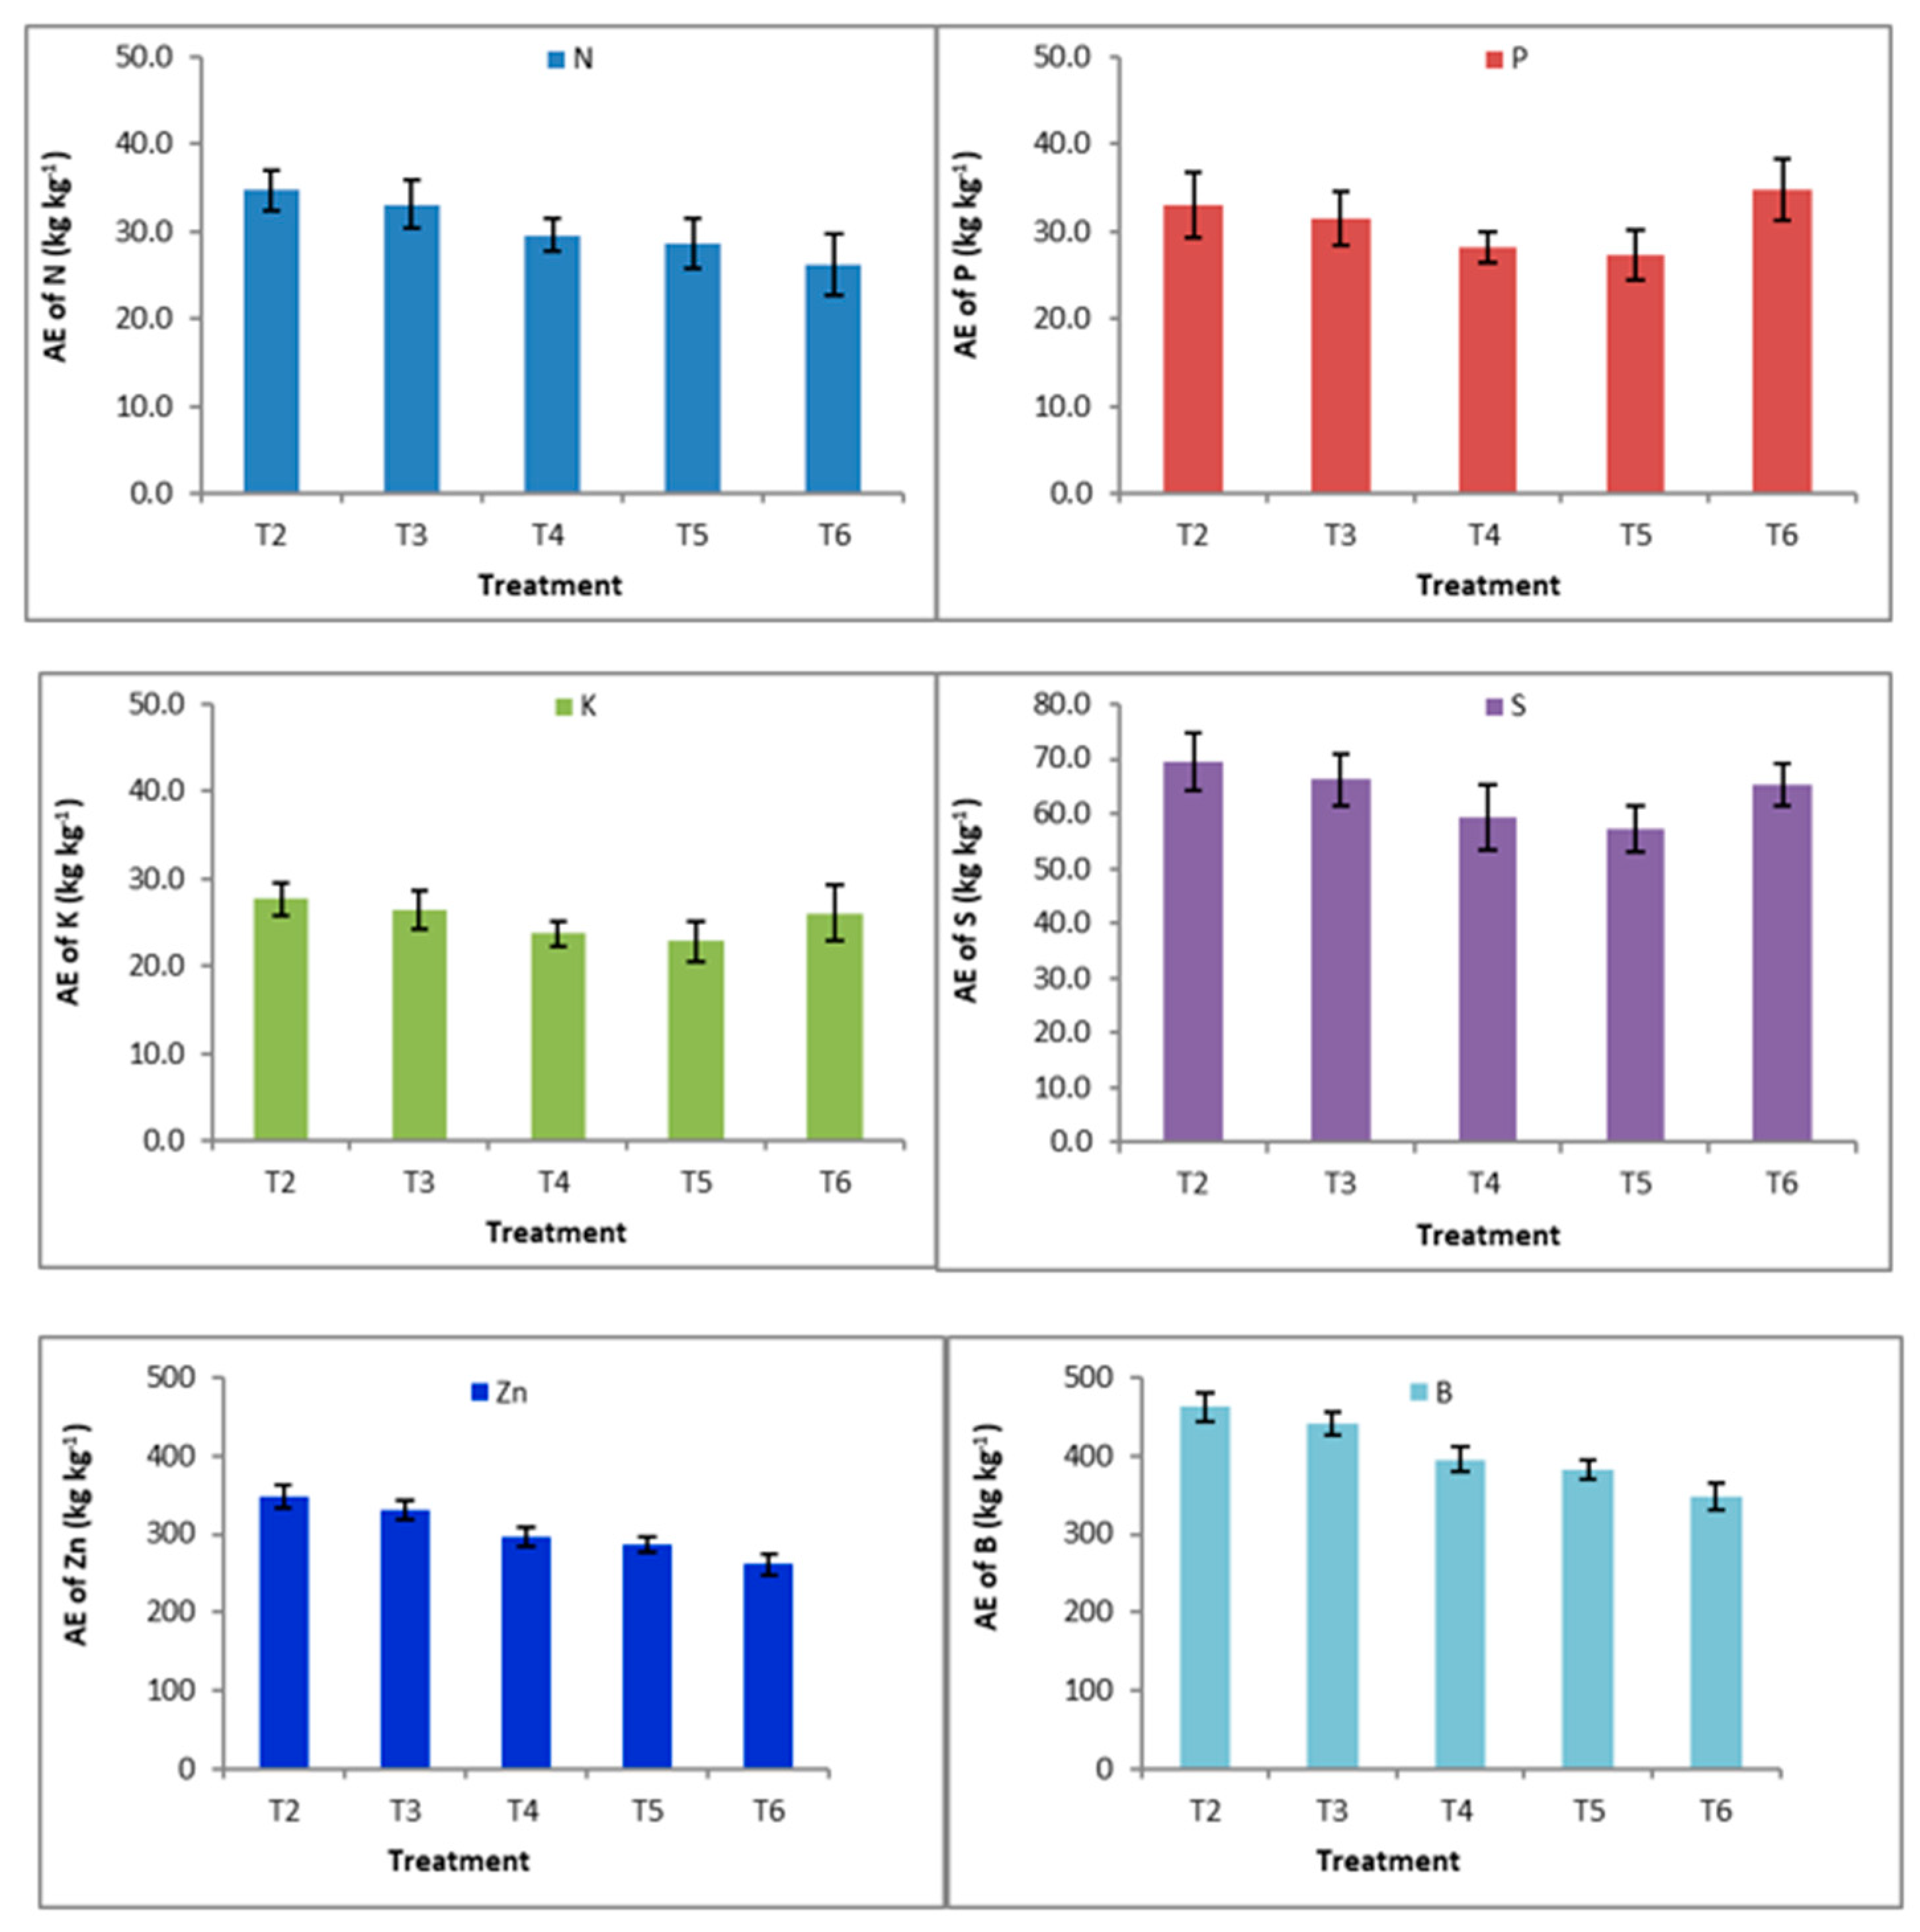
3.3.4. Agronomic Efficiency (AE) of Nutrients in Lentil

The AE of N declined as N rates increased, with the greatest value (34.7 kg kg−1) obtained from 50% RDF (Figure 3). For P, the T6 treatment produced the highest AE (34.8 kg kg−1), while the T5 treatment produced the lowest AE. For K and S, the T2 treatment had the highest AE while the T5 treatment had the lowest AE (Figure 3). T2 treatments had the highest AE for Zn and B, while T6 treatment had the lowest AE.

3.4. Mungbean

3.4.1. Yield and Yield Components of Mungbean

The application of varied fertilizer doses significantly influenced plant height, yield, and yield-contributing characters in mungbean (Table 13). Plant height and pods plant−1 were comparable in the 125% RDF and 100% RDF treatments, but they were much higher in other treatments. The 125% RDF, 100% RDF, FP, and 75% RDF treatments had similar thousand seed weights. The treatment of 125% RDF produced (1650 kg ha−1) the highest seed production, which was statistically similar to the fertilizer treatment of 100% RDF. Stover yield was maintained at almost similar trends compared to seed yield.

3.4.2. Nutrient Content in Mungbean

Different doses of fertilizers affected the nutrient content in the seed and stover of mungbean (Table 14). All nutrient contents in seed and stover were the highest for the treatment of 125% RDF. The percent increments of nutrient content in 125% RDF in mungbean over 100% RDF were 1.13% and 3.18% for N, 5.12% and 4% for P, 0.78% and 1.42% for K, 8.33% and 5.26% for S, 5.36% and 1.61% for Zn, and 1.62% and 5.80% for B in seed and stover, respectively.

3.4.3. Nutrient Uptake by Mungbean (Seed + Stover)

All nutrient uptakes by mungbean (seed + stover) were affected by fertilizer treatments, and the highest value was observed in the treatment of 125% RDF, which was always significantly similar to 100% RDF (Table 15).

3.4.4. Agronomic Efficiency (AE) of Nutrients in Mungbean

The AE of all nutrients differed significantly with respect to the fertilizer management treatments. The AE of N (19.8 kg kg−1) was found to be the highest in the treatment with 75% RDF and was the lowest in FP treatments (Figure 4). For P, K, S, and Zn, the highest AE was recorded in the treatment FP, and the lowest was in the 50% RDF treatment. The highest AE of B was recorded in 75% of RDF treatment and the lowest was in the FP treatment.

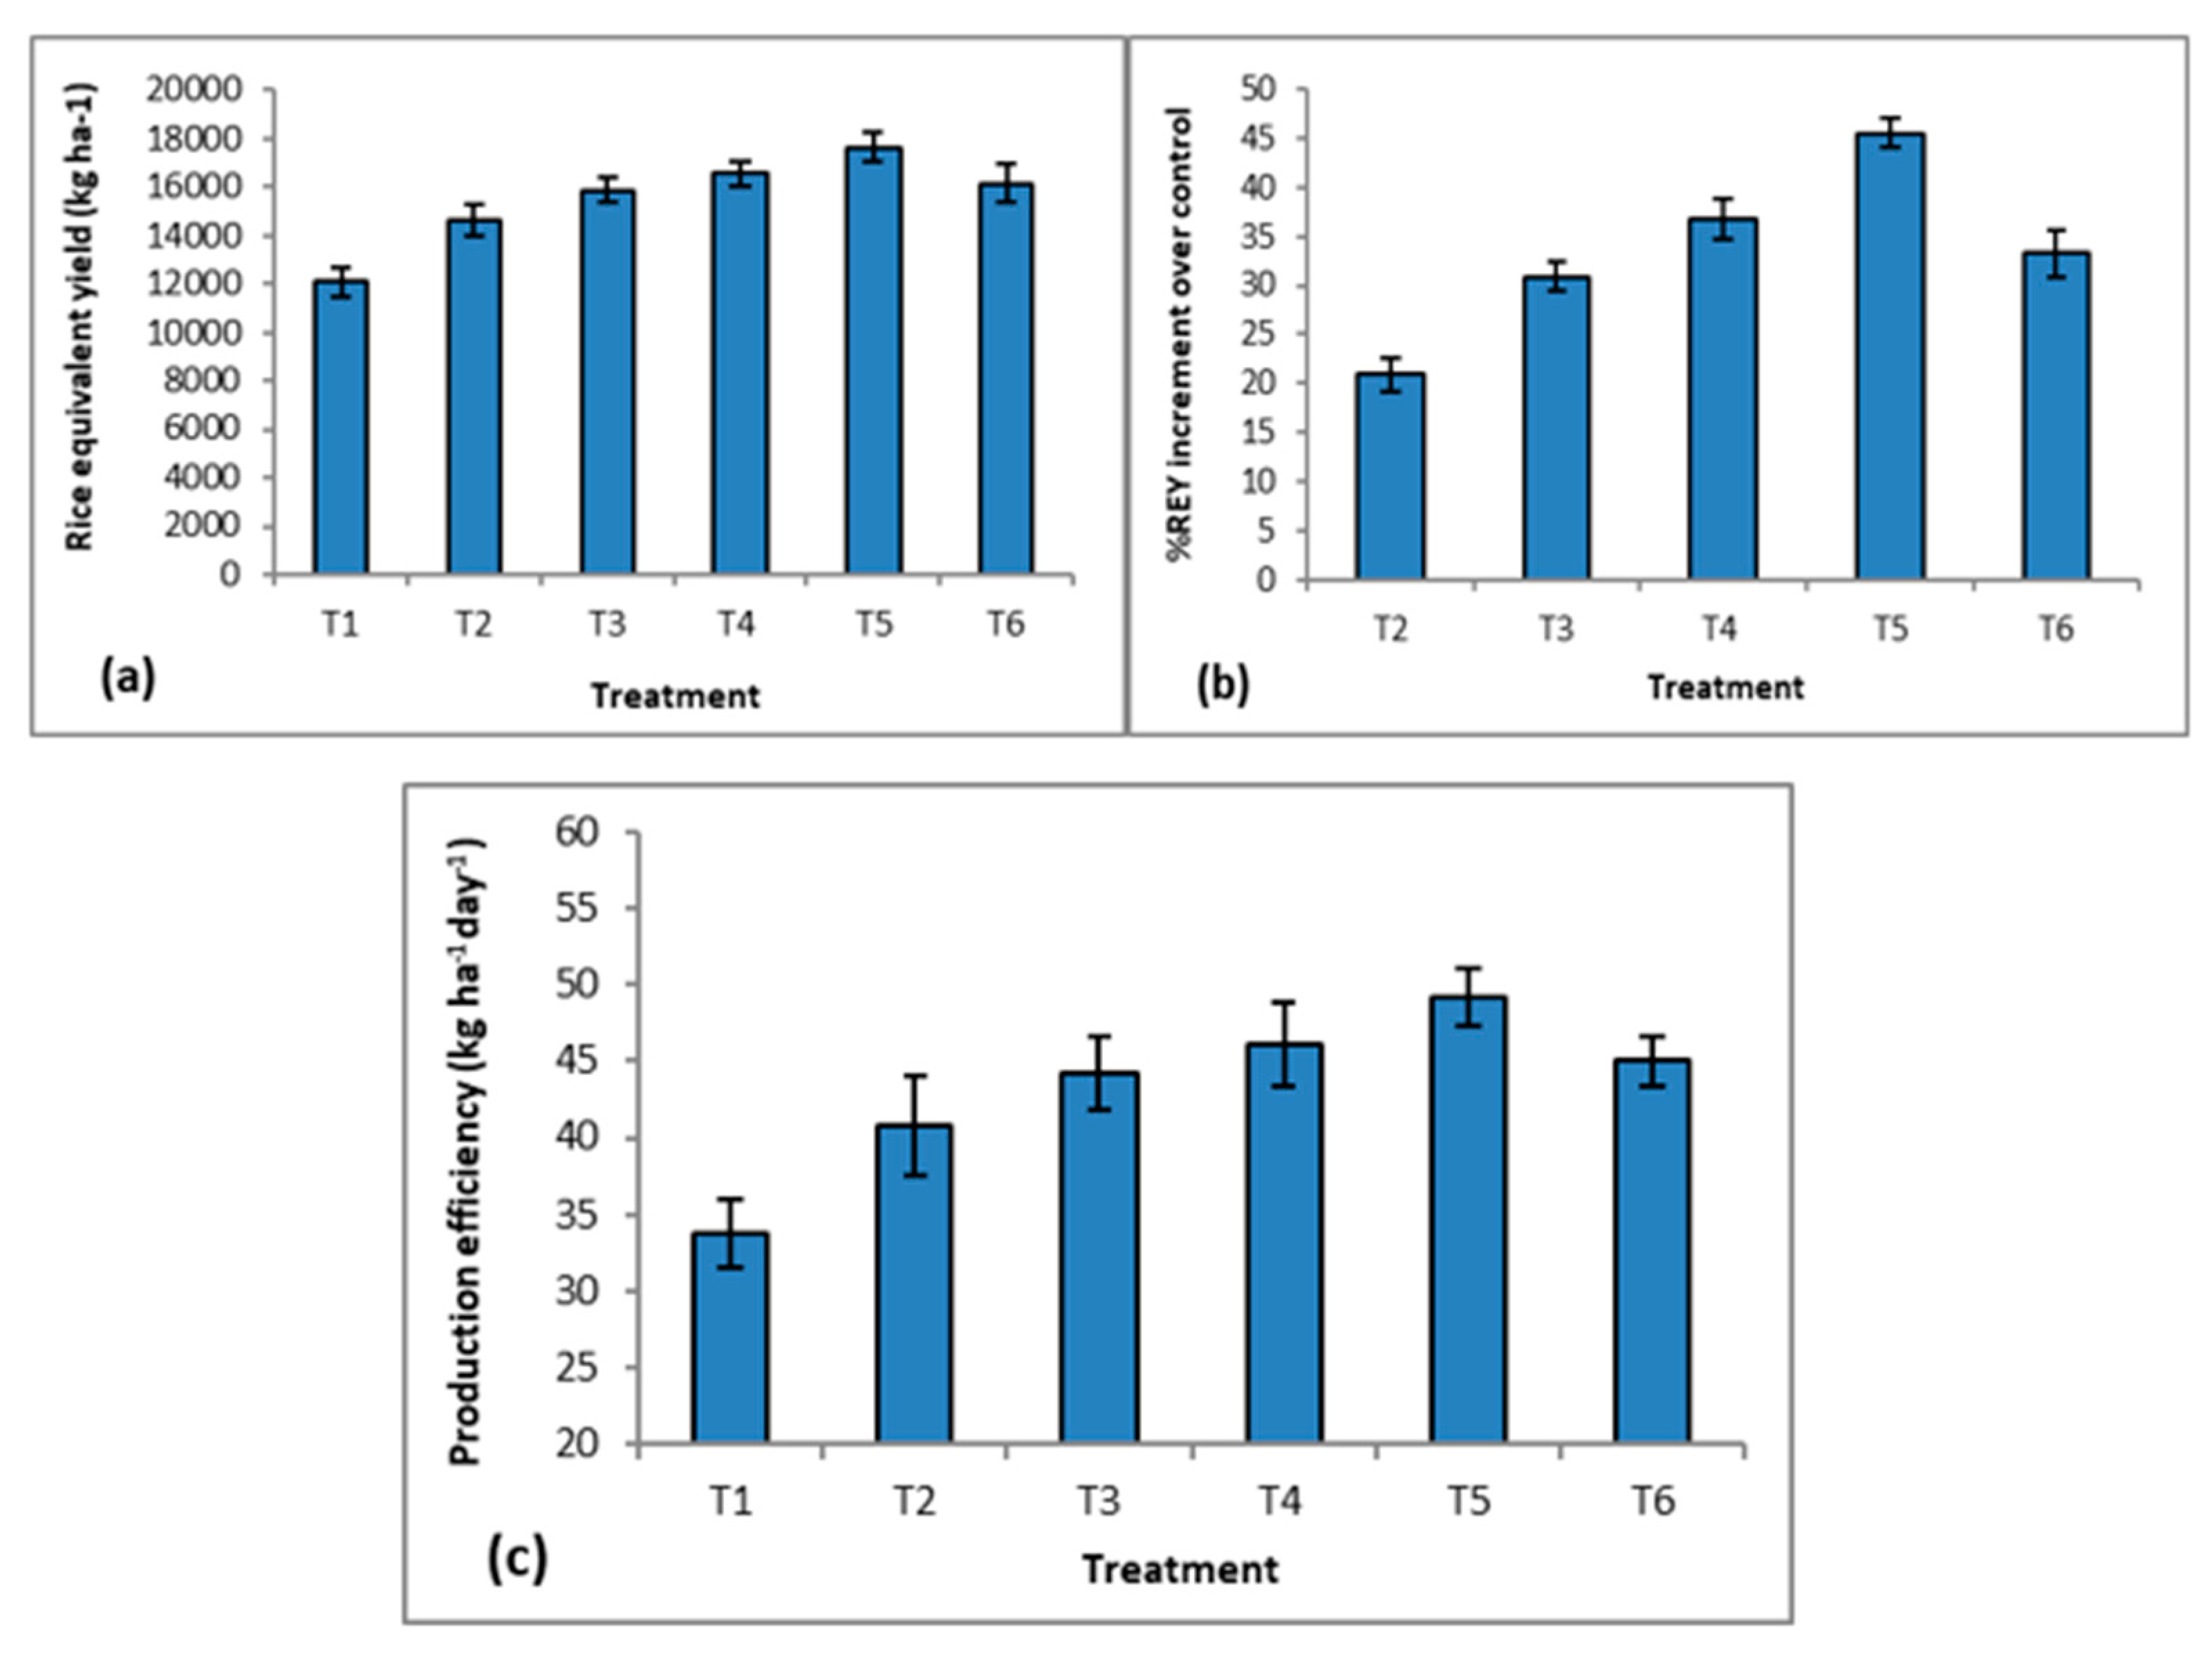
3.5. Rice Equivalent Yield and Production Efficiency

The total system productivity of different fertilizer treatments was assessed in terms of rice equivalent yield (REY) and it was calculated from the yield of every test crop of the system (Figure 5a–c). Rice equivalent yield ranged from 12,093 to 17,599 kg ha−1 across different fertilizer treatments (Figure 5a). The highest REY was produced in the treatment with 125% RDF and the lowest amount was produced in the control (T1) (Figure 5b). The highest REY increment (45.5%) over the control was recorded in the 125% RDF treatment and the lowest value was recorded in the 50% RDF treatment. The highest production efficiency (49.1 kg ha−1 day−1) was also noted in the treatment with 125% RDF and the lowest in the control (T1) (Figure 5c).

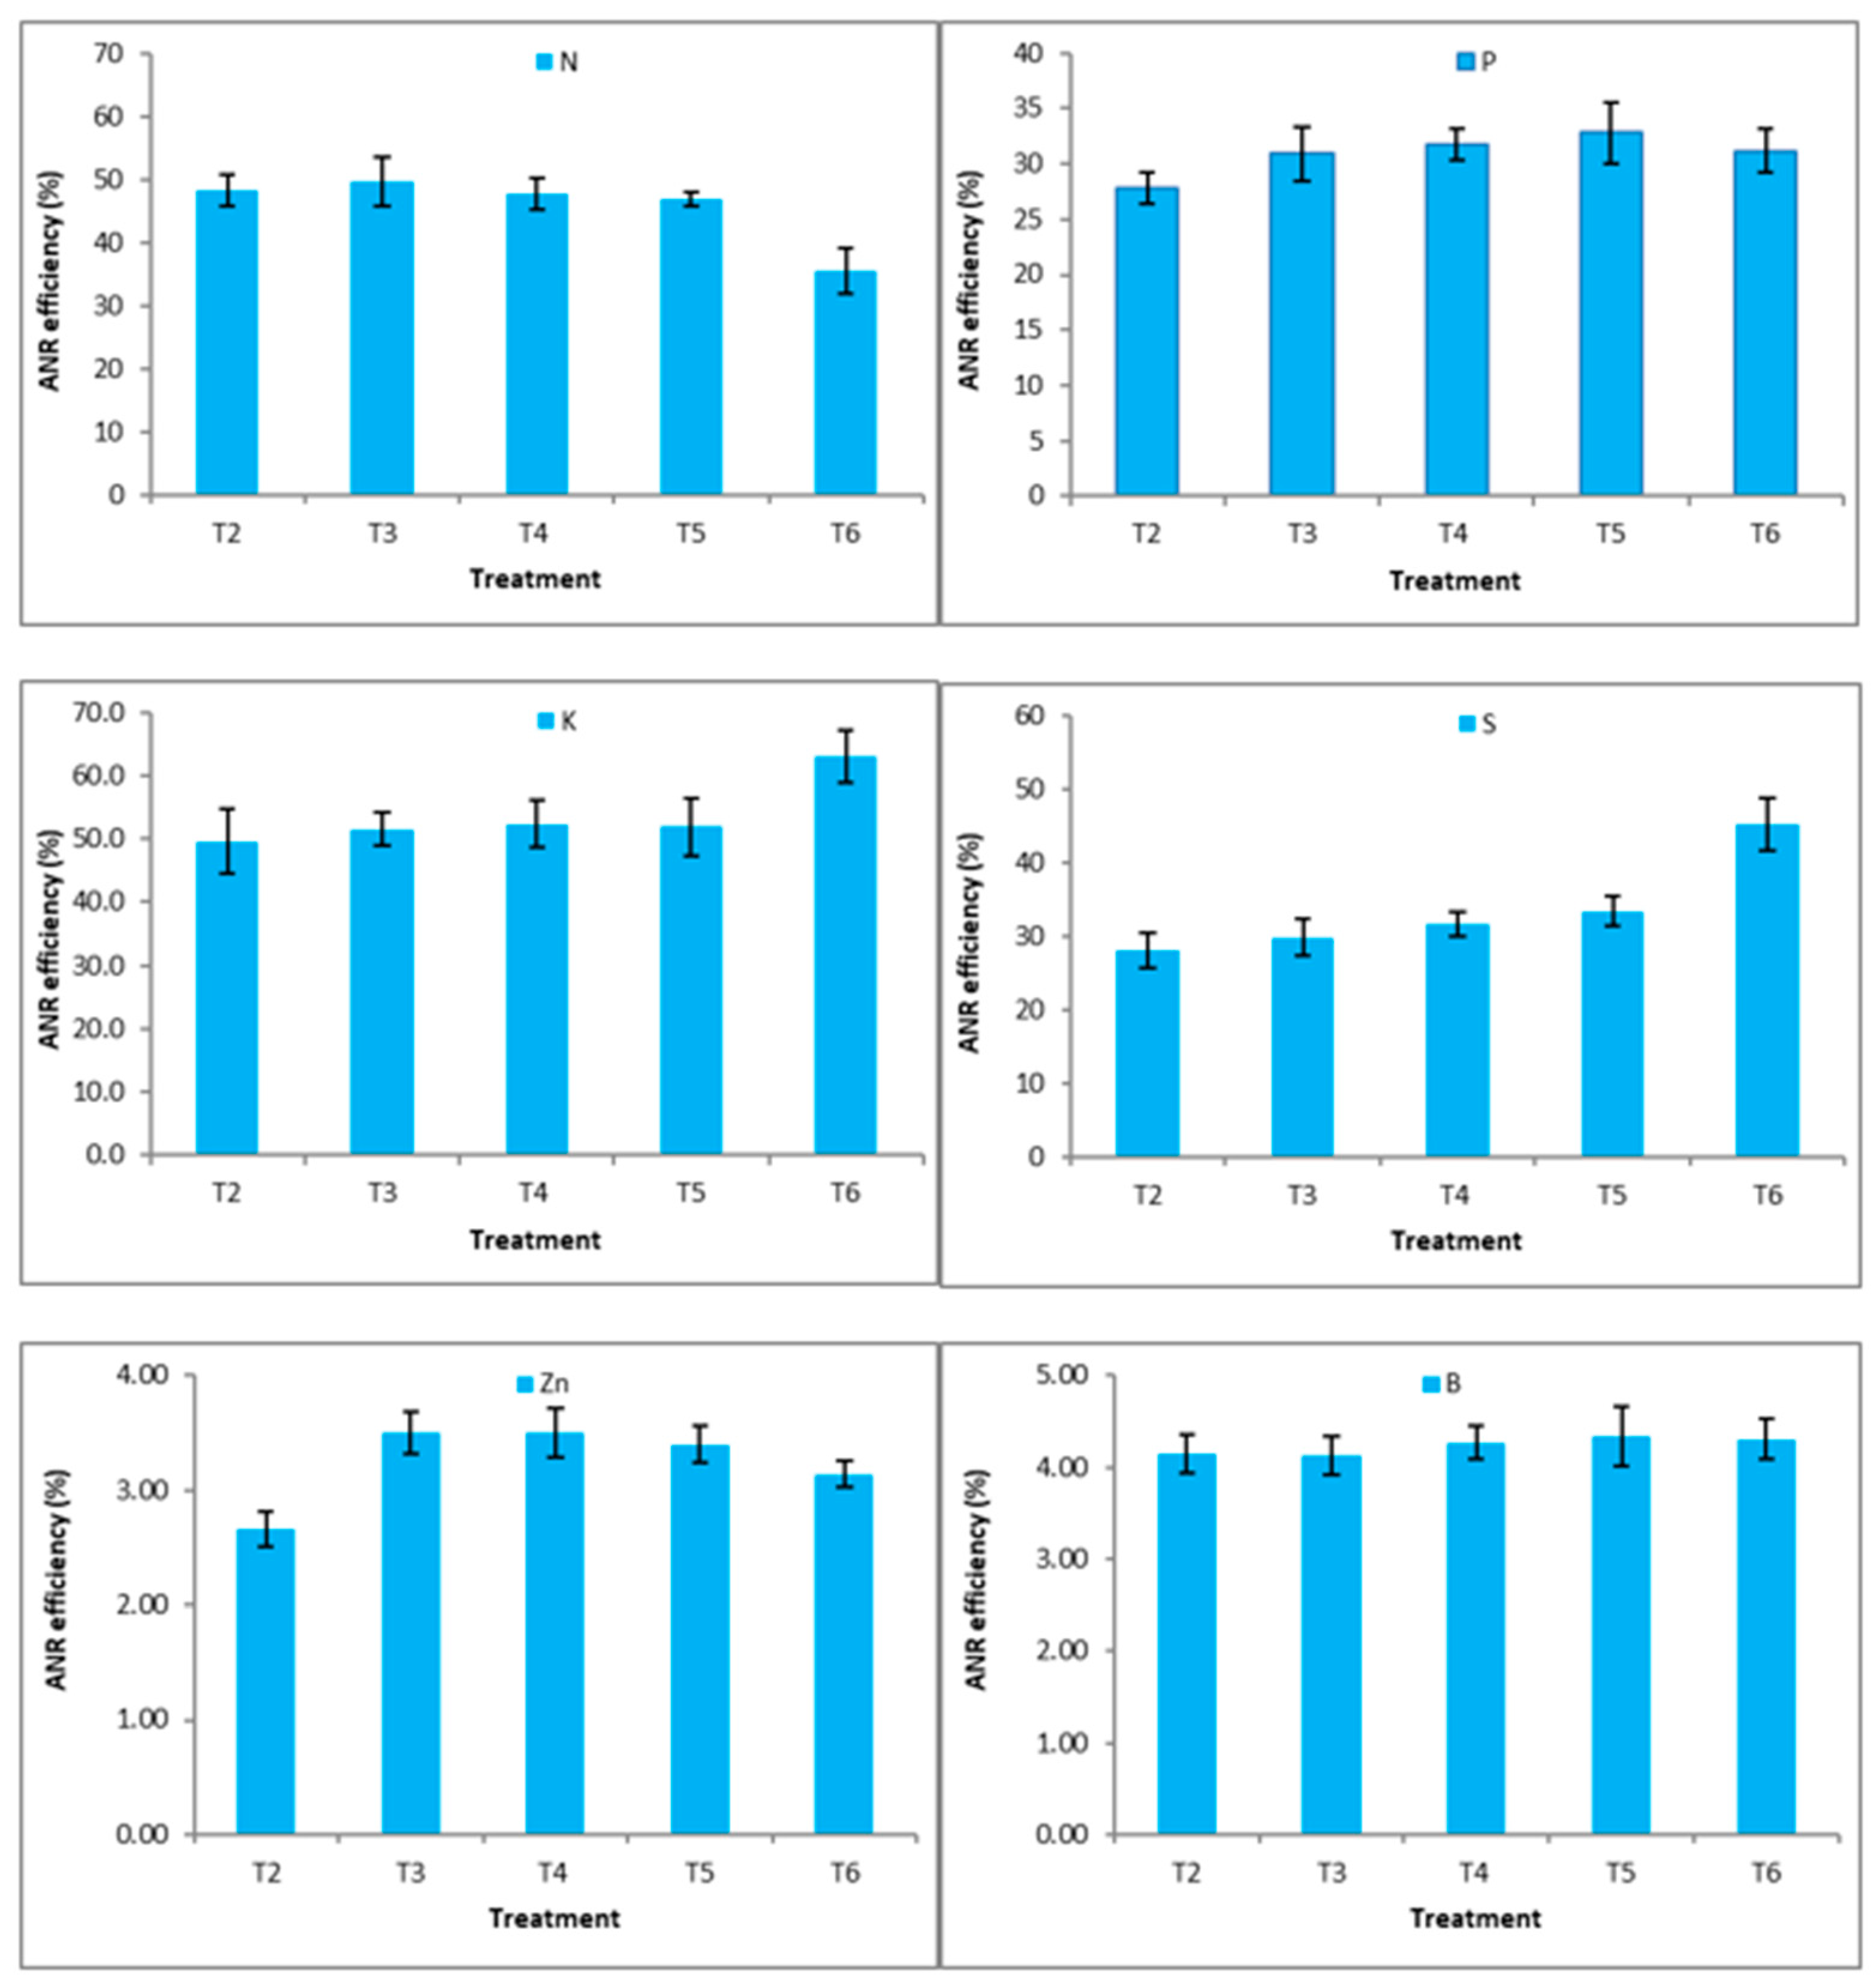
3.6. Total Nutrient Uptake and Apparent Nutrient Recovery Efficiency

Different fertilizer management practices greatly affected nutrientsuptake by the cropping system (Table 16). The treatment with 125% RDF uptake had the highest amount of nutrients, and the treatment with 100% RDF had almost similar results. The highest apparent N recovery efficiency (49.7%) of the system was recorded in the treatment with 75% RDF and the lowest was recorded in FP (Figure 6). The highest P recovery efficiency (32.8%) of the system was recorded in 125% RDF treatment, and the lowest was in 50% RDF. The highest K recovery efficiency (63.0%) of the cropping system was observed in FP and the lowest was in 50% RDF treatment. The apparent S recovery efficiency of the system ranged from 28.1 to 45.2% across the treatments where the highest value was in the FP treatment. In the cropping systems, the apparent Zn recovery efficiency was higher in the 75% RDF treatment and lower in the 50% RDF treatment. The highest apparent B recovery efficiency (4.34%) was recorded in the treatment with 125% RDF, and the lowest was in the 75% RDF treatment.

3.7. Effect of Fertilizer Management Practices on Postharvest Soil Properties

Fertilizer management practices affected the postharvest soil properties after the completion of two cycles of four crop cropping systems (Table 17). The initial soil pH of the experimental field was 8.2, but the postharvest soil pH was slightly reduced after two cycles. After two cycles of four crop-based cropping systems, the OC of soil improved marginally for all treatments, with the greatest value being observed from the treatment of 125% RDF. Similar results were recorded for total N. The available P, K, and S concentrations were slightly increased in treatments of 100% and 125% RDF. The available Ca concentrations in postharvest soil under 100% and 125% were slightly lower than the opening status. However, the available Zn and B concentrations in the postharvest soil were slightly increased over the opening status.

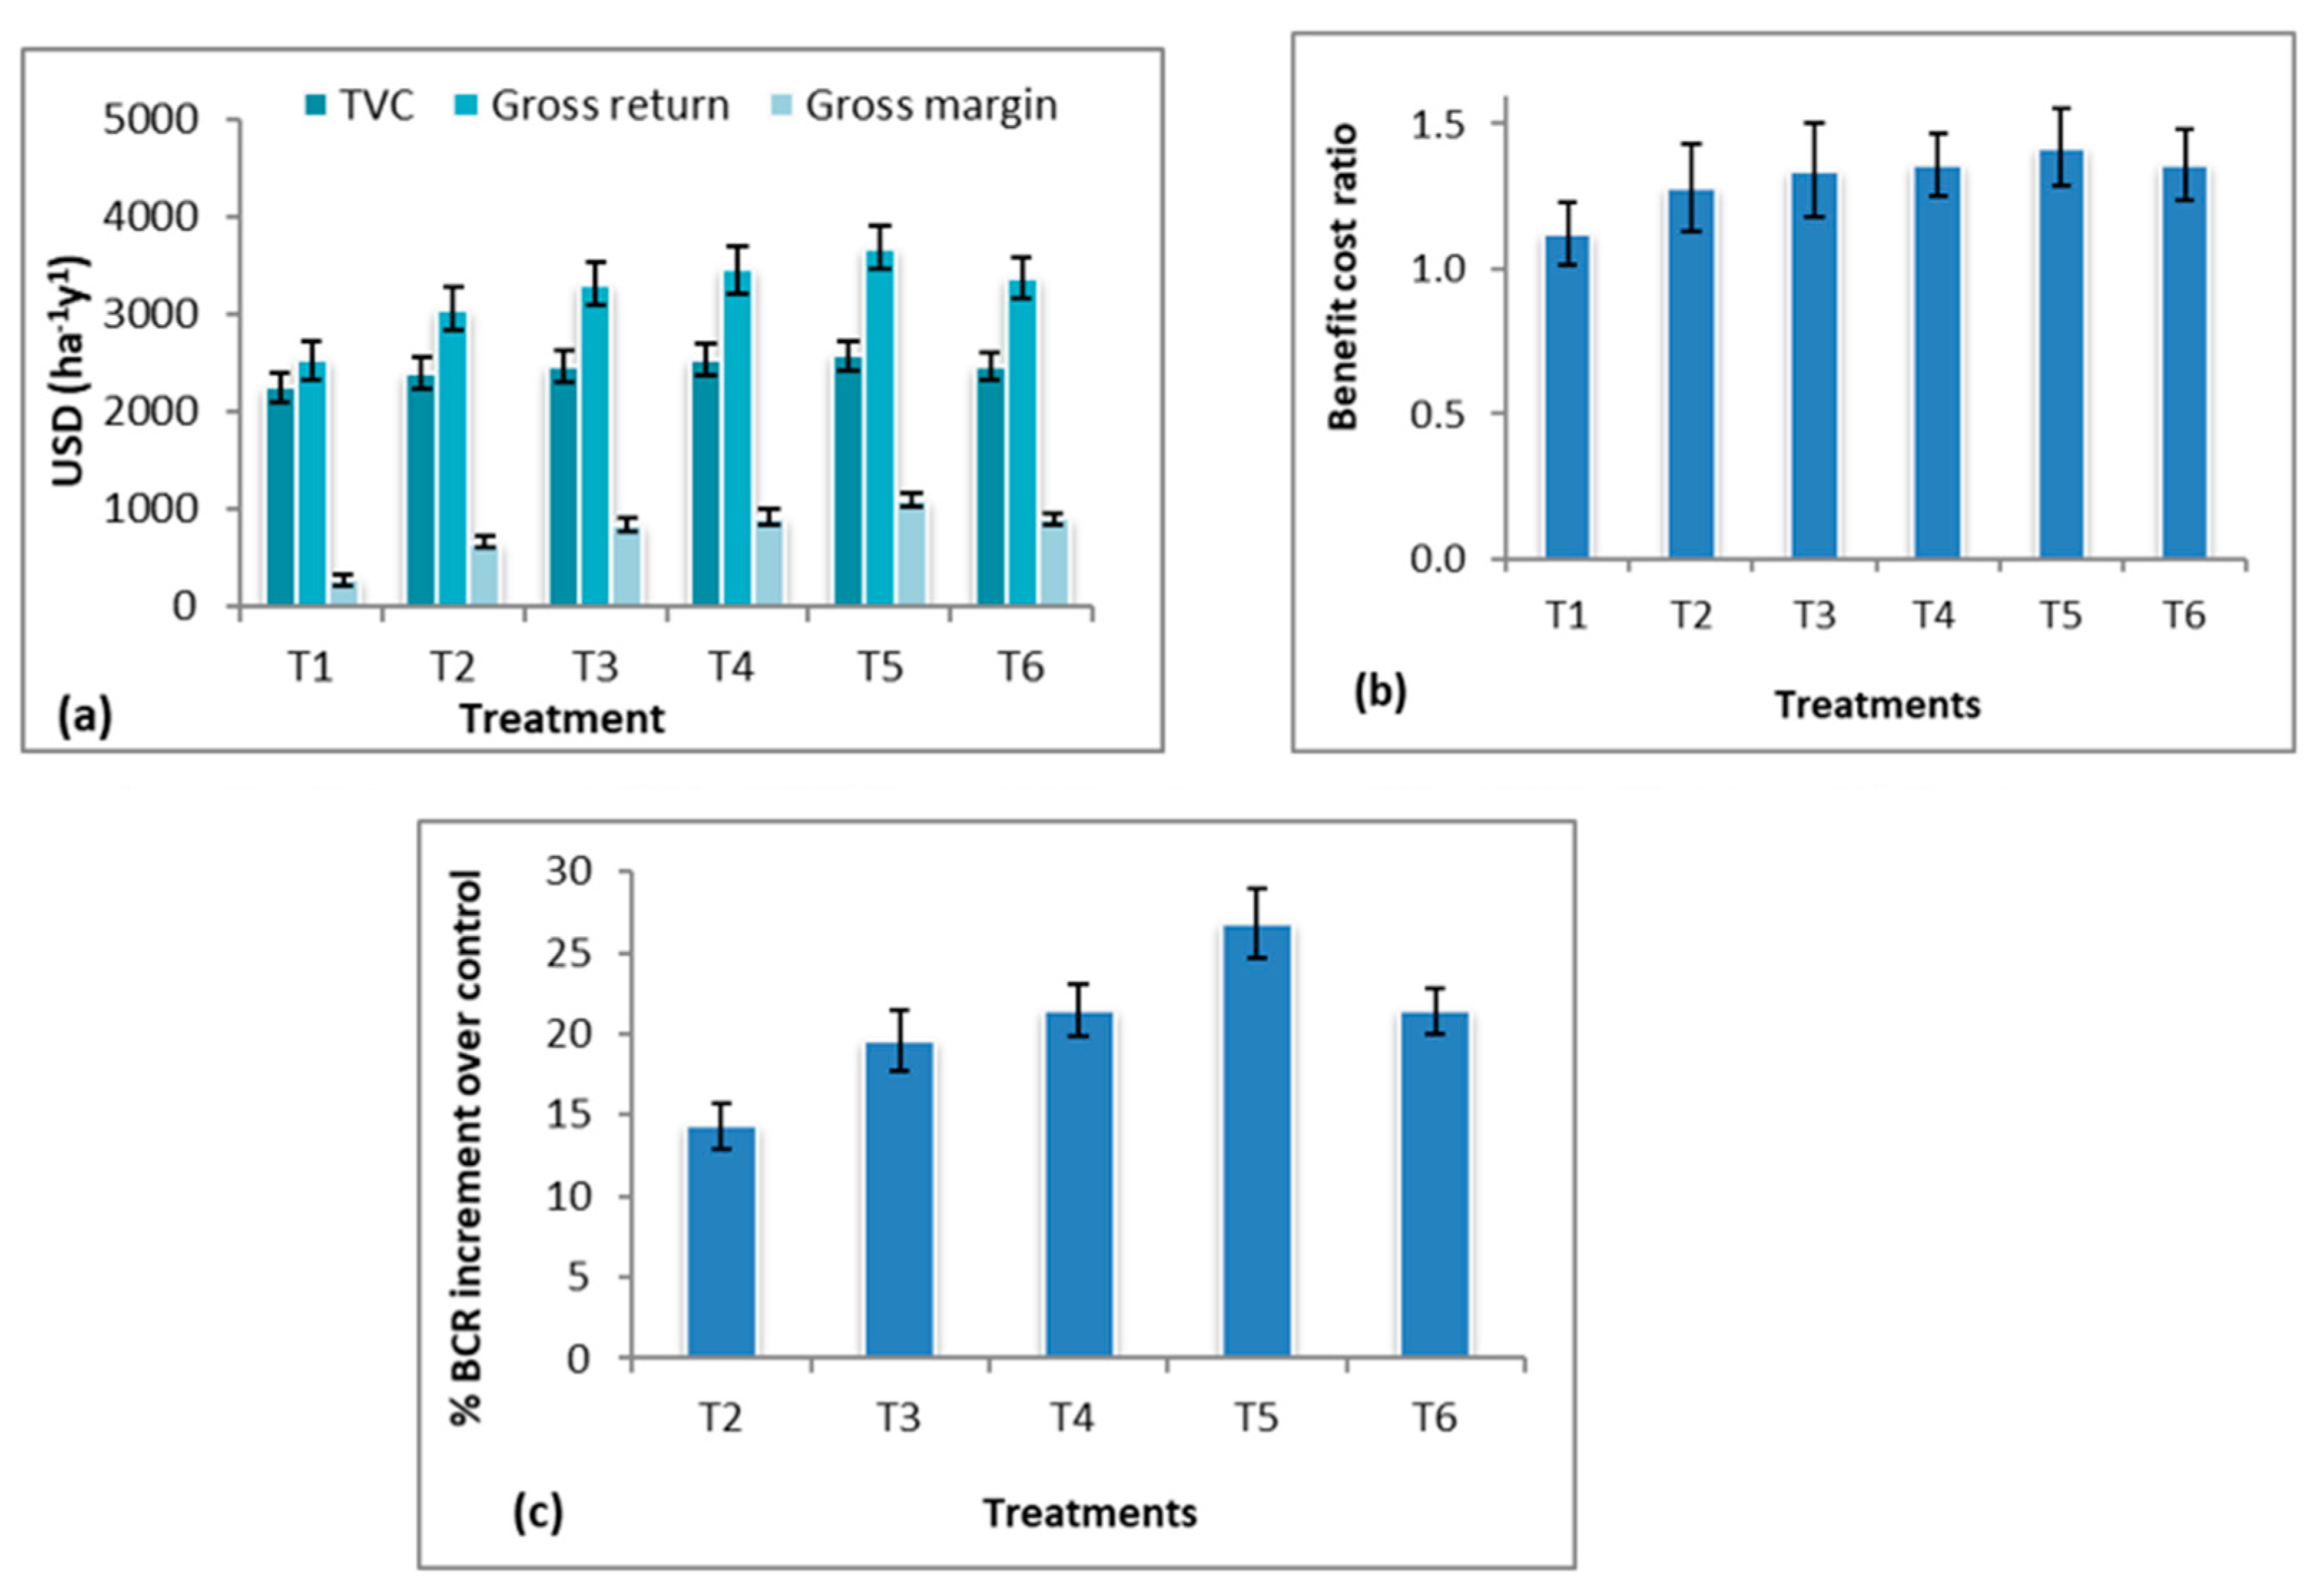
3.8. Cost and Return Analysis

Among the fertilizer management practices, the highest gross return (USD 3684 ha−1 y−1) and gross margin (USD 1106 ha−1 y−1) were obtained in the treatment 125% RDF and the lowest was from the control (T1) (Figure 7a). The second-highest gross return (USD 3460 ha−1 y−1) and highest gross margin (USD 921 ha−1 y−1) were obtained from the treatment 100% RDF. The cost–benefit ratio was the highest (1.42) for the 125% RDF treatment (Figure 7b) and the percent increment of BCR was also higher (26.8%) for the 125% RDF treatment (Figure 7c).

4. Discussion

4.1. Yields and Yield Attributes

The present fertilizer doses recommended for all crops in the cropping system are adequate for achieving yields of crops under the four crops-based system as the yields were significantly similar to the 125% recommendation except for lentil crop. However, for obtaining higher yields, increased fertilizer doses up to 125% of the current recommendation can be used for the individual crop as the increased rate slightly increased the yield of crops in intensive four-crop-based cropping systems. The higher yield might be associated with proper fertilizer dose determination based on soil tests that can maintain soil fertility and simultaneously can enhance uptake by plants. With similar results to this study, Mittal et al. [31] and Singh et al. [32] reported that soil test-based fertilizer applications, which were higher than the recommended doses, improved the yield of rice in rice-based systems. However, these studies are conducted in two or three crop-based cropping systems.
Although the yield components of the crop were not always significantly influenced (increased) by the increased dose of fertilizer, the grain/seed yield was influenced and it was mainly due the cumulative results of all components. It was observed that some of the components of the individual crop had an increasing trend with the application of higher fertilizer doses. However, the overall highest grain yield was always recorded from the highest fertilizer application. The current farmers’ fertilizer practices always had lower yields than the 100% and 125% RDF treatments of all crops, indicating that the current farmer’s practices of fertilizer application are not adequate for the optimum yield in four crop-based systems. Farmers usually do not practice balanced fertilizer doses and usually apply only macronutrients (N, P, K, and S). In Bangladeshi soil, micronutrient (Zn and B) deficiency is increasing day by day, and both nutrient recommendations are very common for most field crops. In our study, increased yield and yield-contributing characters of lentil crops in higher doses of fertilizer (significantly higher than the 100% RDF and FP) might be attributed to the balanced use of fertilizers including micronutrients that farmers usually do not apply in the study area. The current fertilizer recommendation for three crop-based systems for lentil is not adequate for four crop-based systems. From previous studies, many authors already reported that lentil needs an adequate amount of nutrients along with micronutrients for stimulating growth, pod formation, seed development, and seed setting [33]. Islam et al. [34] reported that yield and yield traits of lentil were higher in a balanced dose of inorganic and organic fertilizer. The best results were also achieved with the conjunctive use of micro- and macronutrients. The balanced application of fertilizers favorably influences the plant vigour, morphology, and metabolic processes that ultimately help in acquiring higher crop yields.

4.2. Nutrient Uptake, Productivity Efficiency, and Soil Properties in the System

Improved and balanced fertilization influences the higher acquisition of plant nutrients and increases nutrient uptake efficiency reported in Aus rice [35], Aman rice [36], lentil [36], and mungbean [37,38]. However, the increased accumulation of the nutrients in lentil and mungbean might be related to N2 fixation from nodulation [39,40,41].
Different doses of fertilizer application had varied agronomic efficiency (AE) in terms of N, P, K, S, Zn, and B in Aus, Aman, lentil, and mungbean. The authors of [20] reported that crop and nutrient management practices had varied nutrient use efficiency for crops in the cropping systems. Inconsistent results of AE for all test crops in the current study might be due to the variation of the growing environment, seasonal variability, and fertilizer management practices, which affected the yield of crops [42]. Elia and Conversa [43] reported that AE generally declined with an increase in nutrient supply. The inconsistent apparent nutrient recovery efficiency (ANR) might be related to the nutrient absorption potentials of crops in the cropping systems, which depend on the inherent biology of crops and varied recovery of the applied nutrient.
Fertilizer management practices affected the postharvest soil properties of the system. Soil pH slightly decreased due to the incorporation of different fertilizers in the soil. The increased amount of urea may activate ammonification, which leads to nitrification and results in lower soil pH by releasing extra H+ ions into the soil solution. The percent increment of organic carbon (OC) was the highest in 125% RDF treatments. The total N, P, K, and S contents with available Zn and B content were slightly improved in the 100% and 125% treatments compared to initial fertility. It indicates that the recommended dose and increased dose (125%) could maintain or increase soil fertility in addition to increased yield and nutrient uptake [44]. This improvement might be related to the incorporation of rice straws and legume stovers, which facilitated the improvement of soil microbial activities and biological properties [45,46].

4.3. Sustainable Soil Fertility Management for Intensive Cropping

In the current four crop-based systems study, crops responded to 25% higher fertilizer than the recommended rates of the existing cropping systems indicating that cropping intensification may require an increase in fertilizer application rates. Although cropping intensification is one of the major drivers of increases in national production, the increased rates of fertilizer requirement are a sustainability concern. The cost of chemical fertilizers is increasing worldwide; in addition, the residual effects of fertilizer and its contamination of ecosystems are a serious threat to sustainable agricultural practices and public health. Most chemical fertilizers applied to the soil, particularly nitrogen fertilizers, are leached and can easily pollute underground water. Cropping intensification is urgent for food security in terms of the increasing population, and fertilizers also play a crucial role in increasing food production; however, considering the negative effects of chemical fertilizers on the environment, we need to find the right balance between crop intensification and balance/reduction use with respect to chemical fertilizers. The future of sustainable agriculture greatly depends on soil health. Therefore, integrated nutrient management that will increase productivity as well as maintain soil fertility is very urgent. Fertile soil contains all the major and minor nutrients necessary to sustain basic plant growth and development. Organic matter is the life of the soil and various practices such as incorporating cover crops, using green manure, growing legumes to fix nitrogen from the air, residue retention of crops, using farmyard manure, crop rotation, proper water management, protecting soil from erosion, etc., can help in further improving soil organic matter. On the other hand, soil organic matter and nutrient availability also greatly depend on tillage practice and minimum tillage and no-till soil systems are very important for conserving microbes and nutrients. In addition, fertilizer application timing and methods are extremely important in terms of fertilizer economy and efficiency. The efficiency of fertilizers can increase with the method used, and larger areas can be fertilized with less fertilizer application. The loss of nutrients can be reduced by using slow and controlled release and nano fertilizers. Nitrogen is the most abundant element in the atmosphere, and this can be harnessed for crop use through biological N fixation by leguminous species [47].

5. Conclusions

The productivity and nutrient uptake efficiency of the individual crop, as well as the four crop-based systems in this study, confirmed that current fertilizer recommendations or farmers’ fertilizer practices for three crop-based systems are not adequate. The increased fertilizer use by 25% of the recommended dose (125% RDF) was also economically more profitable with a cost–benefit ratio that is 26.8%, 4.4%, and 4.9% higher over the control, 100% RDF, and FP, respectively. Revisions of farmers’ practices of fertilizer application based on soil test value (100%) and the increased rate of fertilizers (125%) maintained higher yields and improved soil fertility compared to current farmers’ practices or lower doses of nutrients. The increments of soil organic C, total N, available P, K, S, Zn, and B concentrations in soils under 100% and 125% recommended fertilizer doses after two years of the study indicate that, for sustainable soil fertility management and for sustainably increasing cropping intensity, the fertilizer recommendation must be modified for the individual crop by using soil test values or by increasing fertilizer rates at least by 25% of the recommendation for the initial few years. The cropping systems in the four crop-based systems were intensified by the inclusion of lentil and mungbean and it is expected that the use of these leguminous crops on a long-term basis in the systems will increase soil fertility as well as fertilizer use efficiency, which may help further decrease fertilizer requirements.

Author Contributions

Conceptualization, M.A.Q., M.B.A. and M.K.A.; methodology, M.A.Q. and M.B.A.; formal analysis, M.A.Q. and M.K.A.; data curation: M.A.Q., M.B.A., R.A. and M.T.I.; statistical analysis, M.A.Q., M.A.I. and K.K.S.; writing—original draft preparation, M.A.Q.; writing—review and editing, S.A., M.K.A., M.I.K., A.G., K.K.S. and M.A.Q.; visualization: S.A., M.K.A. and M.A.Q.; supervision, M.A.Q., M.K.A., M.I.K., A.G. and M.B.A.; project administration, M.A.Q., M.I.K., A.G. and M.K.A.; funding acquisition, M.I.K. and S.A. All authors have read and agreed to the published version of the manuscript.

Funding

Authors are thankful to the head of administration of the Bangladesh Agricultural Research Institute (BARI) for financial support to conduct this research. Also, the research was partially funded by Taif University Researchers Supporting Project number (TURSP-2020/74), Taif University, Taif, Saudi Arabia.

Data Availability Statement

Data are not publicly available, although the data may be made available upon request from the corresponding author.

Acknowledgments

Authors acknowledge the head of the Soil Science Division under BARI for permitting to use of the laboratory facilities to analyse soil and plant samples. The authors would like to cover their truthful gratitude to the Researchers Supporting Project number (TURSP-2020/74), Taif University, Taif, Saudi Arabia.

Conflicts of Interest

The authors declare no conflict of interest.

References

  1. Jones, D.L.; Cross, P.; Withers, P.J.A.; DeLuca, T.H.; Robinson, D.; Quilliam, R.; Harris, I.M.; Chadwick, D.R.; Edwards-Jones, G. Review: Nutrient Stripping: The Global Disparity between Food Security and Soil Nutrient Stocks. J. Appl. Ecol. 2013, 50, 851–862. [Google Scholar] [CrossRef]
  2. Pretty, J.; Bharucha, J.P. Sustainable Intensification in Agricultural Systems. Ann. Bot. 2014, 114, 1571–1596. [Google Scholar] [CrossRef]
  3. Rahman, M.S.; Islam, M.T.; Ali, M.S. Feasibility of Introducing Four Crops Based Cropping Patterns in Kushtia Area of Bangladesh. Agriculture 2020, 18, 94–102. [Google Scholar] [CrossRef]
  4. Islam, M.A.; Islam, M.J.; Ali, M.A.; Khan, A.S.M.M.R.; Hossain, M.F.; Moniruzzaman, M. Transforming Triple Cropping System to Four Crops Pattern: An Approach of Enhancing System Productivity through Intensifying Land Use System in Bangladesh. Int. J. Agron. 2018, 2018, 7149835. [Google Scholar] [CrossRef]
  5. Barman, A.; Shome, S.; Alam, M.J.; Akhtar, S.; Hossain, M.A. Fertilizer Recommendation for Four Crop Based Cropping Pattern: Potato- Boro- T. Aus-T. Aman Under AEZ-11. Bangladesh Agron. J. 2019, 22, 71–78. [Google Scholar] [CrossRef]
  6. BARC. Fertilizer Recommendation Guide (FRG); Bangladesh Agricultural Research Council: Dhaka, Bangladesh, 2018. [Google Scholar]
  7. Konrad, M.; Kirkby, E.; Kosengarten, H.; Appel, T. Principles of Plant Nutrition, 5th ed.; Kluwer Academic Publishers: Dordrecht, The Netherlands; Boston, MA, USA, 2001; ISBN 1-4020-0008-1. [Google Scholar]
  8. Saleque, M.A.; Abedin, M.J.; Bhuiyan, N.I.; Saman, S.K.; Panaullah, G.M. Long-Term Effects of Inorganic and Organic Fertilizer Sources on Yield and Nutrient Accumulation of Low Land Rice. Field Crops Res. 2004, 86, 53–65. [Google Scholar] [CrossRef]
  9. Yu, Y.; Xue, L.; Yang, L. Winter Legumes in Rice Crop Rotations Reduces Nitrogen Loss, and Improves Rice Yield and Soil Nitrogen Supply. Agron. Sustain. Dev. 2014, 34, 633–640. [Google Scholar] [CrossRef]
  10. Tirol-Padre, A.; Ladha, J.K.; Regmi, A.P.; Bhandari, A.L.; Inubushi, K. Organic Amendments Affect Soil Parameters in Two Long-Term Rice-Wheat Experiments. Soil Sci. Soc. Am. J. 2007, 71, 442–452. [Google Scholar] [CrossRef]
  11. Jonas, N.C.; Justina, N.C.; Franklin, M. Mineral Fertilizers in the Farming Systems of Sub-Saharan Africa. A Review. Agron. Sustain. Dev. 2012, 32, 545–566. [Google Scholar]
  12. Lucrezia, C.; Ronald, V.; Lies, W. Soils and Pulses: Symbiosis for Life; Food and Agriculture Organization of the United Nations: Rome, Italy, 2016; pp. 1–104. [Google Scholar]
  13. Stagnari, F.; Maggio, A.; Galieni, A.; Pisante, M. Multiple Benefits of Legumes for Agriculture Sustainability: An Overview. Chem. Biol. Technol. Agric. 2017, 4, 2. [Google Scholar] [CrossRef]
  14. Urmi, T.A.; Rahman, M.; Islam, M.; Islam, A.; Jahan, N.A.; Mia, A.B.; Akhter, S.; Siddiqui, M.H.; Kalaji, H.M. Integrated Nutrient Management for Rice Yield, Soil Fertility, and Carbon Sequestration. Plants 2022, 11, 138. [Google Scholar] [CrossRef] [PubMed]
  15. Berg, B.; McClaugherty, C. Plant Litter Decomposition Humus Formation. In Carbon Sequestration; Springer: Berlin/Heidelberg, Germany, 2003; p. 296. [Google Scholar]
  16. Sandhu, O.S.; Jat, M.L.; Gupta, R.K.; Thind, H.S.; Sidhu, H.S.; Singh, Y. Influence of Residue Type and Method of Placement on Dynamics of Decomposition and Nitrogen Release in Maize-Wheat-Mungbean Cropping on Permanent Raised Beds: A Litterbag Study. Sustainability 2022, 14, 864. [Google Scholar] [CrossRef]
  17. Tharanathan, R.N.; Mahadevamma, S. Grain Legumes—A Boon to Human Nutrition. Trends Food Sci. Technol. 2003, 14, 507–518. [Google Scholar] [CrossRef]
  18. Kumar, R.; Lal, M.; Naresh, R.K.; Kumar, M.; Yadav, S.; Kumar, R.; Chandra, M.S.; Rajput, P. Influence of Balanced Fertilization on Productivity, Nutrient Use Efficiency and Profitability of Rice in Inceptisol: A Review. Int. J. Curr. Microbiol. Appl. Sci. 2020, 9, 568–590. [Google Scholar] [CrossRef]
  19. Shil, N.C.; Saleque, M.A.; Islam, M.R.; Jahiruddin, M. Soil Fertility Status of Some of the Intensive Crop Growing Areas under Major Agro-Ecological Zones of Bangladesh. Bangladesh J. Agril. Res. 2016, 41, 735–757. [Google Scholar] [CrossRef]
  20. Clark, J. Fertilizer Recommendation Guide; Bangladesh Agricultural Research Council: Dhaka, Bangladesh, 2012. [Google Scholar]
  21. Ahmed, S.; Quddus, A.F.M.R.; Mohiuddin, M.; Islam, M.R.; Hossain, M.A. Performance of Lentil-Mungbean-T.aus Rice-T.aman Rice against existing Cropping Pattern Lentil-Jute-T.Eman Rice in Faridpur Region. Bangladesh J. Agric. Res. 2019, 44, 537–552. [Google Scholar] [CrossRef]
  22. Hossain, M.S.; Alam, S.M.M.; Abida, M.Y.; Hasan, M.K.; Khan, A.S.M.M.R. Productivity and Nutrient Balance of Lentil-Mungbean-T. aus-T. aman Rice Cropping Pattern in High Barind Tract. Bangladesh Agron. J. 2018, 21, 105–115. [Google Scholar] [CrossRef]
  23. Page, A.L.; Miller, R.H.; Keeney, D.R. Methods of Soil Analysis. Part 2, Chemical and Microbial Properties; American Society of Agronomy: Madison, WI, USA, 1982. [Google Scholar]
  24. Gupta, P.K. Soil, Plant, Water and Fertilizer Analysis; Maharana Pratap University of Agriculture & Technology: Rajasthan, India, 2004. [Google Scholar]
  25. Jackson, M.L. Soil Chemical Analysis; Prentice Hall of India Pvt. Ltd.: New Delhi, India, 1973. [Google Scholar]
  26. Fox, R.L.; Olsen, R.A.; Rhoades, H.F. Evaluating the Sulphur Status of Soil by Plant and Soil Test. Soil Sci. Soc. Am. J. 1964, 28, 243–246. [Google Scholar] [CrossRef]
  27. Lindsay, W.; Norvell, W.A. Development of a DTPA soil test for Zn, Fe, Mn and Cu. Soil Sci. Soc. Am. J. 1978, 42, 421–428. [Google Scholar] [CrossRef]
  28. Piper, C.S. Soil and Plant Analysis; Adelaide University Press: Adelaide, Australia, 1964. [Google Scholar]
  29. Baligar, V.C.; Fageria, N.K.; He, Z.L. Nutrient Use Efficiency in Plants. Commun. Soil Sci. Plant Anal. 2001, 32, 921–950. [Google Scholar] [CrossRef]
  30. Analytical Software. Statistix 10; Analytical Software: Tallahassee, FL, USA, 1985. [Google Scholar]
  31. Mittal, S.; Sharma, S.K. Effect of Different Approaches of Fertilizer Recommendations on Yield, Nutrient Uptake and Economics of Rice under SRI. J. Pharmacogn. Phytochem. 2018, 7, 761–765. [Google Scholar]
  32. Singh, V.K.; Gautam, P.; Nanda, G.; Dhaliwal, S.S.; Pramanick, B.; Meena, S.S.; Alsanie, W.F.; Gaber, A.; Sayed, S.; Hossain, A. Soil Test Based Fertilizer Application Improves Productivity, Profitability and Nutrient Use Efficiency of Rice (Oryza sativa L.) under Direct Seeded Condition. Agronomy 2021, 11, 1756. [Google Scholar] [CrossRef]
  33. Bhuiyan, M.A.H.; Mian, M.H.; Islam, M.S.; Islam, M.R. Effects of Integrated Use of Fertilizers and Manure on Yield and Nutrient uptake of T.aus Rice and Mungbean in the Wheat-T.aus Rice/Mungbean-T.aman Rice Cropping Pattern. Bangladesh J. Agric. Res. 2011, 36, 697–710. [Google Scholar] [CrossRef]
  34. Islam, M.; Karim, R.; Oliver, M.H.; Urmi, T.A.; Hossain, A.; Haque, M.M. Impacts of Trace Element Addition on Lentil (Lens culinaris L.) Agronomy. Agronomy 2018, 8, 100. [Google Scholar] [CrossRef]
  35. Bhuiyan, M.A.H.; Mian, M.H.; Islam, M.S.; Islam, M.R. Integration of Organic and Inorganic Fertilizers on Yield of T. Aus and Mungbean in a Wheat-T. Aus/Mungbean-T. Aman Cropping Pattern. Bull. Inst. Trop. Agric. 2010, 33, 63–71. [Google Scholar]
  36. Chaudhary, S.K.; Singh, J.P.; Jhair, S. Effect of Integrated Nitrogen Management on Yield, Quality and Nutrient Uptake of Rice (Oryza sativa L.) under Different Dates of Planting. Indian J. Agron. 2011, 56, 228–231. [Google Scholar]
  37. Howlader, M.I.A.; Rahman, M.M. Integrated Plant Nutrition System for Mungbean-T. Aus-T. Aman Cropping Pattern in the Ganges Tidal Floodplain. Int. J. Innov. Res. 2020, 5, 8–17. [Google Scholar]
  38. Sheikh, M.H.R.; Khan, M.S.; Hannan, A.; Huda, A.; Rahman, M.T. Sustainable Crop Production Retaining Soil Fertility and Environment through Mustard-Mungbean-T.aman Cropping Pattern. J. Soil. Nat. 2009, 3, 10–14. [Google Scholar]
  39. Taliee, A.; Sayadian, K. Effect of Supplemental Irrigation and Plant Nutrient in Chickpea (Dry Farming). J. Agron. Crop Sci. 2000, 2, 12–19. [Google Scholar]
  40. Fatima, K.F.; Ganie, S.A.; Kumar, Y.; Masoodi, T.H.; Shah, A. Effect of Organic and Inorganic Fertilizer Doses on Growth and Yield of Lentil under Cold Arid Conditions of Ladakh. Int. J. Curr. Microbiol. Appl. Sci. 2018, 7, 1449–1455. [Google Scholar] [CrossRef]
  41. Nasir, M.; Khalatbari, M.; Farahani, H.M. Zn-foliar Application Influence on Quality and Quality Features in Phaseolus Vulgaris under Different Levels of N and K Fertilizers. Adv. Environ. Biol. 2011, 5, 839–846. [Google Scholar]
  42. Yadav, S.; Yadav, R.B.; Nanher, A.H.; Tyagi, S. Effect of Nutrient Management on Yield and Nutrient Status on Soil in Mungbean (Vigna radiata L. Wilczek). Trends Biosci. 2015, 8, 406–414. [Google Scholar]
  43. Elia, A.; Conversa, G. Agronomic and Physiological Responses of a Tomato Crop to Nitrogen Input. Eur. J. Agron. 2012, 40, 64–74. [Google Scholar] [CrossRef]
  44. Saha, P.K.; Islam, M.N.; Islam, M.S. Updating Nutrient Requirements for Rice-Based Cropping Systems in Nonsaline Tidal Flood Ecosystem. Int. J. Biol. Pap. 2016, 1, 6–11. [Google Scholar]
  45. Zhang, J.; Li, W.; Zhou, Y.; Ding, Y.; Xu, L.; Jiang, Y.; Li, G. Long-Term Straw Incorporation Increases Rice Yield Stability under High Fertilization Level Conditions in the Rice–Wheat System. Crop J. 2021, 9, 1191–1197. [Google Scholar] [CrossRef]
  46. Blanchart, E.; Villenave, C.; Viallatoux, A.; Barthès, B.; Girardin, C.; Azontonde, A.; Feller, C. Long-Term Effect of a Legume Cover Crop (Mucuna pruriens var. utilis) on the Communities of Soil Macrofauna and Nematofauna under Maize Cultivation, in Southern Benin. Eur. J. Soil Biol. 2005, 42, 136–144. [Google Scholar] [CrossRef]
  47. Garrity, D.P.; Akinnifesi, F.K.; Ajayi, O.C.; Weldesemayat, S.G.; Mowo, J.G.; Kalinganire, A.; Larwanou, M.; Bayala, J. Evergreen Agriculture: A Robust Approach to Sustainable Food Security in Africa. Food Secur. 2010, 2, 197–214. [Google Scholar] [CrossRef]
Figure 1. Effect of nutrient management on agronomic efficiency of N, P, K, S, Zn, and B in Aus rice under the AusAman–Lentil–Mungbean cropping system. T2 = 50% recommended dose of fertilizer (RDF), T3 = 75% RDF, T4 = 100% RDF, T5 = 125% RDF, and T6 = Farmers practice (FP).
Sustainability 14 07194 g001
Figure 2. Effect of nutrient management practices on agronomic efficiency of N, P, K, S, Zn, and B in Aman rice under Aus–Aman–Lentil–Mungbean cropping system. T2 = 50% recommended dose of fertilizer, T3 = 75% RDF, T4 = 100% RDF, T5 = 125% RDF, and T6 = Farmers practice (FP).
Sustainability 14 07194 g002
Figure 3. Effect of nutrient management practices on agronomic efficiency of different nutrients in lentil under AusAman–Lentil–Mungbean cropping system. T2 = 50% recommended dose of fertilizer, T3 = 75% RDF, T4 = 100% RDF, T5 = 125% RDF, and T6 = Farmers practice (FP).
Sustainability 14 07194 g003
Figure 4. Effect of nutrient management practices on agronomic efficiency of N, P, K, S, Zn, and B in mungbean under the AusAman–Lentil–Mungbean cropping system. T2 = 50% recommended dose of fertilizer, T3 = 75% RDF, T4 = 100% RDF, T5 = 125% RDF, and T6 = Farmers practice (FP).
Sustainability 14 07194 g004
Figure 5. Effect of nutrient management practices on rice equivalent yield (a), percent REY increment over control (b), and system production efficiency (c) under the AusAman–Lentil–Mungbean cropping system. T1 = control, T2 = 50% recommended dose of fertilizer (RDF), T3 = 75% RDF, T4 = 100% RDF, T5 = 125% RDF, and T6 = Farmers practice (FP).
Sustainability 14 07194 g005
Figure 6. Effect of nutrient management practices on apparent N, P, K, S, Zn, and B recovery efficiency by the AusAman–Lentil–Mungbean cropping system. T2 = 50% recommended dose of fertilizer (RDF), T3 = 75% RDF, T4 = 100% RDF, T5 = 125% RDF, and T6 = Farmers practice (FP) mANR: apparent nutrient recovery efficiency.
Sustainability 14 07194 g006
Figure 7. Fertilizer management practices on the gross return and gross margin: (a) cost–benefit ratio (b) and % increment of BCR (c) over control treatment under the Aus–Aman–Lentil–Mungbean cropping system. T1 = control, T2 = 50% recommended dose of fertilizer (RDF), T3 = 75% RDF, T4 = 100% RDF, T5 = 125% RDF, and T6 = Farmers practice (FP). Urea = USD = 0.21 kg−1; T.S.P = USD 0.26 kg−1; MoP = USD 0.20 kg−1; Gypsum = USD 0.09 kg−1; Zinc sulphate = USD 1.63 kg−1; Boric acid = USD 1.74 kg−1; Magnesium sulphate = USD 0.81 kg−1; Plowing = USD 16.28/pass; Wage rate = USD 3.49 day−1; Bavistin = USD 2.33/100 g; Sevin = USD 2.79/100 g; Rovral 50 WP = USD 2.16/50 g; Imitaf = USD 3.08/100 g; Lentil seed = USD 0.76 kg−1; Mungbean seed= USD 0.70 kg−1; T. Aus rice seed = USD 0.29 kg−1; T. Aman rice seed = USD 0.29 kg−1. T. Aus rice = USD 0.20 kg−1; T. Aman rice = USD 0.20 kg−1; Lentil = USD 0.69 kg−1; Mungbean = USD 0.58 kg−1. Gross returns calculated on the farm gate price, Jashore, Bangladesh. USD is Unites States currency; 1 USD = 85.9968 BDT. TVC = Total variable cost (Source: www.xe.com/currencyconverter/convert/?Amount=1&From=USD&To=BDT accessed on 24 January 2022).
Sustainability 14 07194 g007
Table 1. Initial soil fertility status of the experimental field.
Parameters and UnitpHCEC Cmol Kg−1Total N
(G Kg−1)
OC
(G Kg−1)
CaKPSZnB
Meq. 100 G−1Mg Kg−1
Results8.26.90.788.5818.00.131415.20.830.15
Critical level 1.2 2.00.1210100.600.20
Interpretationslightly alkaline very lowlowhighlowmediummediummediumlow
Table 2. Weather data (temperatures, humidity, and precipitation) during the trial period.
MonthsAverage Temperature (°C)Average Humidity (%)Precipitation (Mm)
201620172018201620172018201620172018
Min TMax TMin TMax TMin TMax T
January10.423.911.226.68.9324.378.475.769.41.70.00.0
February15.727.113.730.115.430.380.576.866.3150.03.0
March18.630.419.332.520.534.684.476.965.3207.912
April24.637.923.535.722.734.979.878.470.745107207
May23.536.624.936.224.334.282.281.475.9165148167
June25.931.425.334.526.435.184.682.676.5149156101
July26.530.426.332.426.633.587.182.580.4285664430
August25.631.626.933.526.733.984.479.479.8229311113
September22.831.026.534.626.034.681.578.378.26519675
October20.228.024.632.221.832.979.080.174.818.535974
November15.625.717.630.416.831.077.971.670.30.0281.0
December13.022.613.527.111.825.876.271.568.60.03011
Table 3. Fertilizer amount for Aus, Aman, lentil, and mungbean in the pattern.
AusAmanLentilMungbean
T1 = Control (native nutrient)T1 = Control (native nutrient)T1 = Control (native nutrient)T1 = Control (native nutrient)
T2 = * N45P7.5K20S5Zn0.75 B0.25T2 = N45P7.5K25S5Zn0.75 B0.25T2 = N10P10.5K12.5S5Zn1B0.75T2 = N10P10.5K15S6Zn1.5B0.75
T3 = N67.5P11.25K30S7.5Zn1.125B0.375T3 = N67.5P11.25K37.5S7.5Zn1.125B0.375T3 = N15P15.75K18.75S7.5Zn1.5B1.125T3 = N15P15.75K22.5S9Zn2.25B1.125
T4 = N90P15K40S10Zn1.5B0.5T4 = N90P15K50S10Zn1.5B0.5T4 = N20P 21K25S10Zn2B1.5T4 = N20P 21K30S12Zn3B1.5
T5 = N112.5P18.75K50S12.5Zn1.875B0.625T5 = N112.5P18.75K62.5S12.5Zn1.875B0.625T5 = N25P26.25K31.25S12.5Zn2.5B1.875T5 = N25P26.25K37.5S12.5Zn3.75B1.875
T6 = N90P15K30S5Zn1.5T6 = N100P15K30S5Zn1.5T6 = N20P15K20S8Zn2B1.5T6 = N20P15K20S8 Zn2B1.5
* Nutrient amount represents kg ha−1.
Table 4. Nutrient management effect on plant height, florets panicle−1, 1000-grain weight, grain, and straw yields of Aus rice under the Aus–Aman–Lentil–Mungbean cropping system (mean data of two years).
TreatmentPlant Height (Cm)Florets Panicle−11000-Grain Weight (G)Rice Grain Yield
(Kg Ha−1)
Rice Straw Yield
(Kg Ha−1)
T1 = Control87.5 d70.0 c23.6 c3326 c3713 c
T2 = 50% RDF93.8 cd82.2 b25.9 b3950 b4184 b
T3 = 75% RDF96.4 bc83.3 b26.7 b4040 b4359 b
T4 = 100% RDF103 ab89.0 a27.2 ab4156 ab4522 ab
T5 = 125% RDF107 a92.8 a28.9 a4399 a4658 a
T6 = FP99.2 bc88.1 b25.9 b4087 b4384 b
Values within columns with the same letter are not substantially different according to the least significant difference (LSD) test at p ≤ 0.05.
Table 5. Nutrient management practices on nutrient content in grain and straw of Aus rice under the AusAman–Lentil–Mungbean cropping system.
TreatmentsNPKSZnB
G Kg−1
Grain
T1 = Control8.99 c1.682.64 c0.81 d0.0263 d0.0105 e
T2 = 50% RDF9.24 bc1.772.77 bc0.86 c0.0271 cd0.0130 d
T3 = 75% RDF9.54 a–c1.812.81 bc0.89 b0.0276 bc0.0144 c
T4 = 100% RDF9.77 ab1.822.95 ab0.92 b0.0282 ab0.0152 b
T5 = 125% RDF10.0 a1.883.17 a0.94 a0.0289 a0.0162 a
T6 = FP9.56 a–c1.792.92 b0.86 a0.0270 cd0.0151 bc
Straw
T1 = Control5.76 b0.69 e16.4 c1.12 b0.0452 d0.0112 e
T2 = 50% RDF5.87 ab0.72 d17.5 b1.16 ab0.0482 c0.0119 cd
T3 = 75% RDF5.91 ab0.76 c17.6 b1.18 ab0.0485 c0.0123 c
T4 = 100% RDF5.99 a0.79 b17.9 ab1.20 ab0.0497 ab0.0130 b
T5 = 125% RDF6.03 a0.85 a18.2 a1.23 a0.0503 a0.0143 a
T6 = FP5.88 ab0.77 c17.5 b1.21 ab0.0489 ac0.0115 de
Values within columns with the same letter are not substantially different according to the least significant difference (LSD) test at p ≤ 0.05.
Table 6. Nutrient management practices on total nutrient uptake by Aus rice (grain + straw) under the AusAman–Lentil–Mungbean cropping system.
TreatmentNPKSZnB
Kg Ha−1
T1 = Control51.3 c8.14 c69.6 c6.85 c0.254 c0.077 d
T2 = 50% RDF61.2 b10.0 b84.1 b8.22 b0.309 b0.101 c
T3 = 75% RDF64.8 ab10.7 ab88.2 b8.78 ab0.324 b0.113 b
T4 = 100% RDF67.7 ab11.1ab93.2 ab9.21 ab0.342 ab0.122 b
T5 = 125% RDF72.2 a12.2 a98.7 a9.88 a0.361 a0.138 a
T6 = FP65.8 ab10.8 ab89.0 b8.90 ab0.327 ab0.114 b
Values within columns with the same letter are not substantially different according to the least significant difference (LSD) test at p ≤ 0.05.
Table 7. Nutrient management practices on plant height, florets panicle−1, grain, and straw yields of Aman rice under the AusAman–Lentil–Mungbean cropping system (mean data of two years).
TreatmentPlant Height (Cm)Florets Panicle−11000-Grain Weight (G)Rice Grain Yield
(Kg Ha−1)
Rice Straw Yield
(Kg Ha−1)
T1 = Control88.6 c72.8 c17.4 b2092 d2200 e
T2 = 50% RDF97.5 b86.9 b18.3 a2388 c2459 d
T3 = 75% RDF100 b98.7 b18.7 a2584 bc2693 c
T4 = 100% RDF104 a107 a18.8 a2765 ab2940 ab
T5 = 125% RDF106 a116 a19.0 a2897 a3088 a
T6 = FP98.9 b92.3 b18.7 a2700 b2851 b
Values within columns with the same letter are not substantially different according to the least significant difference (LSD) test at p ≤ 0.05.
Table 8. Nutrient management practices on nutrient content in grain and straw of Aman rice under the AusAman–Lentil–Mungbean cropping system.
TreatmentsNPKSZnB
G Kg−1
Grain
T1 = Control11.2 c2.21 b2.430.950.0245 b0.0105 b
T2 = 50% RDF11.7 bc2.41 ab2.560.970.0253 ab0.0112 b
T3 = 75% RDF11.9 ab2.63 ab2.620.970.0258 ab0.0121 ab
T4 = 100% RDF12.1 ab2.67 ab2.680.980.0265 a0.0137 ab
T5 = 125% RDF12.3 a2.80 a2.740.990.0269 a0.0149 a
T6 = FP11.8 ab2.67 ab2.610.960.0256 ab0.0138 ab
Straw
T1 = Control6.71 b0.67421.2 d1.10 b0.0495 d0.0092 e
T2 = 50% RDF6.79 b0.67922.7 c1.15 ab0.0503 d0.0101 d
T3 = 75% RDF6.85 ab0.68123.4 bc1.17 ab0.0514 c0.0115 ab
T4 = 100% RDF6.93 ab0.68923.9 ab1.19 a0.0529 ab0.0110 bc
T5 = 125% RDF7.11 a0.69324.5 a1.21 a0.0531 a0.0121 a
T6 = FP6.82 ab0.68423.3 bc1.19 a0.0520 bc0.0103 cd
Values within columns with the same letter are not substantially different according to the least significant difference (LSD) test at p ≤ 0.05.
Table 9. Nutrient management practices on total nutrient uptake by Aman rice (grain + straw) under the AusAman–Lentil–Mungbean cropping system.
TreatmentsNPKSZnB
Kg ha−1
T1 = Control38.1 d6.09 c51.7 e4.41 d0.159 d0.031 d
T2 = 50% RDF44.6 c7.44bc61.9 d5.14 cd0.183 cd0.036 cd
T3 = 75% RDF49.2 bc8.07 b69.8 c5.65 bc0.205 bc0.042 bc
T4 = 100% RDF54.0 ab9.03 ab77.7 ab6.21 ab0.228 ab0.046 ab
T5 = 125% RDF57.6 a10.2 a83.6 a6.68 a0.242 a0.052 a
T6 = FP51.3 b9.42 a73.5 bc5.98 ab0.217 ab0.043 b
Values within columns with the same letter are not substantially different according to the least significant difference (LSD) test at p ≤ 0.05.
Table 10. Nutrient management practices on plant height, pods plant−1, 1000-seed weight, seed and stover yields of lentil under the AusAman–Lentil–Mungbean cropping system (average data of two years).
TreatmentsPlant Height (Cm)Pods Plant−11000-Seed Weight (G)Seed Yield
(Kg Ha−1)
Stover Yield
(Kg Ha−1)
T1 = Control33.3 b45.5 d21.1 b1000 d1626 d
T2 = 50% RDF34.3 b54.2 c21.5 ab1347 c1963 c
T3 = 75% RDF35.7 b63.8 b22.0 a1467 bc2252 b
T4 = 100% RDF37.5 ab64.6 b22.0 a1543 b2405 b
T5 = 125% RDF40.6 a73.7 a22.1 a1716 a2600 a
T6 = FP36.6 ab63.4 b21.6 ab1503 b2442 b
Values within columns with the same letter are not substantially different according to the least significant difference (LSD) test at p ≤ 0.05.
Table 11. Nutrient management practices on nutrient content in seed and stover of lentil under the AusAman–Lentil-Mungbean cropping system.
TreatmentsNPKSZnB
G Kg−1
Seed
T1 = Control37.8 c4.30 d5.60 e1.40 d0.0663 e0.0331 f
T2 = 50% RDF41.2 b4.80 c5.90 d1.60 cd0.0687 d0.0349 d
T3 = 75% RDF41.8 ab5.00 c6.30 c1.70 bc0.0705 c0.0358 c
T4 = 100% RDF42.4 ab5.40 b6.80 b1.90 ab0.0723 b0.0380 b
T5 = 125% RDF43.1 a5.90 a7.30 a2.10 a0.0731 a0.0392 a
T6 = FP40.9 b4.90 c6.50 c1.60 cd0.0659 e0.0335 e
Stover
T1 = Control11.4 c5.60 d4.80 d2.70 d0.0428 c0.0302 d
T2 = 50% RDF12.0 bc6.10 c5.30 c3.10 c0.0431 c0.0316 c
T3 = 75% RDF12.5 bc6.70 b5.70 bc3.20 bc0.0452 b0.0322 c
T4 = 100% RDF13.2 ab7.10 ab6.00 ab3.50 ab0.0464 a0.0334 b
T5 = 125% RDF13.8 a7.50 a6.40 a3.60 a0.0470 a0.0347 a
T6 = FP12.1 bc6.20 c5.60 bc3.30 a–c0.0431 c0.0308 d
Values within columns with the same letter are not substantially different according to the least significant difference (LSD) test at p ≤ 0.05.
Table 12. Nutrient management practices on total nutrient uptake by lentil (seed + stover) under AusAman–Lentil–Mungbean cropping system.
TreatmentNPKSZnB
Kg Ha−1
T1 = Control56.3 d13.4 e13.3 d5.77 e0.136 d0.074 d
T2 = 50% RDF79.2 c18.5 d18.3 c8.27 d0.177 c0.109 c
T3 = 75% RDF90.8 bc22.5 c22.2 bc9.80 cd0.207 b0.126 bc
T4 = 100% RDF101 ab26.4 ab25.7 ab11.8 ab0.231 ab0.144 ab
T5 = 125% RDF110 a29.4 a29.2 a13.0 a0.248 a0.158 a
T6 = FP92.9 b23.2 bc24.1 b10.8 bc0.210 b0.129 bc
Values within columns with the same letter are not substantially different according to the least significant difference (LSD) test at p ≤ 0.05.
Table 13. Nutrient management practices on plant height, pods plant−1, 1000-seed weight, seed, and stover yields of mungbean under AusAman–Lentil–Mungbean cropping system.
TreatmentsPlant Height (Cm)Pods Plant−11000-Seed Weight (G)Seed Yield
(Kg Ha−1)
Stover Yield
(Kg Ha−1)
T1 = Control42.5 c17.8 c43.2 c1203 c1607 c
T2 = 50% RDF50.8 b26.6 b45.2 bc1367 bc1850 b
T3 = 75% RDF53.6 b25.9 b46.3 ab1501 b2006 b
T4 = 100% RDF56.9 a29.0 ab46.9 ab1548 ab2156 a
T5 = 125% RDF58.8 a31.0 a48.7 a1650 a2253 a
T6 = FP53.9 b26.9 b46.4 ab1499 b2081 b
Values within columns with the same letter are not substantially different according to the least significant difference (LSD) test at p ≤ 0.05.
Table 14. Nutrient management practices on nutrient content in seed and stover of mungbean under the AusAman–Lentil–Mungbean cropping system.
TreatmentsNPKSZnB
G Kg−1
Seed
T1 = Control32.3 c3.40 d12.3 c1.90 d0.023 e0.0266 f
T2 = 50% RDF34.6 b3.70 bc12.7 b2.10 cd0.0242 d0.0287 d
T3 = 75% RDF35.1 ab3.60 cd12.8 ab2.20 bc0.0254 c0.0291 c
T4 = 100% RDF35.5 ab3.90 ab12.9 ab2.40 ab0.0261 b0.0308 b
T5 = 125% RDF35.9 a4.10 a13.0 a2.60 a0.0275 a0.0313 a
T6 = FP32.5 c3.70 bc12.7 b2.20 bc0.0238 d0.0269 e
Stover
T1 = Control13.5 d2.10 c13.4 b1.50 c0.0224 d0.0272 c
T2 = 50% RDF14.5 cd2.20 c13.8 ab1.70 bc0.0236 c0.0289 bc
T3 = 75% RDF15.1 bc2.30 bc13.9 ab1.80 ab0.0245 b0.0275 c
T4 = 100% RDF15.7 ab2.50 ab14.1 a1.90 ab0.0249 ab0.0310 ab
T5 = 125% RDF16.2 a2.60 a14.3 a2.00 a0.0253 a0.0328 a
T6 = FP14.2 cd2.30 bc13.8 ab1.90 ab0.0227 d0.0280 bc
Values within columns with the same letter are not substantially different according to the least significant difference (LSD) test at p ≤ 0.05.
Table 15. Nutrient management practices on total nutrient uptake by mungbean (seed + stover) under the Aus–Aman–Lentil–Mungbean cropping system.
TreatmentsNPKSZnB
Kg Ha−1
T1 = Control60.7 b7.46 c36.2 b4.71 c0.0637 c0.0753 c
T2 = 50% RDF74.3 ab9.15 bc42.9 ab6.05 bc0.0767 bc0.0930 bc
T3 = 75% RDF82.9 a10.0 a–c47.1 ab6.92 a–c0.0870 ab0.0990 bc
T4 = 100% RDF88.8 a11.4 ab50.3 a7.81 ab0.0940 ab0.1147 ab
T5 = 125% RDF95.7 a12.6 a53.7 a8.87 a0.1027 a0.1260 a
T6 = FP78.4 ab10.3 ab47.8 ab7.29 ab0.0833 a–c0.0990 bc
Values within columns with the same letter are not substantially different according to the least significant difference (LSD) test at p ≤ 0.05.
Table 16. Nutrient management practices on nutrient uptake by the AusAman–Lentil–Mungbean cropping system.
TreatmentsNPKSZnB
Kg Ha−1
T1 = Control206 d35.1 d171 d21.7 d0.614 d0.256 d
T2 = 50% RDF259 c45.1 c207 c27.6 c0.747 c0.339 c
T3 = 75% RDF288 bc51.8 bc227 bc31.1 bc0.824 bc0.380 bc
T4 = 100% RDF311 ab58.0 ab247 ab35.0 ab0.896 ab0.427 ab
T5 = 125% RDF335 a64.6 a265 a38.4 a0.955 a0.473 a
T6 = FP288 bc53.8 b234 bc33.0 bc0.838 bc0.385 bc
Values within columns with the same letter are not substantially different according to the least significant difference (LSD) test at p ≤ 0.05.
Table 17. Fertilizer management practices on postharvest soil physical and chemical properties.
TreatmentsPhOC
(G Kg−1)
Total N
(G Kg−1)
CaKPSZnB
Meq. 100 G−1Mg Kg−1
Opening8.28.580.7818.00.1314.014.70.810.15
T1 = Control8.03 a9.53 d0.84 c17.5 a0.12 ab14.1 b14.3 b0.80 d0.13 c
T2 = 50% RDF7.93 ab9.67 bc0.87 b17.2 bc0.11 b14.0 b14.9 a0.83 bc0.14 bc
T3 = 75% RDF7.80 b9.78 c0.87 b17.3 b0.11 b15.0 a15.0 a0.83 bc0.16 ab
T4 = 100% RDF7.90 ab10.0 a0.88 b17.2 bc0.14 b15.0 a14.9 a0.82 c0.15 a–c
T5 = 125% RDF7.76 b10.2 a0.90 a17.1 c0.15 a15.2 a15.0 a0.84 a0.17 a
T6 = FP7.76 b9.9 bc0.89 ab17.2 bc0.12 ab15.0 a14.9 a0.83 bc0.14 bc
Values within columns with the same letter are not substantially different according to the least significant difference (LSD) test at p ≤ 0.05.
Publisher’s Note: MDPI stays neutral with regard to jurisdictional claims in published maps and institutional affiliations.

