1. Introduction
The internet is a phenomenon that has risen in the past 50 years as a global network of interconnected computers. It influences individuals’ lives in many ways, both in their free time or at work, when buying goods and services, seeking information, or communicating online with friends and family [
1].
According to the International Telecommunication Union [
2], 63% of the world’s population was using the internet in 2021, with 90% of users hailing from developed countries. The number of individuals living in households with internet access has doubled in the past 10 years, from 33% in 2010 up to 65.7% by the end of 2020 worldwide.
Internet services have become universally available to the general public, costwise as well as in terms of accessibility. In the European Union, there 90% of users accessed the internet at least once in 2021, with 92% of households having internet access, which is 20% higher than it was in 2011. According to the Eurostat database repository [
3], among the EU member states, Luxembourg and the Netherlands have the highest rate of households connected to the internet, with an impressive 99% in 2021, opposed to Bulgaria with the lowest proportion of only 84%. However, Bulgaria had the highest growth in the past 5 years, by 20%, along with Romania, Greece, and Slovenia, all with increases between 15% and 17% in 2021 compared to 2016. This increase in internet connectivity is one of the main reasons for selecting these four countries (Bulgaria, Romania, Greece, and Slovenia) for further analysis in our study.
If we look at the United Nations 2030 Agenda’s Sustainable Development Goals (SDGs) [
4], SDG 9—Industry, innovation and infrastructure, Target 9.C: Universal access to information and communications technology; indicator: households with high-speed internet connection in 2020, we can observe that there is a rate of 59.3% of households with high-speed internet in the EU [
5]. This indicator measures the share of households with very high-capacity fixed internet connections, and we can observe that Romania has had the highest growth among the four countries analyzed in this study, reaching an impressive 75.9% of all households. Romainia is followed by Slovenia with 65.6% and Bulgaria with 42.9%. Greece, however, has the lowest percentage of high-speed internet-connected households, with only 10.2%. The globally increasing use of the internet in the past decade has led to the formulation of such development goals from the necessity of universal access to information, since the internet impacts all aspects of society, from social life to politics, economy and, especially, education.
Many aspects of a person’s life have been associated with their level of education, from their choice of job, income, place of residence, to their lifestyle, hobbies, and how they spend their free time. Education contributes to the foundation of development and individual evolution. It basically improves individuals’ quality of life and their understanding of the world which, in turn, benefits society, increases productivity, and leads to technological advances [
6].
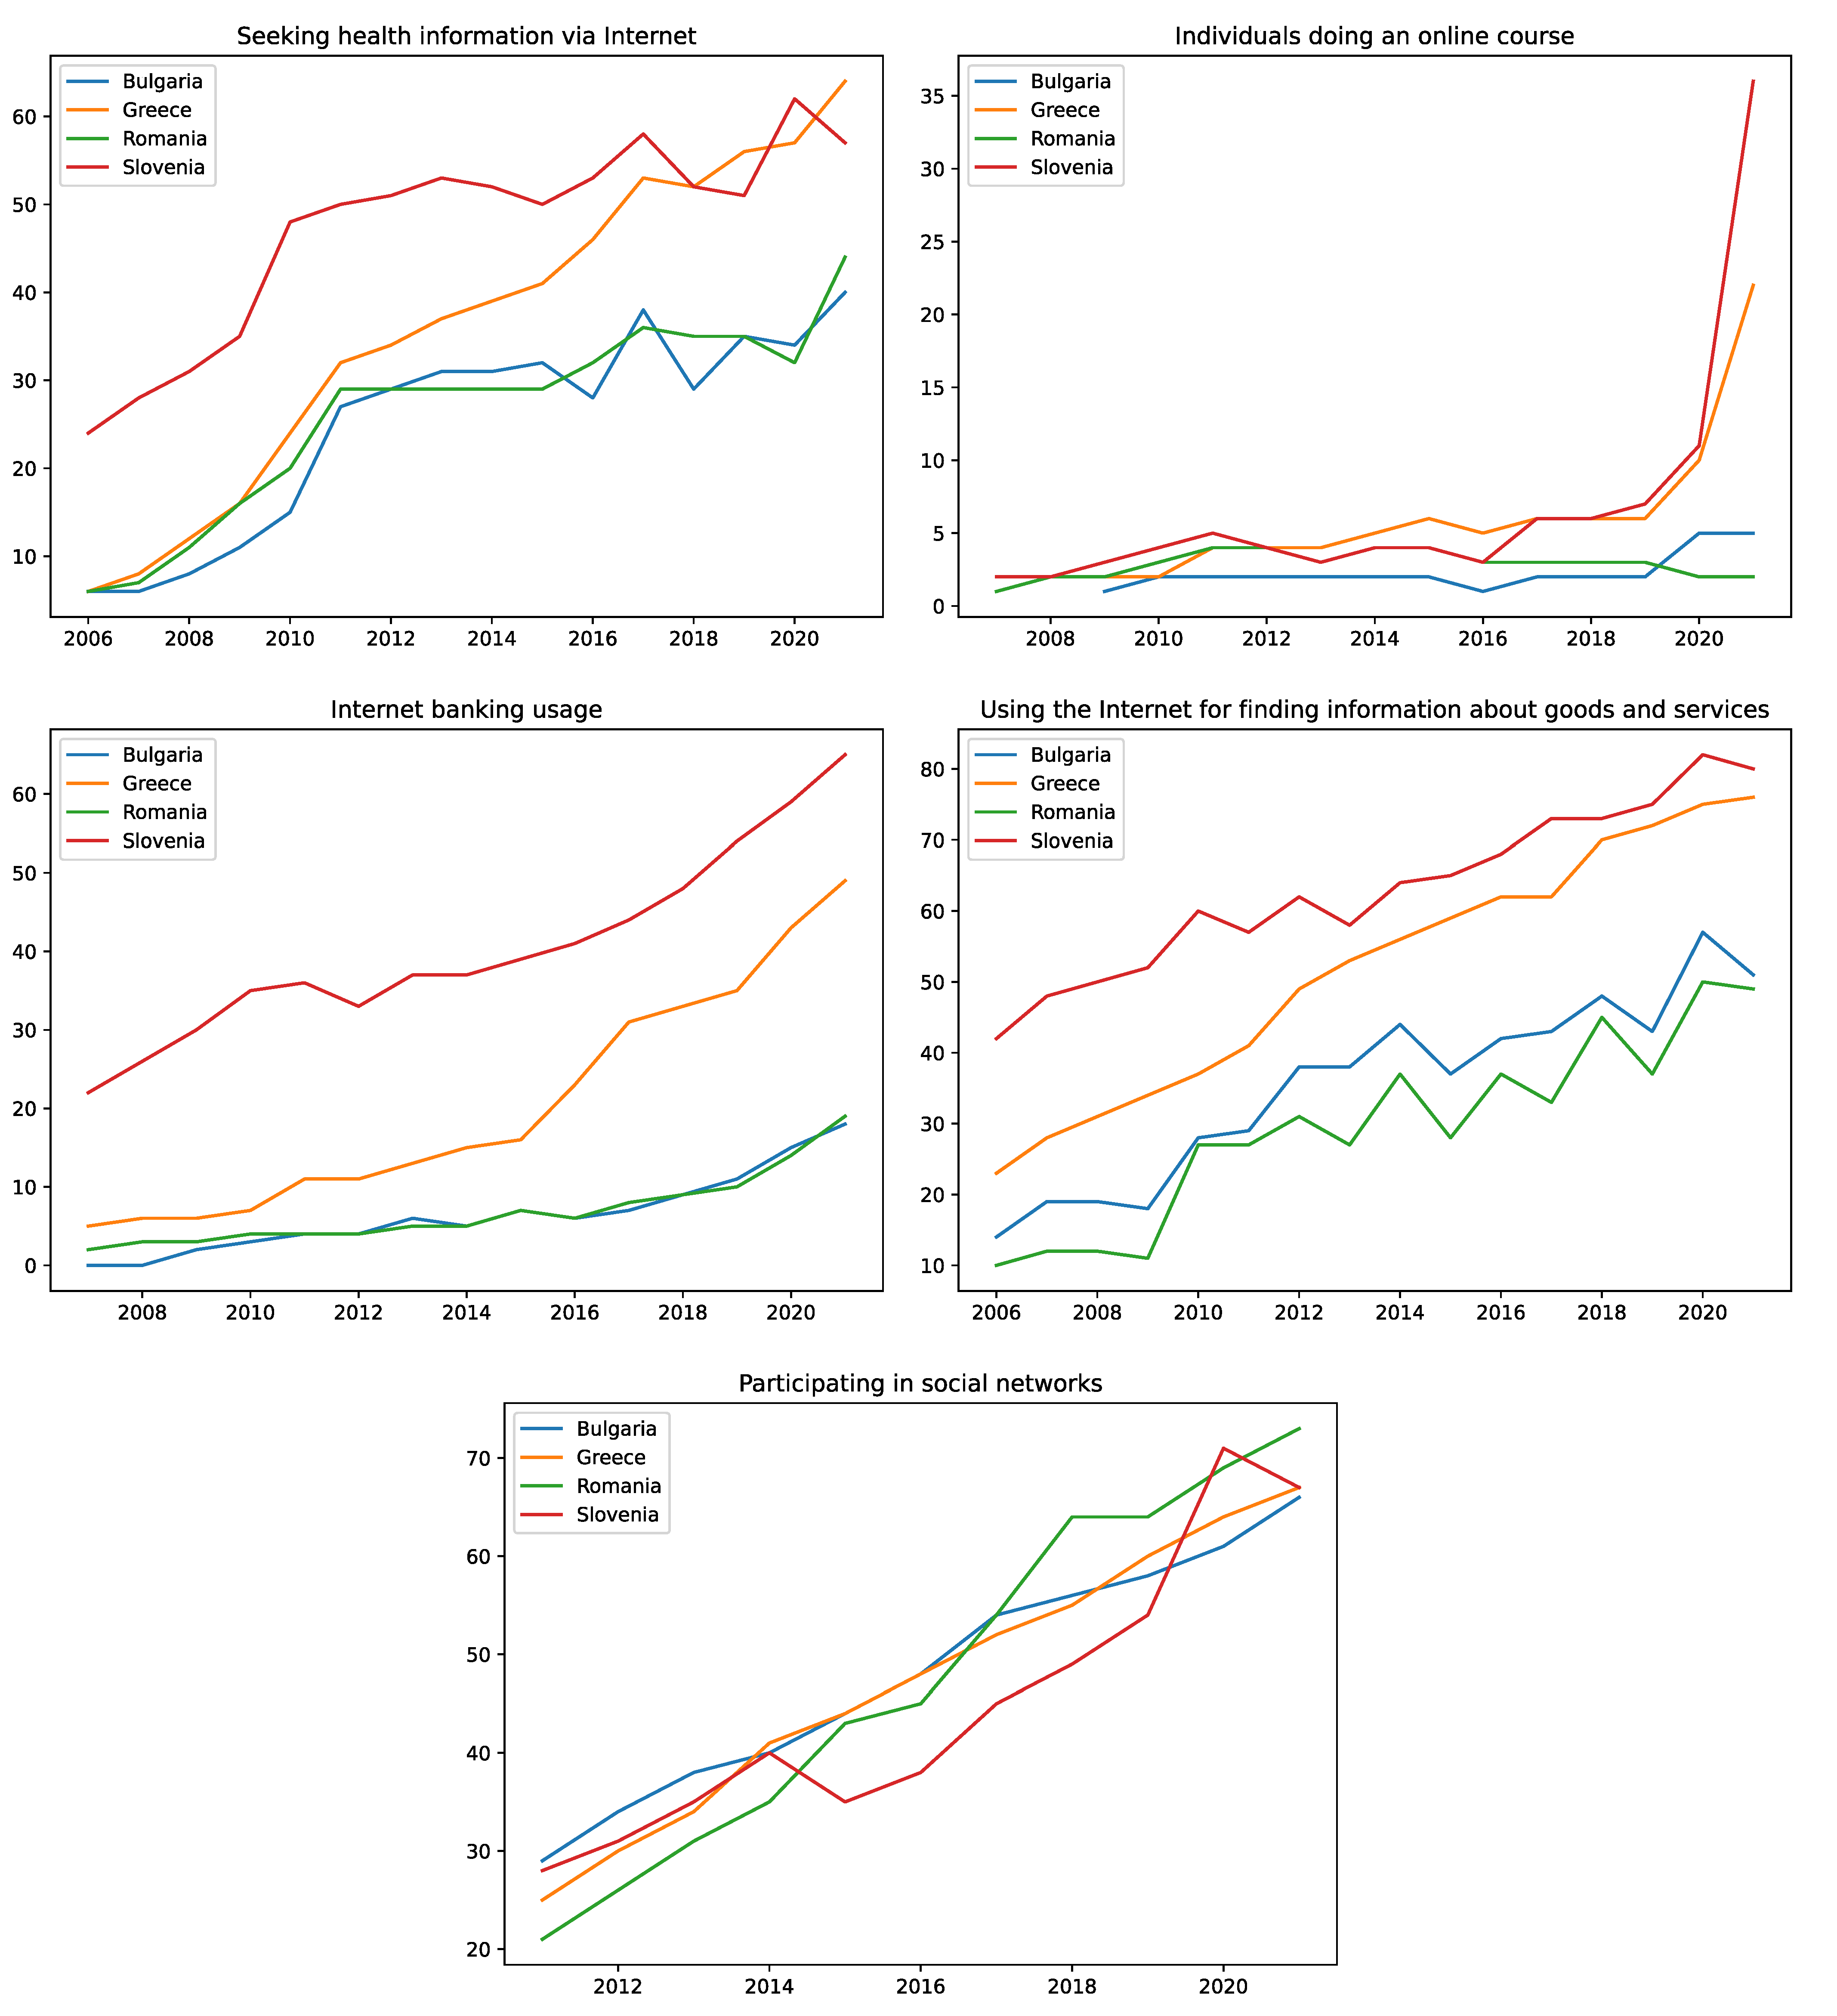
For our study, we have selected the following five scenarios that people take interest in while online: seeking health information, taking an online course, internet banking, finding information about goods and services, and participating in social networks. We chose these five scenarios of internet usage because we consider them to be an online reflection of some of the main aspects of an individual’s life, namely: health—seeking health information [
7,
8], education—taking an online course [
9], financial services—internet banking [
10], shopping—finding information about goods and services [
11], and spending free time—participating in social networks [
12].
Numerous studies have been conducted on various demographic variables, such as age, gender, social status, or income, in connection with internet usage, but there is a lack of studies on the influence of education and residential area on internet usage, especially in the European countries. These aspects may not necessarily be the most important, but they are definitely worth studying; thus, we selected these two variables for our analysis.
Because of the fast growth in their internet connectivity in the last 5 years, we chose the following four European countries: Bulgaria, Greece, Romania, and Slovenia. The connection between the four countries is not only a geographical one, with them being territorially very close, but also a cultural one, the social behaviors of the inhabitants of these countries being very similar. For these countries, we will analyze how the selected internet usage scenarios relate to individuals’ education and their area of residence. Using data collected from international databases, we will stipulate five hypotheses, one for each scenario, and apply a multilinear regression model to the data in order to analyze the degree of confirmation for the hypotheses. We want to find out whether internet usage has influenced individuals lives, but also determine what could be improved regarding internet literacy as connectivity levels continue to increase.
2. Literature Review and Hypotheses Proposal
Various studies have described education as an investment that one makes in order to increase their income, but it is also an investment in human capital made by governments in order to attain sustainable economic growth. Aina and Sonedda [
13] state that education has a positive connection with life satisfaction, thus revealing the consumption component of education, a connection that dependends on the specific levels of education. This implies that education could also influence the time a person spends online and the areas of interest one could use the internet for, and we intend to further explore this idea in our study.
In
Table 1, we can observe the percentage of the population by education level (Eurostat presents data for three aggregates: low–medium–high level of education [
14]) and degree of urbanization for the year 2020 in each of the four selected countries. It is important to note that in all residential areas the highest percentage of the population has a secondary level of education. The discrepancies appear between high and low levels of education, and it can be seen that, in cities, the individuals with high levels of education are twice or even three times as numerous as those with low levels education. In contrast, in rural areas, the percentages are the opposite, except for Slovenia, where higher education is above lower education even in rural areas.
Rural and urban sectors are not entirely separate domains, and their development is interdependent. These areas are defined in relation to certain demographic aspects, infrastructure, and economic, social, and political factors. The disparity between rural and urban zones is wide in developing countries, where the rural population does not have access to the same social infrastructure as their urban counterparts. These areas are of prime concern for policy makers and governments that seek to diminish the discrepancies between the two discussed areas. Rural–urban interconnections play a very important role in advancing national development through the flows of people, finances, goods and services, information, and technology to and from rural and urban areas. Technology is seen as one of the most-important links between rural and urban areas [
15].
Table 2 shows the percentage of households regarding their level of internet connection by degree of urbanization by 2021. We can see that, in all four countries analyzed in this study, the internet access is medium–high, even in rural areas. The divide between rural and urban areas was particularly strong in Bulgaria, with the lowest level of connectivity in the rural sector, followed by Greece and Romania, but we can easily observe that these areas keep pace with urban zones, especially in Slovenia, where all rates are above 90%.
2.1. Relationship between Seeking Health Information on the internet, Education Level, and Area of Residence
As far as the personal health is concerned, education may be the most-important factor that determines whether people invest their time and resources in the achieving better health and increasing their life expectancy [
16]. Among the excessive opportunities the internet offers, using it for seeking health-related information has been one of the most prominent topics and is an important value to traditional health resources. The internet as a means of communication and improvement can benefit personal health by allowing information exchange and helping individuals make informed decisions about their health.
Although searching for information is the main activity regarding internet use for health-related purposes, there are other activities slowly advancing [
7], such as users accessing their health records, communicating with health professionals, or buying medical products online. This overall improvement happens because individuals become more experienced in their computer and internet skills, a fact that is strictly connected to individuals’ education level.
The internet seems to have an important role in helping individuals take preventive measures and improving their health status, but in order to fully benefit from the substantial amount of health information available online, they must have a certain level of health literacy—that is, the aptitude to read, understand, ask questions, and discern the validity of the information received [
17]. This implies that individuals with lower levels of education are less likely to have the abilities required to seek and make good use of health information in their medical decisions, which leads to a weakened health status [
18]; however, those individuals with medium education, who have a high school diploma, are more inclined and capable of seeking and using health information [
19].
Other studies proved that individuals have been using the internet instead of a doctor or have changed their opinion regarding health decisions based on their internet research [
20], even referring to information found online at their appointments with physicians or health professionals. During the first wave of the COVID-19 pandemic, the prevalence of seeking health-related information online escalated, especially during the lockdown, when the internet was the most handy and available tool people had for comparing symptoms or searching for ways to prevent infection. However, the validity of the information is a matter of individual judgment and is directly connected to health literacy and education level [
21].
Bujnowska-Fedak [
22] determined the profile of internet users that are more likely to seek health information online as having a higher level of education or continuing education, being of a younger age, and residing in cities. Another study based on data from seven European countries found a similar profile for individuals that use the internet frequently to read health-related websites and opinions, establishing consistency for the theory [
23].
Because access to information is fundamental to maintaining and improving health status, it is important to understand how various demographic variables affect the way individuals access health information: cultural norms, social situations, accessibility of information sources, and the level of understanding it. Even though, in urban areas, we do not see a significant gender difference when it comes to seeking health information, in rural areas, women are more likely to seek such information to their benefit or for their significant others [
8]. Regarding the age of individuals [
24], it is more difficult for older adults from rural areas to find health-related information online compared to their urban counterparts, and they should receive more support in the use of the internet to help them access reliable health information and make better decisions for their health.
Examining the previous research results, we can observe that education plays its part in internet health-related searches, but there are not many studies that consider its connection to individuals’ places of residence; therefore, we formulated the following hypothesis:
Hypothesis 1 (H1). Health-related internet searches are strongly influenced by education level and area of residence.
2.2. Online Courses, Education, and Residential Areas
Technology has always been of great importance in improving the quality of education and the learning process. One of its main uses is to deliver courses via the internet, a process that is also referred to as e-learning [
25]. Online courses are beneficial to both students and educators, emphasizing the versatility of distance learning as a supplement to traditional methods of teaching and learning.
The study [
26] compares the face-to-face teaching method with online teaching in order to find out which method is more effective with respect to students’ performance, gender, or class rank, but finds no significant difference between these two methods.
During the mid 1800s, the University of London initiated correspondence and distance learning courses, a method that was very much dependent on the postal service. Today, when speed and accessibility of content know no such limits, people turn more and more towards online courses, forcing the academic institutions to change the way they deliver course content. One of the biggest challenge online courses present is that they rely upon network connections in order to reach the students, as opposed to face-to-face learning [
9].
The COVID-19 pandemic outbreak compelled the entire education system to shift towards the online area and readjust quickly. As many businesses switched to working from home during the lockdown, so did other areas, including courses, forcing instructors to improve the effectiveness of their online instruction methods.
Studies prove that online learning has increased learners’ engagement in various areas due to its advantages such as accessibility, comfort, and remoteness, but it also has limitations that include supervising students effectively [
27].
Yu analyzes the effect that education level and gender has had on online learning results during the COVID-19 pandemic, proving that education level is strongly correlated with online learning [
28]. The learners with higher education levels prove to be more focused and less distracted while taking an online course; thus, they prefer this method to the traditional one, providing them with better results. Trainees with medium education levels were not satisfied with this training method, however.
Regarding online courses, many studies focus on students and their participation in various online-related learning tasks compared to their area of residence, emphasizing the challenges that individuals from rural areas face due to their low levels of digital skills [
29]. However, we did not find sufficient research on the working population regarding their digital skill status and their area of residence that would lead to their participation in online education; hence, we would like, in this study, to better understand the connection between these aspects.
Other studies examined various demographic aspects of trainees compared to online learning development [
30], showing that education levels have a major impact on participation in online learning. The demographic traits of those who are among the most willing to take an online course are females, working learners, and individuals with lower education levels who are performance-expectancy driven [
31]. However, these studies are, like most of the studies found in the literature, based on surveys with a limited number of participants; thus, we will focus our analysis on larger, international data. Given these findings, we propose the following hypothesis:
Hypothesis 2 (H2) Taking online courses is connected with education and place of residence.
2.3. Internet Banking Usage and Individuals’ Education Level
Concerning the banking sector, the internet has been of constant importance with respect to the advantages it brings to banks, customers, and businesses. As the most-important part of the internet involved in the banking sector, internet banking can be defined as the process that enables banks to create a platform for its customers to access their bank accounts, enabling them to conduct transactions via an electronic device without having to be physically present at the bank’s location [
32]. The availability and quality of the customers’ internet connection have a significant effect on their use of internet banking, a figure which is continuously growing due to increasing internet infrastructure [
10,
33].
The most-important factors for choosing internet banking over conventional banking seem to be the convenience, time savings, and continuous access that internet banking offers. Within the comfort of their home and at their fingertips, individuals are able to pay bills, transfer funds, make deposits, or even apply for loans anytime they like via internet banking, which proves even more the convenience aspect of this service [
34].
Internet banking proved its value even more during the pandemic period, when the use of internet banking had the highest expansion in all four countries selected for this study, which makes even more sense considering it offers the convenience of accessing one’s bank account and money without having to leave the house in cases of lockdown.
Being able to use the internet is a necessary but not sufficient condition for individuals to use internet banking. Szopinski examines the influence of education on using internet banking and shows a direct relationship between them: the higher the education level, the more internet banking users there are [
35]. In addition, Burke shows how income, level of education, and using internet banking have a positive correlation [
11]. Other factors that influence both positively and negatively the use and acceptance of online banking are cultural differences and the perception of technology [
36], as well as various demographic variables such as age, sex, income, education, or infrastructure access [
37].
With respect to the area of residence, it has been observed that although users living in rural areas have similar preferences for banking products and services as do users living in towns or cities, the former use internet banking less often than the rest of the users [
38], which should cause banks to take notice of the differences in consumer needs and preferences in order to improve the reach area of their online banking systems.
Reviewing the literature, we could observe that there are some studies involving the use of internet banking compared to education level or different demographic variables, but there are not many studies that analyze the use of internet banking in relation to users’ area of residence, leading us to submitting the following hypothesis:
Hypothesis 3 (H3) Living area and education level have a great influence on using internet banking.
2.4. Frequency of Goods and Services Internet Searches in Connection with Residential Zones and Individual Education
People’s consumption needs are constantly evolving, and the internet has changed how they approach this matter. We can observe how a high education level has a positive impact on individual attitudes towards online shopping, while those with lower education levels do not readily accept online commerce or are uncertain about it. Education has a great influence on individual consumption levels and concepts; thus, the economics of education should focus on the improvement of consumption level and should also mediate rational consumption [
39]. People have started to buy more goods online, but, before they decide on a certain product or service, they seek information about it on the internet in the form of reviews, blogs, or videos. They have to make educated decisions so they search for related information and apply it to their best level of understanding, a level which is strictly connected with their degree of education.
A product’s price is not always the first aspect individuals take into consideration when searching for goods and services. Among the most-important features people look for while searching for information about goods and services are quality, appearance, price, brand, and after-sale service. The higher-educated individuals pay more attention to the reputation and quality of products or services, but green consumption is not particularly influenced by a specific education level [
40]. There is a certain level of literacy needed in order to understand and discern the information found online about goods and services, and this level is settled by education.
Reviewing the literature, we notice that there are not many studies focused on this part of researching information about a product or service before buying it; the main focus has been mostly on the commercial part of the process. Additionally, from the residential area point of view, there is a paucity of research regarding the search for information about goods and services; therefore, we intend to further analyze this in our study, so the following hypothesis is postulated:
Hypothesis 4 (H4) Finding online information about goods and services is influenced by individuals’ level of education and place of residence.
2.5. Connection between Individuals Participating in Social Networks and Their Residence Place and Level of Education
When we talk about social networks, we mean websites and applications that allow users to share information, opinions, beliefs, personal content, and so on with other users. Individuals can access social media using a computer, a smartphone, or a tablet. The number of people who use social networks at present has increased majorly in the last decade, alongside the internet’s growth. The most popular and common social networks used today, based on the number of users, are Facebook, YouTube, WhatsApp, Instagram, WeChat, and TikTok [
41]. A total of 80% of individuals aged 16 to 74 in the EU used the internet in 2021 on a daily basis, and 57% of the same fraction are using it for social networking.
Studies show that among the students who use social networks, only a very small percentage use them for academic purposes. The rest of them have various reasons for use, such as chatting or browsing to pass the time [
42], while a significant amount of people admitted that social networks waste their free time and have affected their social interactions.
Although social networks allow for learning, working, or communication between a vast number of users worldwide, they can also be addictive and can affect different areas of individuals’ lives in a negative way [
43].
Regarding various demographic aspects, it has been noted that social media was used equally by all genders; however, individuals with medium and high education levels have constantly used social media, while those with low education did not participate as much in social networking, but they have been increasing their engagement lately [
44].
Aside from the fun side of social networks, they are also an important source of income for a variety of users, such as content creators who exchange user-generated data, pictures, and videos, but can also share product or service reviews [
12]. From the commercial point of view, social media has been a means to reach a targeted audience of users in order to promote various businesses with great impact, especially in rural areas [
45].
Although residents of urban areas have been constantly using social media a bit more than individuals living in rural areas, we want to analyze this a bit further and also see how the level of education impacts the time a person spends on social networking sites for the four selected countries in our study. Thus, we submit the following hypothesis:
Hypothesis 5 (H5) Education level and residence area are directly related to frequency of using the internet for social networking.
4. Results
In this section, based on the collected data, we performed a quantitative analysis for the hypotheses’ validation.
For Bulgaria, the
HealthInfo variable shows a strong positive correlation with
HighEd and
Towns, a medium positive correlation with
Cities, and a strong negative correlation with
LowEd and
Rural. From
Table 3, we can also see that for Greece’s data,
HealthInfo shows a strong positive correlation with
MediumEd,
HighEd, and
Towns, and a strong negative correlation with
LowEd and
Rural, while for Romania, it has a strong positive correlation with
HighEd and
Towns and a strong negative correlation with
Cities and
Rural. For Slovenia,
HealthInfo has a strong positive correlation with
HighEd and
Cities, a strong negative correlation with
LowEd and
MediumEd, and a medium negative correlation with
Rural.
Thus, the values of
HealthInfo increase in the same manner as the values of the variables that are positively correlated with it, and in the opposite direction with the variables that present a negative correlation.
In the about multilinear regression formula (Equation (
2)), the
Towns variable is excluded because of collinearity issues for Bulgaria, Greece, and Romania. For Slovenia, the
HighEd variable is excluded due to collinearity. In addition,
MediumEd for Bulgaria,
Cities for Greece, and
Towns for Slovenia are excluded because the Pearson correlation coefficients and
p-values are not statistically significant.
These results are consistent with the fact that seeking health information on the internet has increased over the period analyzed, as have the levels of high education and the share of the population living in Towns. We also notice a steady decline in the percentage of people who have a low level of education, but also in those who live in rural areas. This is easily justified given that people with a high level of education and those living in urban areas use the internet to a greater extent to search for health information.
A peculiarity is represented by the Greek data, where the percentage of those with secondary education has a growth rate similar to that of HealthInfo, while for Slovenia the place of the variable Towns is taken by Cities, and those with secondary education have the same decrease rate as those with LowEd. This has to do with the demographic structure of the respective countries and the structure of the education level of their resepective societies.
These results confirm Hypothesis 1 for all four countries.
As seen in
Table 4, the
eCourses variable does not correlate to the other variables for Bulgaria, meaning that in this country, the increase in the level of taking online courses did not take place in connection with any of the studied variables. For Greece, however, the
eCourses variable has a strong positive correlation with
MediumEd,
LowEd, and
Towns, a strong negative correlation with
LowEd and
Rural, and a medium negative correlation with
Cities. Here, the increase in online courses has been in line with the increase in the population with
MediumEd and
LowEd, and with the increase in the share of the population living in
Towns, but also with the rate of reduction in the share of the population with
LowEd and those living in rural areas.
For Romania, the Pearson coefficient reveals a strong negative correlation between eCourses and MediumEd only. The share of online courses has had the same evolution as the share of the population with a secondary education level, which shows, rather, that this indicator is not really related to the level of education and demographic evolution of Cities, Towns, and Rural.
The Slovenian data show that
eCourses strongly correlates positively with
HighEd, correlates positively in a moderate manner with
Cities, and negatively with
MediumEd, while the negative correlation with
LowEd is strong. Here, the increase in the number of online courses has kept pace with the increase in the share of people with higher education, and at the same rate with the decrease in those with a low level of education.
In the above multiple linear regression formula (Equation (
3)), the following variables are excluded due to collinearity:
LowEd and
Towns for the Greek data and
HighEd for the Slovenian data. At the same time, the variables
LowEd,
HighEd,
Cities,
Towns, and
Rural for Romania and
Towns and
Rural for Slovenia were excluded because their
p-values showed that they were not statistically significant.
Given all this, Hypothesis 2 is refuted for Bulgaria, it is strongly confirmed for Greece, while for Slovenian data, it is strongly confirmed for education and moderately confirmed for residential areas. For Romania, Hypothesis 2 is confirmed just for the education level, and that fact is easily explained by the good distribution of the internet infrastructure in all areas of residence.
For the
eBanking variable, in
Table 5, in Bulgaria’s case, the Pearson correlation coefficients show a strong positive correlation with
HighEd, a medium positive correlation with
Cities and
Towns, and a strong negative correlation with
LowEd and
Rural. For the Greek dataset,
eBanking shows a strong positive correlation with
MediumEd,
HighEd, and
Towns, and a strong negative correlation with
LowEd and
Rural. There is a strong positive correlation between
eBanking and
HighEd and
Towns, a strong negative correlation with
LowEd and
Cities, and a medium negative correlation with
Rural for the Romanian data, while for Slovenia, we can observe that
eBanking has a strong positive correlation with
HighEd and
Cities and a strong negative correlation with
LowEd and
MediumEd.
Regarding the above multilinear regression formula (Equation (
4)),
Towns is excluded because of collinearity issues for the Bulgarian, Greek, and Romanian datasets. Moreover,
HighEd is excluded in the Slovenian formula.
MediumEd for Bulgaria and Romania, as well as
Towns and
Rural for Slovenia, were also excluded since their correlation coefficients were not statistically significant.
In all countries, internet banking has grown at a rate similar to the growing share of the highly educated and urban population, and similar to the reduction in those with a low level of education and living in rural areas. The explanation would be that, in general, those who use internet banking services are people with a high level of education and residents of urban environments. In Romania, the connection with the Rural variable is not as close, which may suggest that, here, the share of people living in rural areas who use internet banking is slightly higher than in other countries, and that this is directly related to people’s affinity for online banking, but also to the type of commercial services provided by banks.
Considering all these, we conclude that Hypothesis 3 is confirmed for all countries.
From
Table 6, we observe that
InfoGS has a strong positive correlation with
HighEd and
Towns, a medium positive correlation with
Cities, and a strong negative correlation with
LowEd and
Rural for Bulgaria. The same variable is strongly positively correlated with
MediumEd,
HighEd, and
Towns, and strongly negatively correlated with
LowEd,
Cities, and
Rural for the Greek dataset. For Romania, we observe the strong positive correlation of
InfoGS with
HighEd and
Towns, and a strong negative correlation with
Cities and
Rural. Finally, for Slovenia,
InfoGS has a strong positive correlation with
HighEd and
Cities and a strong negative correlation with
LowEd and
MediumEd.
In the above multiple linear regression formula (Equation (
5)), the following variables are excluded because of collinearity issues:
Towns for Bulgaria, Greece, and Romania,
LowEd for Greece, and
HighEd for Slovenia; while the variables
MediumEd for Bulgaria and Romania,
Cities for Greece, and
Towns and
Rural for Slovenia were excluded due to the statistical nonsignificance of their
p-values.
For all four countries, the growth rate of online searches for information about goods and services has had the same dynamics as the growth rate of higher education and the decline rate of low education. In Bulgaria, Greece, and Romania, this rate is the same as the increase in the share of the population living in Towns and the decrease in the population living in rural areas, while in Slovenia, this rate is of the same nature as the increasing rate of the share of the population living in Cities and the decreasing share of the population with secondary education. These aspects suggest that, of those individuals who search for information about goods and services on the internet, a high share is made up of those who have a high level of education and live in towns, while only very few of them live in rural areas and have a low level of education.
Therefore, Hypothesis 4 is firmly supported for the four countries considered.
As we extract from
Table 7, the Bulgarian data show that the
SocialNtw variable presents a strong positive correlation with
HighEd, a strong negative correlation with
LowEd and
MediumEd, and a medium negative correlation with
Rural. This means that the increase in the values of
SocialNtw is in the same direction with the increase in the values of
HighEd and the decrease in the
LowEd and
MediumEd variables. In the same manner, one can notice a strong positive correlation with
MediumEd,
HighEd, and
Towns, and a strong negative correlation with
LowEd,
Cities, and
Rural for Greece. So, in this country,
SocialNtw increases in the same way as the
MediumEd,
HighEd, and
Towns increase and
LowEd,
Cities, and
Rural decrease.
For Romania,
SocialNtw correlation coefficients reveal a positive correlation with
HighEd, a medium positive correlation with
Towns, and a strong negative correlation with
LowEd and
Cities, while for Slovenia,
SocialNtw is strongly positively correlated with
HighEd and strongly negatively correlated with
LowEd and
MediumEd.
In the multilinear regression formula above (Equation (
6)), for Greece,
LowEd and
Towns are excluded variables due to collinearity. In addition,
Cities and
Towns for Bulgaria,
MediumEd and
Rural for Romania, and
Cities,
Towns, and
Rural for Slovenia were excluded for their level of significance.
Social networks are broadly used by a wide range of people, and it is obvious that these networks have had a continuous increase in their usage. We consider that the expansion of this indicator in the same direction with the increase of HighEd and with the decrease of LowEd is not a causal one in this case, but reveals the fact that this indicator had a marked development, like the other indicators studied. For the Slovenian dataset, social network participation is influenced by education levels only, meaning that the residential area is irrelevant to this scenario. Observing all these facts, we conclude that Hypothesis 5 is strongly confirmed for Bulgaria, Greece, and Romania, and partially confirmed for Slovenia.
5. Discussion
Education is an ongoing phenomenon throughout the entirety of an individual’s life, and together with technology, it plays an important role in providing efficiency to human lives, that being the primary reason for selecting education as one of the independent variables in this paper. For the second main independent variable, we have chosen the area of residence, because it is an important factor in the development of a country and because technology plays an essential role in the linkage between rural and urban areas.
Our study is an analysis of whether or not the five dependent variables, namely, HealthInfo, eCourses, eBanking, InfoGS, and SocialNtw, which correspond to the five main scenarios for using the internet, were significantly predicted by the level of education or residence variables. We considered these five scenarios of internet usage due to their correspondence to some of the most-important aspects of one’s life: health, education, financial services, commerce, and socialization.
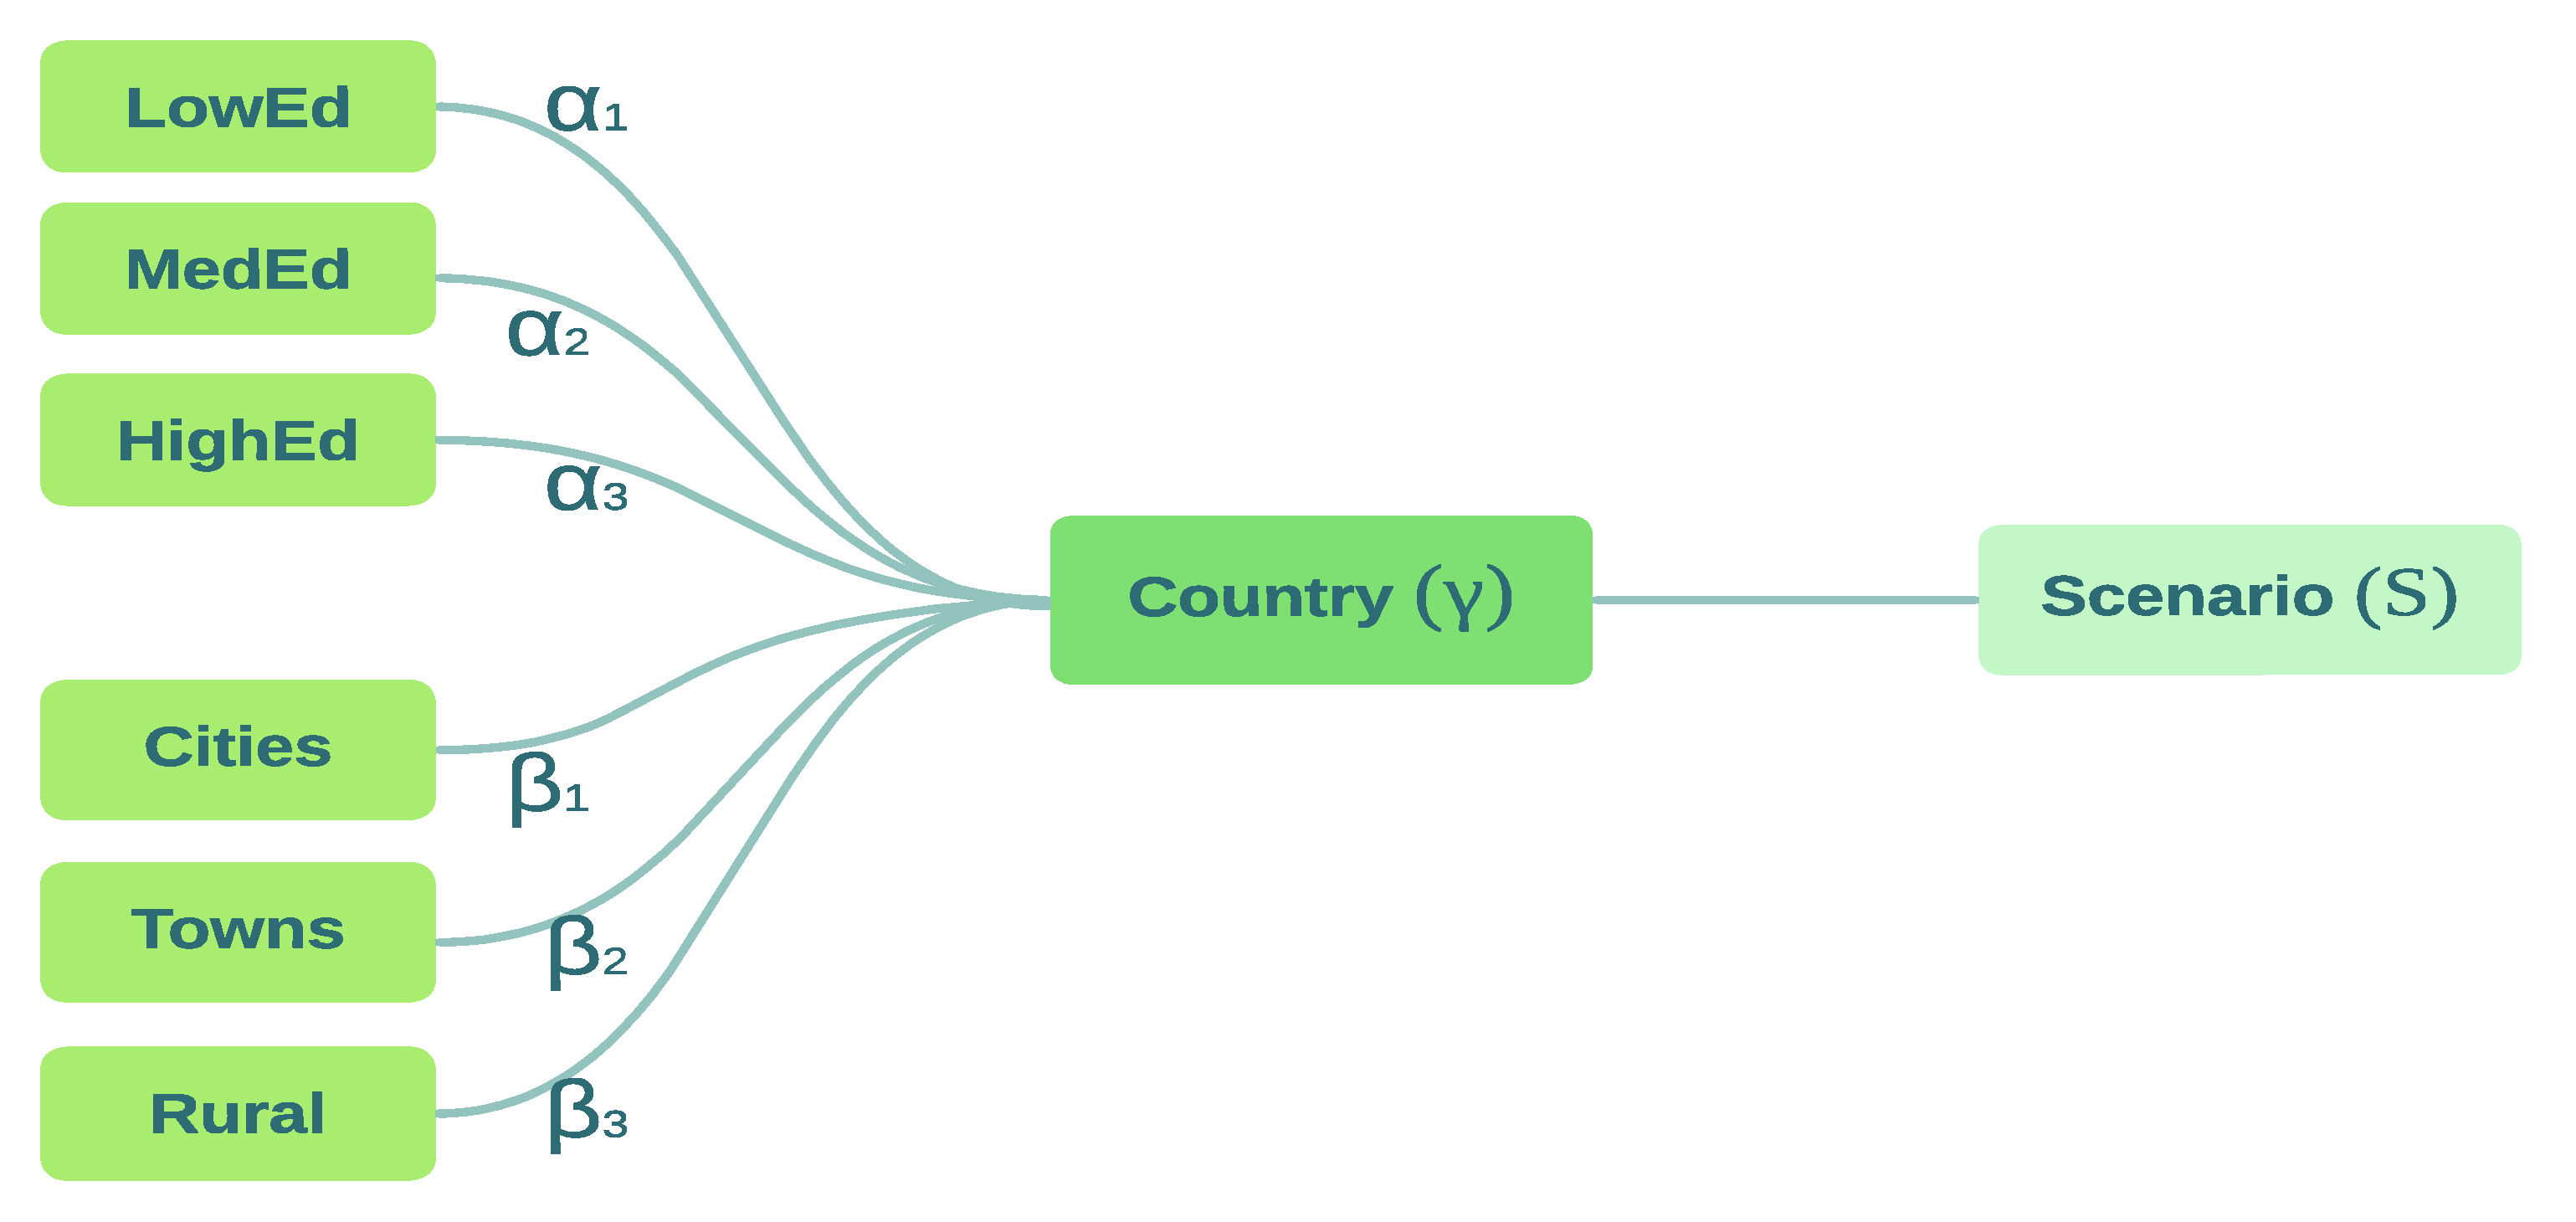
The research led to the identification of the multlinear regression formula that was later used to analyze the connection between the internet usage scenarios and certain social components (education levels and residential area).
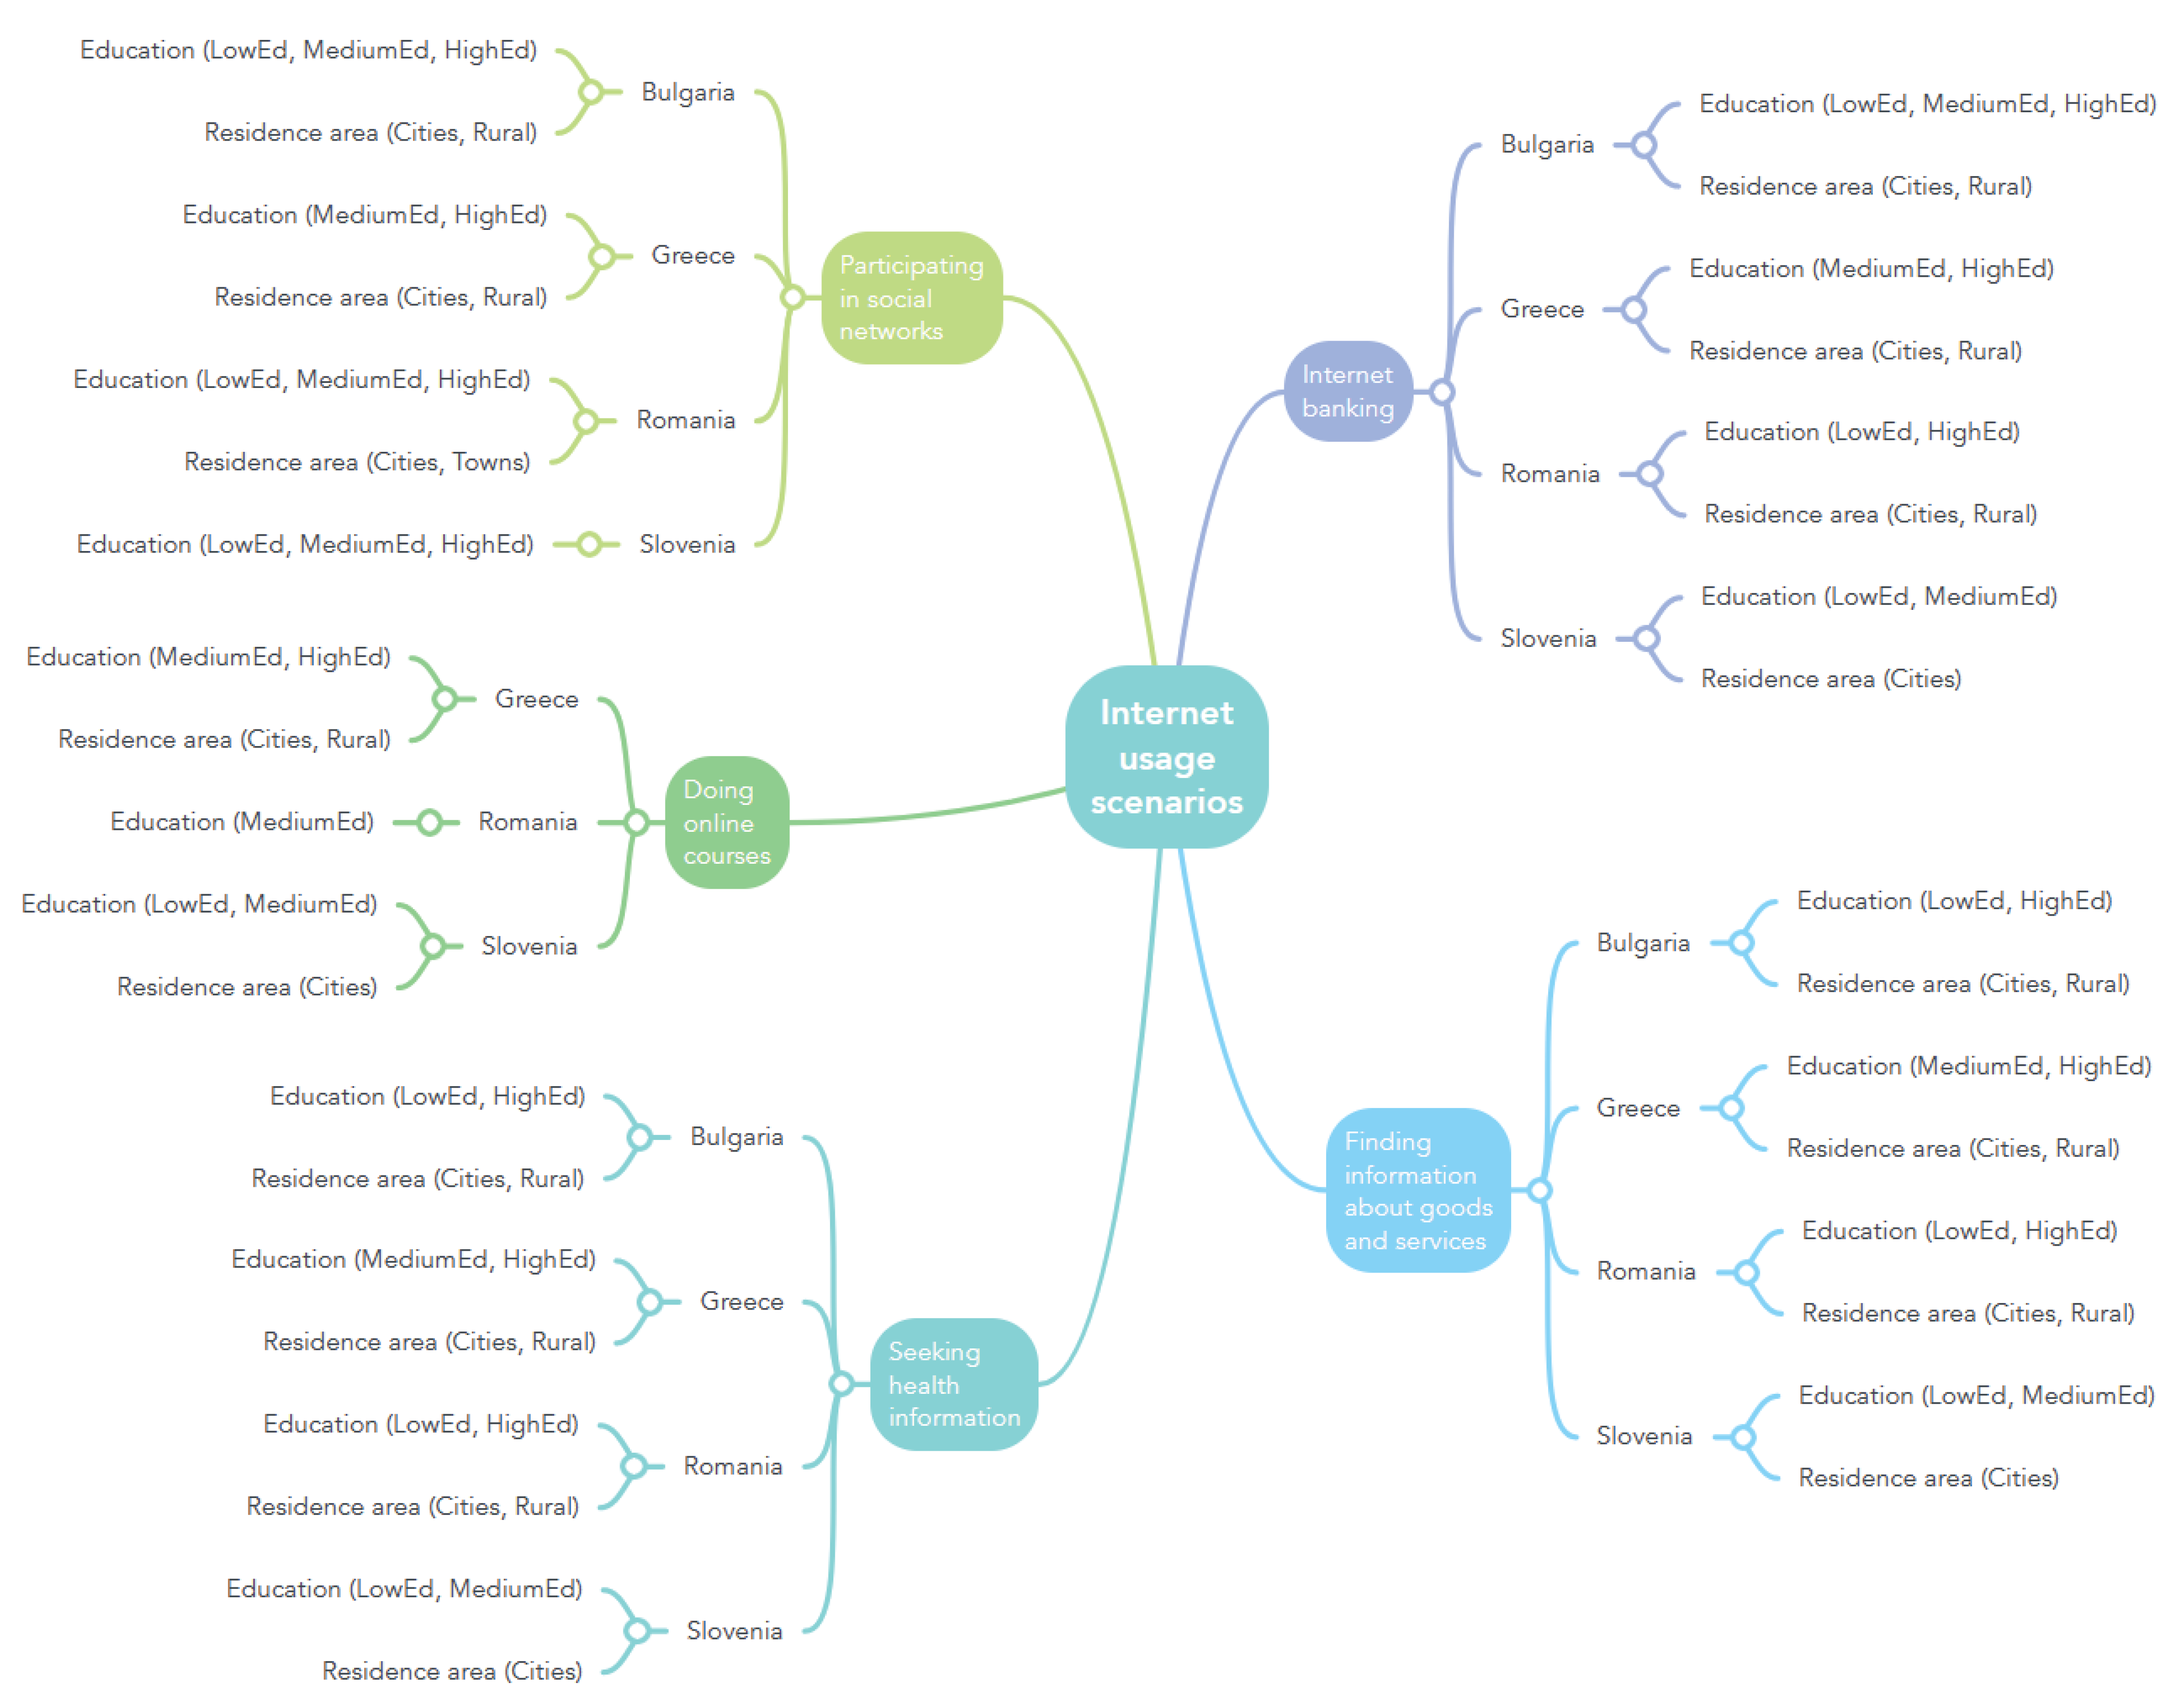
We designed the mind map in
Figure 3 in correspondence with the multiple linear regression model. The representation shows to what degree the hypotheses are confirmed or refuted.
We concluded that health-related internet searches are strongly influenced by education level and area of residence for all countries; this means that Hypothesis 1 is confirmed.
Hypothesis 2 is confirmed only for Greece and Slovenia, the developed countries. However, the six independent variables did not influence the evolution of online courses in the developing countries in a statistically significant way, and consequently, the corresponding Hypothesis 2 was not confirmed for Bulgaria and was just partially confirmed for Romania.
Education level and residence area strongly influence both the usage of internet banking and finding online information about goods and services scenarios, leading to the confirmation of Hypotheses 3 and 4 for all four countries.
Analyzing the data, we concluded that Hypothesis 5 (education level and residence area are directly related to frequency of using the internet for social networks) is strongly confirmed for Bulgaria, Greece, and Romania. For Slovenia, the residence area does not influence the frequency of using the internet for social networks, but all the education levels (low, medium and high) strongly impact social network usage.
People with higher education that live in urban areas are the ones that use internet banking or any other online banking products most. From the results, we noticed that, in Romania, internet banking services are more easily accessed by the rural population compared to the other countries. Highly educated individuals from Romania, living in cities as well as in rural areas, have searched for health-related information more than those with lower education levels. The constant increase in seeking health-related information online could also have to do with the dissatisfaction of the population with the health care system and health services.
For Bulgaria, we noticed that all levels of education strongly influence the frequency of using the internet for social networks and eBanking. Medium education is not relevant to the number of individuals that use the internet for seeking information about health or about goods and services. For Bulgaria and Greece, low education is negatively correlated with seeking online health information; so, in order to increase internet usage for this scenario, a combined education and social policy should focus on reducing the number of people who leave school early, in order to decrease the percentage of low-educated persons.
In Greece, social policies should concentrate on decreasing the number of people with low education that live in rural areas, in order to achieve better utility of the online courses.
In Slovenia, people with higher education are the ones who participate in online courses more frequently and also conduct more searches for information about goods and services on the internet more. The connection with the degree of education implies that higher-educated people make better documentation. However, for most scenarios, we notice that the Cities variable is the dominant component of the residential area for the Slovenian dataset, the other two being less significant to the other variables.
Of the four countries Slovenia is the most socio-economically developed and this can be observed in the model formulas from which we can conclude that education level has a strong influence on all five internet usage scenarios. Individuals with higher education are more inclined to use the internet for the considered scenarios, while those with medium and low education have better internet skills compared to their counterparts from Bulgaria, Greece or Romania.
6. Conclusions and Future Work
This paper examines some of the most-important aspects of everyday life, as well as how they are reflected in the use of technology and, especially, the internet. Subsequently, the resulting internet usage scenarios (seeking health information, taking an online course, internet banking, finding information about goods and services, and participating in social networks) are analyzed in accordance with certain social aspects, namely, level of education and area of residence. We considered these two aspects above others, due to the scarcity of studies in this direction, but for an extended future analysis, other demographic factors would be considered, such as age, gender, income, social status, or ethnicity.
From the European area, we selected four countries for this study, namely, Bulgaria, Greece, Romania, and Slovenia, as they had the fastest growth in internet-connected households in the last 5 years.
Most of the studies we found while reviewing the literature do not use data collected from international statistics, but are rather based on surveys with a limited number of participants; thus, we directed our study towards international databases in order to analyze the influence of the level of education and residential area on internet usage scenarios. However, the datasets should be more comprehensive in order to allow predictions to be made for the immediate future.
The results demonstrated that education and residence area have a clear influence over the health-related internet searching, internet banking, social network usage, and finding online information about goods and services scenarios. The influence that the two social aspects have on the attending online courses scenario is relevant only for the two developed countries of the four—Greece and Slovenia. Under these circumstances, we conclude that the more educated individuals are, the more likely they are to be able to use the internet properly and have a good understanding of the information they access.
The questions that generated the hypotheses were founded on the current context and trends, because although internet usage may have seemed recreational before the COVID-19 pandemic, many everyday activities moved online during the pandemic lockdown period, and a certain level of internet literacy as well as digital skills became mandatory for the proper use of the internet. That is why we strongly recommend the improvement of educational policies, targeting especially rural areas, because their level of education has always been lower in general and, thus, improvements are needed in these areas.
Inspecting the individuals’ level of digital skills in 2021, as a percentage of the population aged 16 to 74, the two developing countries, Romania and Bulgaria, have the lowest rates—with 28% and 31%, respectively—while the two developed countries are way above these rates, with 50% in Slovenia and 52% in Greece.
Evaluating the evolution of United Nations 2030 Agenda’s SDGs, SDG 4—Quality education, Target 4.4, Indicator 4.4.1—Proportion of youth and adults with information and communications technology (ICT) skills, we observe that the progress is slow and does not meet the education targets of the SDGs, being set back even more by the COVID-19 pandemic. Digital skills are particularly lower in rural areas; thus, efforts should be made towards improving this indicator in these areas specifically, in order to increase the digital skills and internet literacy levels of rural populations and to diminish the discrepancies between the demographic zones.
Overall, we notice the necessity of decreasing the levels of low education in all of the studied countries, especially the developing ones, Romania and Bulgaria, and in addition to improving the digital skills and internet literacy among youth and adults, we strongly suggest governmental and social policies should focus more on rural areas, which could strongly benefit from improved educational programs.
The research conducted in the article is an original combination of data about education levels and residence areas, combined with different internet usage scenarios. The multilinear regression model could offer solutions to increase the sustainability of education, especially in the rural areas. The impact of the research can be seen on multiple levels of interest. First of all, we can observe a clear and detailed influence that education and residence area have on different internet usage scenarios. Secondly, the multilinear regression model was used to analyze the data and to establish the confirmation of the hypotheses. The degree of hypothesis validation can be used by decision makers to conduct policies that could lead to country development.
The study could be extended to include the entire European Union, so that the stakeholders can define and propose homogeneous development policies.
It would be interesting to follow the research in the coming years to find out what will be the direction and pace of subsequent changes, if the upward trend continues, and which internet usage scenarios will become of interest in the future.


 ,
, 


