1. Introduction
Asphalt concrete is a widely used roadway pavement material. Asphalt pavement generally consists of subgrade, subbase course, base course, and surface course, from the bottom to the top. There have been many academic studies on the influence of raw materials on the performance of asphalt concrete pavement [
1,
2]. However, for driving comfort, the immediate concern is whether the road is flat or not.
According to a survey conducted by the Federal Highway Administration in 2002, pavement roughness is considered to be the most important indicator of user satisfaction [
3]. In fact, pavement roughness is one of the main road performance measures. Good pavement roughness can ensure the high-speed, comfortable, and safe operation of a vehicle. If the pavement roughness is poor, complaints and petitions from the public will follow. Therefore, the quality of urban roads is regarded as an indicator of urban progress and the foundation of sustainable urban development [
4,
5].
In the field of road engineering, the roughness index of pavement is used to summarize the surface condition and ride quality. This figure is closely related to the performance of the pavement obtained by calculation. Over the last century, procedures have been developed to assess road conditions by assigning roughness levels and calculating index values. Currently, many indices related to pavement roughness have been proposed. Among them, the International Roughness Index (IRI) is currently the most widely used index to indicate road surface roughness [
6,
7]. Regarding the standard procedure for calculating the IRI from longitudinal profile measurements, the ASTM E1926 established specifications based on the quarter car model [
8].
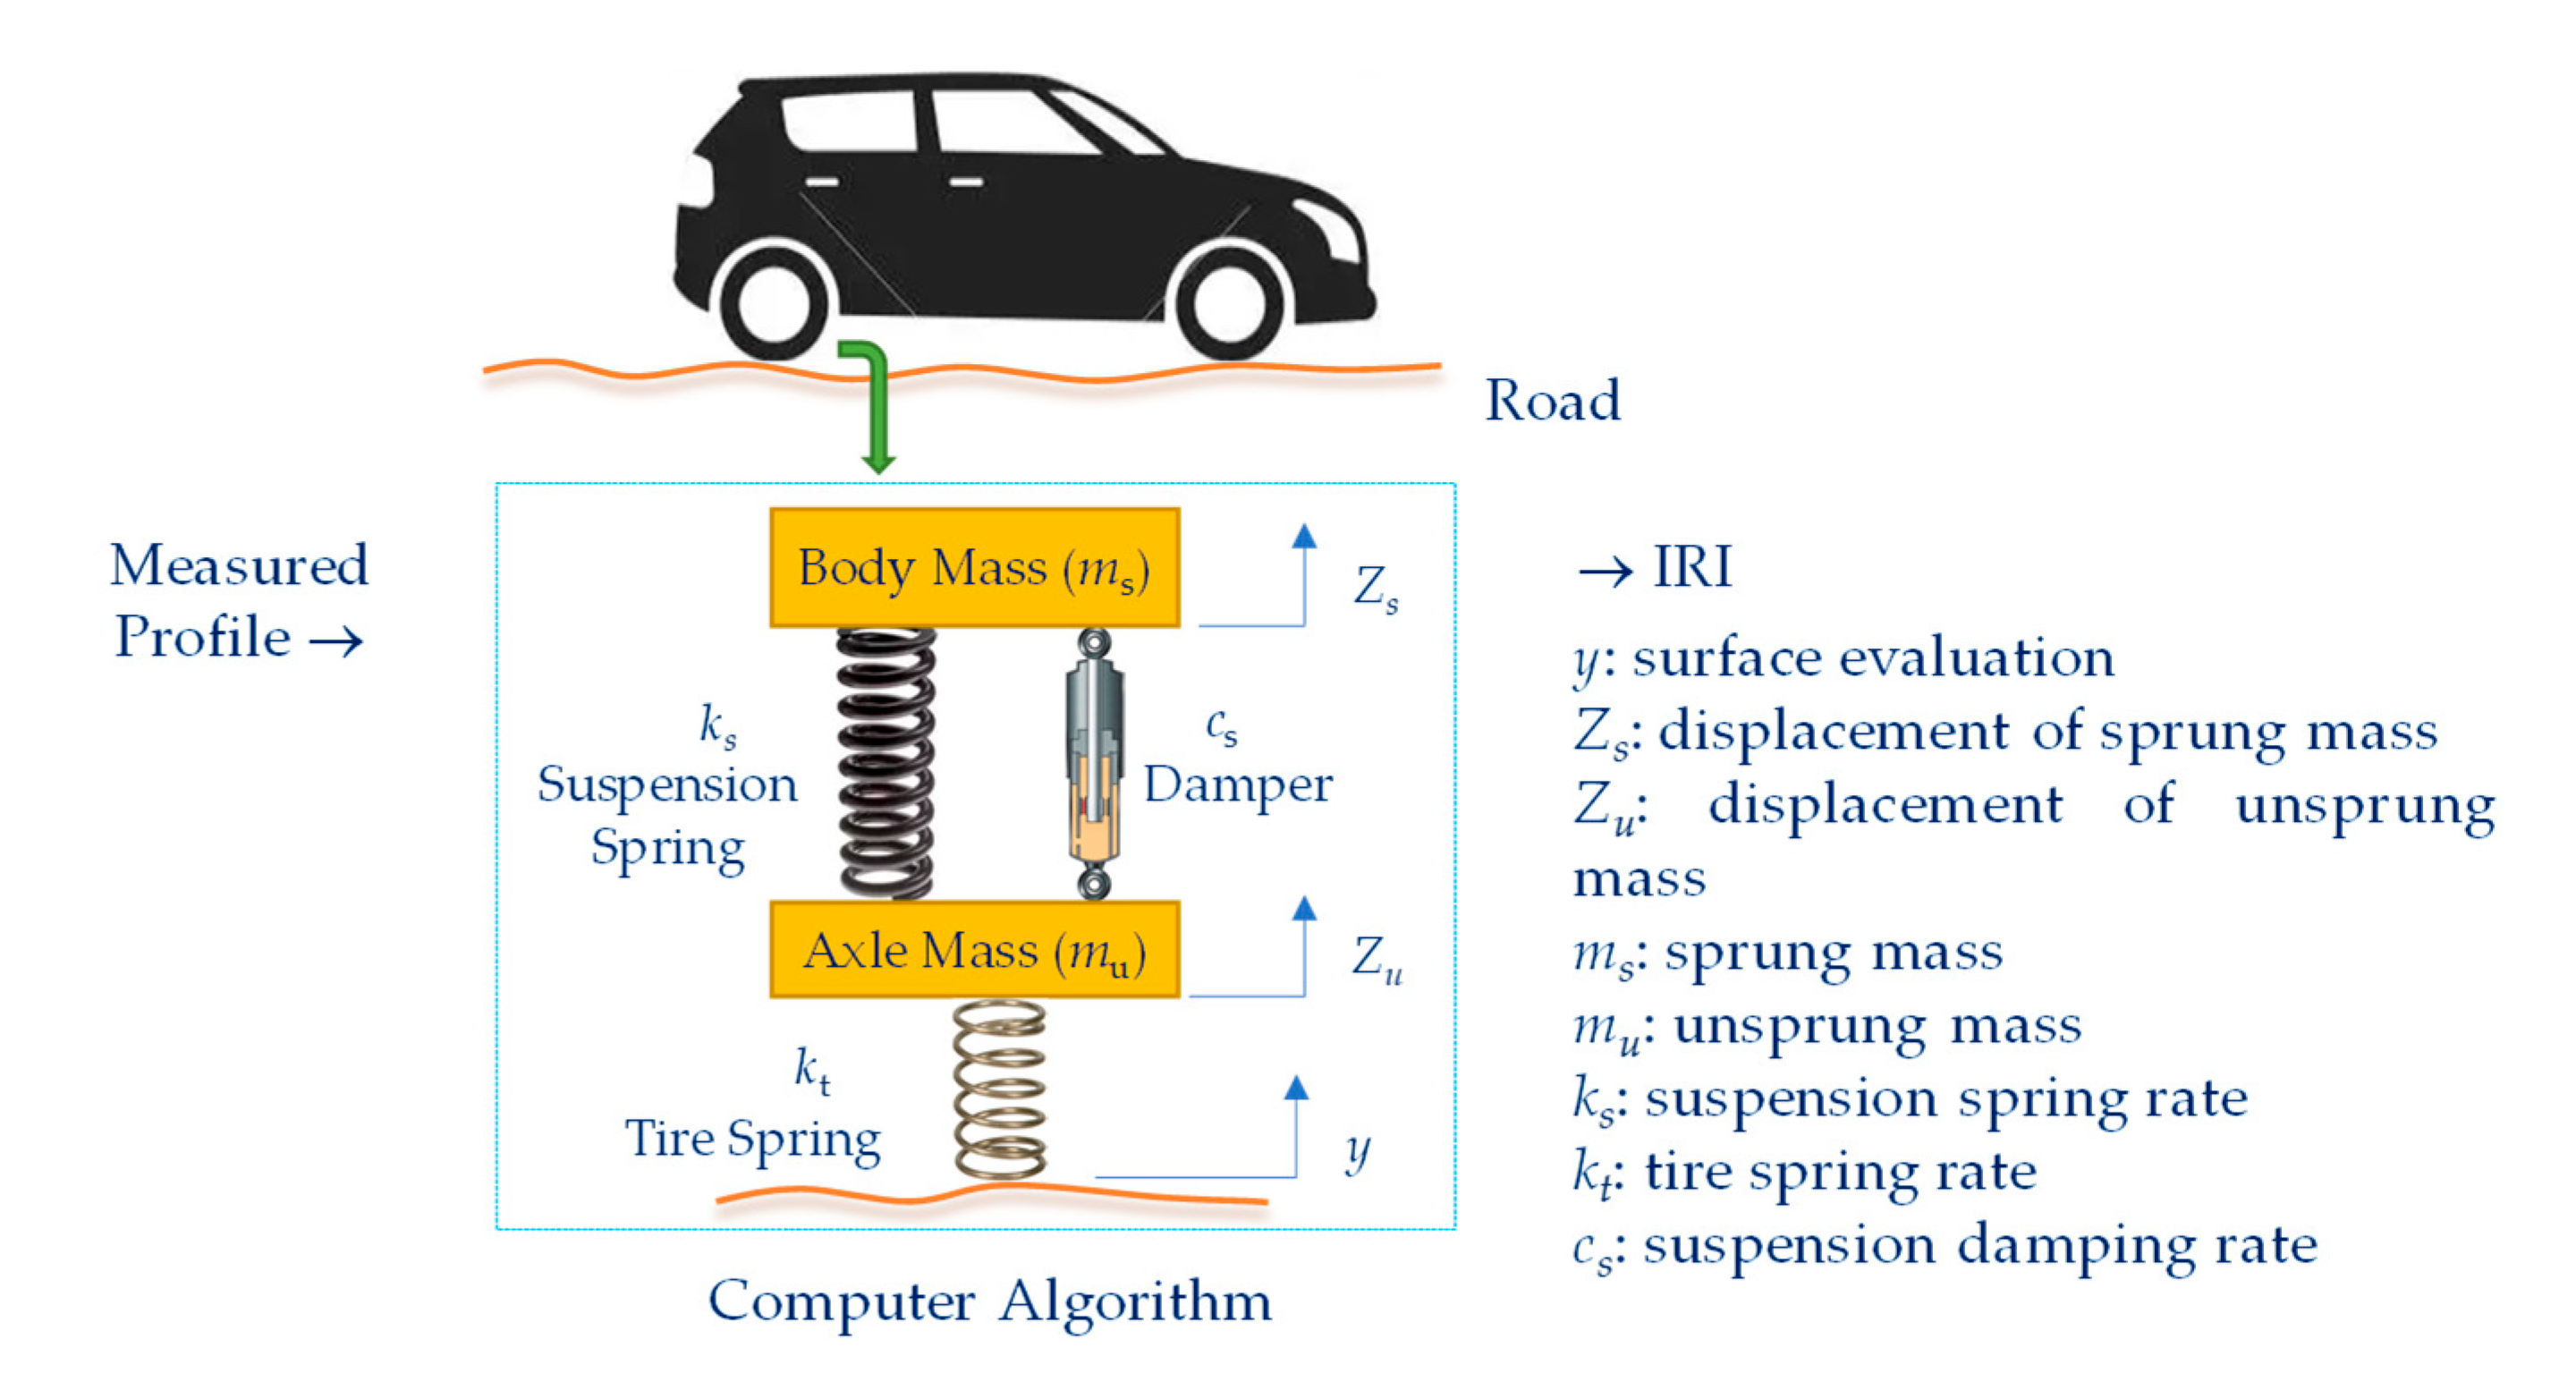
As shown in
Figure 1, the quarter car simulation model is composed of spring suspension mass and non-spring suspension mass [
8,
9]. In this model, the sprung and unsprung masses corresponding to a corner of the vehicle are represented by
ms and
mu, respectively. In the simulation process, the quarter car moves along the longitudinal profile of the test road at a simulated speed of 80 km/h. As the roughness on the surface causes dynamic excitation of the quarter car system, the sprung and unsprung masses have different vertical speeds (
and
) or accelerations (
and
). By drawing a free body diagram and applying Newton’s second law, the following differential equations can be obtained [
8,
9]:
The vertical displacement change of the quarter car is obtained through quadratic integration. In other words, the suspension deflection is calculated based on the measured profile displacement and standard car structural parameters. The simulated suspension motion is accumulated and then divided by the distance traveled to provide the IRI indicator as a unit of m/km, as shown in the following equation [
8,
9,
10,
11,
12]:
where IRI is the International Roughness Index and
L is the length of the profile. The IRI value reflects the jitter degree of a vehicle when driving on road pavement. The IRI is usually expressed in units of m/km [
9]. Generally, the IRI value of asphalt concrete pavement ranges from “0” for superhighways to about “20” for rough unpaved roads [
8]. Therefore, the condition of the pavement is understood from the IRI value. It is worth noting that “0” means perfect pavement; however, in practice this kind of pavement will never be available.
As the IRI has the advantages of being stable over time and transferable worldwide, it has become the most widely employed pavement index [
13,
14,
15]. The IRI is not only used for roughness assessment; it is an important parameter of road surface quality that affects driving safety and fuel consumption. A number of studies have explored pavement assessment and pavement index applicability in developing countries [
16,
17]. For example, Barzegaran et al. [
16] investigated 507 km of asphalt pavement in Kermanshah, Iran, using the IRI and the Pavement Surface and Evaluation Rating (PASER) as a quick and cost-effective indicator. Particularly in European and American countries, the IRI has been widely used in road design, acceptance, management, and maintenance [
18,
19,
20]. For example, Pérez-Acebo et al. [
18] developed an IRI performance model for two-lane roads with flexible pavement. In the United States, 39 states use specific indicators based on the IRI to report the level of roughness of new asphalt pavements [
21]. The roughness acceptance standards of each state in the United States are roughly divided into four areas, namely, the incentive area, full pay area, disincentive area, and correction area; however, the IRI acceptance thresholds of each state are not consistent. A summary of the IRI-based new asphalt pavement specification thresholds in 36 states is shown in
Table 1 [
21].
The accuracy of the IRI is mainly affected in the detection process by the precision of the displacement sensor, data sampling interval, IRI evaluation distance, and measurement speed. The research results of Wang et al. determined that the higher the accuracy of the displacement sensor and the smaller the data sampling interval, the smaller the IRI measurement error [
22]. When the accuracy of the displacement sensor remains the same, smaller the data sampling intervals lead to the smaller errors in IRI measurement. On the other hand, researchers have proposed speed-related IRI thresholds to evaluate ride quality [
10,
23,
24,
25]. The literature indicates that at the same ride quality level, the IRI threshold decreases as the measurement speed increases [
10,
23,
24,
25].
In addition to the IRI, other commonly used roughness indices include the Ride Number (RN), Profile Index (PI), Maysmeter Index (MI), and Root Mean Square Vertical Acceleration (RMSVA). Regardless of the index, the goal is to mathematically reflect the comfort that the user experiences while driving. For example, RN is an indicator that was proposed by the United States in the 1980s to determine how users felt when driving on pavement [
26,
27]. It is evaluated by a panel of raters representing road users, who subjectively rate the service quality of the road on a scale of “0” to “5”, with “0” being the worst and “5” being the best.
Simultaneously with scoring, the roughness of a road section is measured using a mechanized or computerized profilograph, expressed by the profile index (PI); the unit is meters per meter. The PI ranges from “0” to “5”. A score of “0” indicates that the pavement is the roughest, while “5” means that the pavement is very flat. Then, the PI is converted into the RN in a nonlinear mode. In fact, the PI and IRI are related, and many papers have provided the relationship between these two indicators [
28]. On the other hand, the Transportation Research Institute of the Ministry of Transport and Communications of the Republic of China established the Pavement Riding Quality Index (PRQI) in 2005 and listed its corresponding IRI range as a road inspection standard, as shown in
Table 2 [
29].
Roads are important city facilities. They must have the characteristics of stability, comfort, and safety. In addition, it is necessary to provide a quality of service that satisfies road users at a moderate maintenance level. In recent years, the New Taipei City government has actively promoted various road leveling projects and completed the renewal of roads throughout the city year by year to improve the quality of public traffic. This research analyzed and compared the IRI values produced by the New Taipei City government. Our analysis is mainly based on the difference in the IRI before and after the road maintenance under its jurisdiction in order to analyze and improve the effectiveness. On the other hand, in view of the large differences between the IRI thresholds used by countries around the world, an amendment to the accepted IRI threshold of the existing pavement surface characteristics of the New Taipei City government is proposed here, which could be used as a reference for the subsequent implementation of IRI testing.
2. Implementation of the Road Leveling Project in New Taipei City
New Taipei City is an international city located in northern Taiwan. Its territory surrounds Taipei City and Keelung City, forming a co-living circle in the Greater Taipei Metropolitan Area. The population of New Taipei City is estimated to exceed 3.9 million, and its area is 2052 square kilometers, accounting for 6% of Taiwan’s area. With its superior location advantage, today’s New Taipei City is Taiwan’s major commercial city, second only to Taipei City. As the overseer of an international city, the New Taipei City government attaches great importance to the quality of road construction under its jurisdiction. Its roads are divided into express roads, main roads, secondary roads, and branch roads. Management of the pavement roughness is the most important factor in the acceptance of new pavement or road maintenance. This not only relates to driving comfort and driving safety; it determines the service life of the pavement.
At present, the road inspection standards promulgated in Taiwan are mainly formulated by the Ministry of Transportation and Communications and the Construction and Planning Agency of the Ministry of the Interior. In addition, local governments formulate road inspection standards in their jurisdictions. Among these specifications, several use traditional indicators such as the standard deviation of a three-meter straight edge, while others use an inertial profiler to directly or indirectly calculate the IRI. However, analysis of the standard deviation of the three-meter straight gauge is time-consuming and labor-intensive, and cannot fully reflect the real road conditions. In contrast, the IRI is more objective, and is an internationally recognized indicator. In particular, the advantage of the IRI lies in its reproducibility; when different inertial profilers are used to measure the same road section, nearly equal IRI values can be obtained. In addition, the IRI has a linear relationship with road flatness, which reflects the feeling of ride comfort and is converted into various flatness indicators. Therefore, the New Taipei City government has established relevant regulations and inspection standards for the roughness inspection of roads under its jurisdiction, mainly using the IRI as the basis for inspection.
2.1. Brief Description of the Road Leveling Project
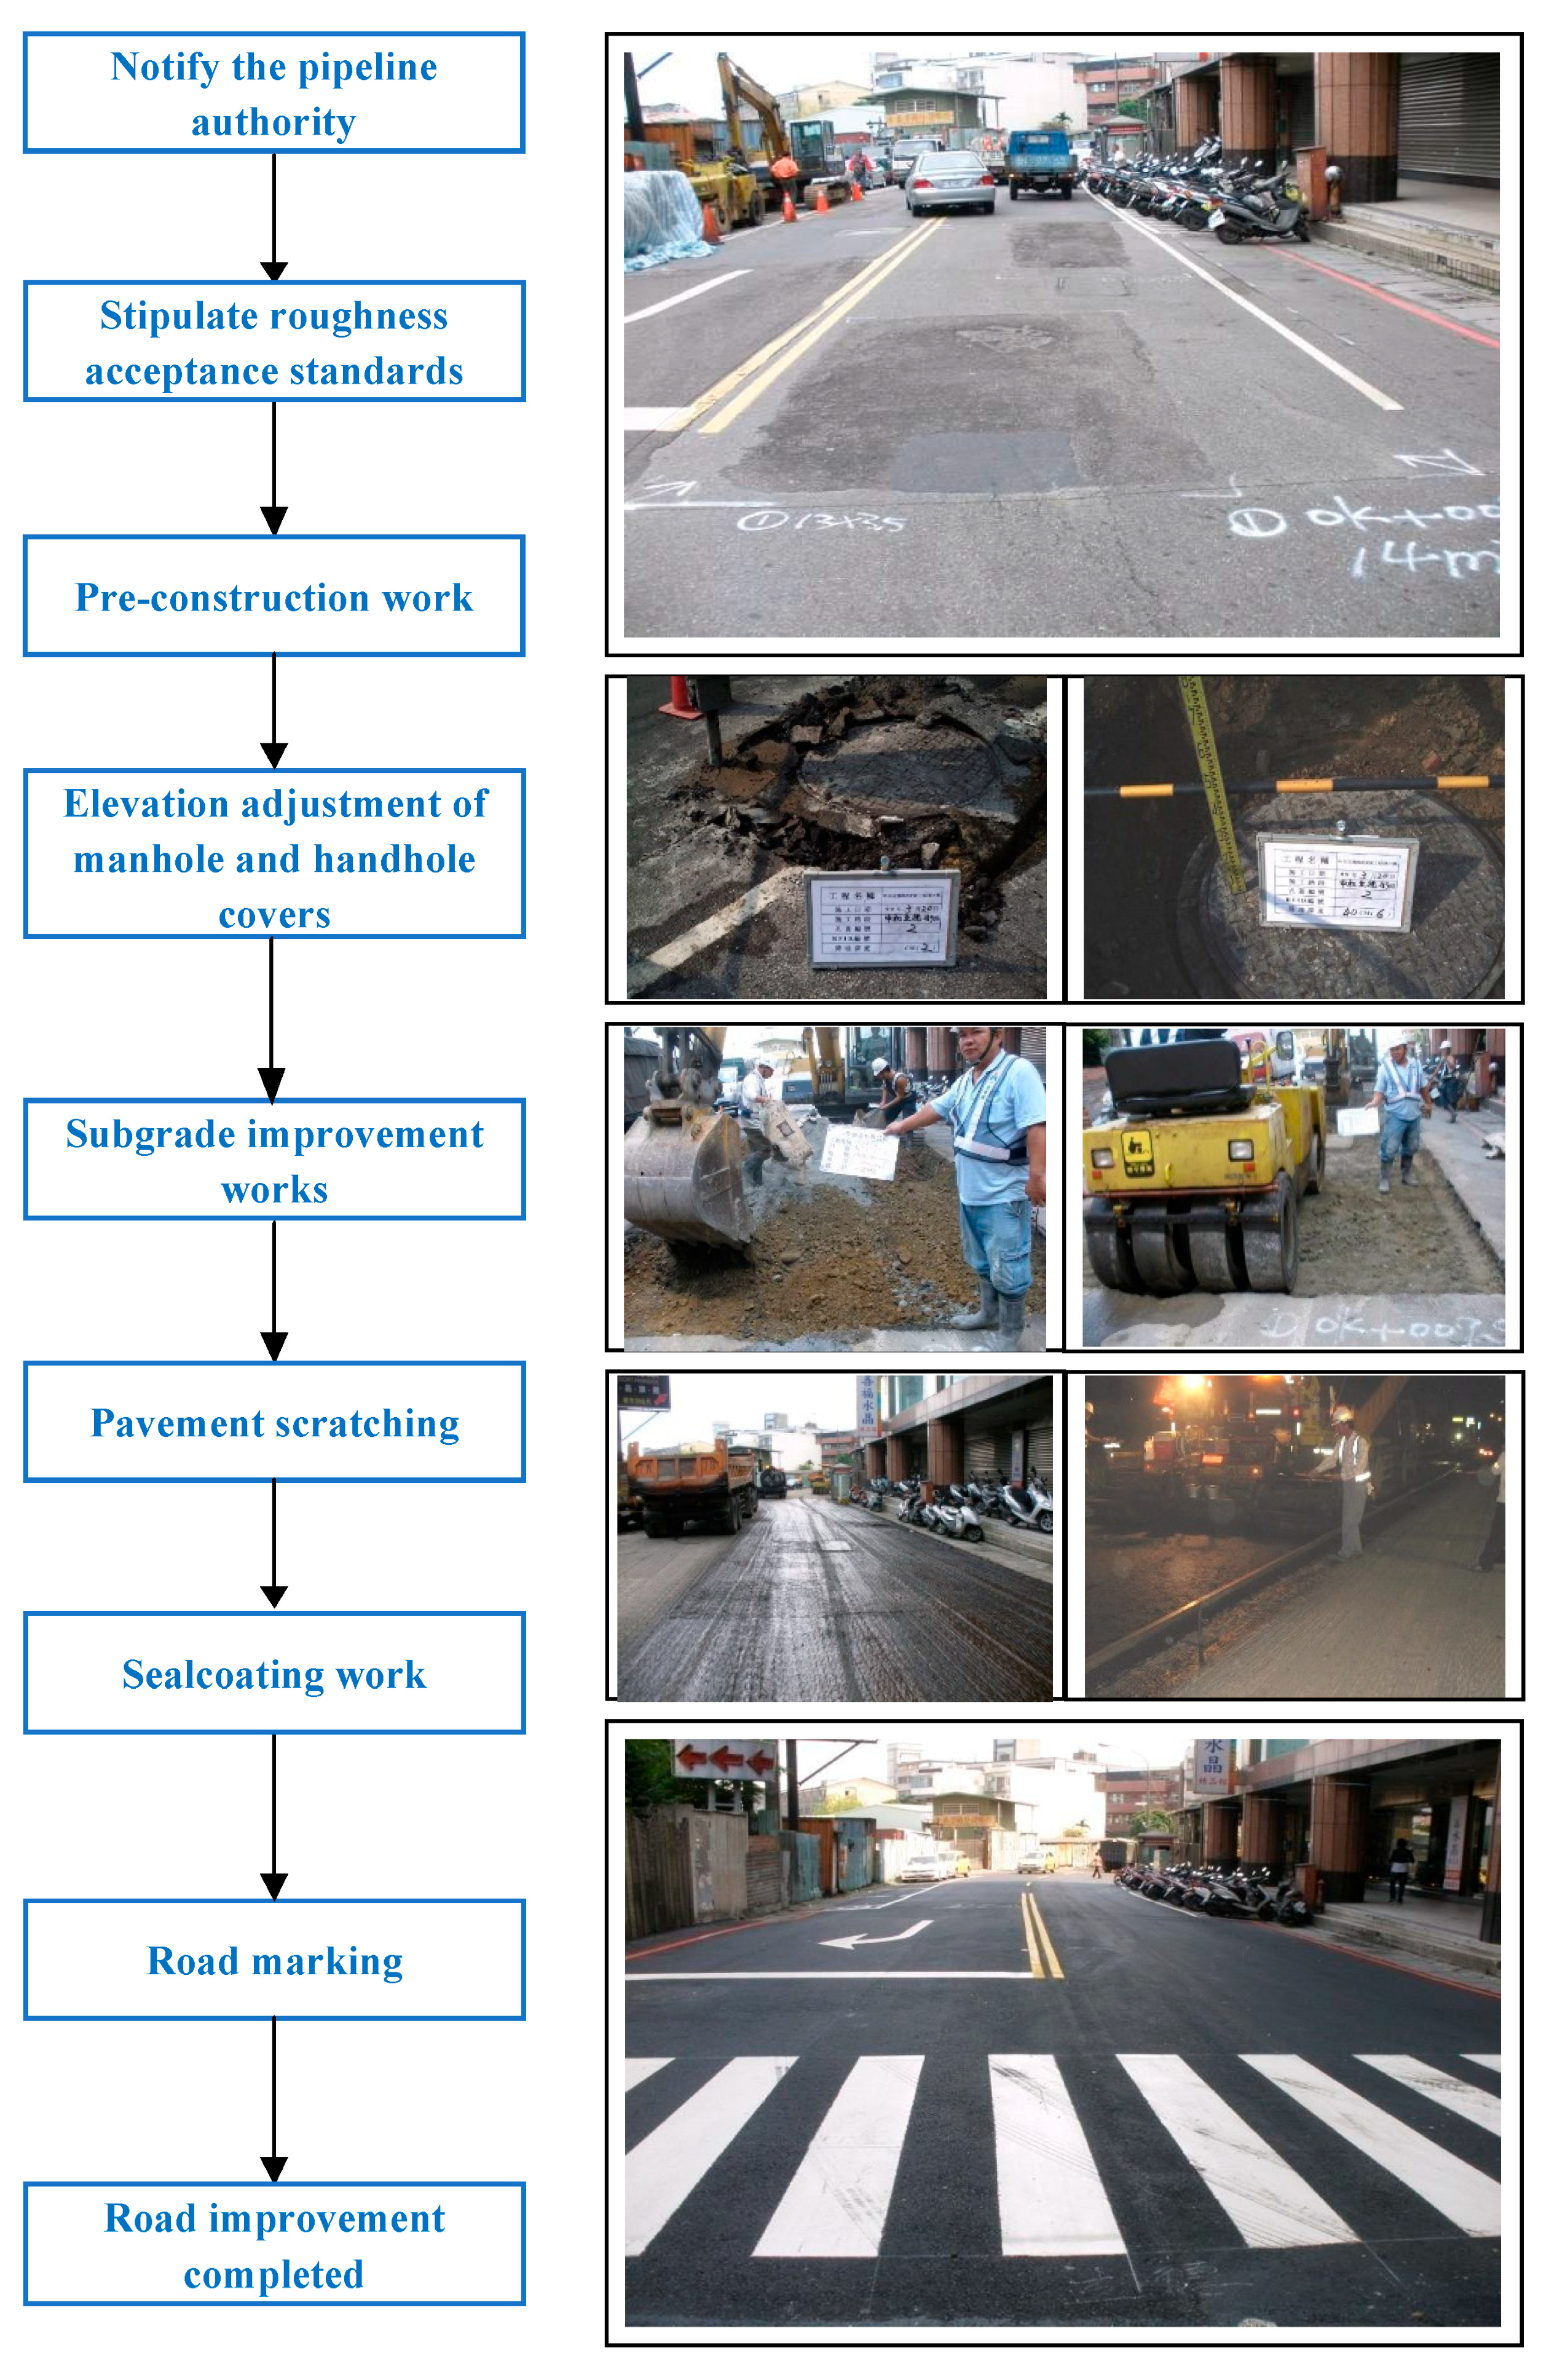
In order to ensure the safety of road users and drivers, in August 1998 the New Taipei City government implemented the Road Leveling Project on the roads within its jurisdiction. The specific pavement technology of the Road Leveling Project includes road roughness detection, elevation adjustment of manhole and handhole covers, adjustment of the slope of longitudinal and transverse sections of the road, subgrade improvement works, pavement scratching, sealcoating work, and road marking. Its implementation process is shown in
Figure 2. The Road Leveling Project of the New Taipei City Government’s Public Works Department completed a total of more than 2.1 million square meters of roads in 2012. The estimated cost of the project was approximately TWD 1.4 billion. In view of the fact that the IRI has gradually become a pavement performance indicator consistently adopted by countries around the world, the New Taipei City government conducted IRI detection and analysis on road restoration within its jurisdiction as a reference for improving the road service quality.
Before a road section is fully milled and paved, a road condition survey is carried out and the subgrade, manholes, and handholes are investigated. For pavement renewal projects, it is necessary to coordinate with the pipeline authority to handle manhole and handhole cover reduction and elevation adjustment. Except for those manholes and handholes that cannot be landed because of disaster prevention or special reasons, manholes and handholes are lowered before the road is paved. After paving, the pipeline authority adjusts the manholes and handholes to be flush with the road surface to increase its flatness. Pavement renewal must be designed according to the concept of the new roads being constructed. The elevation of the road surface should be measured, the slope of the longitudinal and transverse sections of the road surface should be redesigned, and the horizontal drainage slope should be required between each street profile. Rainwater should immediately drain away from the updated road when it is raining, and undulating road conditions should be removed in order to increase the safety and comfort of driving. In order to completely improve and eliminate the problem of uneven road surfaces, subgrade improvement work should be carried out prior to road resurfacing. Subgrade improvement is the most fundamental way to improve road flatness. It can make the resurfaced asphalt concrete pavement smoother and improve the durability coefficient to avoid cracking and damage to the pavement caused by vehicles traveling over poor quality subgrade. On the other hand, the IRI is used for both roughness assessment and as a basis for judging road sections that must be repaired or maintained to prioritize pavement improvements. Therefore, considering the limitations of financial and workforce resources, the New Taipei City government plans to use the results of IRI testing to prepare a budget for damaged roads and dangerous road sections within its jurisdiction in order to effectively implement road maintenance work.
2.2. System Architecture of the Intelligent Pavement Inspection Vehicle
In this study, an intelligent pavement inspection vehicle that met the requirements of E 950 Class I was used to detect the roughness of road surfaces in New Taipei City before and after maintenance [
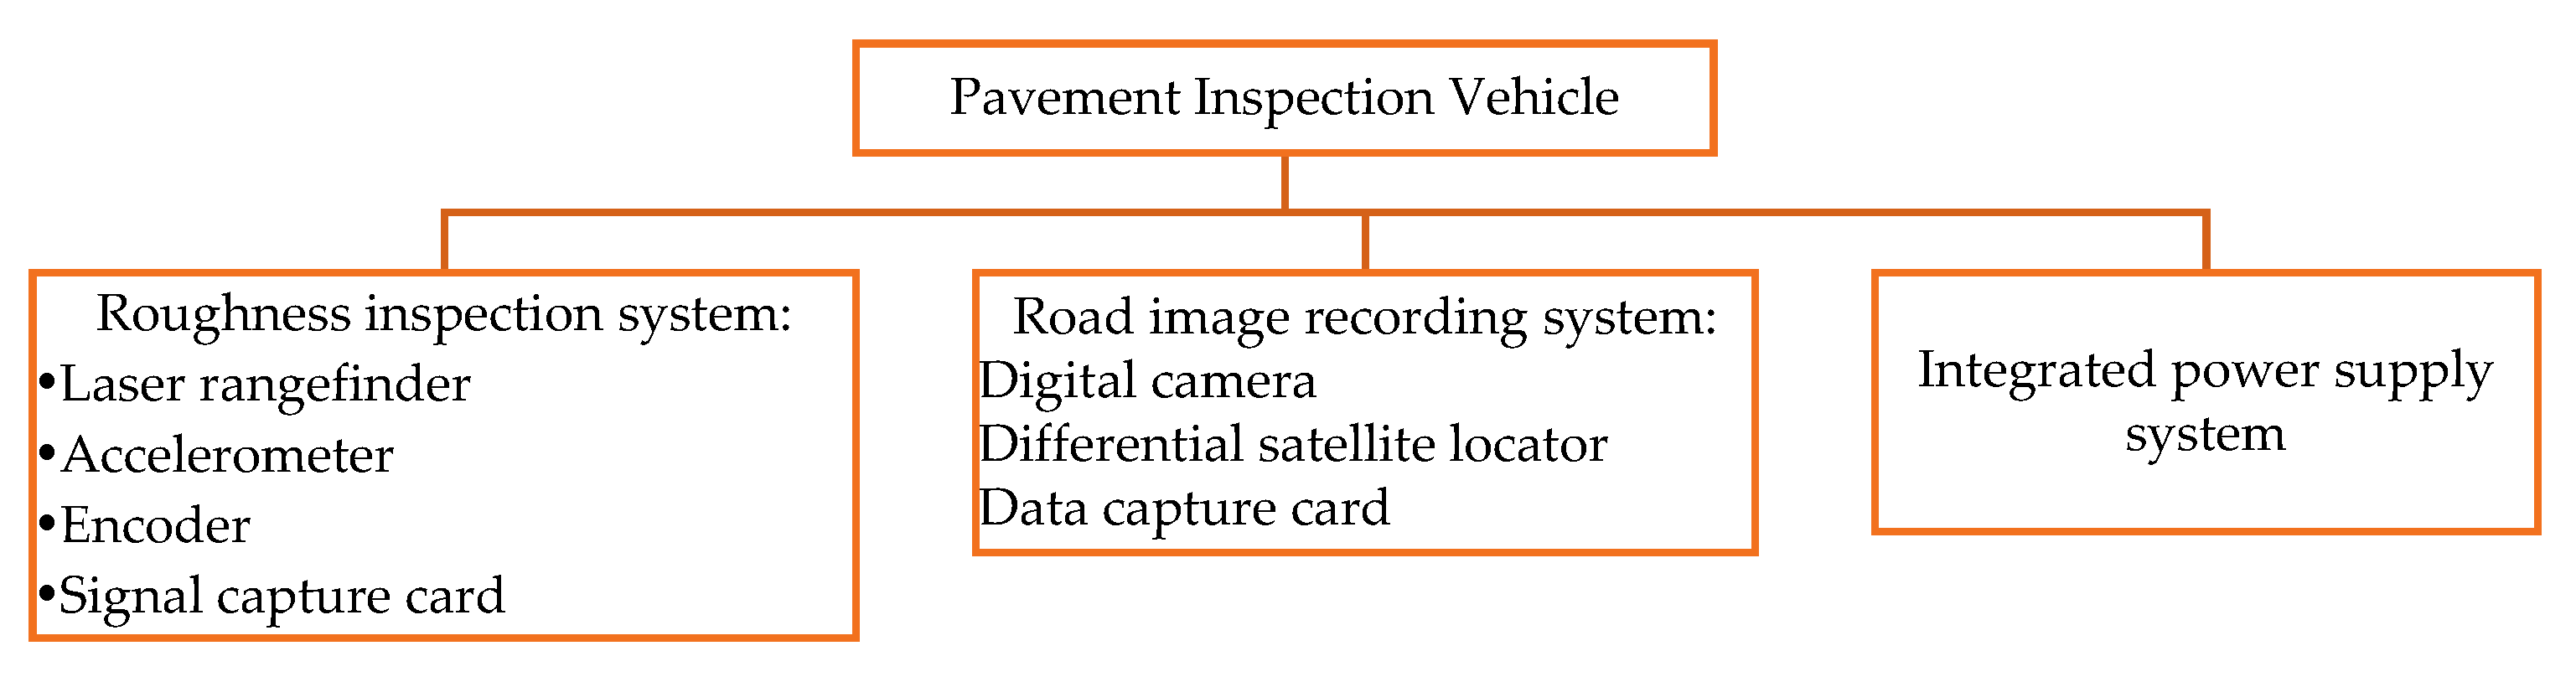
30]. The system architecture of this inspection vehicle was divided into a roughness inspection system, a road image recording system, and an integrated power supply system, as shown in
Figure 3, including in-vehicle equipment (video camera, Global Positioning System (GPS) signal receiver, distance measurement instrument (DMI) vehicle odometer, notebook computer, and information acquisition host) and sensors (a laser rangefinder and an accelerometer) installed in the rear bumper.
The main function of the laser rangefinder was to detect the vertical relative distance between the vehicle and the road, while the accelerometer measured the acceleration value where the laser rangefinder was located. The aforementioned data were used with the DMI to measure the distance of the vehicle, and the longitudinal profile change in the road survey line was calculated. The laser rangefinder, accelerometer, and vehicle odometer transmitted the signal to the data acquisition host installed in the car, and the host transmitted the data to the laptop computer in the car via a USB cable. At the same time, the system cooperated with the GPS signal receiver and webcam to perform numerical output, IRI calculation, GPS positioning, and right-of-way image integration. For the inertial profiler used in the Road Leveling Project in New Taipei City, the output profile elevation data and IRI values were verified for repeatability and accuracy, and the results met the requirements of CNS 15,371 [
31].
2.3. Execution of Roughness Inspection
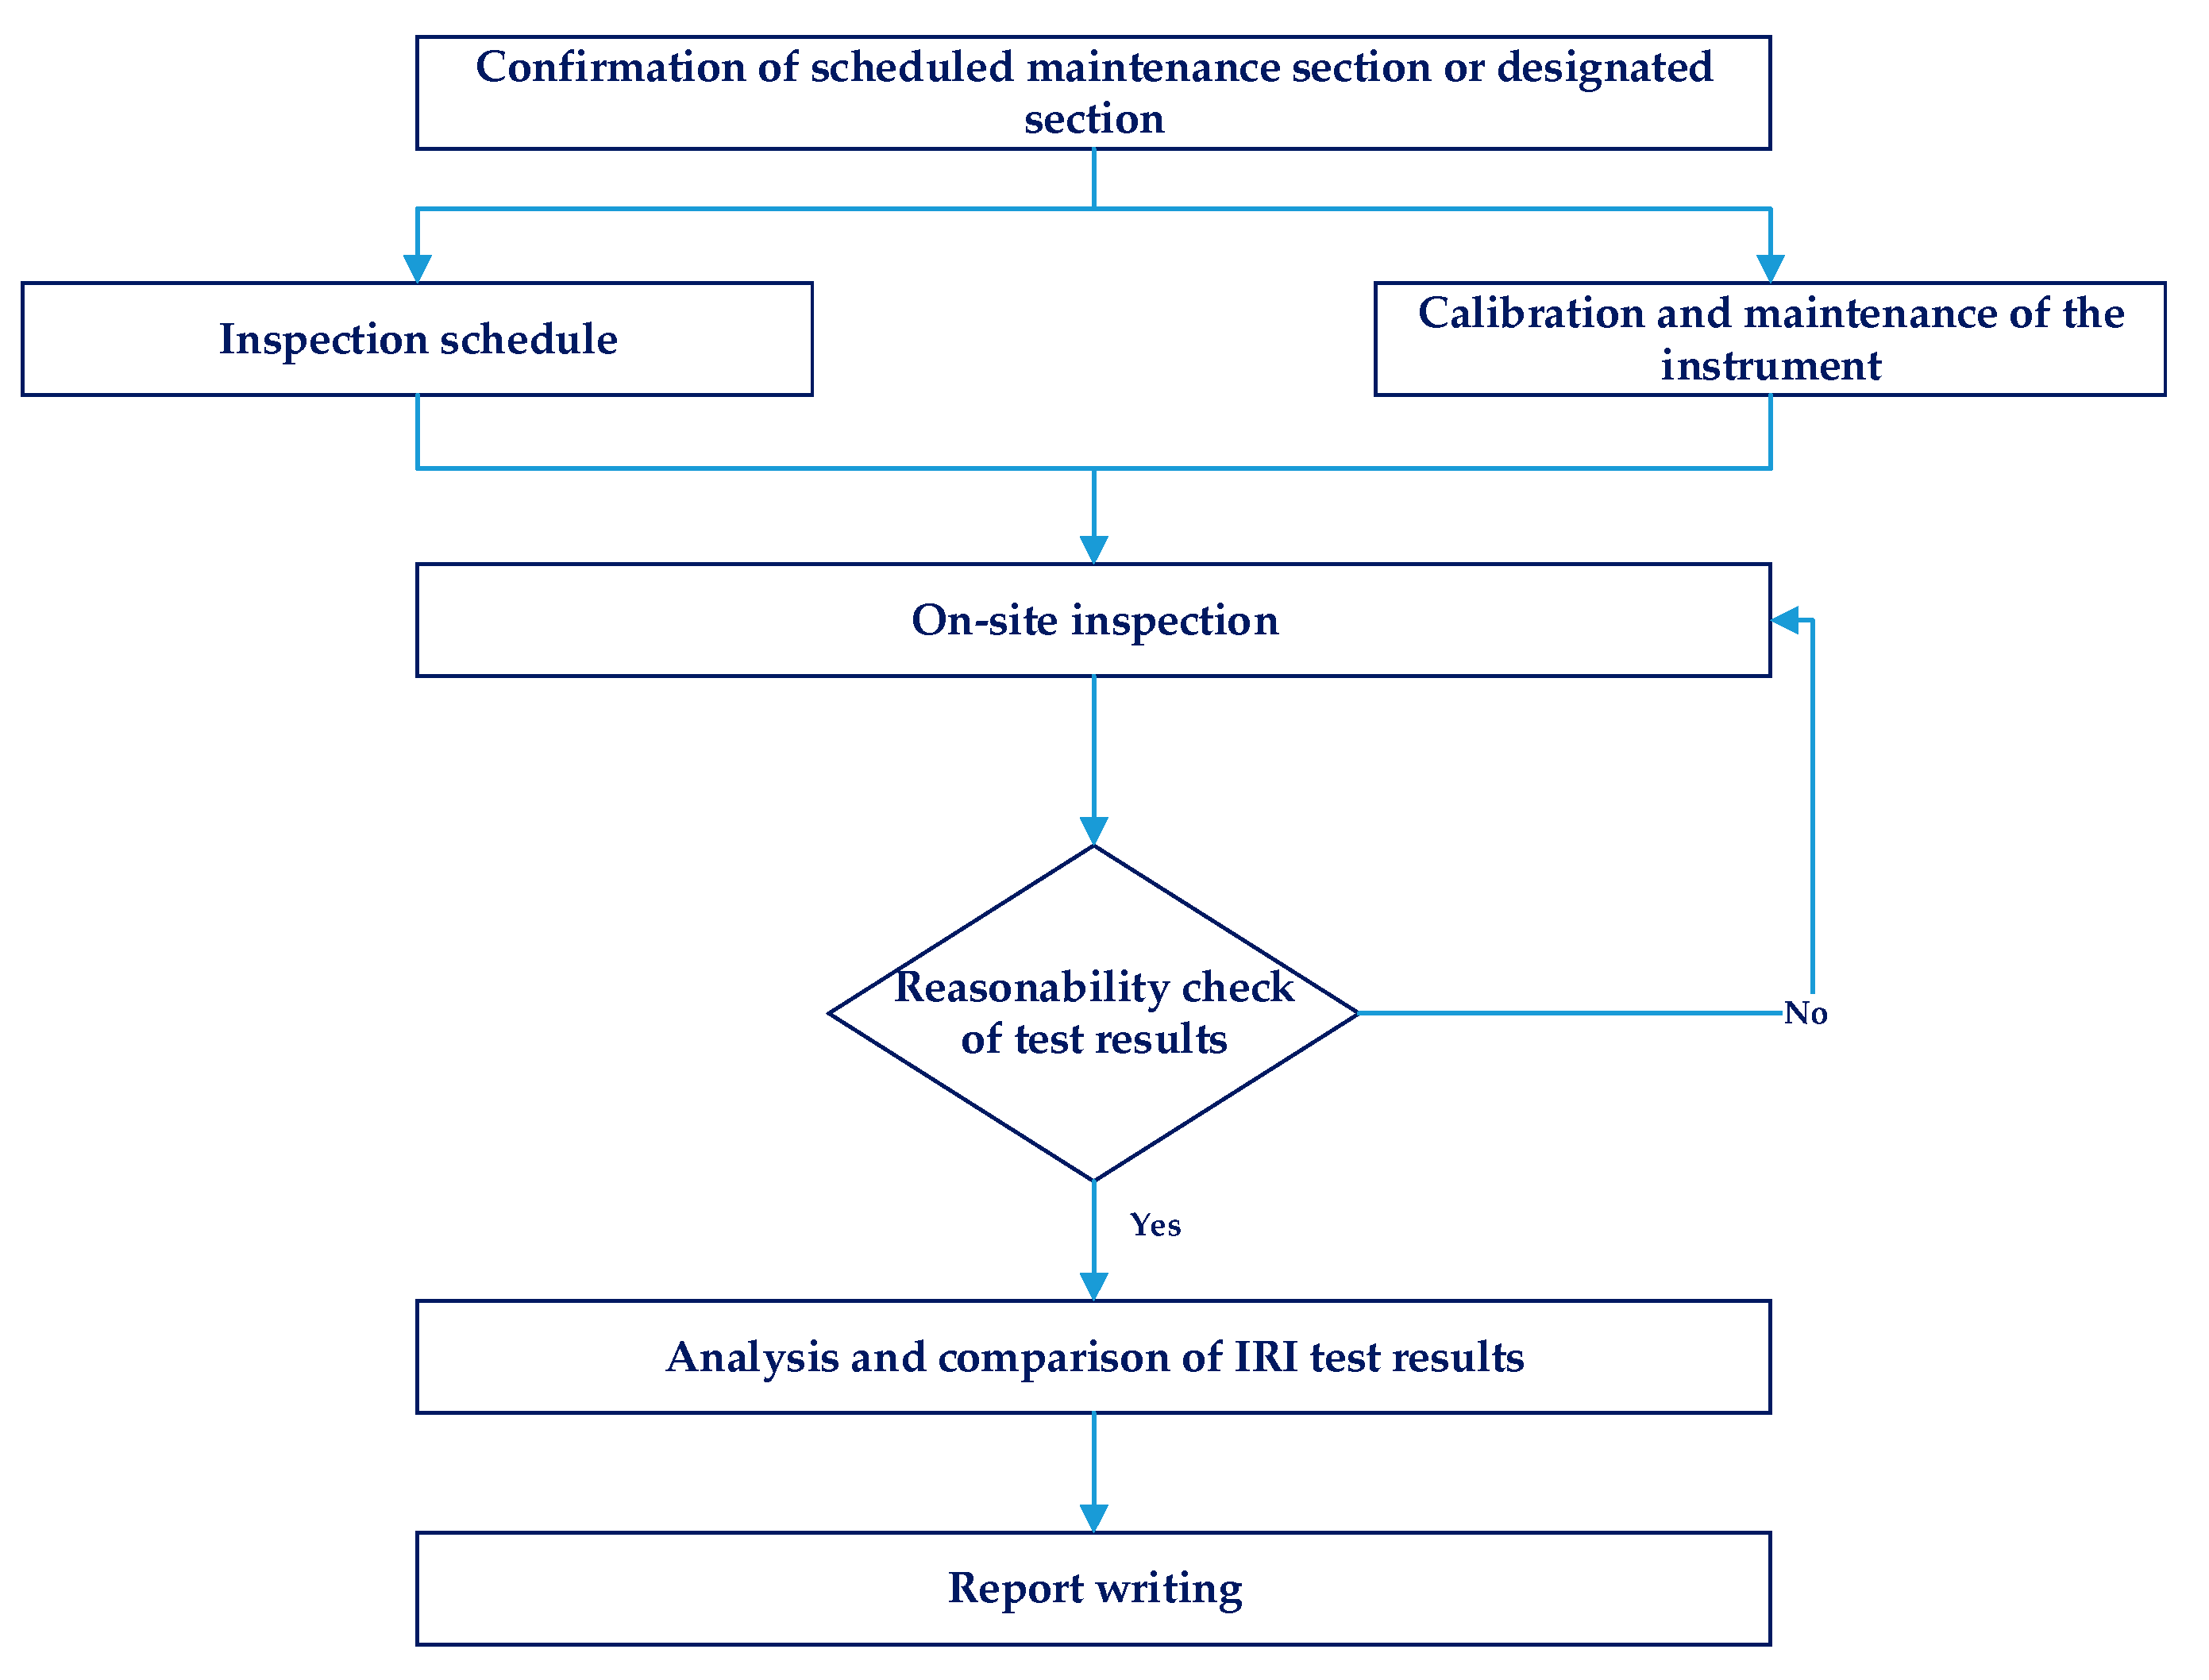
The New Taipei City Road Leveling Project stipulated that the improved road sections be tested and compared for roughness both before and after maintenance. Before the inspection, an overall plan of the road section to be inspected is formulated in order to determine the planned maintenance section or designated road section and to arrange the inspection schedule. In order to improve the comfort of the road, before the road surface is removed and sealed the manhole and handhole iron cover must be lowered and buried in the road section. In addition, the inferior subgrade of the road section is checked and renovated to increase the service life of the road. The calibration and maintenance of testing equipment such as the laser rangefinder, accelerometer, and vehicle odometer were carried out simultaneously with this process. Then, on-site testing was undertaken. During the execution of the Road Leveling Project, the testing instruments were calibrated regularly. After completing the inspection operations, the reasonableness of the measured road section data must be checked. If the data are within a reasonable range, the inspection operation of the road section is ended. Otherwise, it must be retested. The overall inspection workflow is shown in
Figure 4.
The driving speed during detection should be greater than 25 km/h, and the speed should be as stable as possible. The system software of the inspection vehicle uses high-frequency sampling (recording data every 25 cm) to automatically detect and analyze the longitudinal profile data at the track of the wheel. During the detection process, the vehicle speed, distance traveled, laser rangefinder measurement value, and acceleration value are displayed on the computer screen in real time. The software calculates and outputs the IRI value at the wheel trajectory in real time when the inspection vehicle completes the length of the detection section (the default was 100 m).
3. Analysis and Discussion of Actual Measurement Results
3.1. Detection and Analysis of the Pavement IRI Value
During the execution of the Road Leveling Project, the inspection vehicle was driven over the planned maintenance section or designated road section in both directions. Digital images, pavement roughness, and pavement distress data were collected. These data were used to compare the performances of different roadways, pavement designs, and project planning and programming. When performing IRI testing, several local factors must be considered. These factors include inferior subgrade, manholes, handholes, alleys, street profile, bridge expansion joints, rightmost lane, etc., which often result in high detection data and affect the interpretation of pavement flatness. Therefore, in the process of IRI detection, if there is any road segment with the above factors, the IRI value is deducted and then re-measured to obtain the true value of road pavement flatness.
In this study, the detection direction of the inspection section was divided into a forward lane and a reverse lane, and the detection interval was 100 m. In the inspection record sheet, the vehicle speed, left (left wheel tracking) IRI, right (right wheel tracking) IRI, and average IRI were recorded in detail. Then, the average IRI value was used as the basis for various statistical analyses and calculations. Taking the inspection of the second section of Xiwan Road in Xizhi District as an example, the length of the inspection was 1520 m; the direction from Balian Road to the third section of Xiwan Road was forward; otherwise, it was reverse.
Every 100 m, the IRI corresponding to the detection and analysis interval was determined, as shown in
Table 3. In the forward direction, the detection lane from 0 to 100 m in the direction of Balian Road to the third section of Xiwan Road had an IRI of 5.63 m/km, while in the reverse direction, the detection lane from 0 to 100 m in the direction of the third section of Xiwan Road to Balian Road had an IRI value of 7.59 m/km. In the overall IRI data of the second section of Xiwan Road, the average forward direction was 5.65 m/km, the maximum occurred from 1k + 500 to 1k + 520, and its value was 8.00 m/km. The reverse average was 5.99 m/km, the maximum occurred from 1k + 520 to 1k + 500, and its value was 7.59 m/km.
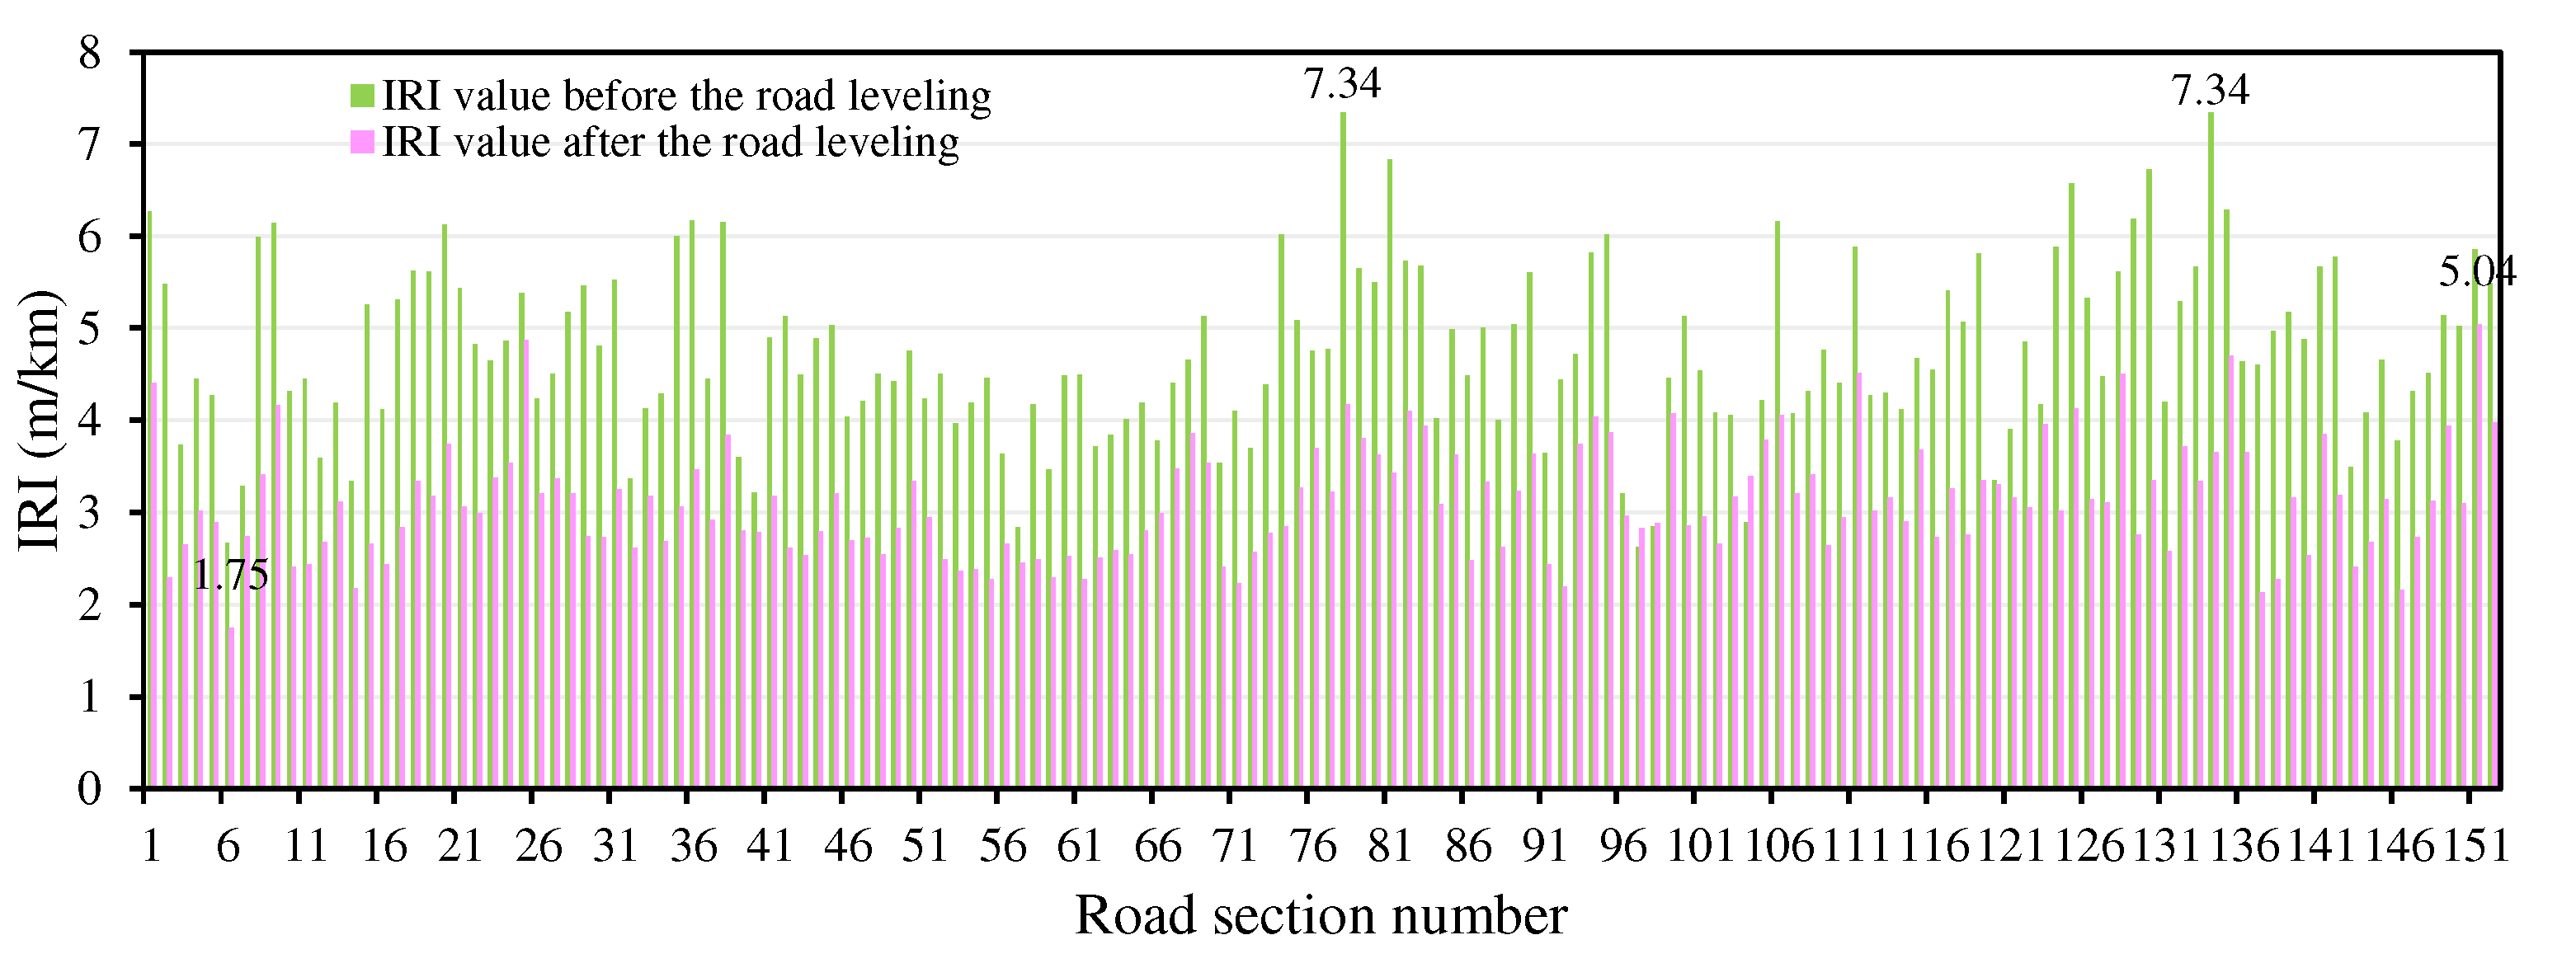
As part of the Road Leveling Project in New Taipei City, a total of 152 asphalt concrete pavement sections were tested for IRI values, with a total length of 479.8 km. From
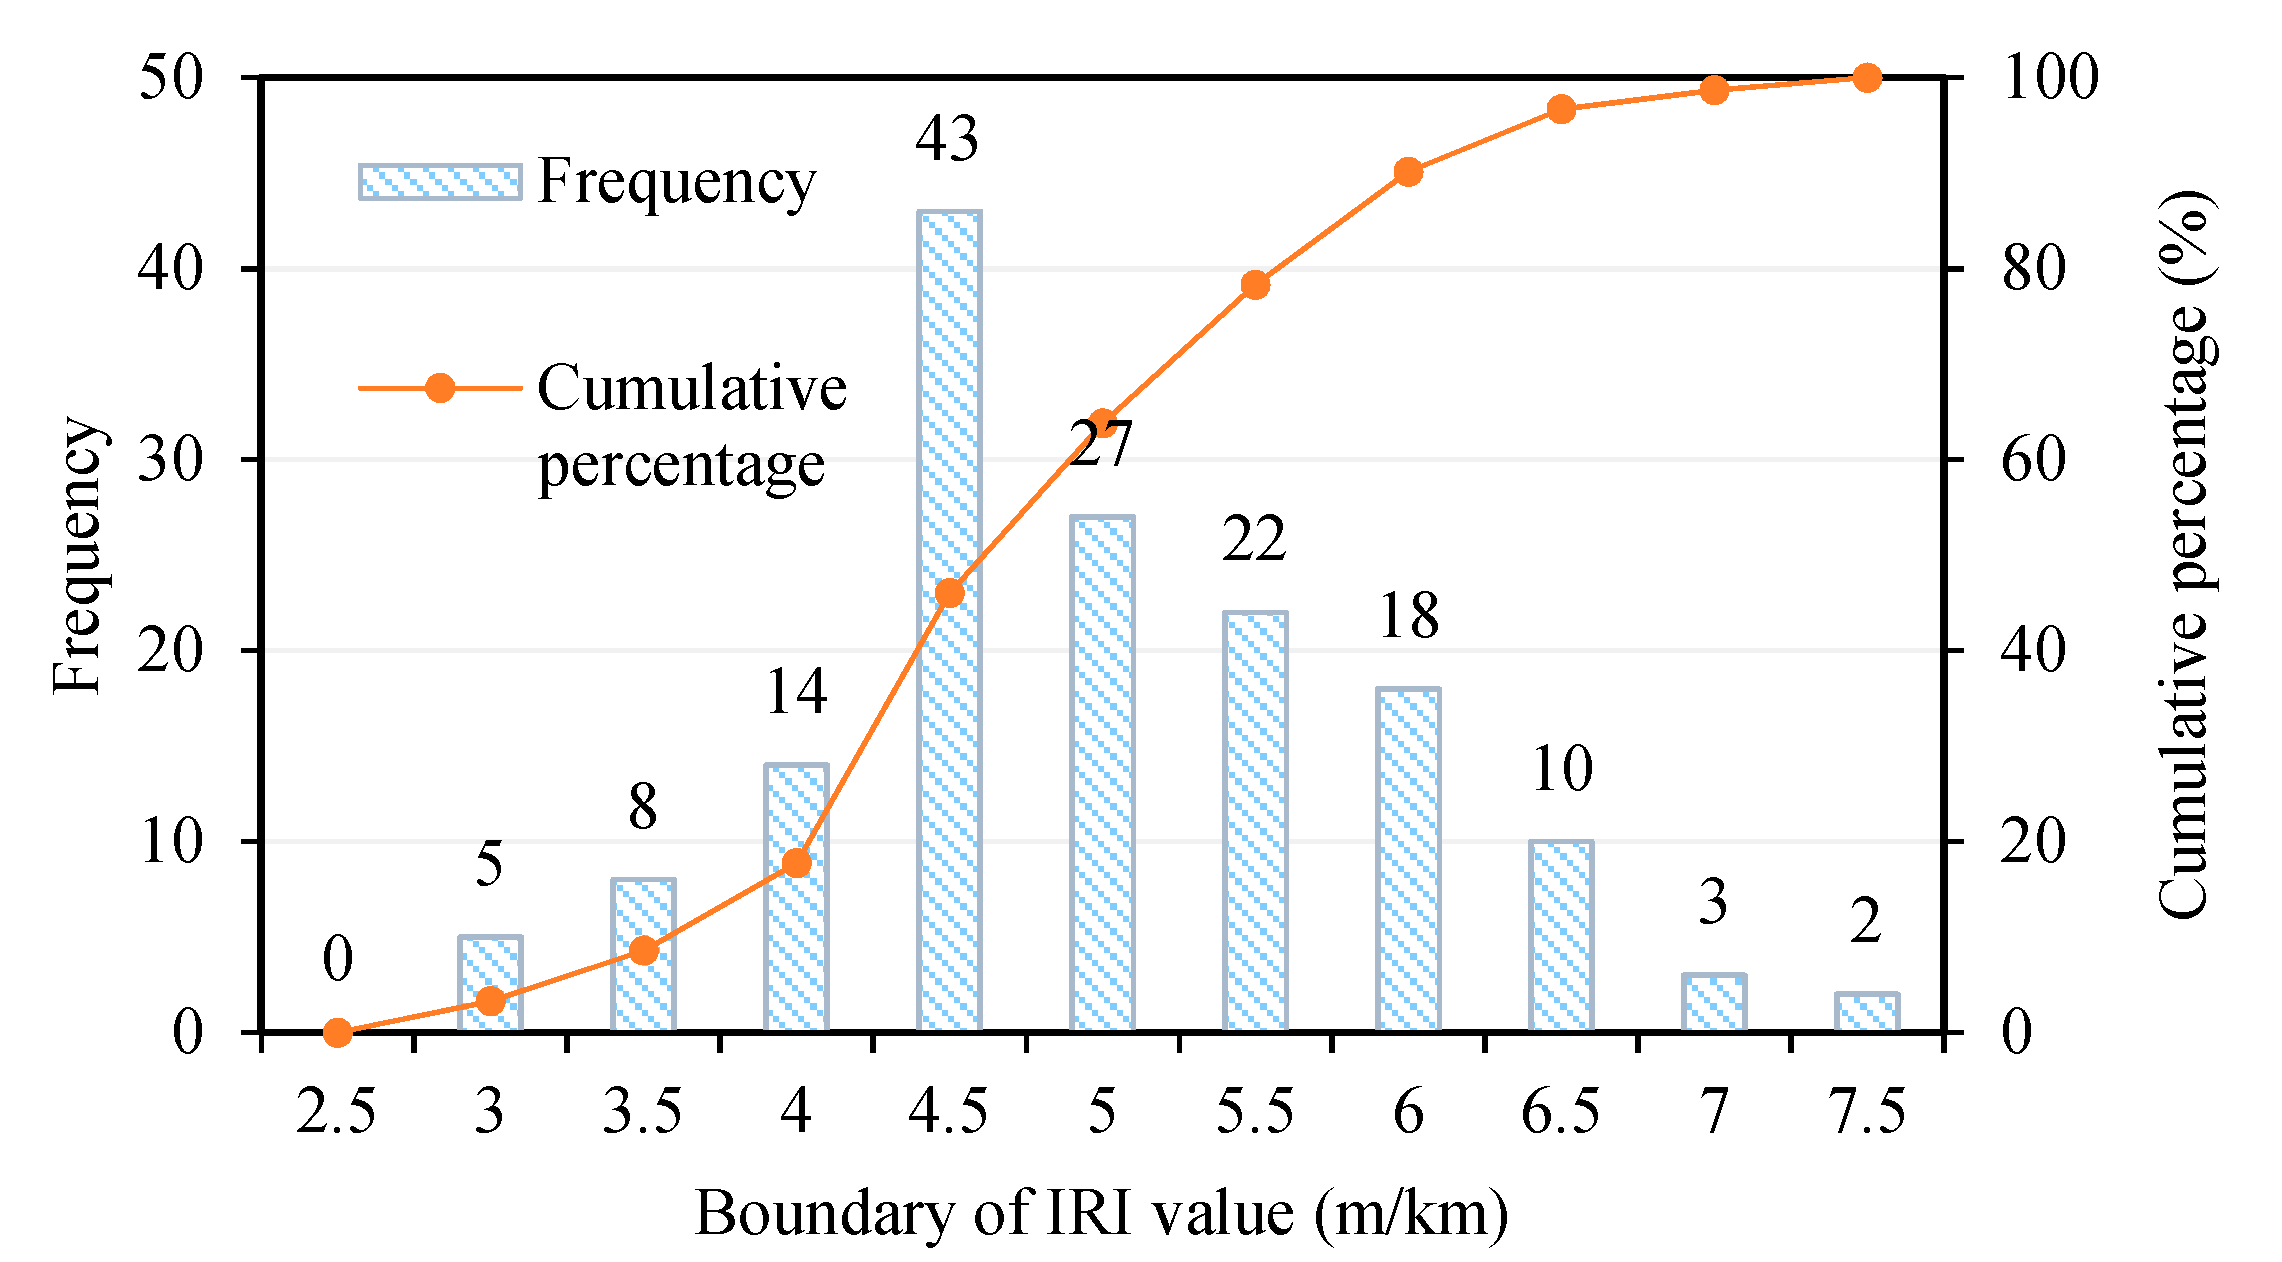
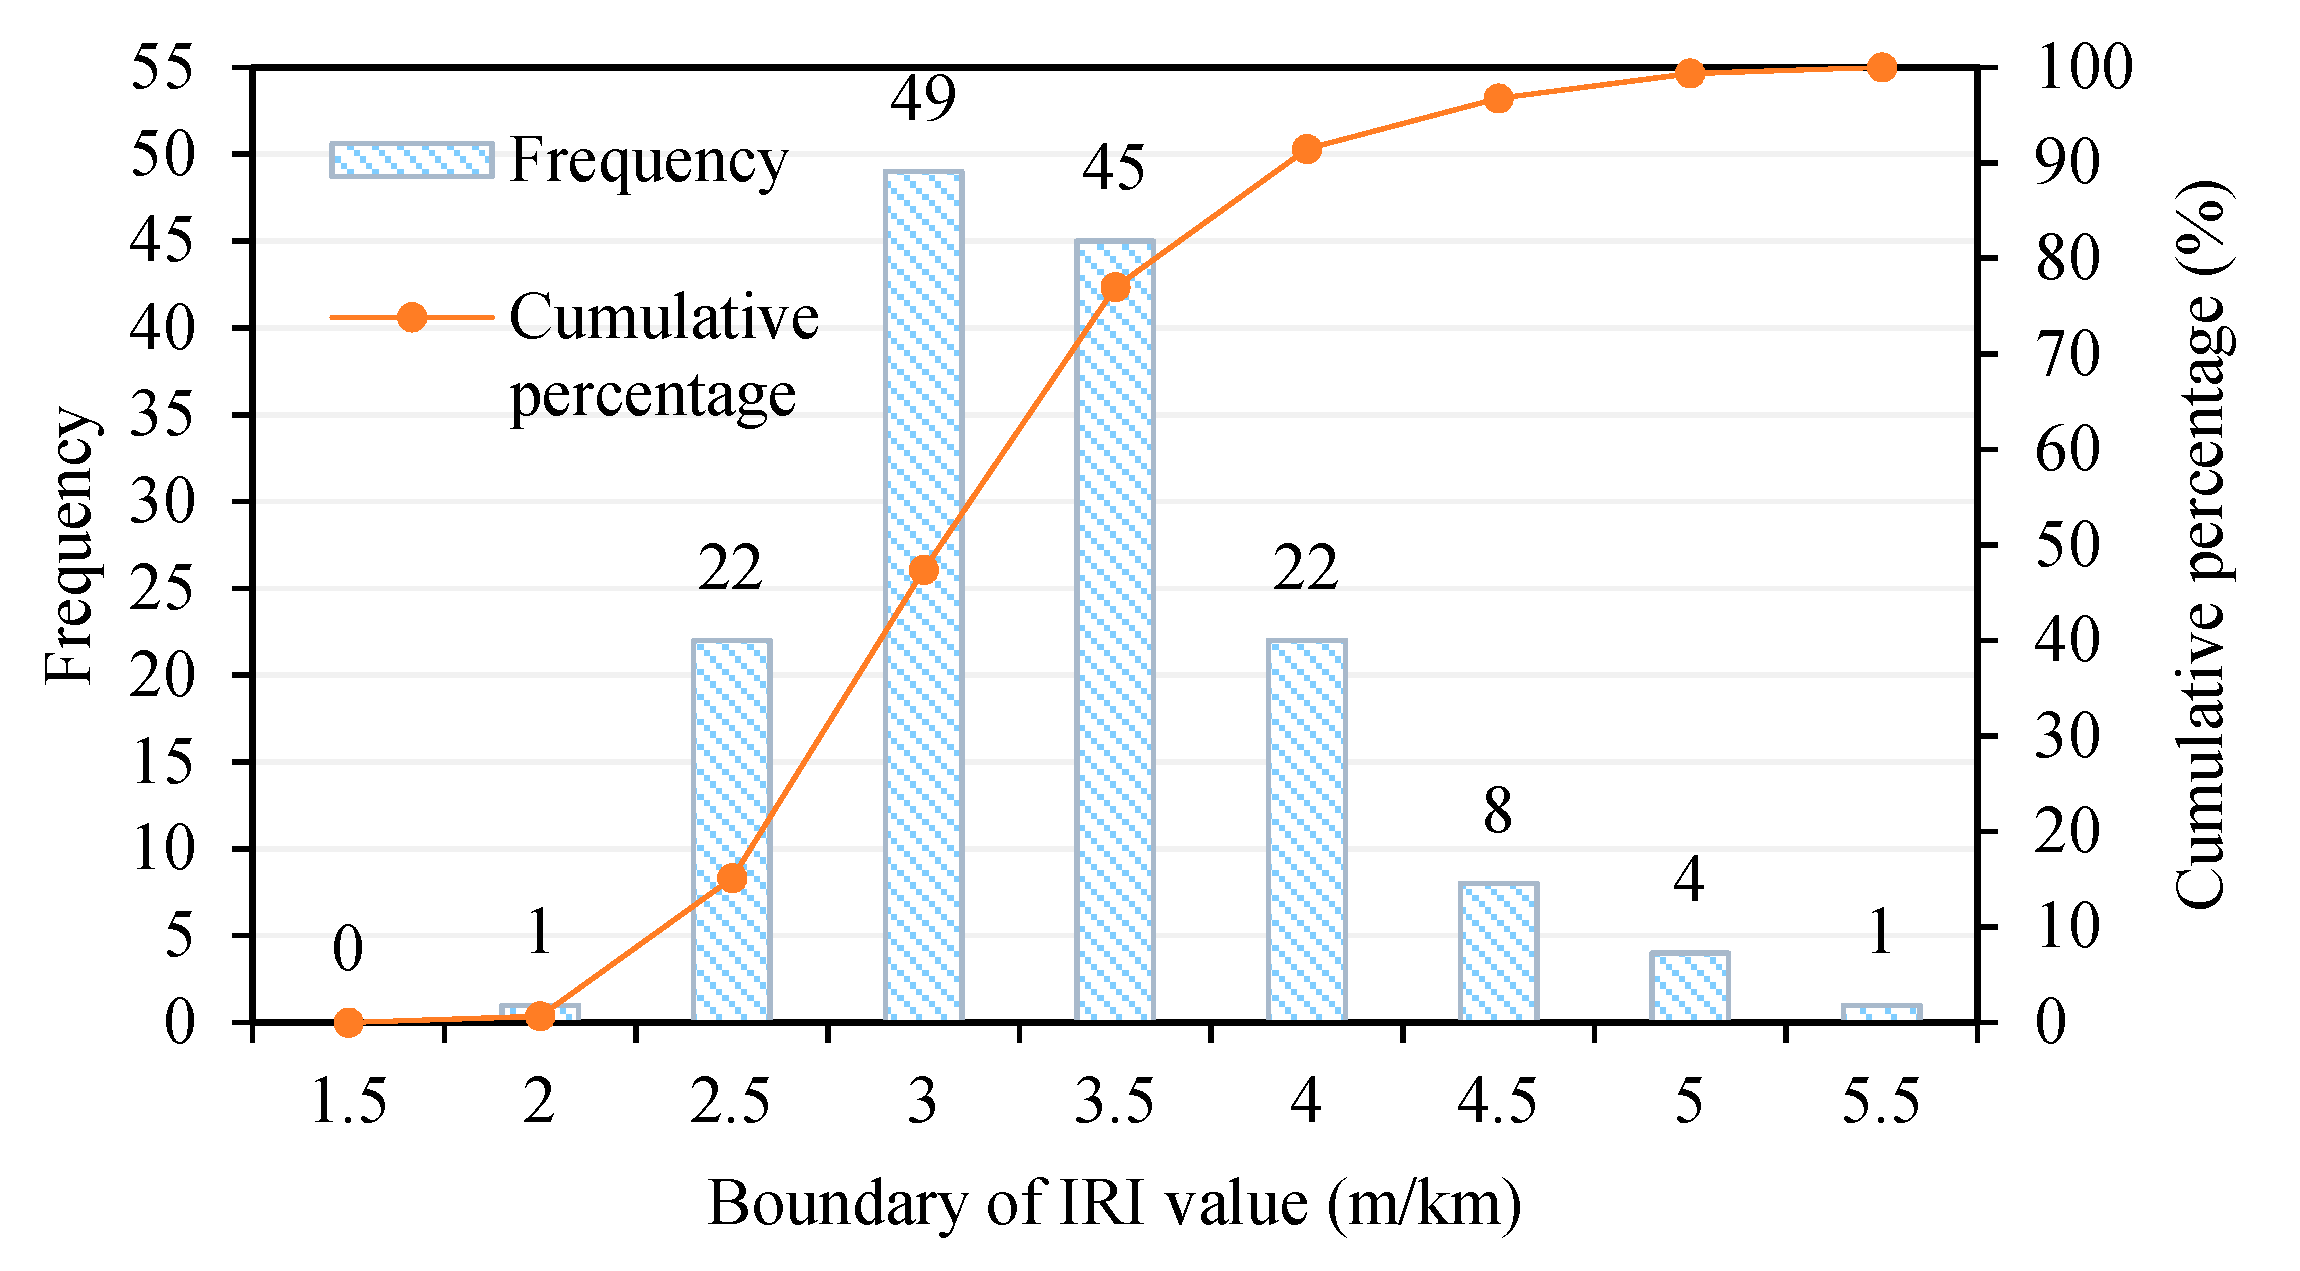
Figure 5, the IRI data before road leveling covered a wide range of road roughness values, ranging from 2.62 to 7.34. In contrast to the IRI data before road leveling, the distribution range of the IRI data after road leveling was narrow, with values ranging from 1.75 to 5.04. The histograms of the calculated IRI distribution before and after road leveling are shown in
Figure 6 and
Figure 7, respectively.
From
Figure 6, it can be seen that 86.3% of the IRI value of the detected road section before leveling was between 3.5 and 6.5 m/km; in particular, the proportion of the IRI value less than 3.5 m/km was only 8.2%. By contrast,
Figure 7 shows that 81.6% of the IRI value of the detected section after road leveling was between 2.5 and 4.5 m/km, and the proportion of IRI value less than 3.5 m/km increased significantly to 77%. From this point of view, the IRI value after road leveling significantly decreased, which indicated that the quality of the road was improved.
3.2. Analysis of the Effectiveness of Pavement Improvement
The IRI value is calculated based solely on the observed results, without interpretation and without human interference. Therefore, it is more practical and fairer than other flatness evaluation indicators.
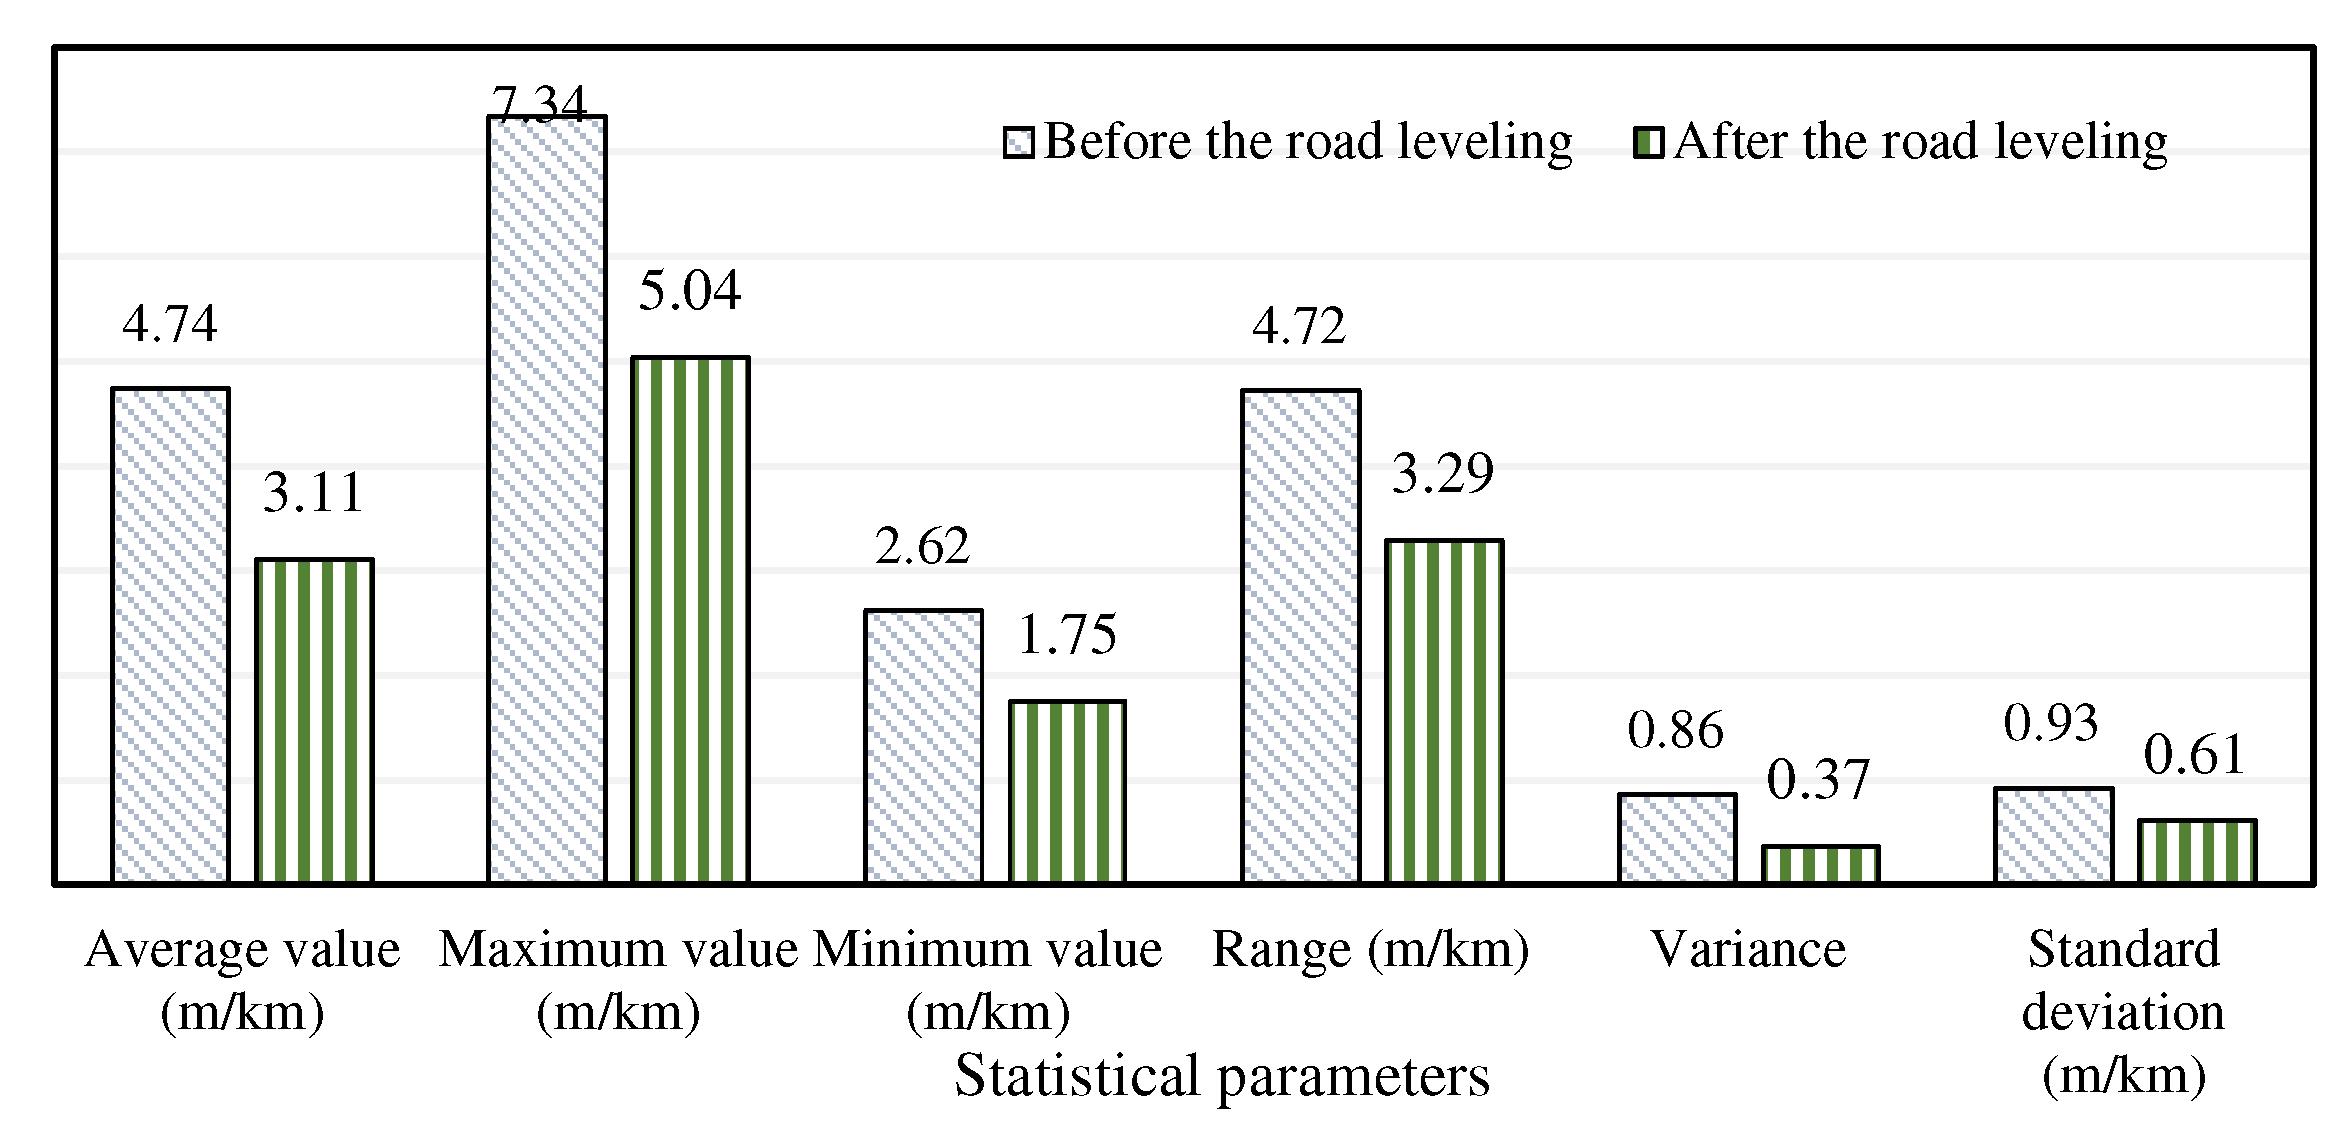
Table 4 summarizes the statistical parameters of the IRI value of the detected road section, including the average, maximum, minimum, range, variance, and standard deviation. Among these indicators, “range” is the difference between the maximum and minimum IRI values calculated for the detected road section and is used to evaluate the dispersion of road roughness. The average and standard deviation of the IRI values of the detected road sections after road leveling were significantly reduced, as shown in
Figure 8. This result confirms that the pavement roughness after road rehabilitation was improved. Therefore, it can be expected that the maintenance quality of the inspected section is at a good level. In other words, the difference in road quality became significantly smaller after road leveling was carried out.
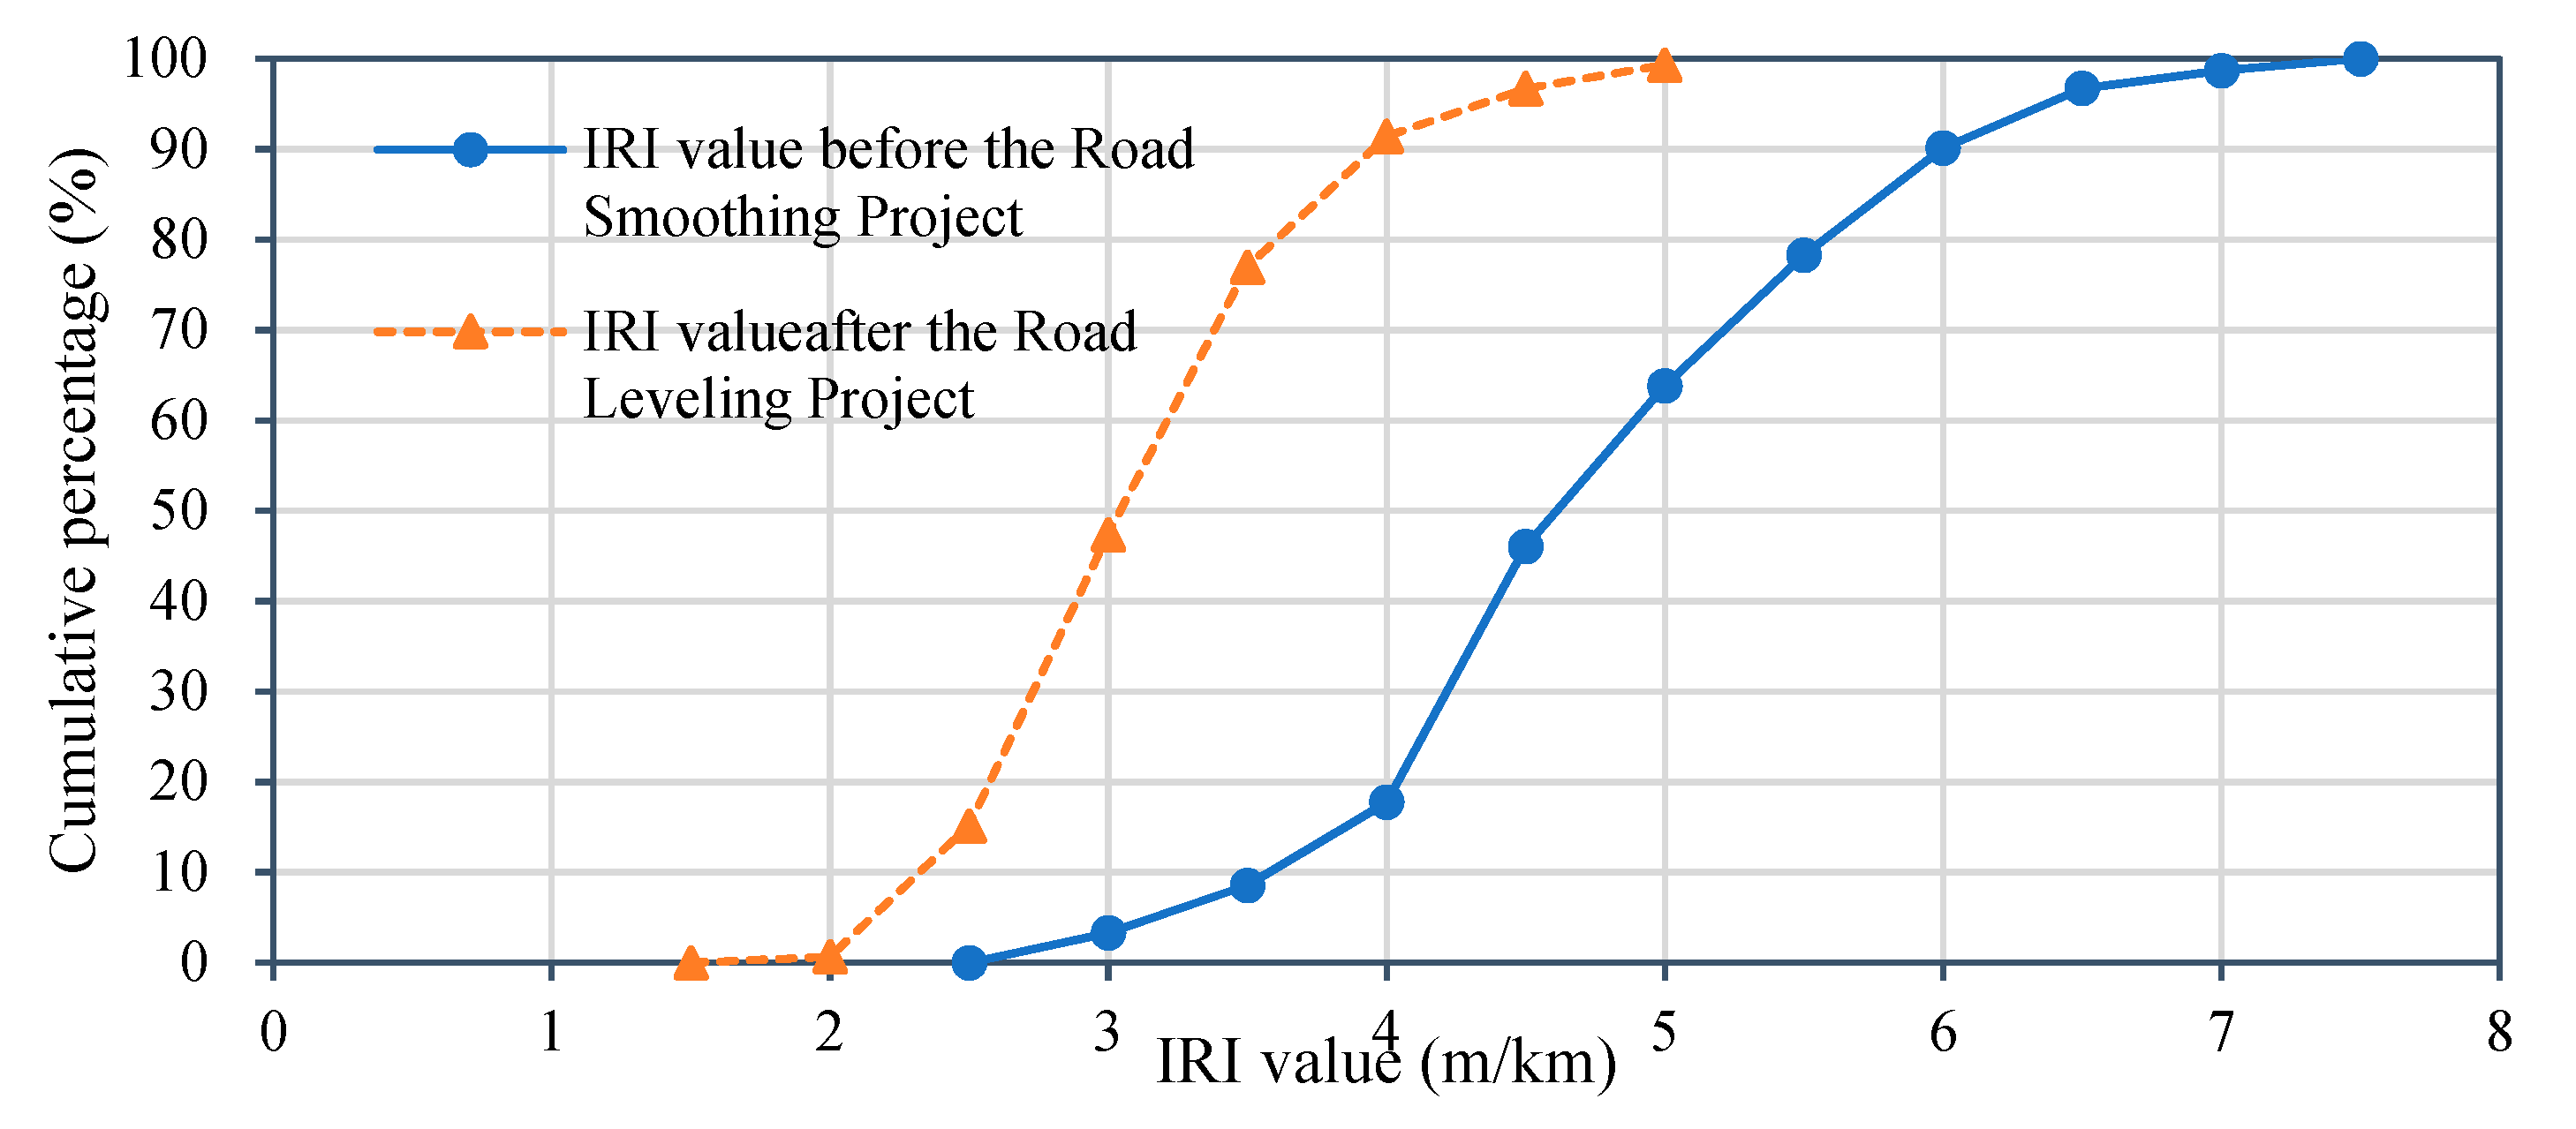
According to the detection results of the IRI value of each road section, the cumulative percentage of the IRI value before and after road leveling was calculated.
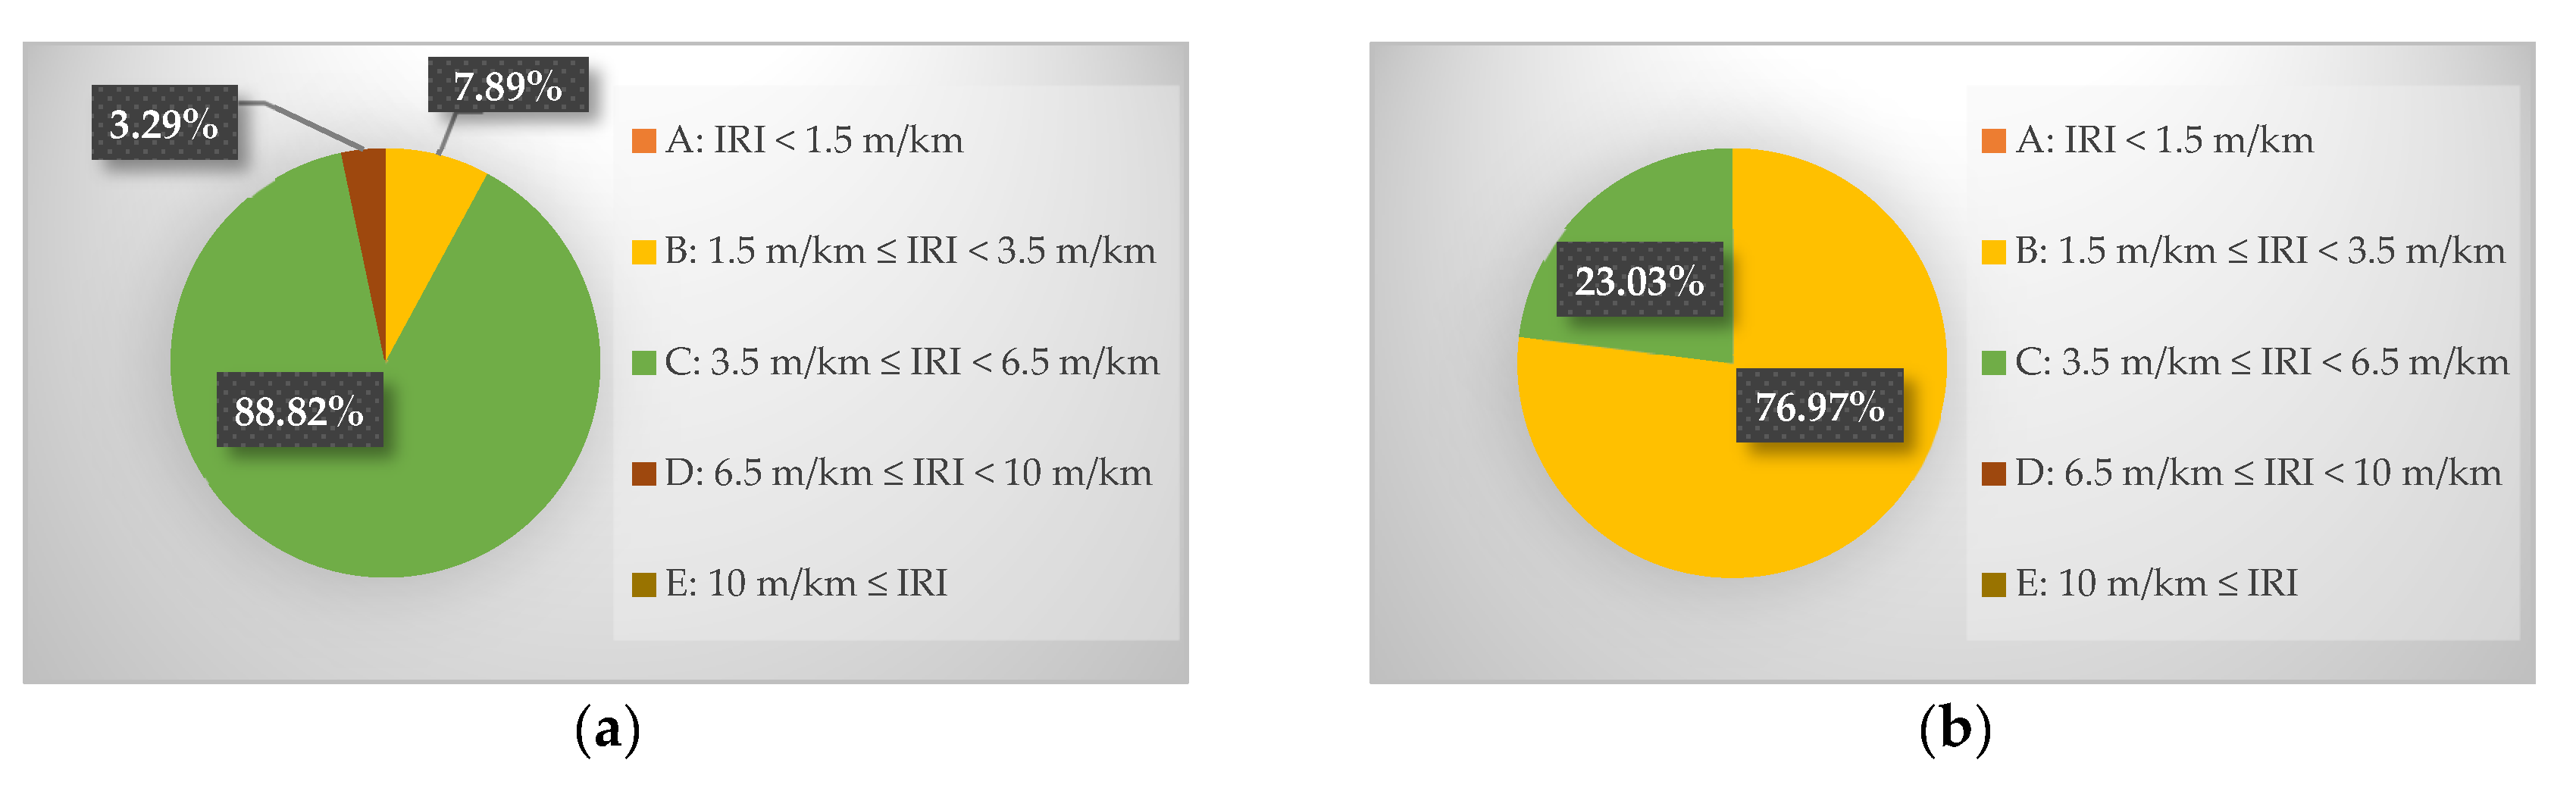
Figure 9 shows that the cumulative curve after road leveling moved significantly to the left, indicating that the IRI value of the detected road section had a downward trend, mainly ranging from 2.5 to 4.0 m/km. Compared with the IRI value corresponding to the Pavement Riding Quality Index (PRQI) in
Table 2, the IRI value before road leveling was only 7.89% for B grade, and as high as 88.82% for C grade, as shown in
Figure 10a. By contrast, the IRI value after road leveling was as high as 76.97% for B grade, and it was significantly reduced to 23.03% for C grade, as shown in
Figure 10b. This result indicates that the pavement driving quality in New Taipei City was significantly improved after road milling and repairing.
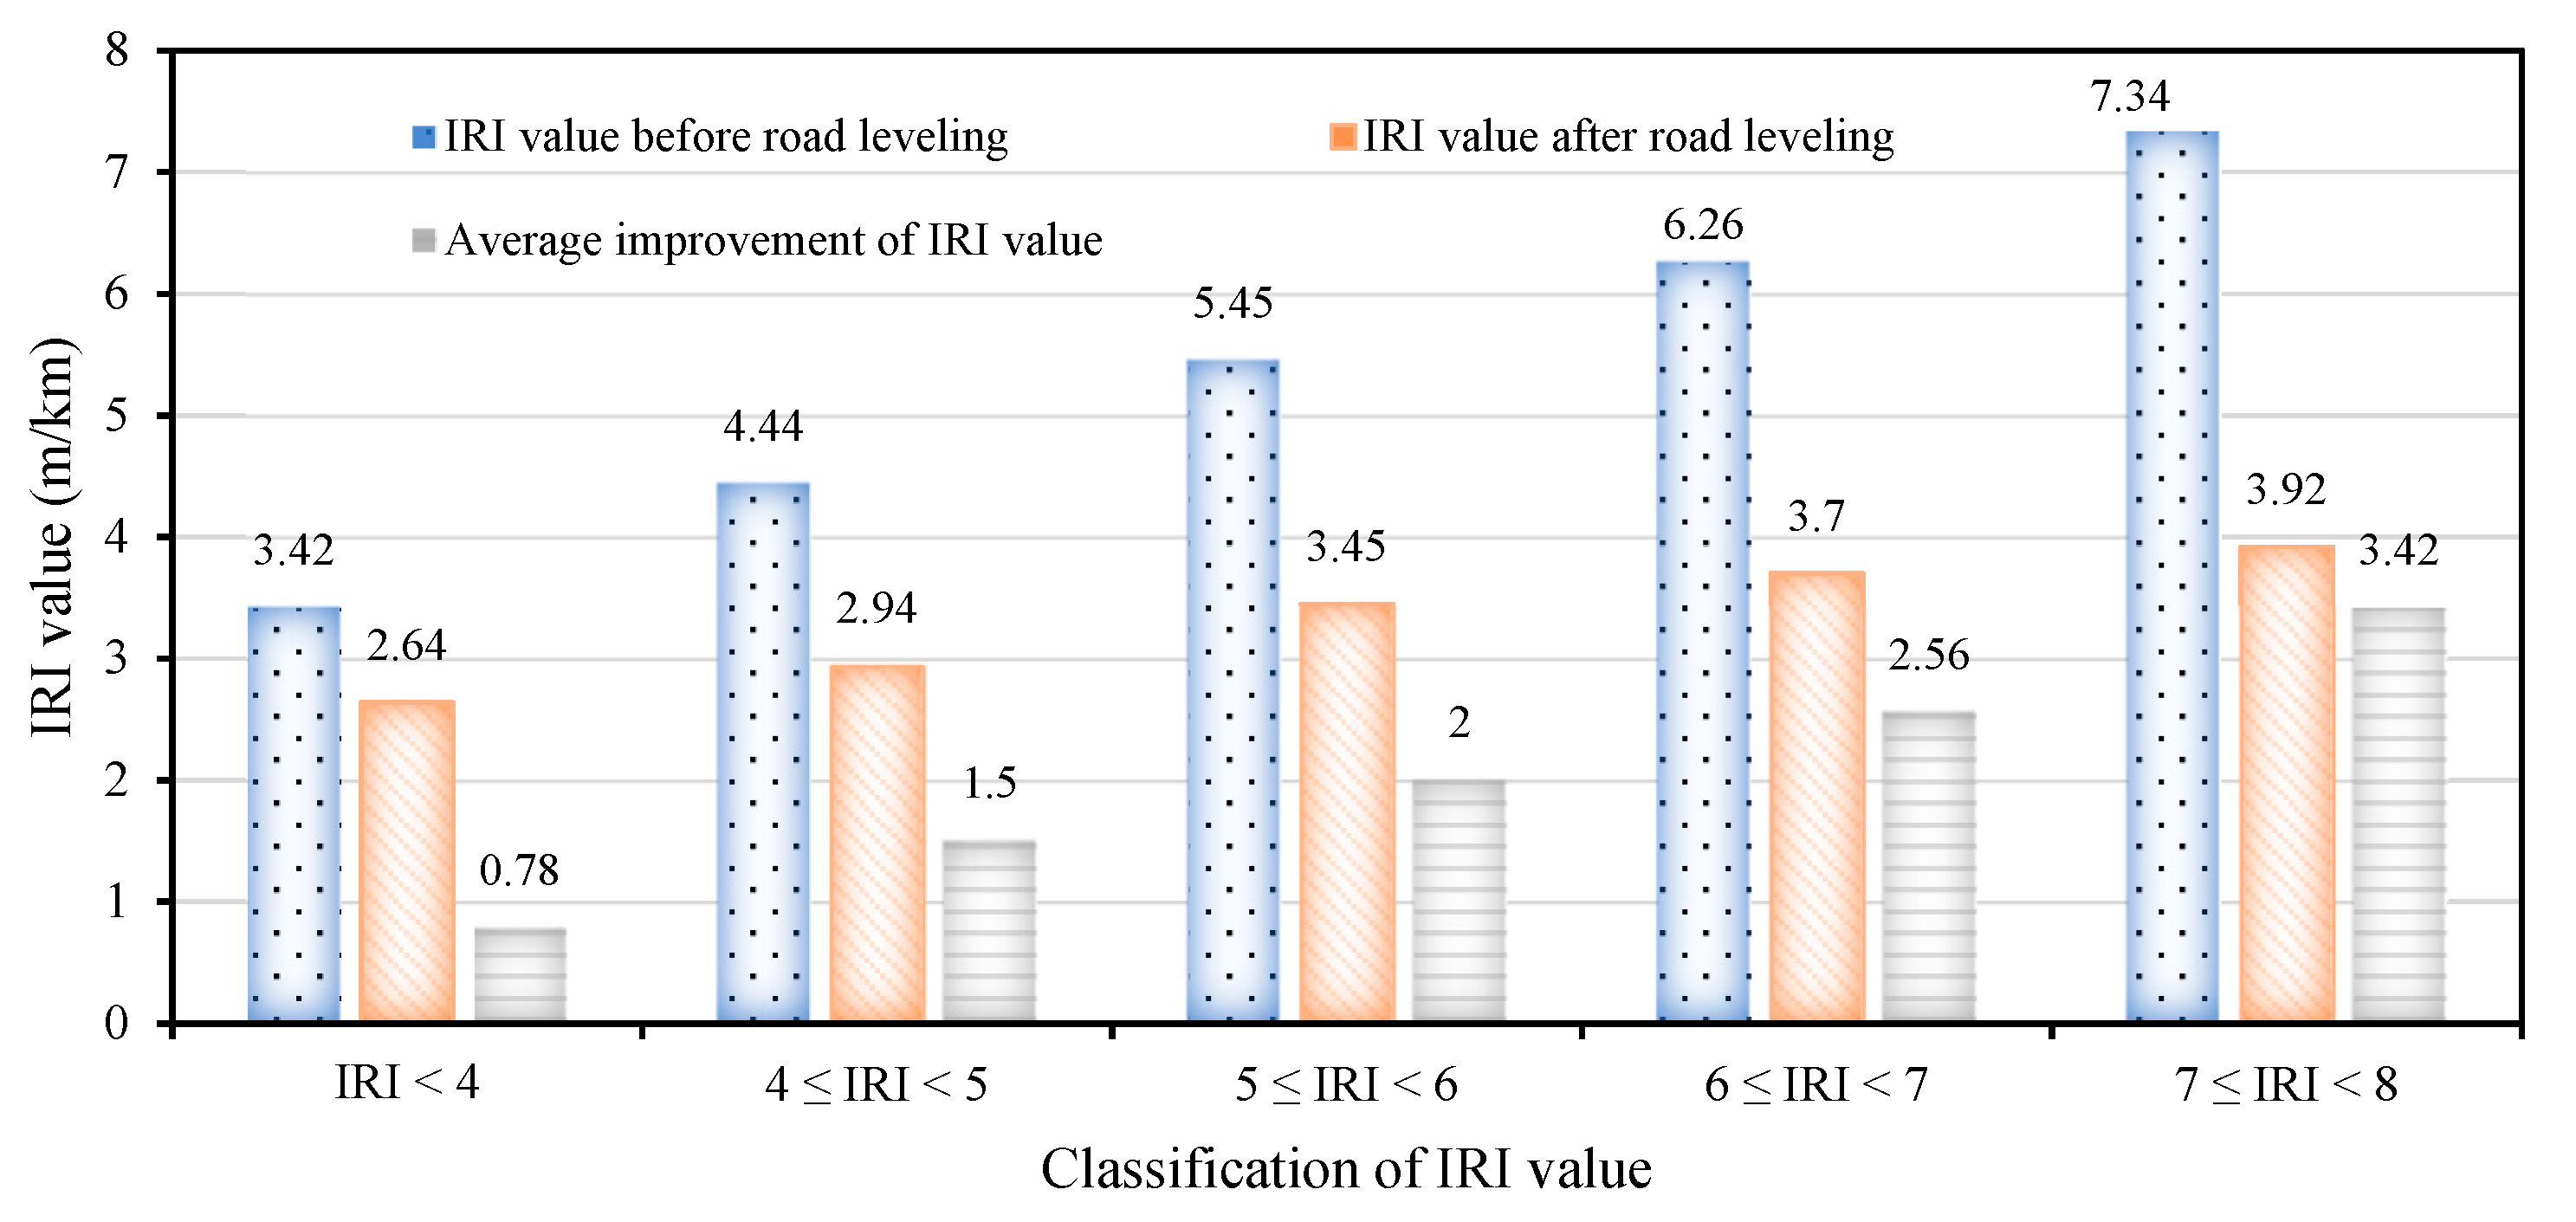
The IRI values of roads prior to leveling were divided into five categories (as shown in
Table 5) in order to facilitate understanding of the average effect of improvement on the IRI of various roads. It can be seen in
Figure 11 that when the original IRI value of the road was less than 4 m/km, the average improvement in the IRI value after road leveling was 0.78 m/km. When the original IRI value was within 7–8 m/km, the average improvement in the IRI value after road leveling was 3.42 m/km. In other words, when the original IRI value of the road was less than 4 m/km, the IRI value after the improvement was only slightly improved; when the original IRI value of the road was between 7 and 8 m/km, the improvement was more obvious. From this point of view, in the case of a limited budget, if priority is given to road sections with poor flatness then the number of road sections with poor service quality can be effectively reduced and the overall road service level can be improved. In addition, using the data in
Figure 11 and basic information about the roads, it is possible to arrange a budget for roads with IRI values greater than a threshold, or to estimate the budget needed to improve roads with an IRI higher than a certain value.
3.3. Appropriateness of the IRI Threshold for Road Rehabilitation in New Taipei City
With the popularity of the IRI, countries worldwide have formulated road acceptance specifications related to it. In keeping with this trend, Taiwan’s road authorities have gradually begun to use the IRI as a reference for road evaluation. The Construction and Planning Agency, Ministry of the Interior, R.O.C., Taiwan, completed the draft specifications for the acceptance of urban road roughness in 2005 [
23]. They recommended that the IRI be used as the testing standard for the roughness of urban roads. For urban roads with an original IRI value greater than 6.5 m/km, the acceptance standards for road rehabilitation are those shown in
Table 6 [
32,
33]. Regarding newly-built urban roads and roads with an original IRI value not greater than 6.5 m/km, the road acceptance standards are as shown in
Table 7 [
32,
33].
As seen in
Table 6 and
Table 7, the assessed roads were divided into four levels, namely, expressways, main and minor roads, general minor roads, and laneways. Taking the main and minor roads in
Table 6 as an example, if the original IRI was between 6.5 and 7.5 m/km and the IRI after road rehabilitation was less than 4.5 m/km, the assessment result belonged to the qualified area. On the other hand, for all milled roads with a length of more than 200 m and a width of more than 8 m, the current regulations of the New Taipei City government mandated an IRI inspection. An IRI value less than 3.5 m/km represented the qualified areas, an IRI value between 3.5 and 4.2 m/km represented the corrected area and an IRI value higher than 4.2 m/km represented the redone area.
Among the 152 road sections detected in the Road Leveling Project, 147 had original IRI values not greater than 6.5 m/km, while only five road sections had original IRI values greater than 6.5 m/km. For road sections with an IRI value not greater than 6.5 m/km, according to the acceptance standard in
Table 7, 115 were qualified areas, 12 were corrected areas, and 20 were redone areas. The road sections of the corrected areas and redone areas are shown in
Table 8.
For the five road sections with an IRI value greater than 6.5 m/km, according to the acceptance standard in
Table 6, all were qualified after rehabilitation, as shown in
Table 9. From the above results, it can be seen that the percentage of qualified road sections with original IRI values greater than 6.5 m/km after road leveling was 100%, while the percentage of qualified road sections with original IRI values not greater than 6.5 m/km after road leveling was only 78.2%. This meant that the current regulations for urban roads from the Construction and Planning Agency have stricter requirements for road sections with original IRI values not greater than 6.5 m/km after road leveling.
On the other hand, according to the current road roughness inspection standards of the New Taipei City government, among the 152 road sections detected in the Road Leveling Project, 117 were qualified areas, 29 were corrected areas, and six were redone areas. The road sections of the corrected areas and redone areas are shown in
Table 10. From this result, it can be seen that the current road roughness acceptance specifications in New Taipei City are more stringent than the urban road roughness acceptance specifications of the Construction and Planning Agency, Ministry of the Interior, R.O.C., Taiwan.
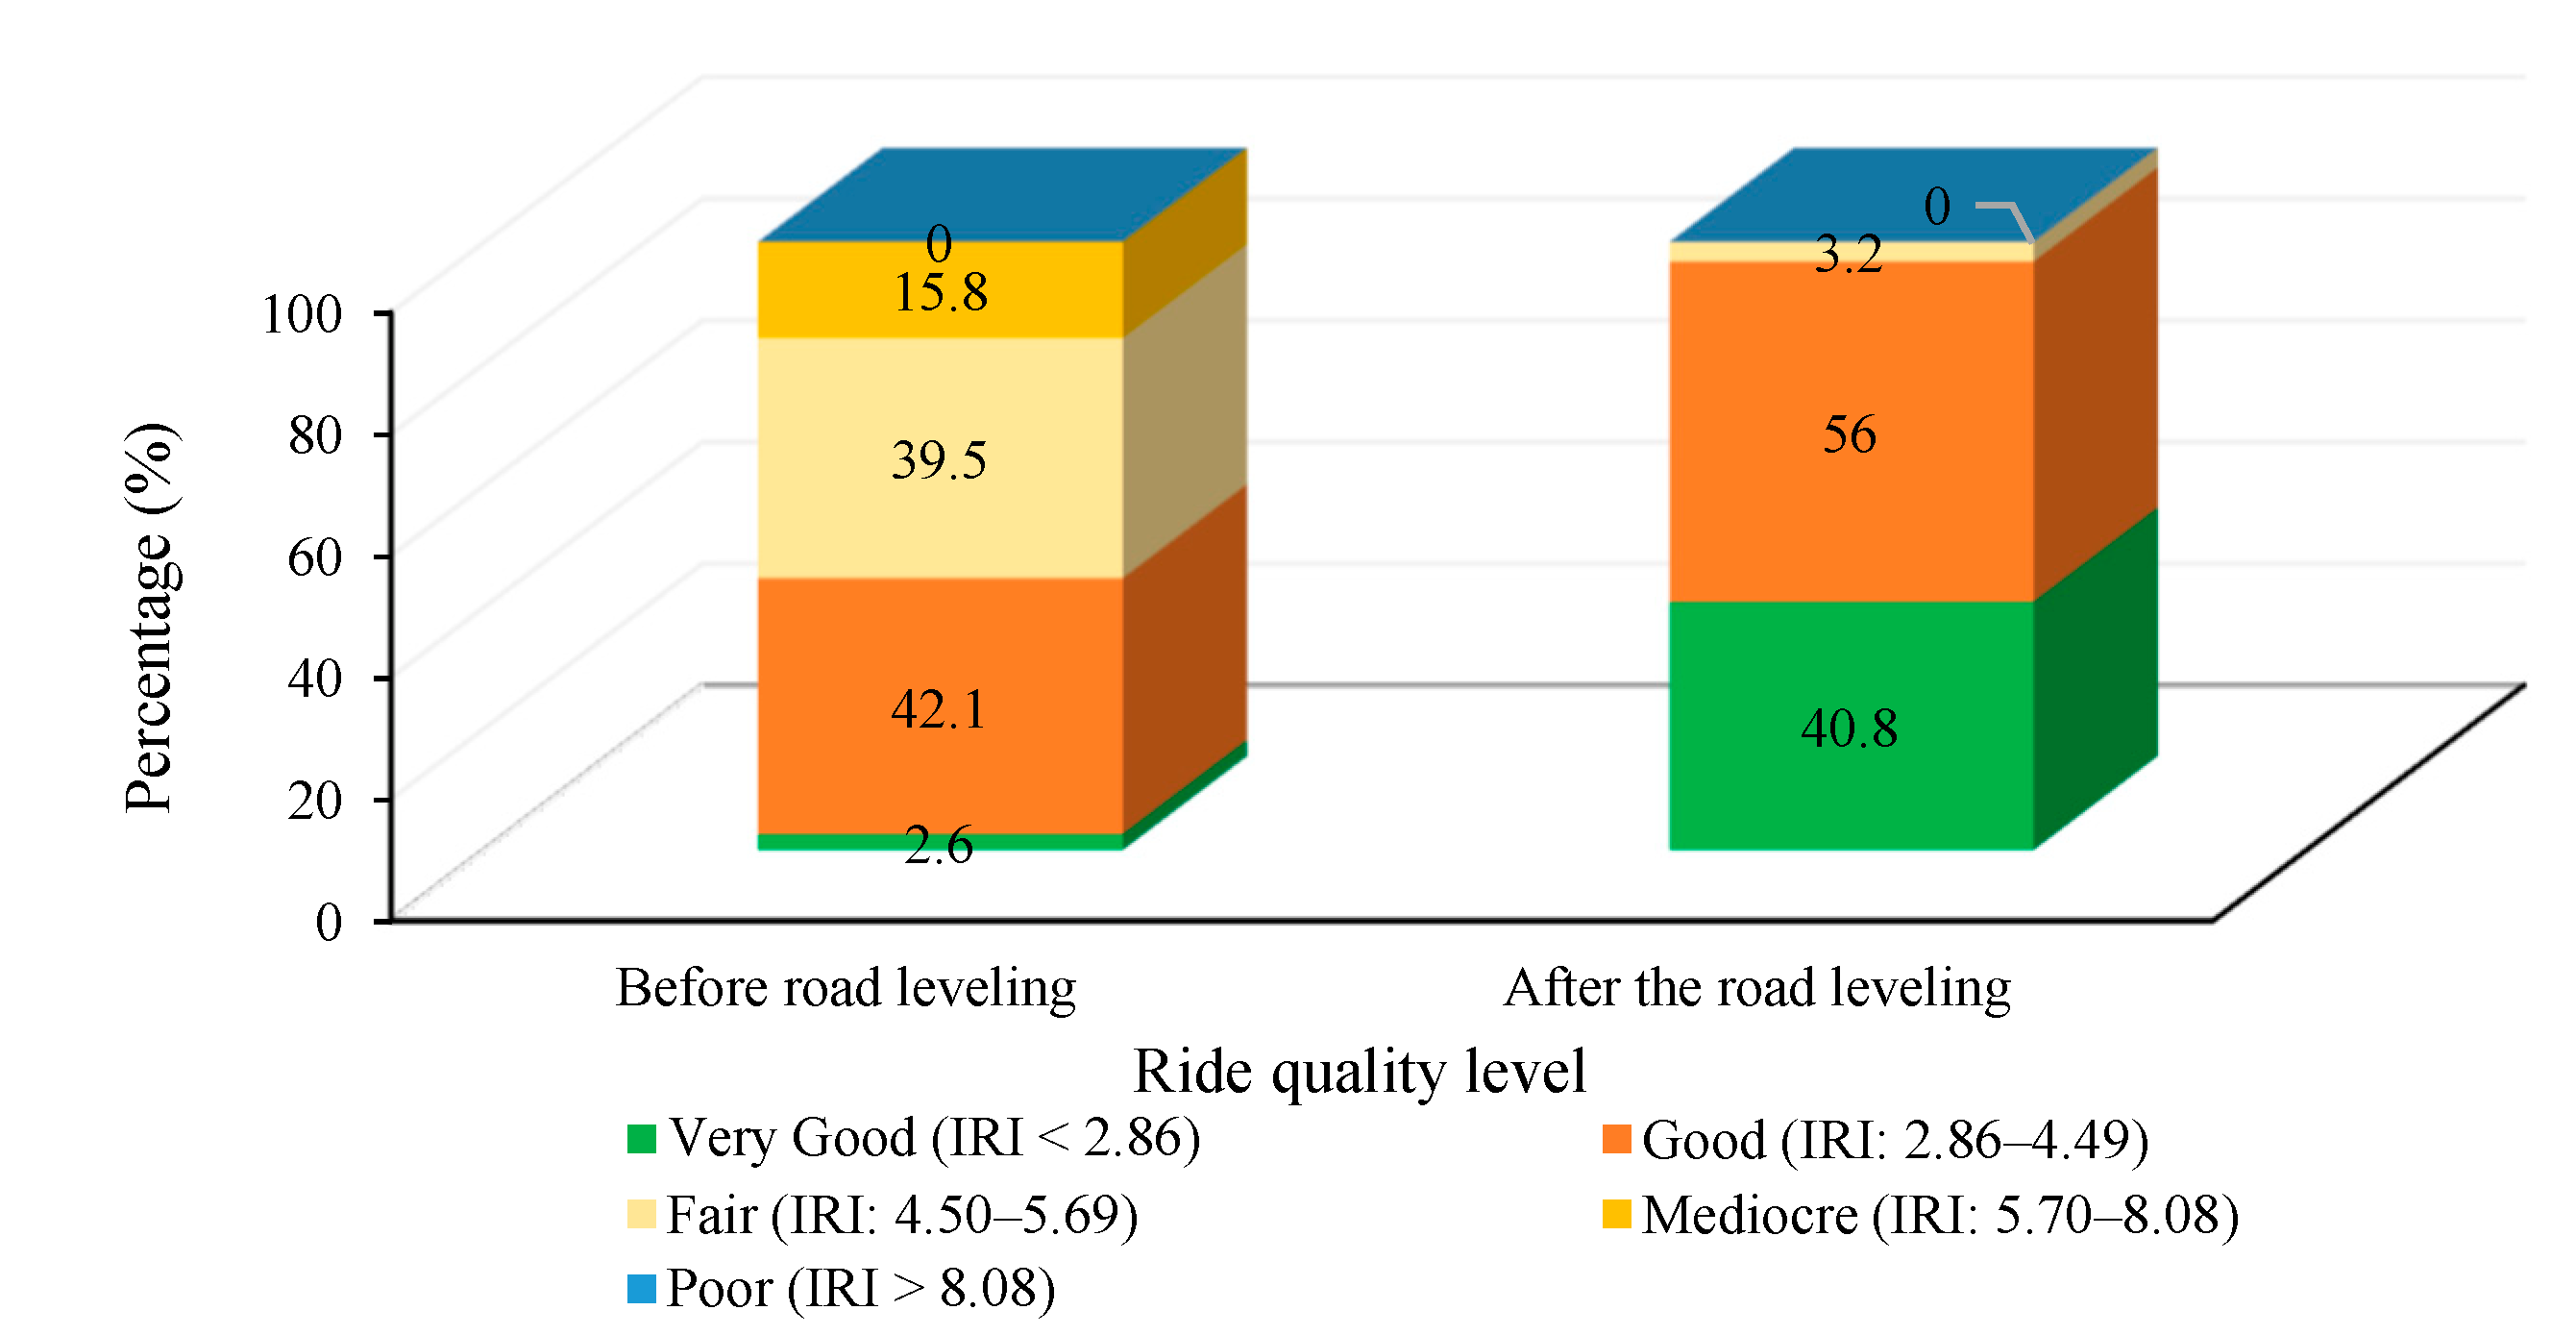
The IRI threshold value for road rehabilitation is not consistent around the world. As mentioned earlier, the speed of the inspection vehicle is a key factor. Yu et al. defined five ride quality levels based on the jolt and jerk experienced by the evaluator in a speed range of 10 to 120 km/h, and provided the corresponding IRI thresholds shown in
Table 11 [
23]. In this study, because of the high traffic volume in the urban area the speed of the inspection vehicle was maintained between 40 and 60 km/h. Therefore, if the driving speed was 40 km/h, the speed-related IRI thresholds were determined from the ride quality level in
Table 11 [
23]. As shown in
Figure 12, an IRI value less than 2.86 m/km indicated that the ride quality level was “very good”; an IRI value between 2.86 and 4.49 m/km indicated that the ride quality level was “good”; an IRI value between 4.50 and 5.69 m/km indicated that the ride quality rating was “fair”; an IRI value between 5.70 and 8.08 m/km indicated that the ride quality level was “mediocre”; and an IRI value greater than 8.08 m/km indicated that the ride quality level was “poor”. In addition, it was determined from the IRI range distribution in
Figure 11 that more than 15% of the detected road sections had poor roughness before leveling, which can make passers-by feel “very uncomfortable”. In contrast, after leveling, no IRI values for any road section fell into this range. The IRI value of the “very good” level of road sections increased significantly from 2.6% before leveling to 40.8%, indicating that the roughness after leveling was significantly improved.
The 152 road sections detected by this project in New Taipei City were all located in urban jurisdictions, and the detection standard was based on 3.5 m/km. For urban jurisdictions, the current road roughness acceptance regulations can be used as the basis for the acceptance of road service quality after rehabilitation. However, the various jurisdictions in New Taipei City are vast, and the gap between urban and rural areas is obvious. As for rural jurisdictions, mountainous roads are the primary road form. In this context, the applicability of the current regulations requires further review. When stipulating the IRI threshold on mountain roads, the influence of the vehicle body tilt when the pavement detection vehicle turns may, owing to inertia and other factors, affect the detection results, and should be considered. On the other hand, our IRI detection results showed that the IRI value of the rightmost lane was higher. This is because the rightmost lane is either the sidewalk side or the adjacent building side. These areas often have private slopes and the elevation of building bases, resulting in undulating road surfaces. In addition, the IRI values of intersections between the tested roads and alleys were higher. In view of this, we suggest that when local governments carry out road surface repair they consider the improvement of related road ancillary facilities (such as sidewalks, barrier-free ramps, demolishing of private ramps, etc.). Under feasible conditions, the elevation of alleys can be adjusted to improve the flatness of the rightmost lane.


