Article

Multi-Scenario Simulation Analysis of Land Use Impacts on Habitat Quality in Tianjin Based on the PLUS Model Coupled with the InVEST Model

College of Earth Sciences, Jilin University, Changchun 130061, China
*
Author to whom correspondence should be addressed.
Sustainability 2022, 14(11), 6923; https://doi.org/10.3390/su14116923
Submission received: 29 April 2022 / Revised: 1 June 2022 / Accepted: 2 June 2022 / Published: 6 June 2022

Abstract

:
Land use change is an important cause of habitat quality change. In order to reveal the impact of urban land use change on habitat quality, and to explore sustainable development planning, this paper uses the city of Tianjin, China, as a case study. Based on land use data from 2000, 2010, and 2020, the PLUS model was first used to predict land use in 2030 under three scenarios, and the InVEST model was then used to assess habitat quality from 2000 to 2030. This study showed that habitat quality was highly correlated with land use change. The rapid expansion of construction land was the main reason for the year-by-year decline in habitat quality. From 2000 to 2030, habitat quality in Tianjin declined year-by-year according to the average habitat quality values for 2030 for the three scenarios: the Ecological Protection Scenario (EPS) > Natural Development Scenario (NPS) > Economic Construction Scenario (ECS). In the EPS, habitat quality will deteriorate and improve. It would be ecologically beneficial to continue to work on the revegetation of the Jizhou area. In the ECS, habitat quality will decline sharply. In Tianjin, urbanization will continue to accelerate. This is a threat to the sustainable development of the city.

1. Introduction

Considering the economic development and rapid urbanization in China, the loss of land with ecological functions, such as woodlands and grasslands, and the exposure of habitat fragility, there is urgent need to find a reasonable urban landscape plan to maintain ecology and promote sustainable development [1]. The transformation of land-use types and their area changes will affect ecosystem services, and has a great impact on habitat quality and sustainable development [2]. Habitat quality refers to the ability of ecosystems to provide suitable resources to individuals and groups for sustainable development within a certain spatial and temporal period [3], and an in-depth study of habitat quality will provide a basis for more reasonable territorial spatial planning and urban development, which is of great significance for sustainable human development.
In recent years, scholars have been paying more and more attention to issues related to habitat quality, which is visually reflected in the current state of the ecosystem and is of great significance to regional urban planning and ecological environmental protection. It has become an important factor affecting the sustainable development planning of a city. Research methods are broadly divided into two categories: the first category assesses habitat quality by constructing a system of indicators affecting habitat, but ignores factors such as existing sources of threats. Another group of scholars assessed habitat quality based on the SLEUTH model [4] and the InVEST model [5,6,7]. The InVEST model has been widely used by scholars because it not only considers threat factors, but it also has good applicability and accuracy [8,9]. However, most studies have chosen ecological reserves as their study areas [10,11], and there are fewer articles focusing on cities, ignoring the importance of habitat quality studies for the sustainable development of cities; despite the increasing attention being paid to the impact of urban expansion on habitat quality, there are few existing studies on the topic.
Research on the prediction of future land-use data has been progressing with the development of machine learning. Initially, the FLUS model based, which is based on an ANN neural network, was widely used [12]; later, the use of CLUS-S appeared to solve the urban emergence problem in areas without historical cities [13]. In 2021, the newly developed patch-generating land-use simulation PLUS model, by Liang et al. [14], was not only able to simulate historical land type emergence areas, but could also simulate the historical land type spatiotemporally. Wang et al. [15] compared the CA-Markov model, FLUS model, and PLUS model using an ecological reserve in western Beijing as the study area. Zhang et al. [16] made land-use projections for 2050 in the Fujian Delta region, and showed that the accuracy of the coupled CA-Markov-based PLUS model was higher than the accuracy achieved without the single PLUS model. All of the above studies show that the PLUS model has better generalizability and accuracy, but it still has relatively few applications.
In summary, most recent studies analyzed the habitat quality of ecological reserves and were less focused on the habitat quality of cities, ignoring the great significance of research predicting the future habitat quality of cities for the sustainable development of the whole city. In addition, in terms of research methods, although some scholars have coupled prediction models with INVEST models for habitat quality prediction [17], few scholars have coupled PLUS models with InVEST models. More importantly, most of the existing studies only predicted habitat quality under one natural development scenario, and a single scenario cannot reveal the changes brought about by policy planning, and scenario prediction after changes resulting from human disturbance has not been studied sufficiently enough to provide a basis for future planning. There are few studies on multi-scenario habitat quality prediction based on the PLUS model coupled with the InVEST model, and this paper aims to fill this gap. The model not only combines land use and habitat quality issues, but also provides guidance and recommendations for ecological improvements from a land planning perspective with a higher degree of accuracy than other predictive models; in addition, it has a wider range of applications for habitat quality calculations.
Tianjin was ranked among the top 100 cities in the world in the 2020 World City Rankings published by the world’s leading rating agency, the Globalization and World Cities Research Group. Tianjin is the largest open coastal city in northern China and is located near the Bohai Sea, and it is one of the key national strategic cities for the coordinated development of the Beijing–Tianjin–Hebei region. Its flat topography and suitable water resources mean that the ability to expand the city’s construction land is limited, to a negligible extent, and its sustainable development will be jeopardized if the large encroachment of construction land on arable land, water bodies, and other land types is indulged. Therefore, it is very important for the government to limit urban expansion and to protect the ecology of the area. Its proximity to the capital is highly valued, and despite strong state support for the establishment of pollution prevention and control linkage, as well as a collaboration mechanism with Beijing, Hebei Province, and the surrounding areas, there are still obvious ecological problems. Habitats are fragile; land reclamation has led to a large reduction in sea area; and rapid urbanization and the continuous expansion of construction land has led to significant land-use changes and a declining trend in habitat quality. Therefore, this paper simulated three natural development scenarios, highlighting economic construction and ecological protection in the future (2030), and calculated their habitat quality based on three periods of land use change data from 2000, 2010, and 2020. The aim of this paper was to investigate the spatial and temporal response mechanisms of habitat quality to the expansion of urban land in Tianjin, by comparing the policy disturbance results with the natural development results to find the optimal future planning scenario. It will provide a reference for national spatial planning and sustainable urban development in Tianjin as well as examples for other similar cities with larger plains to seek effective solutions for the coordinated development of ecology and construction under the general trend of urban land sprawl for construction.

2. Materials and Methods

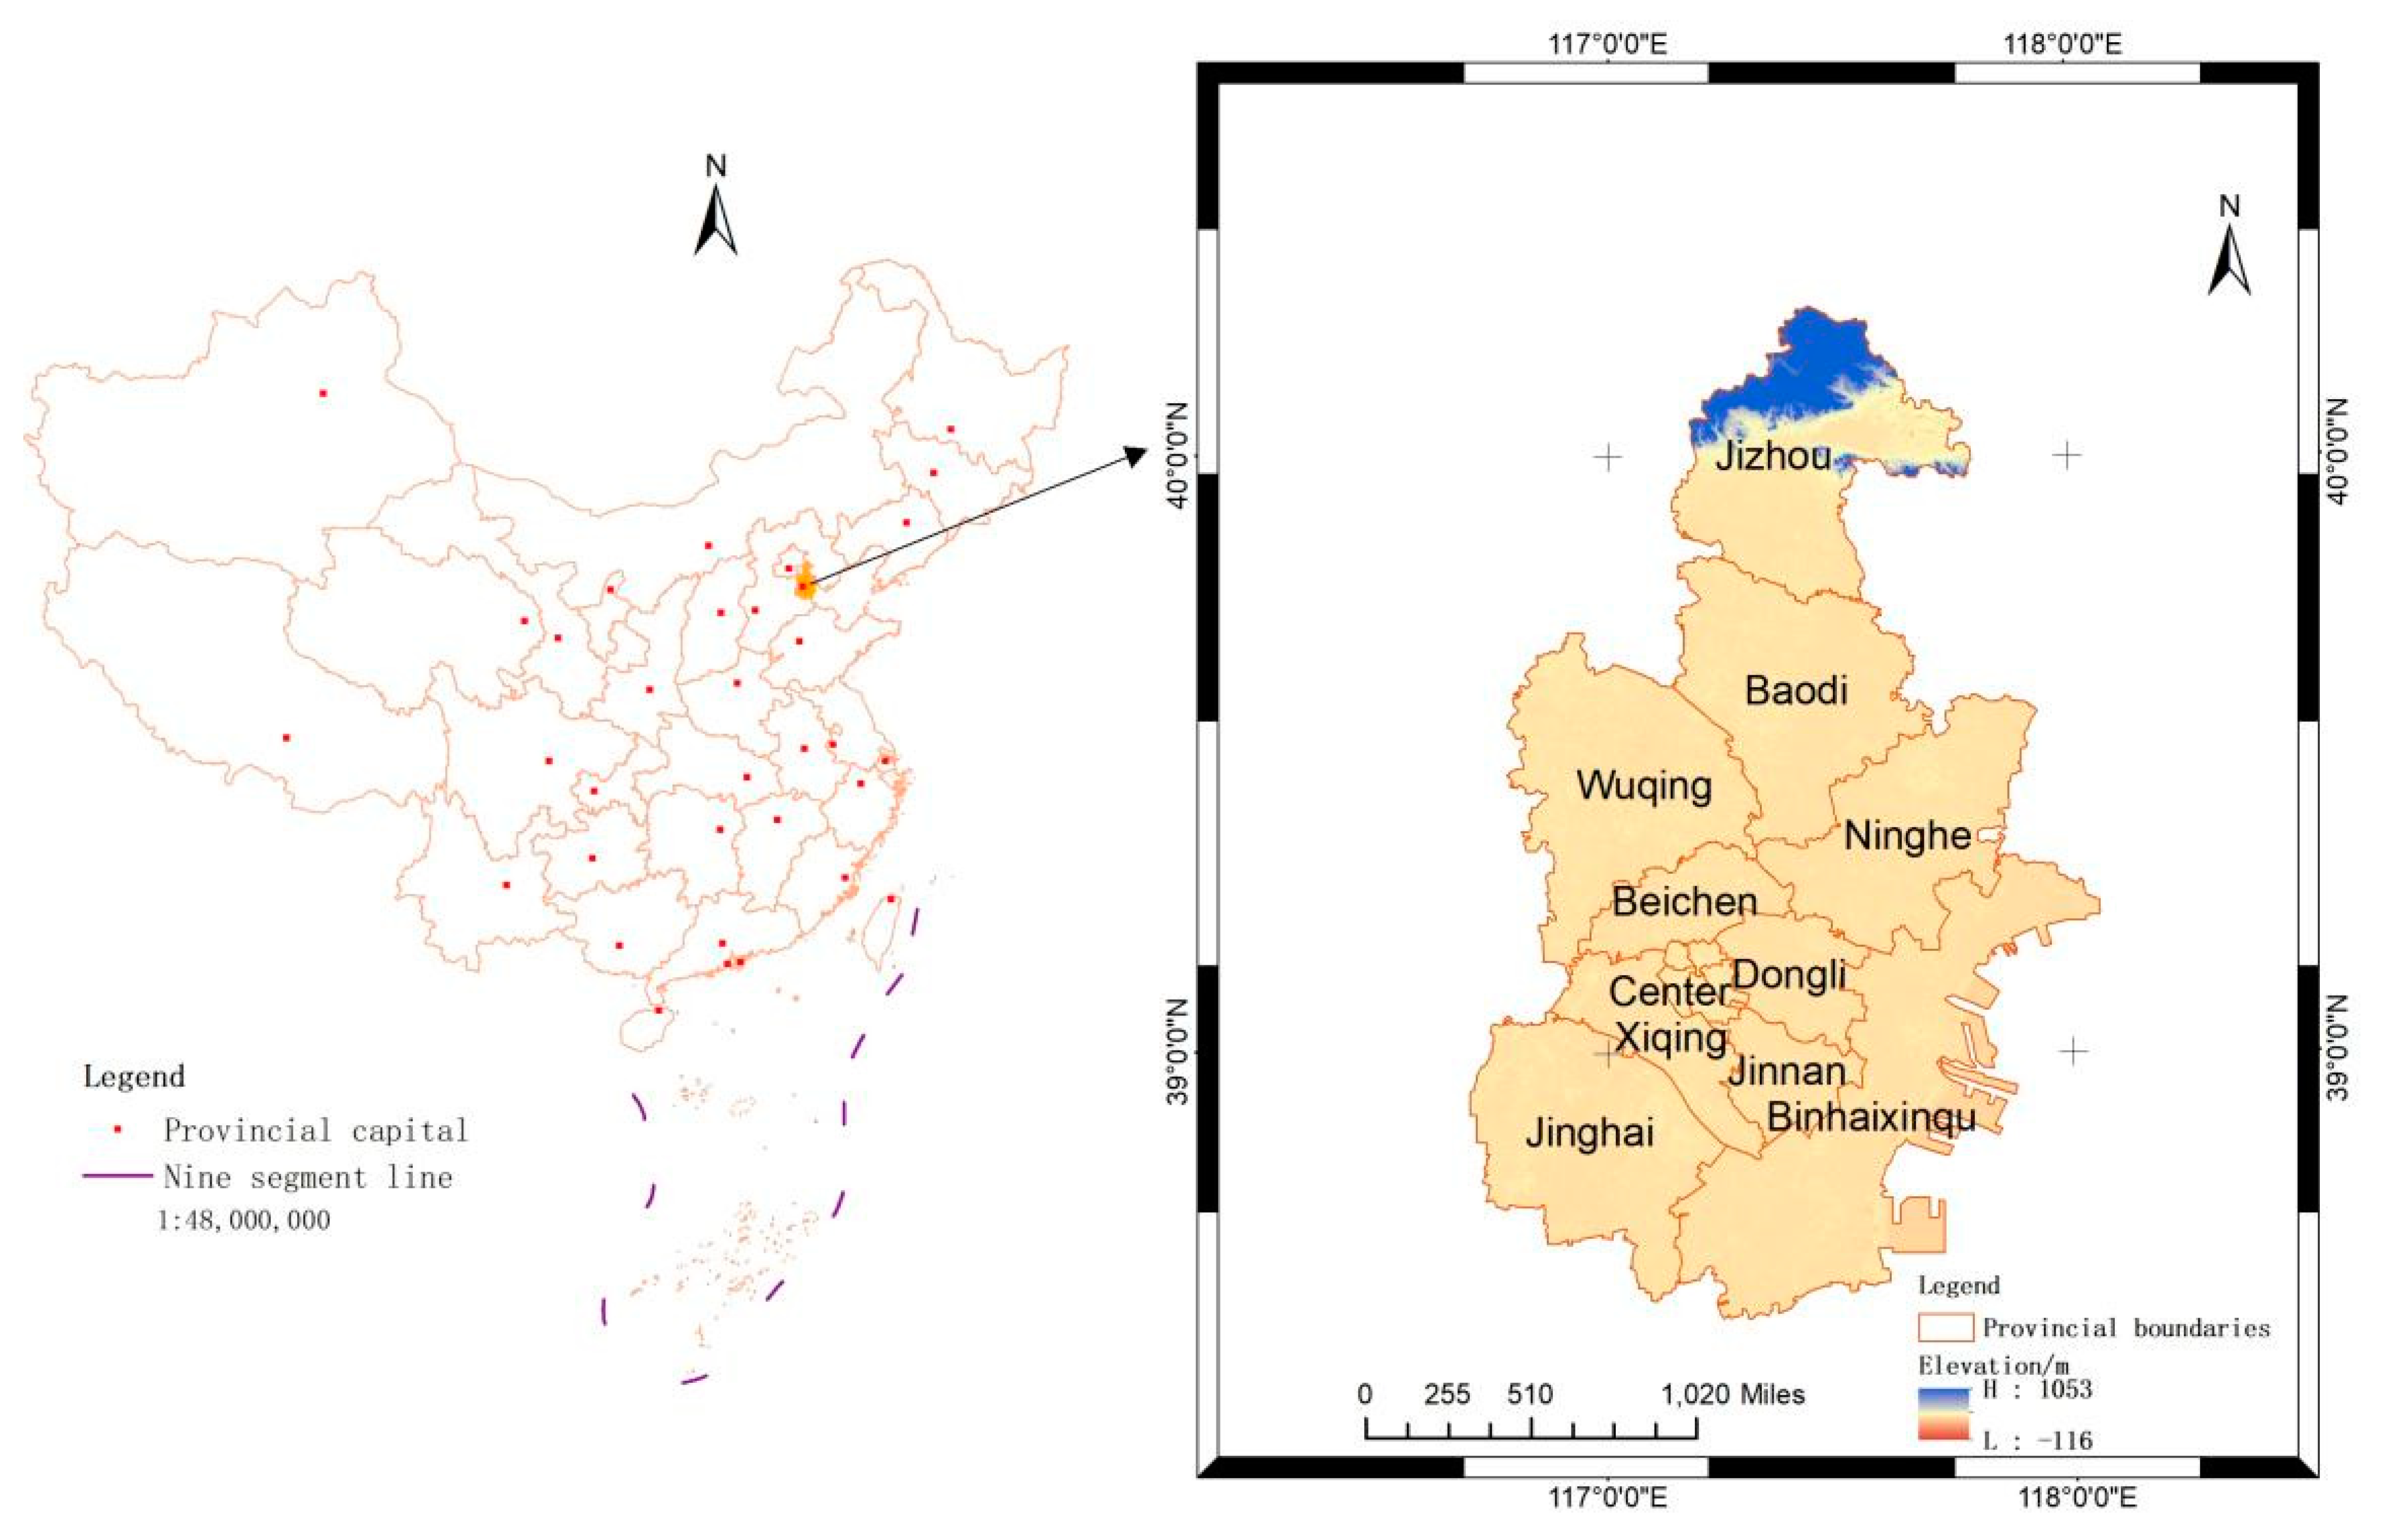
2.1. Description of the Study Area

Tianjin is located in the northeastern part of the North China Plain at latitude 38°34′–40°15′ N and longitude 116°43′–118°04′ E (Figure 1). It is a provincial administrative region, a municipality directly under the Central Government of the People’s Republic of China, a national central city, the largest port city in northern China, an international comprehensive transportation hub, and one of the important engines driving the northern economy. The topography is high in the north and low in the south, which is mainly in the plains. It belongs to the temperate semi-humid continental monsoon climate, and has an average annual precipitation rate of 550–600 mm and an average temperature of 13.4 °C. As of 2021, there were 16 districts under the jurisdiction of Tianjin, and this paper positions Hongqiao District, Nankai District, Henan District, Hebei District, and Hexi District as the central district, with an annual resident population of 13.866 million and the urbanization rate of this district increasing from 75.73% in 2005 to 84.7% in 2020.

2.2. Data Sources

The land use data in this paper were obtained from the National Basic Geographic Information Center (http://www.ngcc.cn/ accessed on 1 March 2022) global land cover data, with a resolution of 30 m × 30 m and includes TM5, ETM+, and OLI multispectral images from the US Land Resources Satellite (Landsat) and multispectral images from the Chinese Environmental Disaster Reduction Satellite (HJ-1), which were obtained using 16 m resolution Gaofen-1 (GF-1) multispectral imagery. The overall accuracy is 85.72%, with a kappa coefficient of 0.82. Taking into account policies such as reclamation [18] and the construction of wetland parks in the study area, its use types are divided into eight categories. In 2020, Farmland (60.64%), Woodland (1.18%), Grassland (2.16%), Water (8.78%), Wetland (3.57%), Construction land (22.43%), Unutilized land (0.03%), and Sea area (0.60%). This detailed classification will provide a more detailed reference for future urban planning

2.3. Research Methods

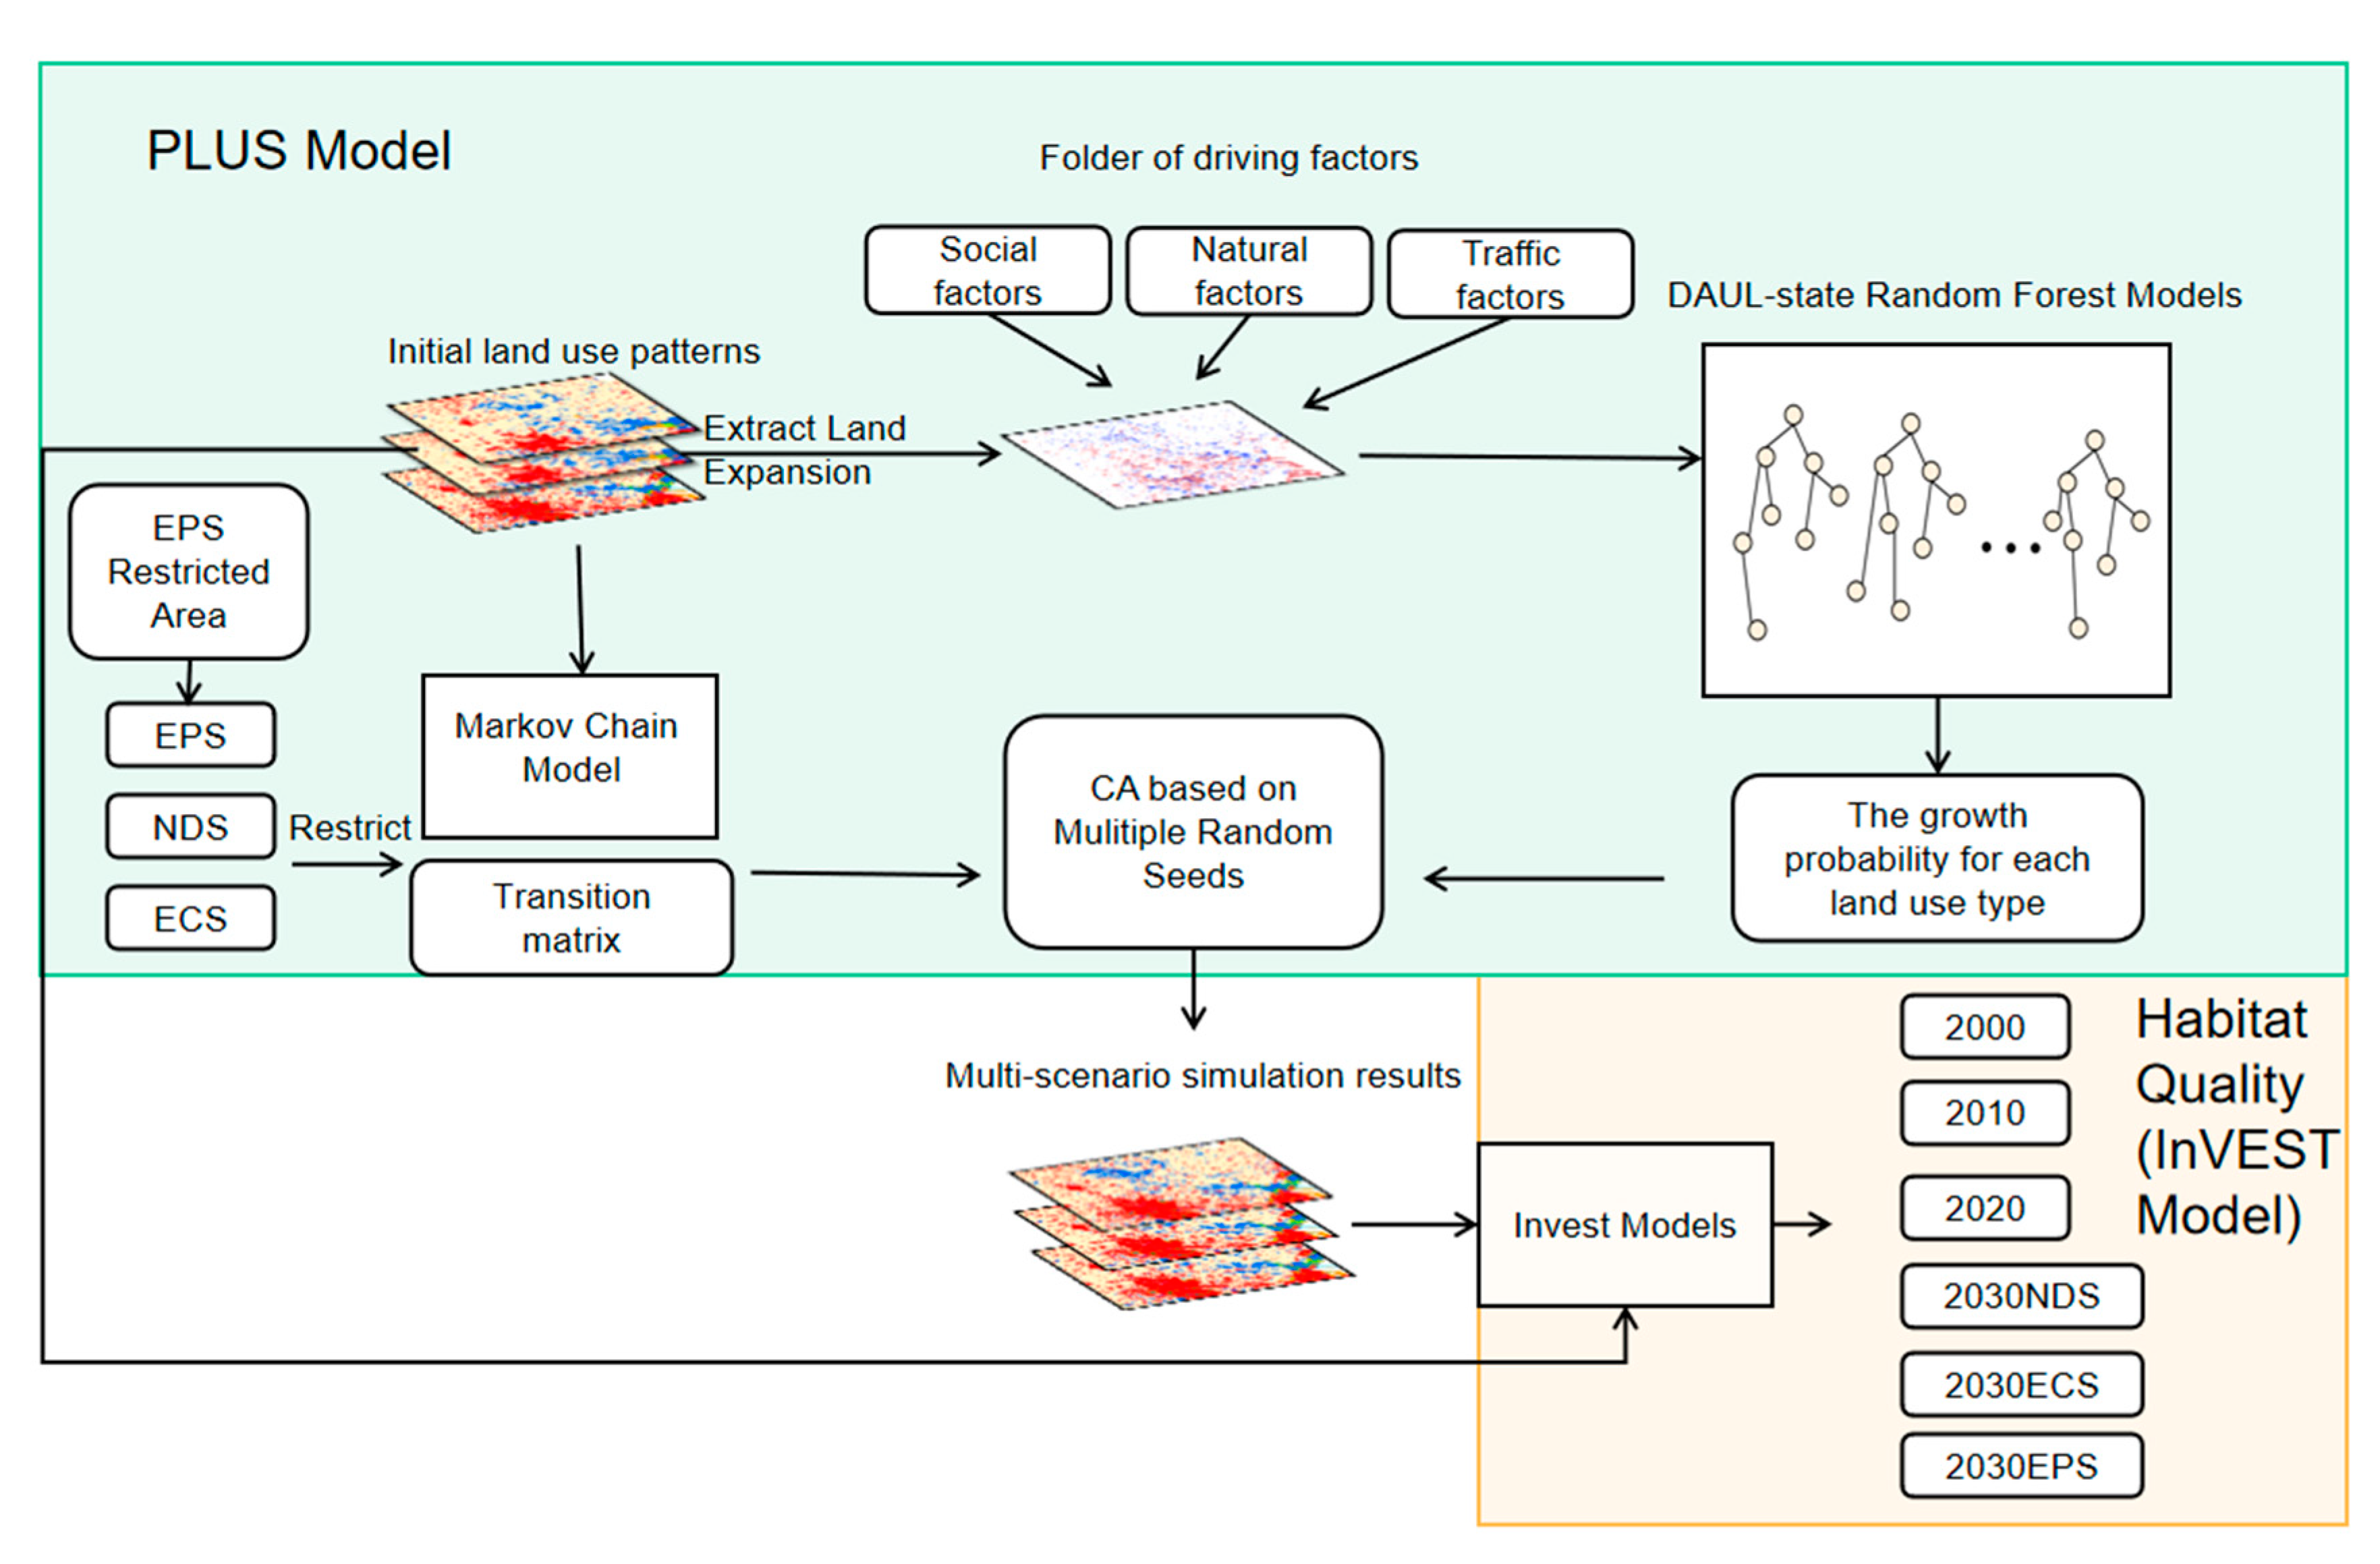
2.3.1. The Research Framework

Based on the land data for Tianjin from 2000 to 2020, the Markov-coupled PLUS model was used to predict the spatial distribution of the land in 2030 for three scenarios, and the INVEST model was used to assess the habitat quality from 2000 to 2030 (Figure 2).

2.3.2. Land-Use Dynamic Attitudes

The land-use dynamics indicator can reflect the rate of conversion of land-use type area to other use types [19] via the following expressions:
K = A t 1 A t 2 A t 1 ( t 2 t 1 ) × 100 %
where K is the dynamic attitude of the land-use in the study period; At1 is the number of land-use types at the beginning of the study; At2 is the number of land-use types at the end of the study; and t1, t2 are the beginning and the end of the study.

2.3.3. Land-Use Transfer Matrix

The land use transfer matrix corresponds to different land types in different years according to the changes in the land type, area, and location. Additionally, the matrix is:
S i j = { S 11 S 12 S 13 S 1 n S 21 S 22 S 23 S 2 n S 31 S 32 S 33 S 3 n S n 1 S n 2 S n 3 S n n }
where S is the land-use type area; n is the number of land-use types before and after transfer; and i,j = 1…n represent the land-use types before and after transfer.

2.3.4. PLUS Model

The Markov model, which is widely used in land transfer studies, is a statistical approach for future probability prediction. The model assumes that the probability of something happening is only related to the previous moment state and is independent of other factors. It is formulated as follows:
S ( t + 1 ) = P i j × S t
where S(t) and S(t+1) are the land use states in the study area at moments t and t + 1, respectively, and Pij is the land use transfer probability matrix (i,j = 1,2,…,n).
In this study, land types and their drivers were fitted using random forest based on the PLUS model Markov predictions.
Similar to the FLUS model, the PLUS model also introduces adaptive inertia coefficients to make the land patches self-adjust toward the expected number during iteration, as well as introducing the same filter matrix to limit the transformation between specific land types, but improves the parameters set for the ensuing patch generation; the proposed threshold decline rule in the competition process limits the spontaneous growth of specific land use types [14,20], whose expressions are shown below;
P i , K ( x ) d = n = 1 M I ( h n ( x ) = d ) M
where P i , K ( x ) d is the integrated probability that the spatial unit is at the moment of transition to site type k; S is the domain weight of the ground class k at the spatial cell at moment t; and D is the adaptive drive coefficient.
Based on previous studies [21,22], combined with the characteristics of the study area such as rapid urbanization and a large construction land area, the driving factors selected for this study come from three aspects: natural factors, social factors, and traffic factors, as well as fourteen driving factors, such as elevation, precipitation, etc. The driving factors are shown in Table 1 below.
The neighborhood factor indicates the interaction between different land types in the neighboring range, and its value is set as the neighborhood factor parameter by combining the existing research with the actual situation of Tianjin, as shown in Table 2.
Adaptive inertia coefficient calculation.
D k t = D k t - 1 ( G k t 1 G k t 2 ) D k t 1 × G k t 2 G k t 1 ( 0 > G k t 2 > G k t 1 ) D k t 1 × G k t 1 G k t 1 ( G k t 1 > G k t 1 > 0 )
where D k t is the inertia coefficient for site type k at the moment and G k t 1 is the difference between site demand and actual quantity at moment t − 1.
T P i , k d = 1 , t { P i , k d = 1 × ( r × μ k ) × D k t ( Ω i , k t = 0 , r < P i , k d = 1 ) P i , k d = 1 × Ω i , k t × D k t }
where T P i , k d = 1 , t are the integrated probability of the transition to land use type k at moment t after the introduction of the random patch generation mechanism; r is a random value within (0,1); and uk is the new land use patch generation threshold.
The transition matrix and final site development probability calculation is as follows:
if k = 1 N | G c t 1 | k = 1 N | G c t | < s t e p ,   I = I + 1 { P i , c d = 1 > τ , T M k , c = 1 change P i , c d = 1 τ , T M k , c = 0 notchange τ = σ l × R 1
where step is the step size required to fit the PLUS model to the land use demand; l is the number of threshold decay steps; δ is the decay factor of the decay threshold t between 0 and 1; R1 is a normal distribution with a mean of 1; and TMk, c is the transition matrix that defines whether land type k can be shifted to c. A value of 1 indicates that the shift is allowed, while a value of 0 restricts the shift.

2.4. Accuracy Verification Analysis

The accuracy analysis of this study introduces kappa coefficients for testing, the expressions of which are as follows:
K a p p a = p 0 p c p p p c
where P0 is the number of simulated correct grids/total number; Pc is the number of random simulated correct grids/total number; Pp is the number of random simulated correct grids/total number. A kappa coefficient between 0.6 and 0.8 represents a good model effect.

2.4.1. Land Multiple Scenario Setting

For future land planning, based on previous studies considering multiple scenario settings as well as typicality and other factors, this study selected three typical scenarios [23,24]:
(1)
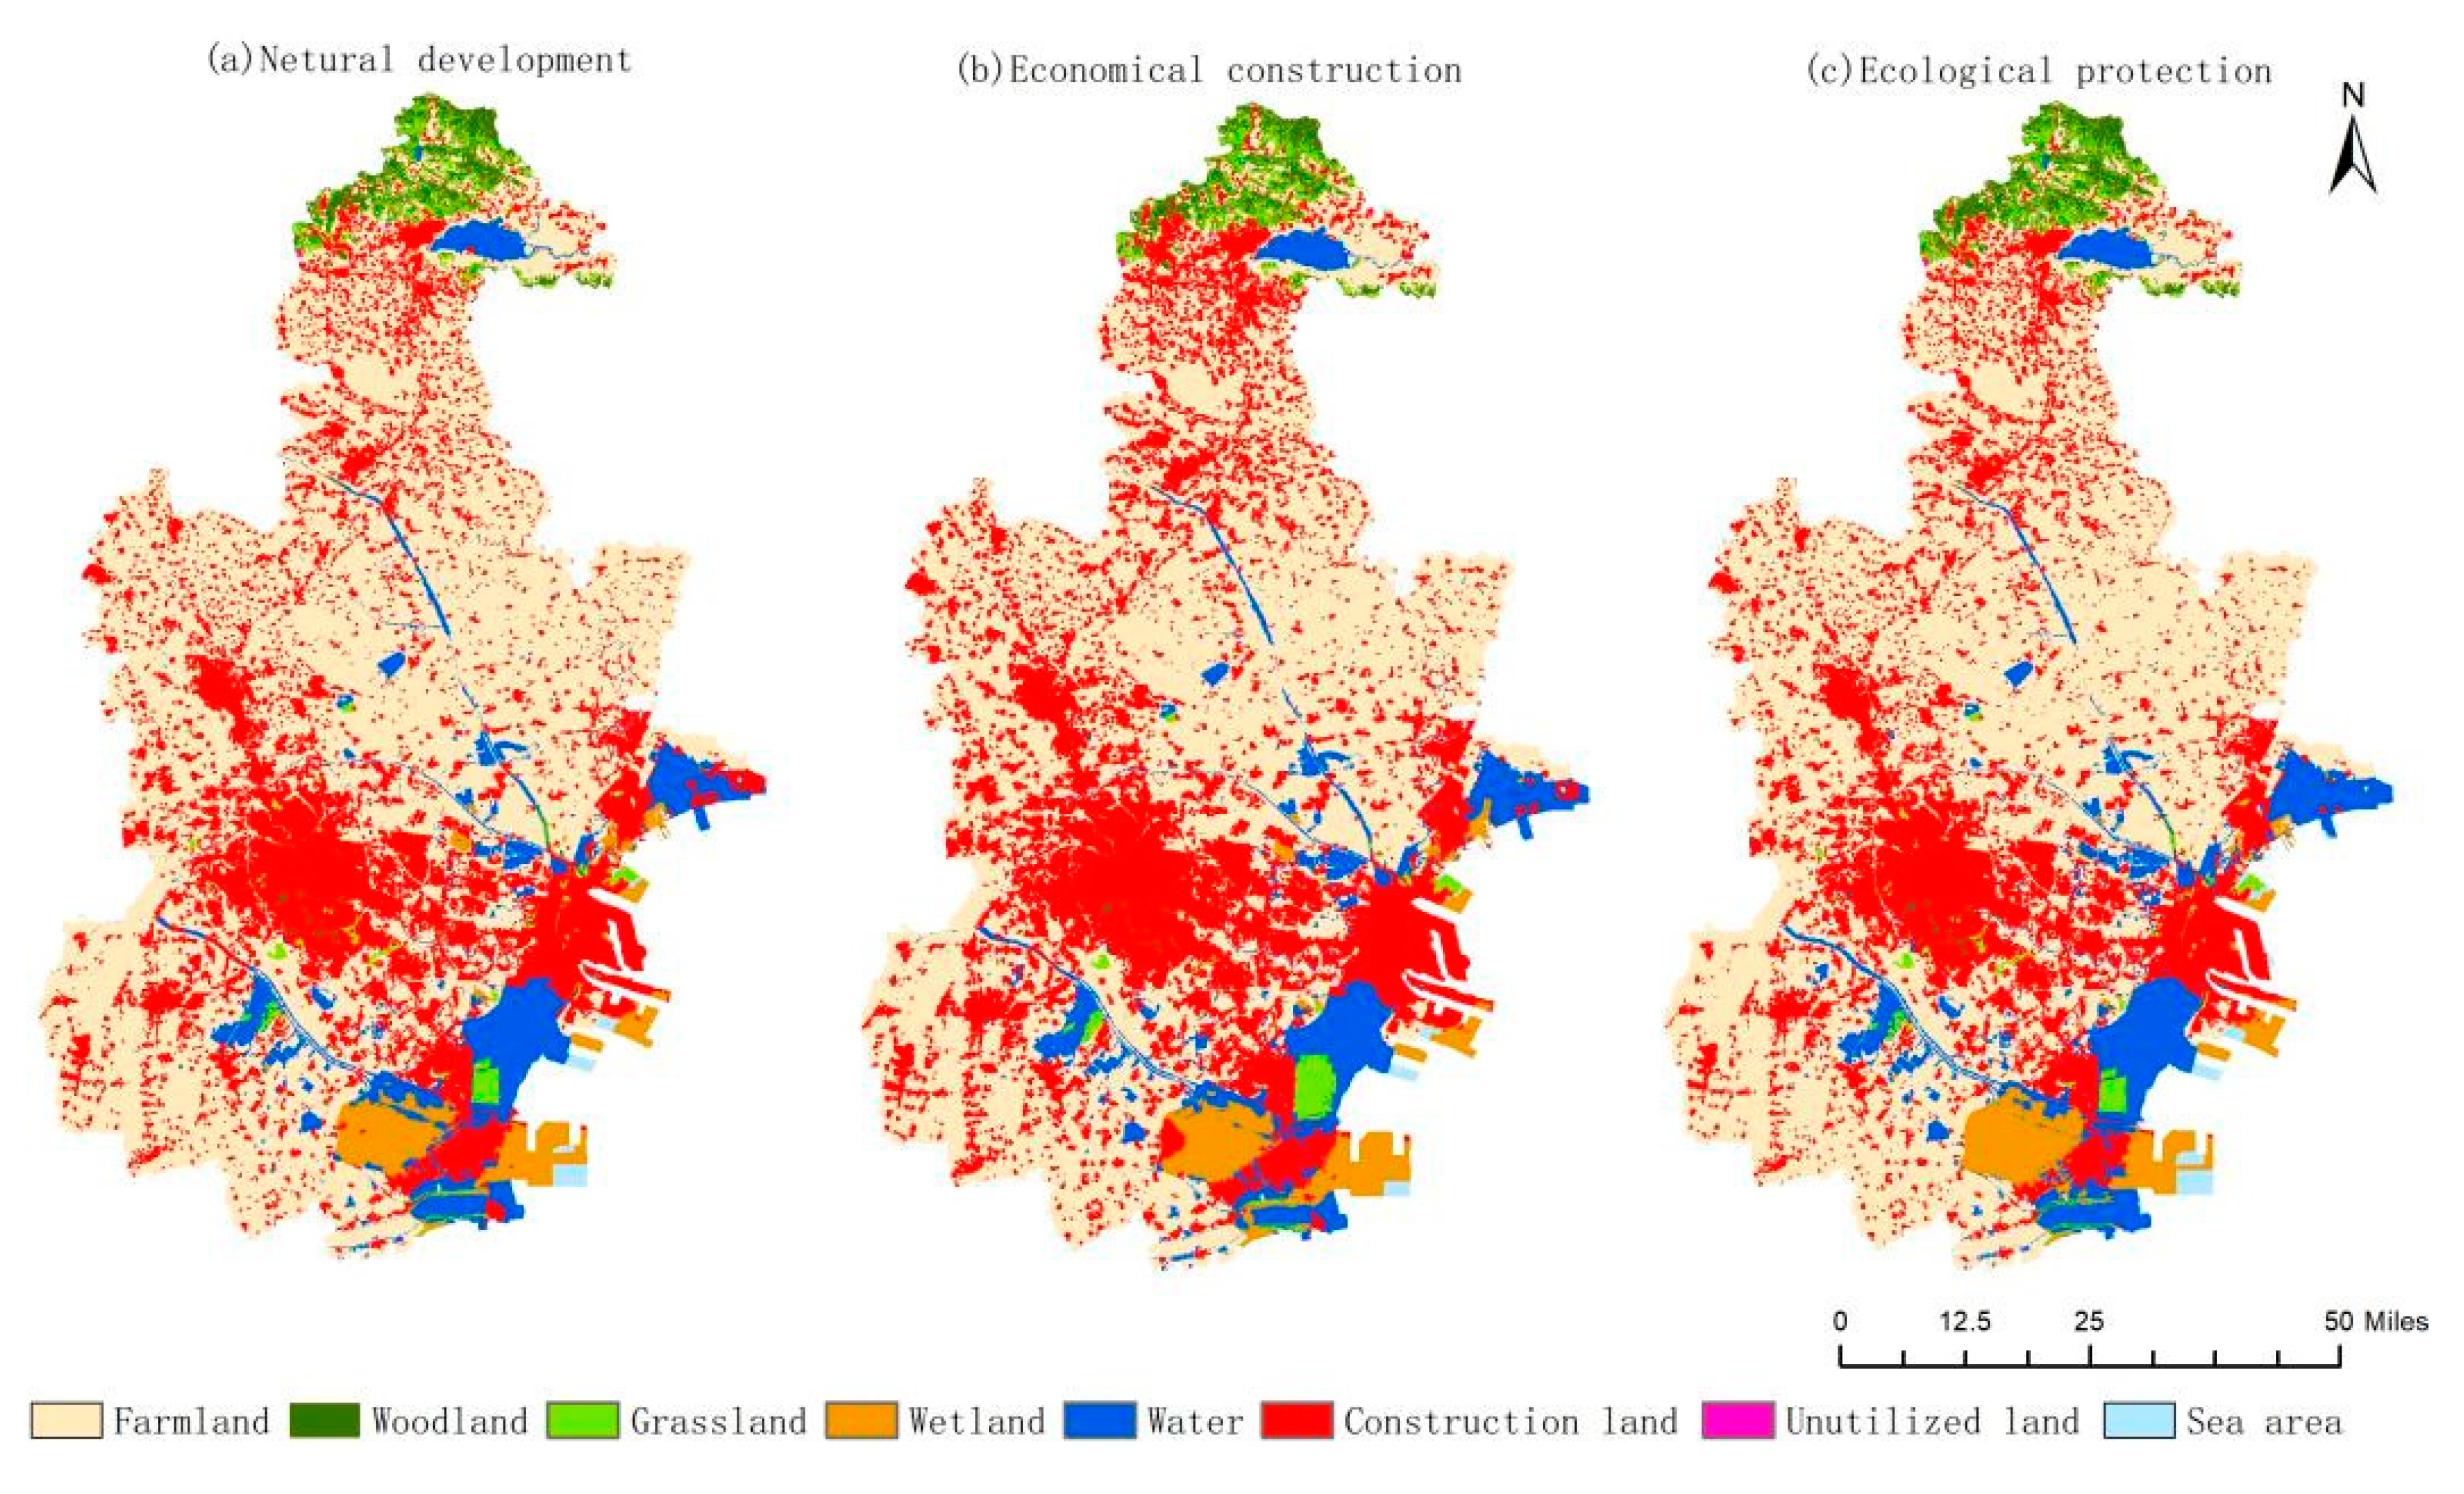
Natural development scenario: In this scenario, human factors, such as territorial spatial planning, are not considered as being able to interfere, and historical data are used for simulation. The probability distribution is the same as the transfer probability matrix for 2010–2020.
(2)
Economic construction scenario: According to statistics, the urbanization rate in Tianjin increased from 82.64% in 2015 to 84.7% in 2020, an increase of 2.06 percentage points during the 13th Five-Year Plan period. During the 14th Five-Year Plan period, the state has provided huge amounts of funding to support the urbanization of Tianjin, establishing pilot urbanization projects in the Dongli District and Jizhou District, which will be vigorously strengthened. The probability of transferring all land types to building land is set to increase by 50%, and the probability of transferring building land out of the transfer matrix is zero.
(3)
Ecological protection scenario: Tianjin has a large concentration of forest land and a large wetland area, which is a key object of national protection. In order to implement the “Opinions on Delineating and Strictly Adhering to the Ecological Protection Red Line” of the State Office, Tianjin has delineated an area of 1195 square kilometers of an ecological protection red line in land area in the city in addition to a marine ecological red line area and actively carries out artificial afforestation and artificial wetland restoration projects. Therefore, to set the probability of transferring all land types to forest land changed by 30% to account for the ecological red line within the rivers, wetlands, and some sea areas to limit the transfer out [25], and forest land is no longer transferred outward.

2.4.2. Habitat Quality Assessment Based on the Invest Model

In this study, the habitat quality was assessed by the InVEST model, which considers the maximum stress distance and weight of the threat factor. It can assess the degree of habitat degradation and habitat quality. The degree of habitat degradation represents the magnitude of the level of threat stressors encountered by the species, and the value of this index ranges from 0 to 1, with values closer to 1 indicating a greater degree and probability of degradation.
D x j = r = 1 y = 1 R y = 1 r y ( w r r = 1 R w r ) r y i r x y β x S i r
where Dxj is the degree of habitat degradation; R is the number of threat factors; r is the number of rasters of the threat layer on the base map; w is the threat factor weights; ry is the threat intensity; irxy is the effect of r on each raster of the habitat (linear or exponential); βx is the effect of local protection policies, etc., but it is not considered in this study for the time being; and Sjr indicates the relative sensitivity of each habitat to the sensitivity of each habitat to different threat sources.
The habitat quality value ranges from 0 to 1. The closer to 1, the better the habitat quality, and the closer to 0 it is, the worse it is, and the expression is:
Q x j = H j ( 1 D x j z D x j z z + k z )
where Qxj is the biblical quality index of raster x in the land use and type j; Hj is the habitat suitability of land type j; D x j z is the habitat degradation of raster x in land type j; z is the default parameter; and k is the half-saturation constant and is 0.2 in this paper.
This article refers to a previous study and the InVEST User Manual [26,27,28]. Cultivated land, construction land, unused land, highways, and railroads are used as threat factors, and the impact distance and weight of different threat factors as well as the sensitivity are set as shown in Table 3 and Table 4 below.

3. Results and Analysis

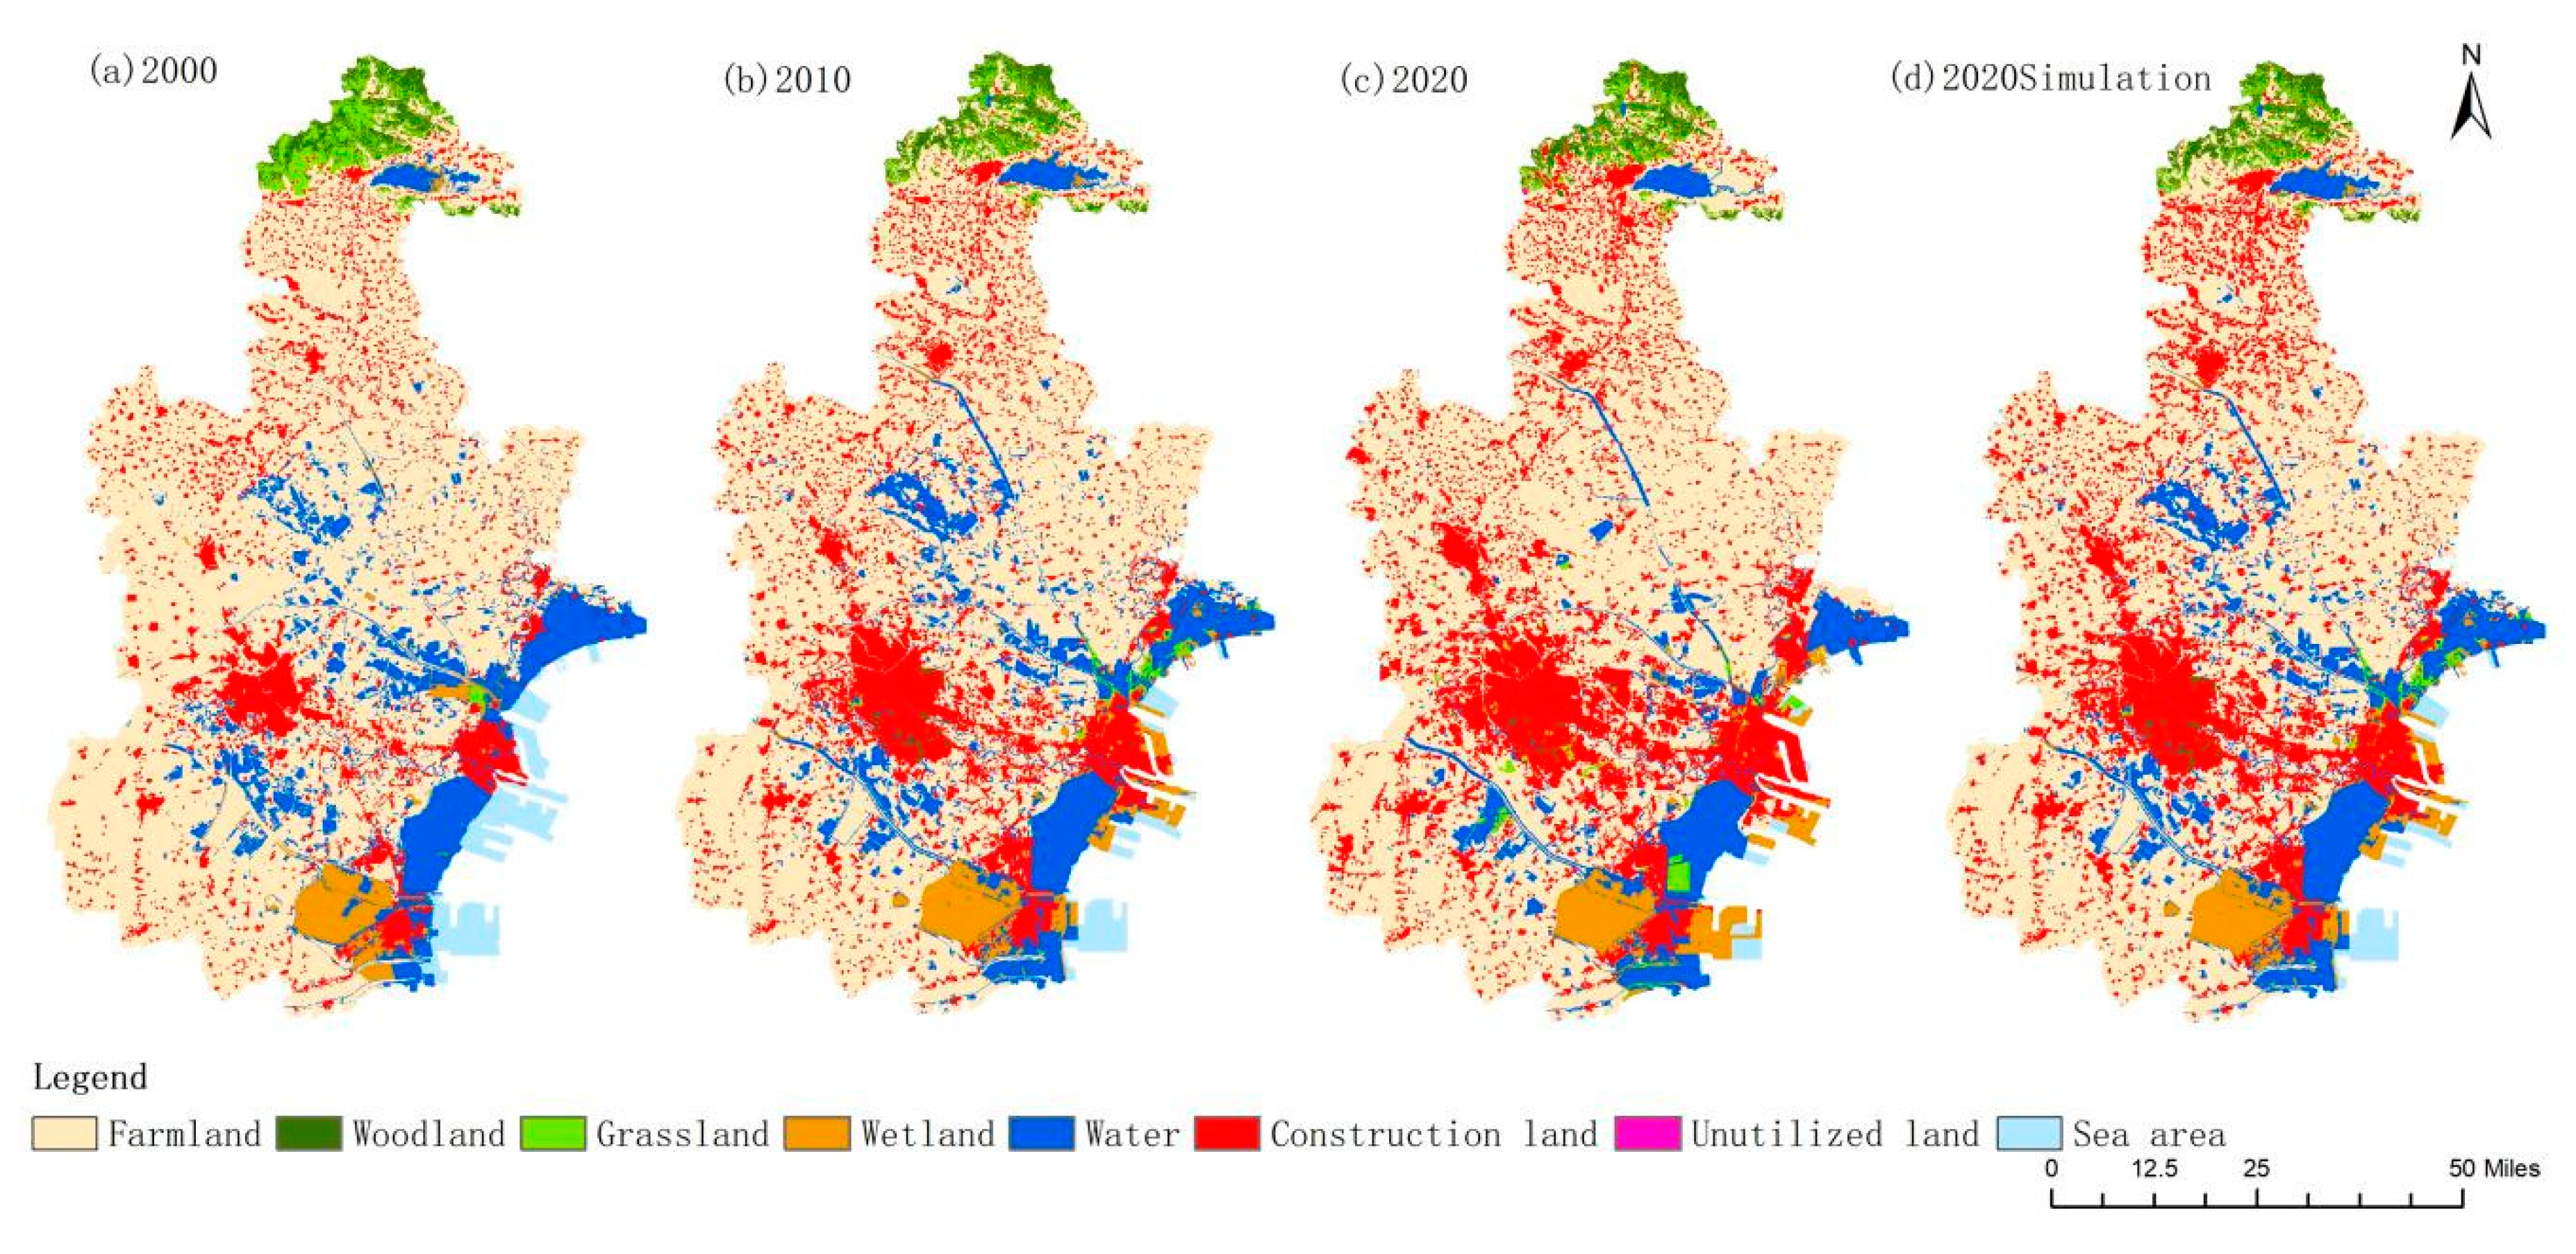
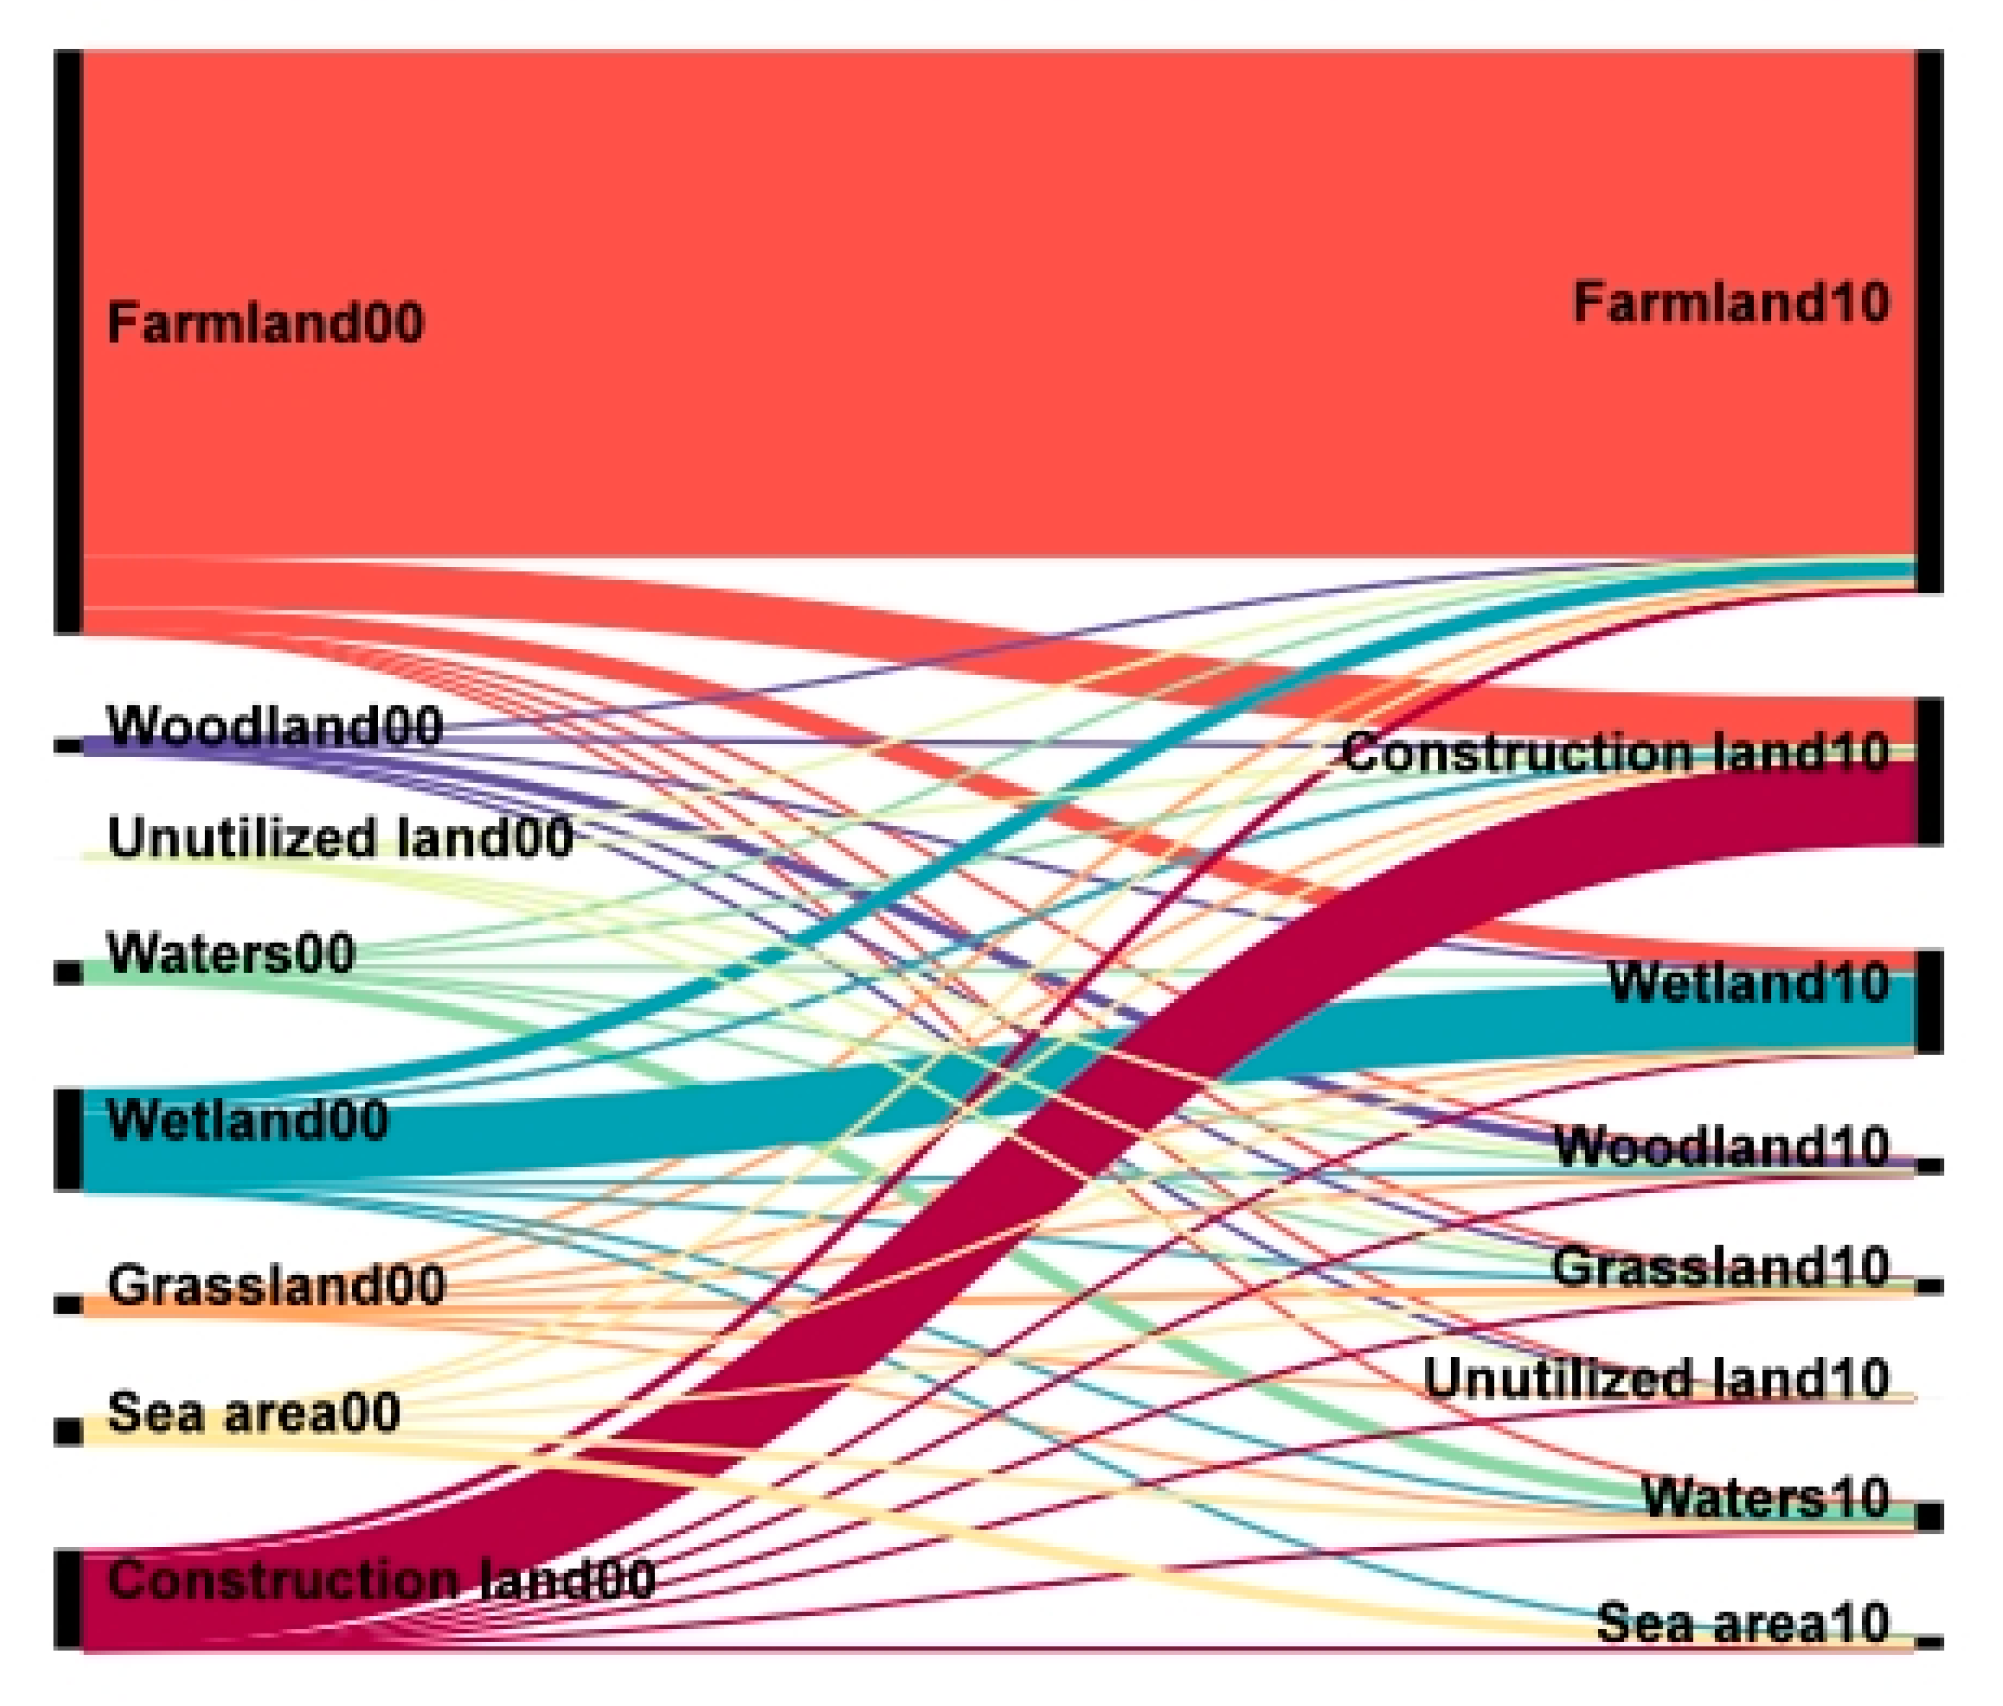
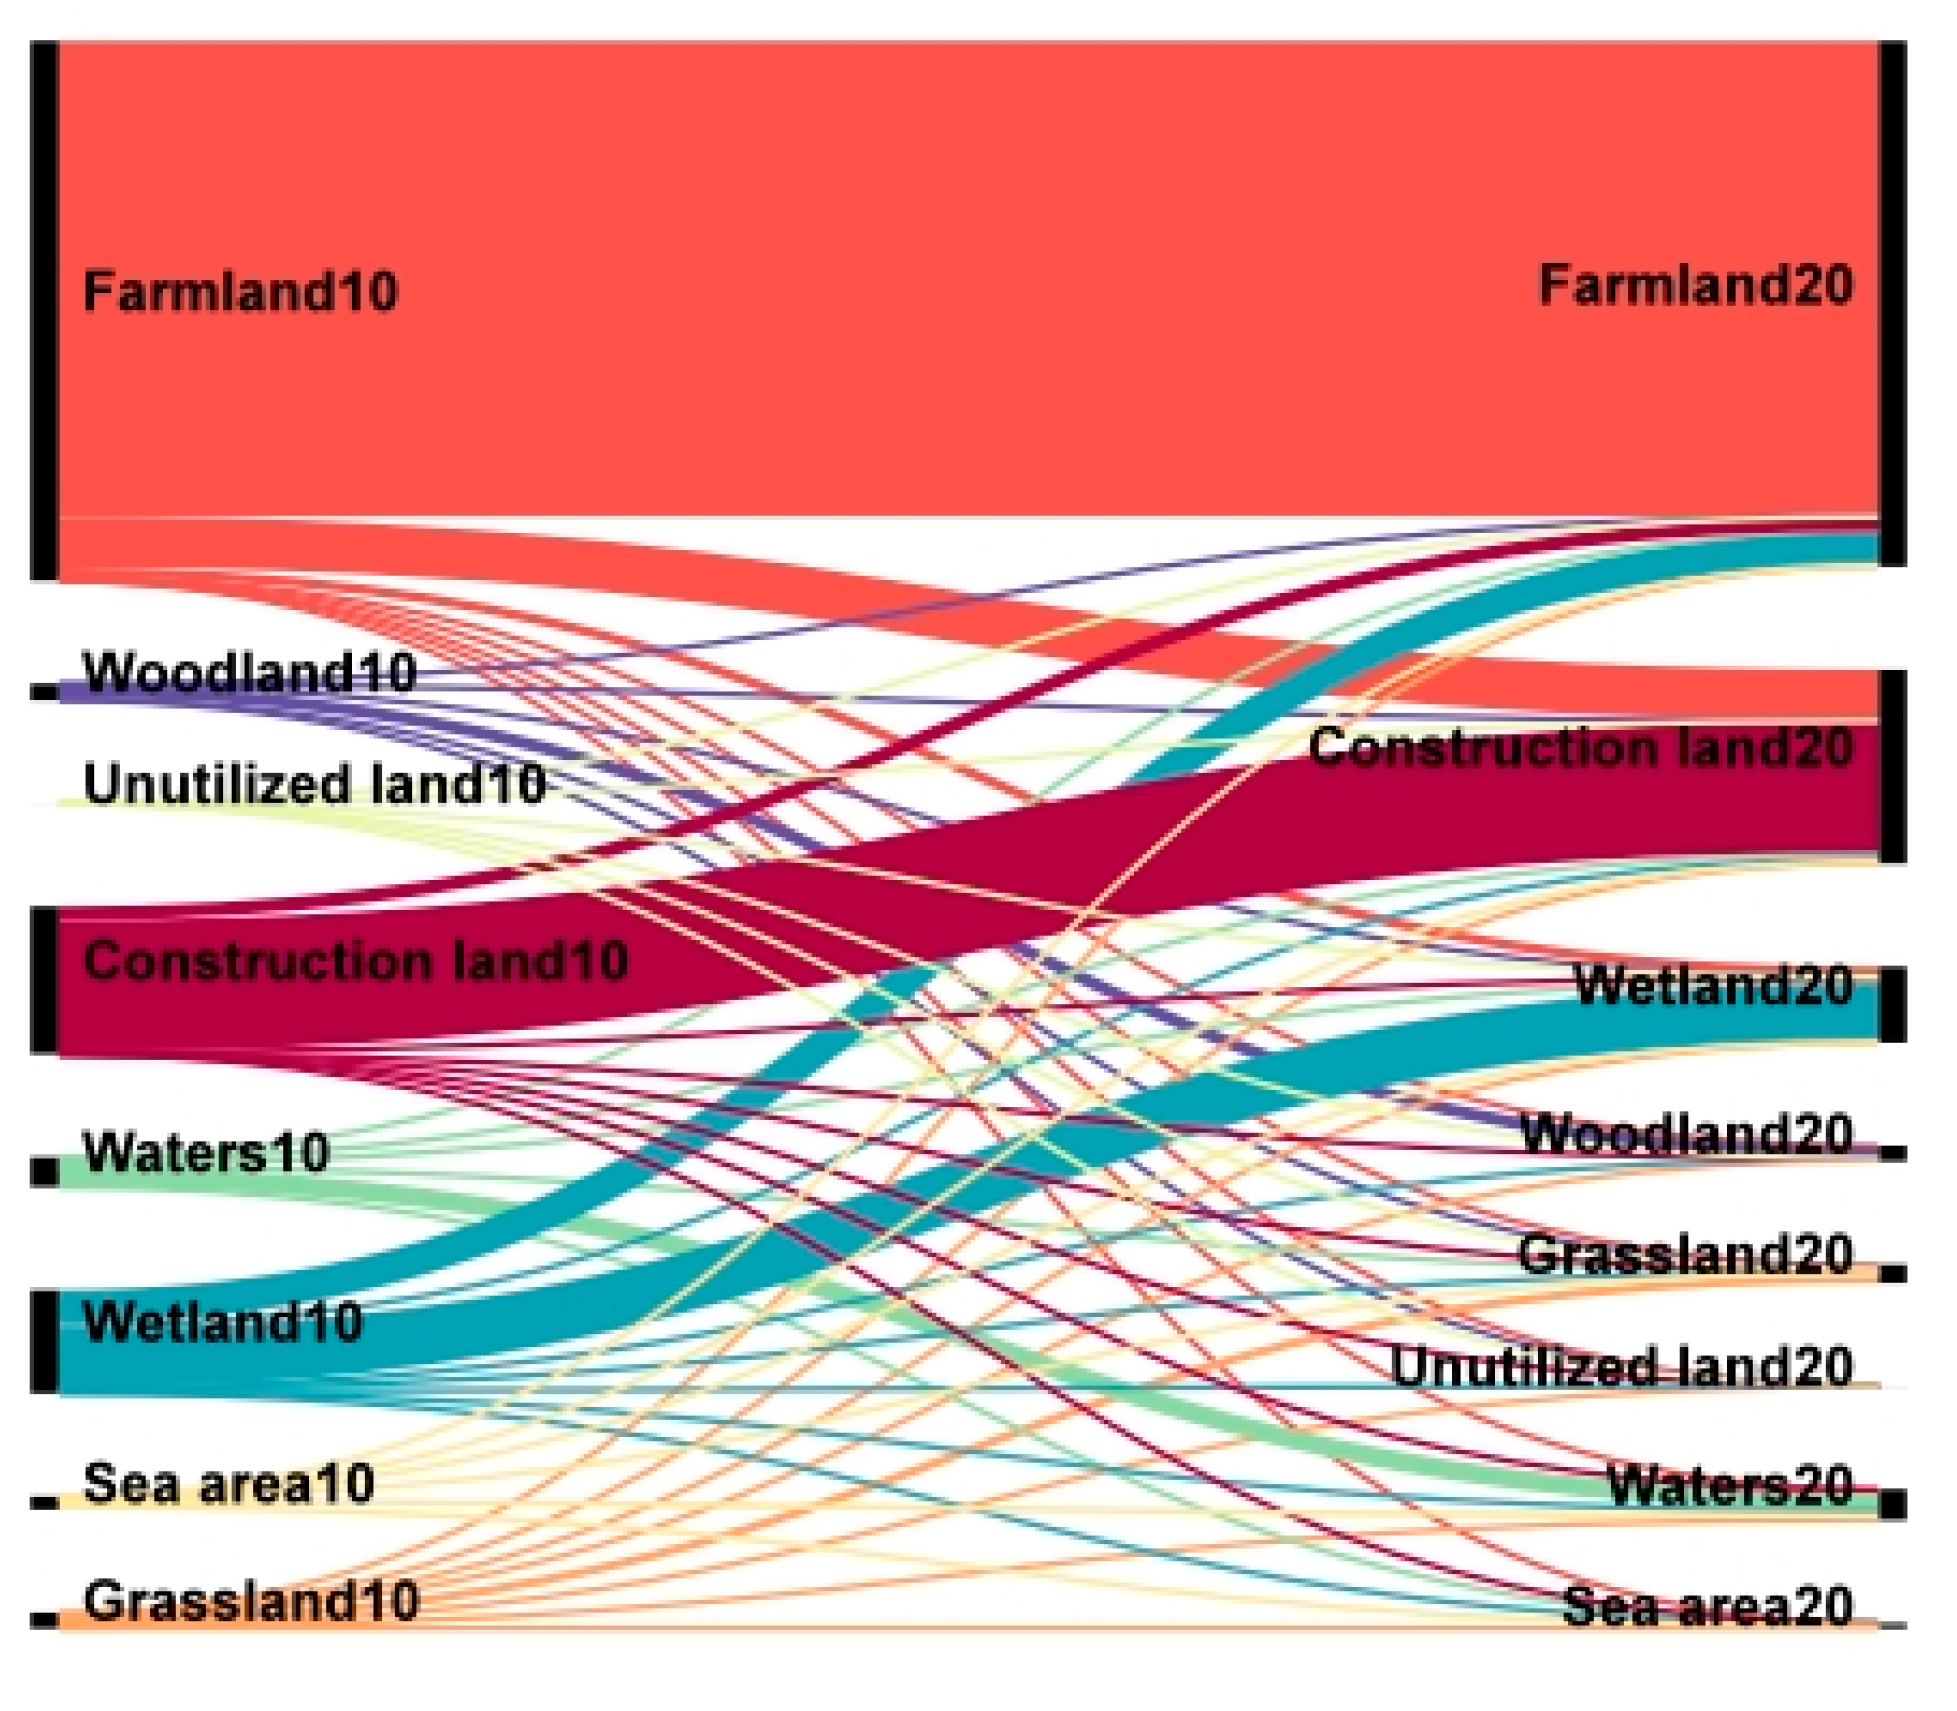
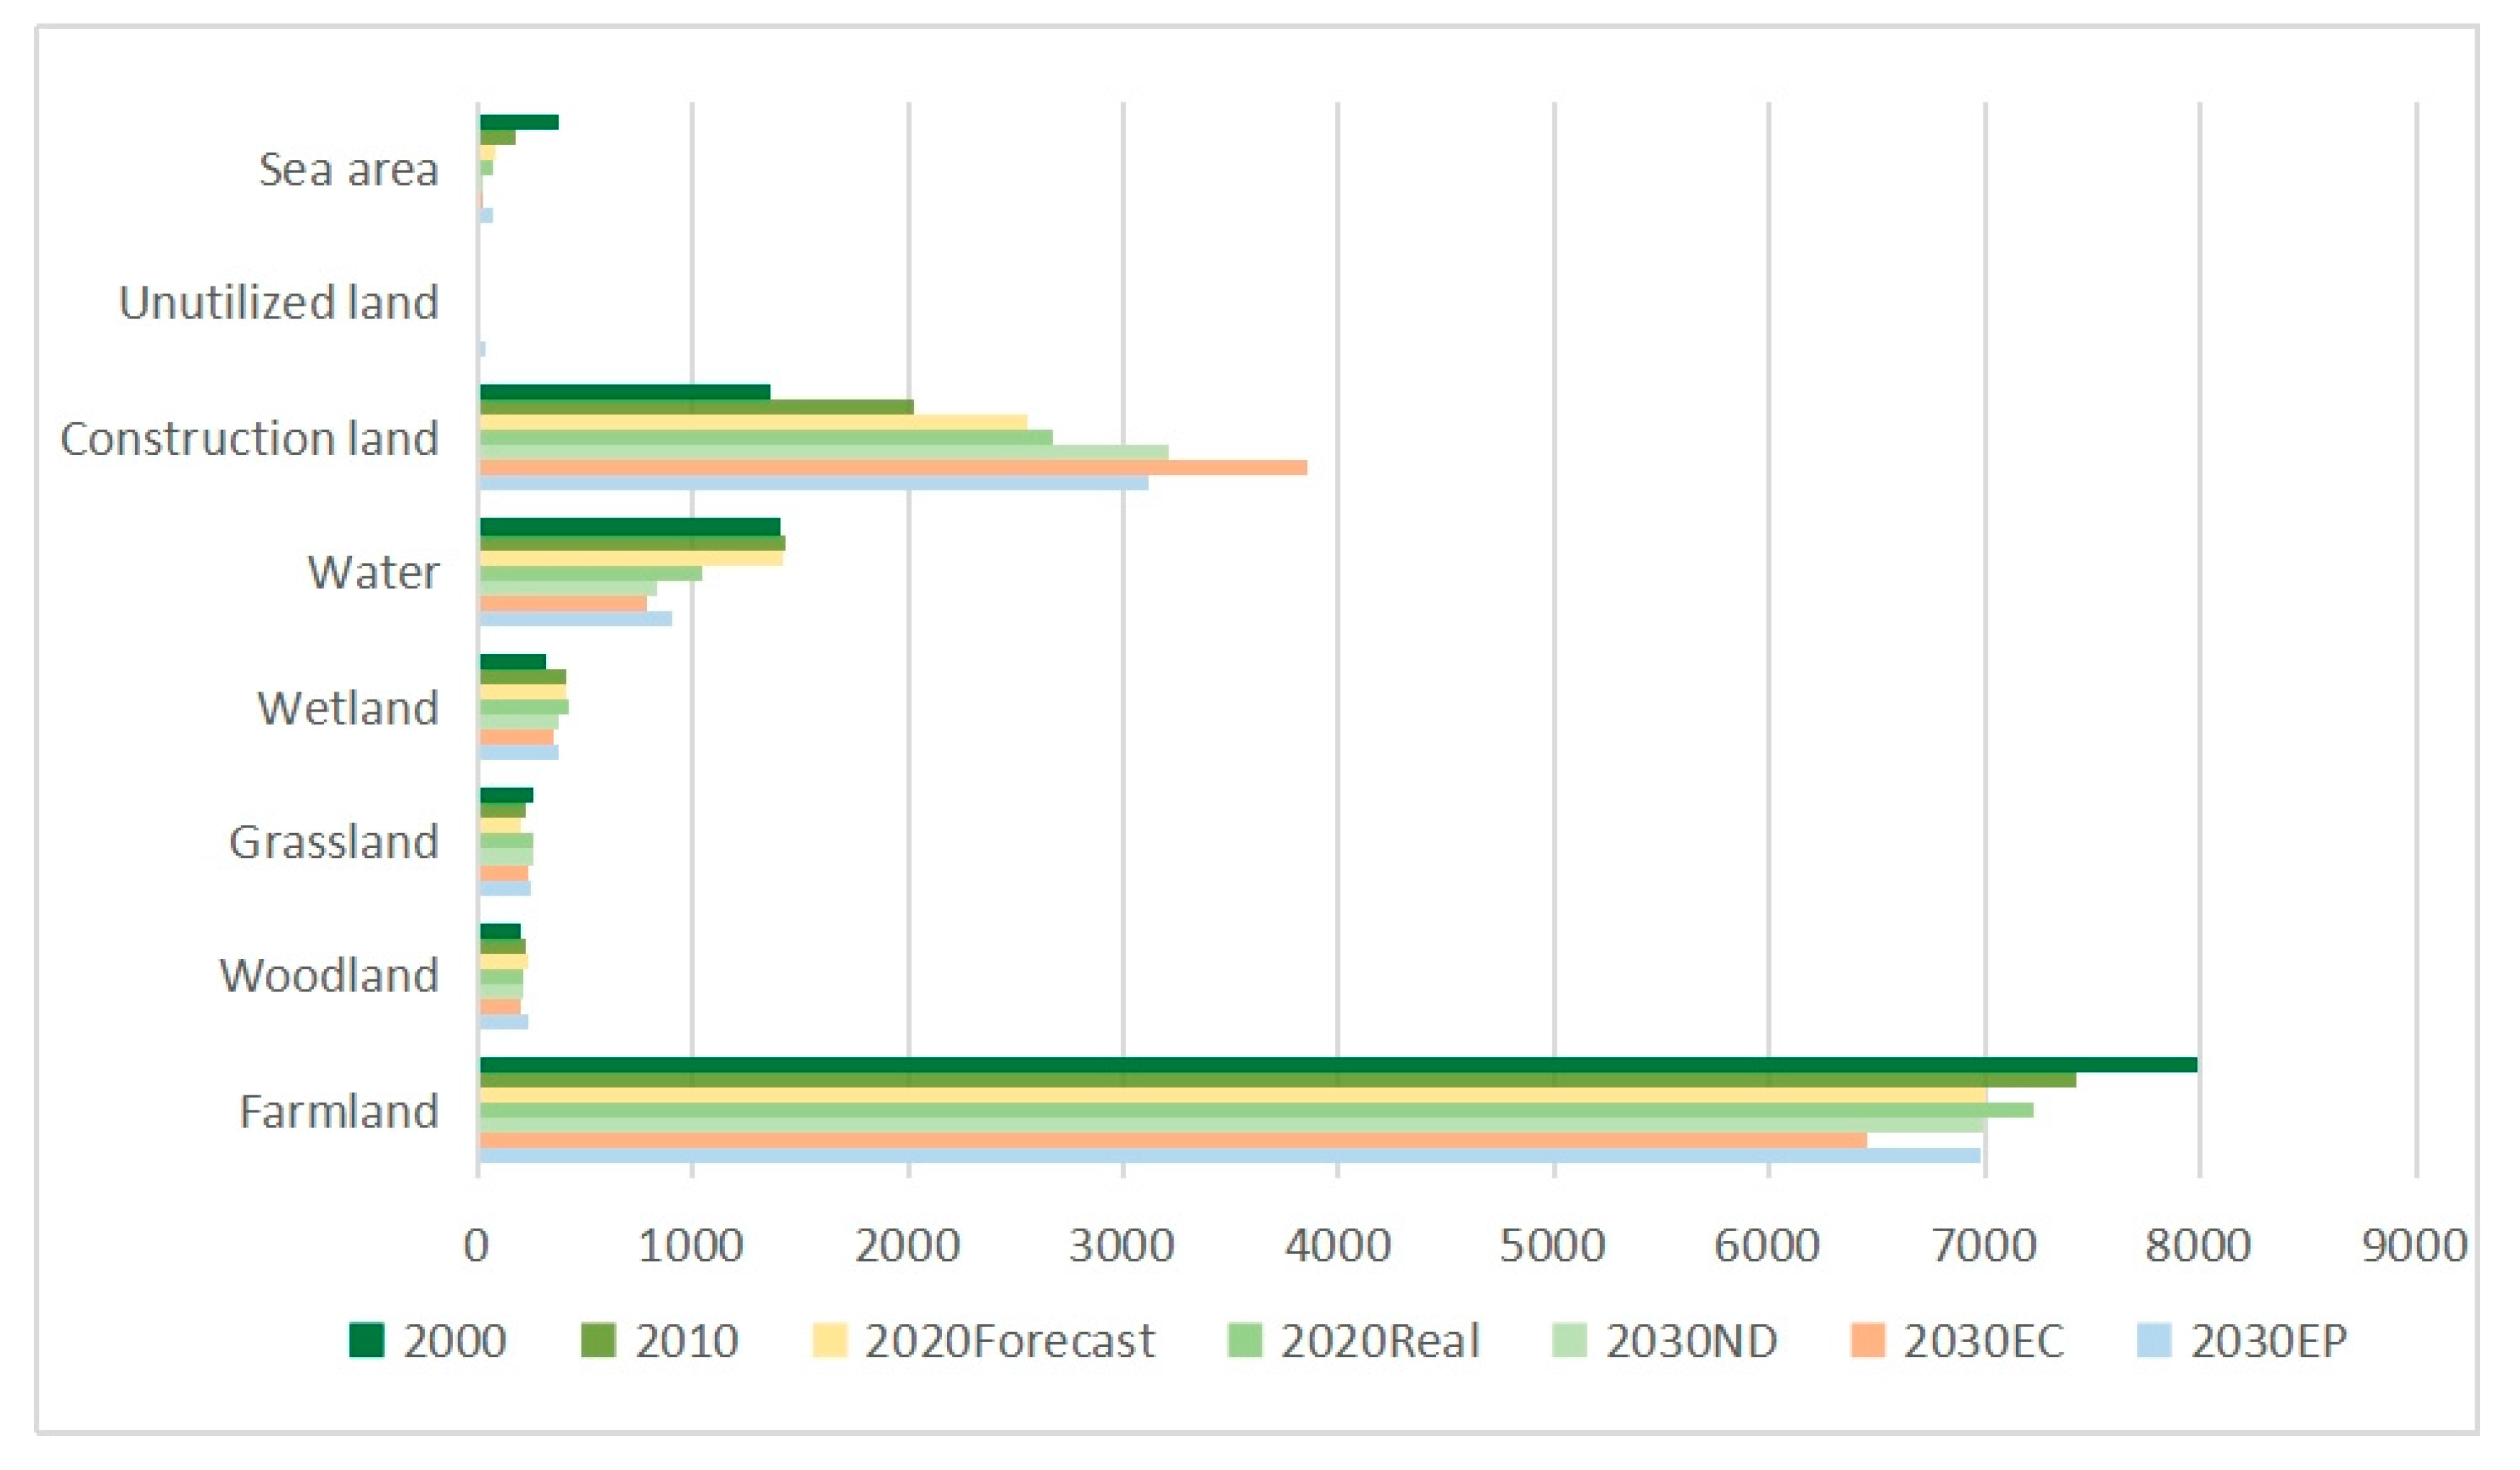
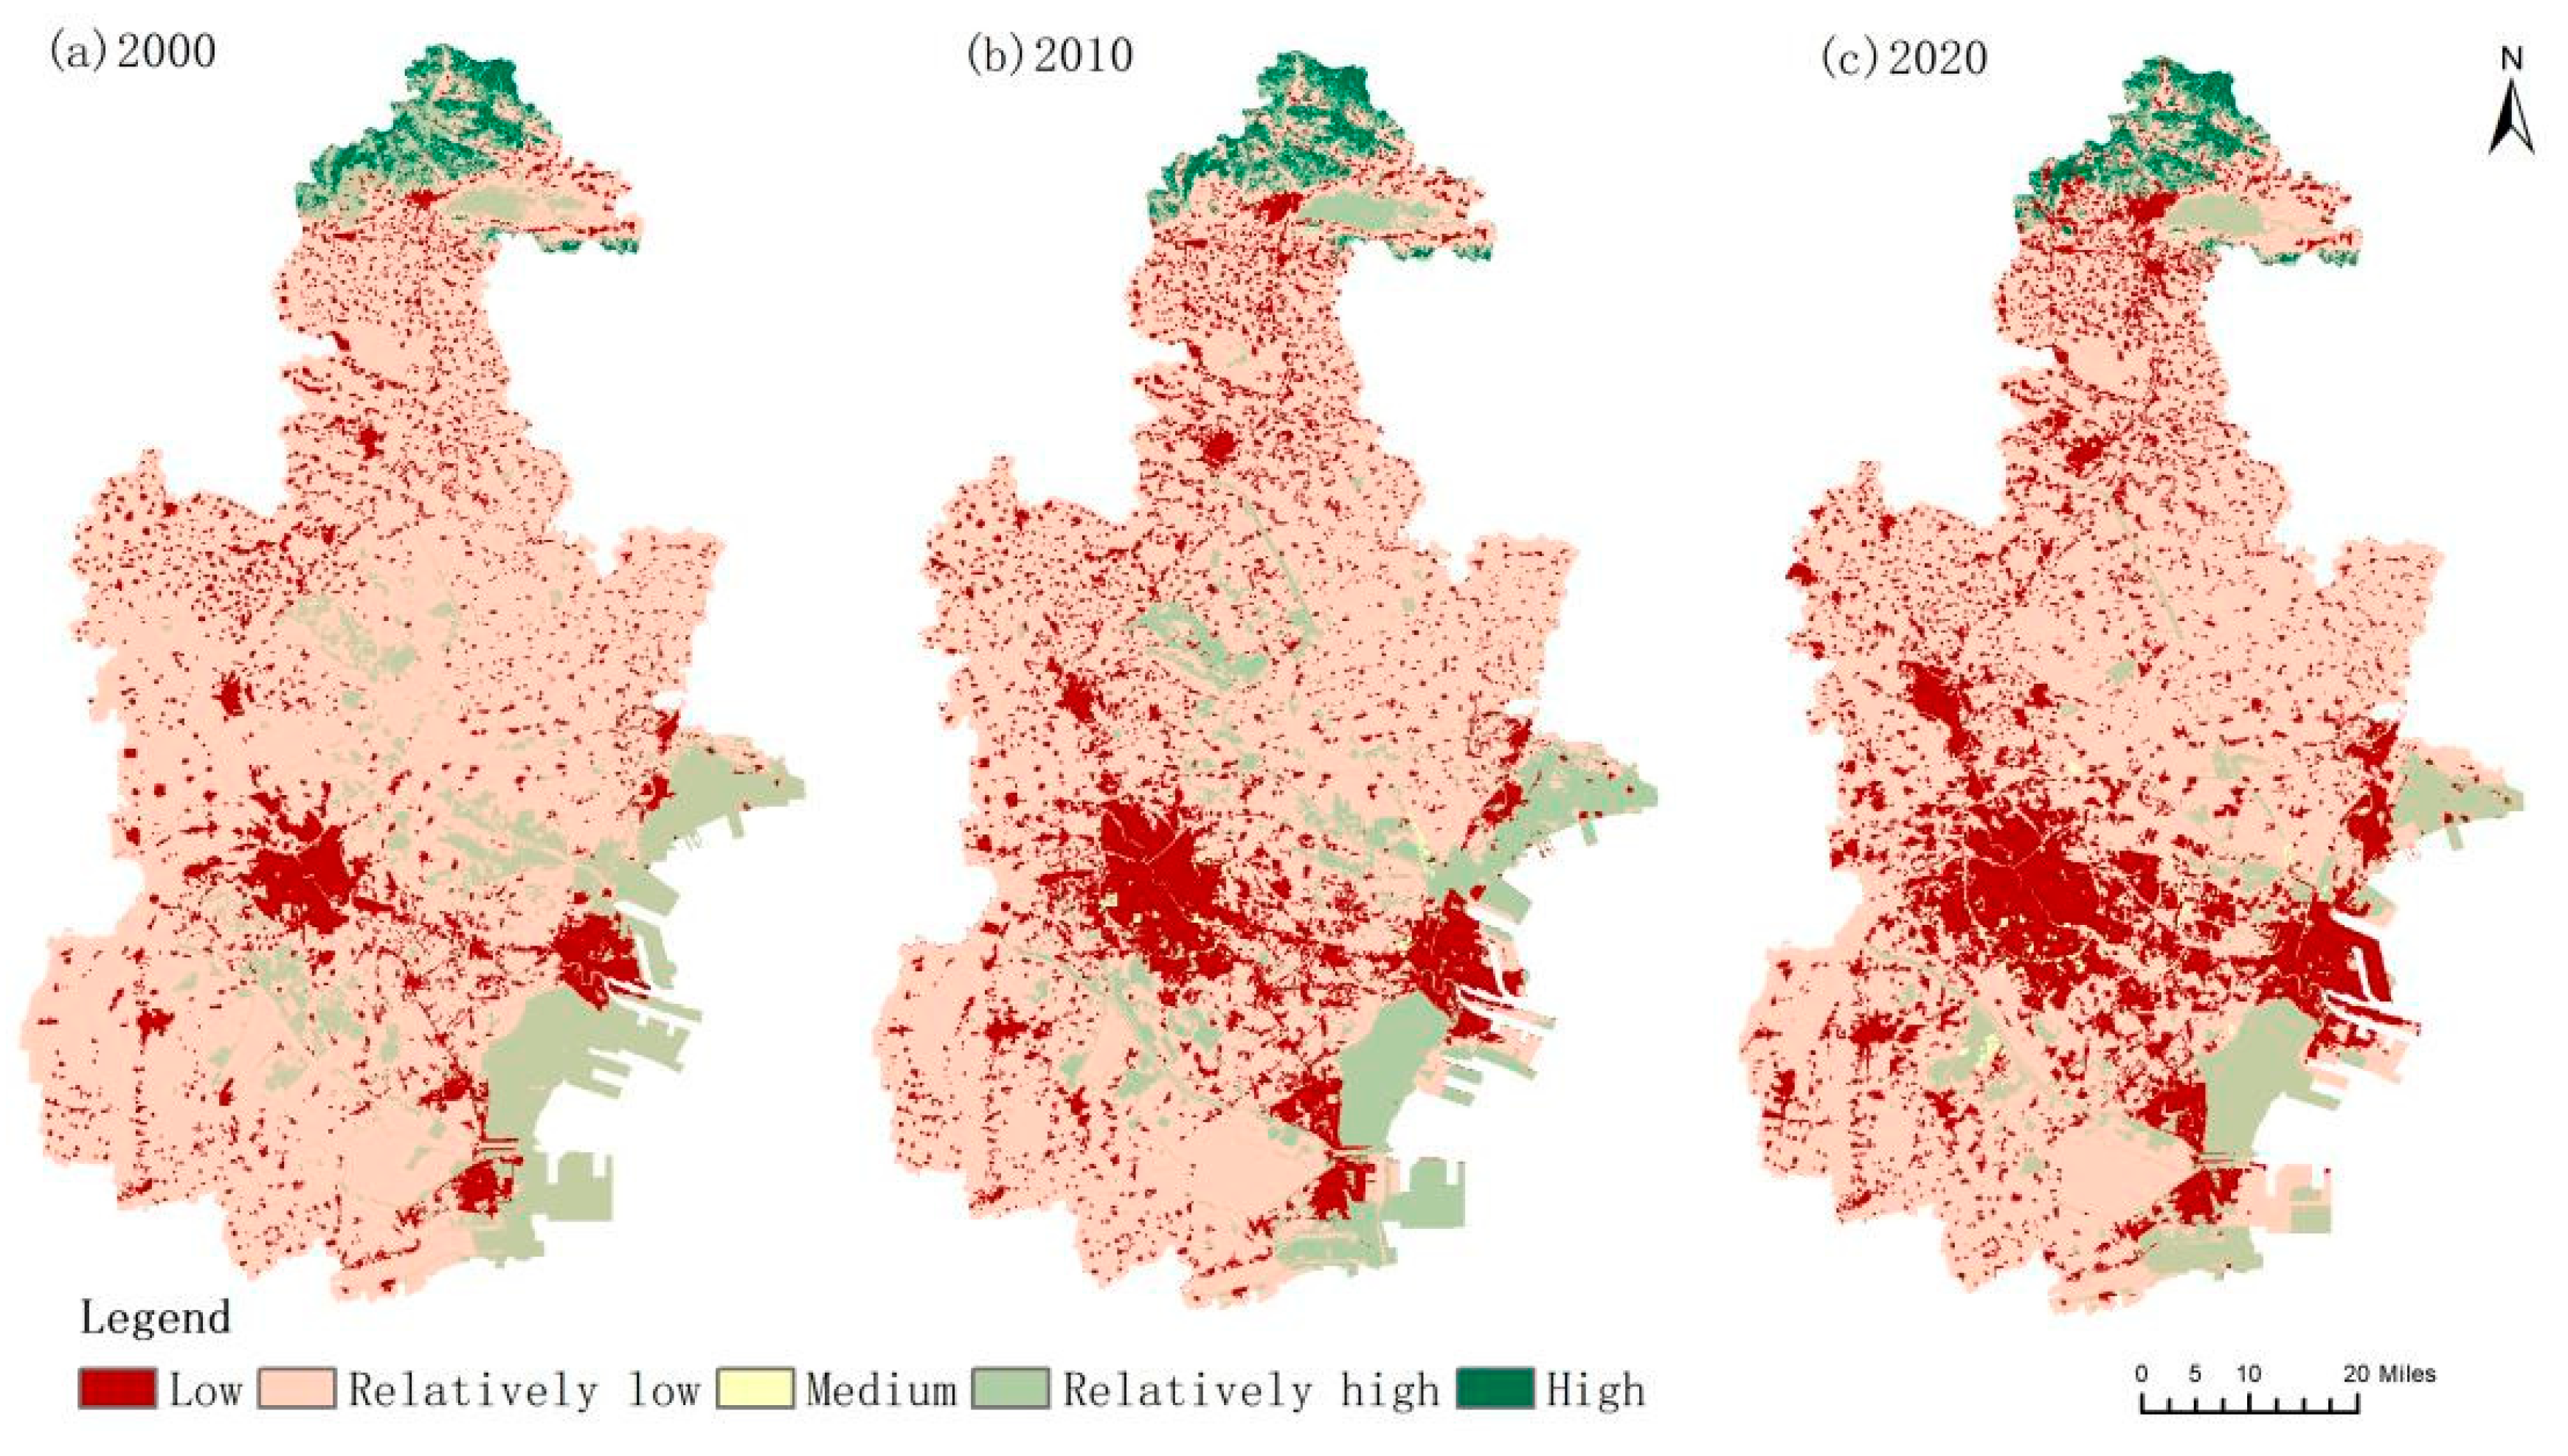
3.1. Land Use Change in Tianjin from 2000 to 2020

In terms of land area changes and land use dynamics (Table 5), the 20-year period from 2000 to 2020 in Tianjin was characterized by overall changes, with construction land expanding rapidly and arable land and sea area decreasing year by year. The largest increase in area was in construction land. With an increase from 1365.21 km2 in 2000 to 2673.49 km2 in 2020, the overall increase was 1309.35 km2, an increase of 95.98%, with a decrease in the dynamic degree of land use over the next ten years. The arable land area decreased by 753.61 km2, and the dynamic degree of land use decreased from −0.70% to -0.26% over the next ten years, probably due to the arable land red line policy, which played a certain protective role. The forest area increased by 11.42 km2, and the dynamic degree of land use was 1.09% in the first ten years and 5.58% in the second ten years. The forest land coverage rate was 18.11%. It can be seen that Tianjin’s protective forestry and ecological restoration measures have been effective in the past ten years.
From the perspective of land transfer (Figure 3), from 2000 to 2020, the construction land area gradually expanded around the central area, and a large area of cultivated land was converted to construction land. During the two decades, 679.16 km2 (Figure 4) and 697.10 km2 (Figure 5) of cultivated land were transferred to construction land, respectively, and the change area was mainly concentrated in the central area and the peripheral area of the city. A large number of sea areas were converted to wetlands and construction land, showing a decrease of 305.22 km2 in 20 years (Table 5), and the reduction value was 81.05% of its original value. The conversion of some sea areas to wetlands had a certain relationship with the decline in sea level, but it was more so caused by the reclamation policy and the expansion of construction land in the Tianjin Binhai New Area. Recovery has been observed in woodland areas in the last ten years. Of its increased area, 78% comes from grassland and is concentrated in the south of the Jizhou district. It can be seen that human afforestation and ecological restoration have made great contributions. Comparing the simulation with the actual 2020 land use data acquired using a random sampling test, the Kappa coefficient is calculated to be 0.75, and the overall accuracy is 88.86%, and the model has strong robustness.
Based on the land use data in 2020, the Markov and plus models were coupled to predict the spatial distribution of land use types in 2030 under three scenarios, as shown in Figure 6. (1) Under the NDS, the overall trend remained unchanged, with the construction land area increasing to 3206.32 km2. The area of cultivated land decreased to 6999.93 km2, the area of forest land remained largely unchanged, and the area of other land types decreased accordingly. (2) Under the EPS, the construction land area increased from 2673.49 km2 to 3856.25 km2, while the area of arable land decreased to 6454.11 km2. (3) Under the EPS, the forest area increased from 215.90 km2 to 245.46 km2, an increase in the original area of 13.69%.
Analysis from a spatial perspective: (1) In the 2030 National Development Strategy, the area of built-up land in the central region had expanded further outwards compared to 2020 (Figure 7a) due to development in the Wuqing District, central Jizhou District, and northern Binhai New Area. However, the forests and grasslands in the Jizhou District had been degraded, with threats mainly coming from the expansion of arable land. (2) Compared to the NDS, the ECS showed an expansion of built-up land in the central area (Figure 7b), with the decentralized construction centers of the Jizhou District beginning to connect. The fragmentation of the landscape pattern increased with the encroachment of the main river route on the border of Jinghai and Xiqing by built-up land. (3) Under the EPS, the increase in woodland areas was mainly concentrated in the northern part of the Jizhou District (Figure 7c), with most of the grassland being converted to woodland. This is consistent with the vegetation restoration measures in Tianjin. In the restricted areas within the ecological red line, river trunk lines and wetlands were protected.

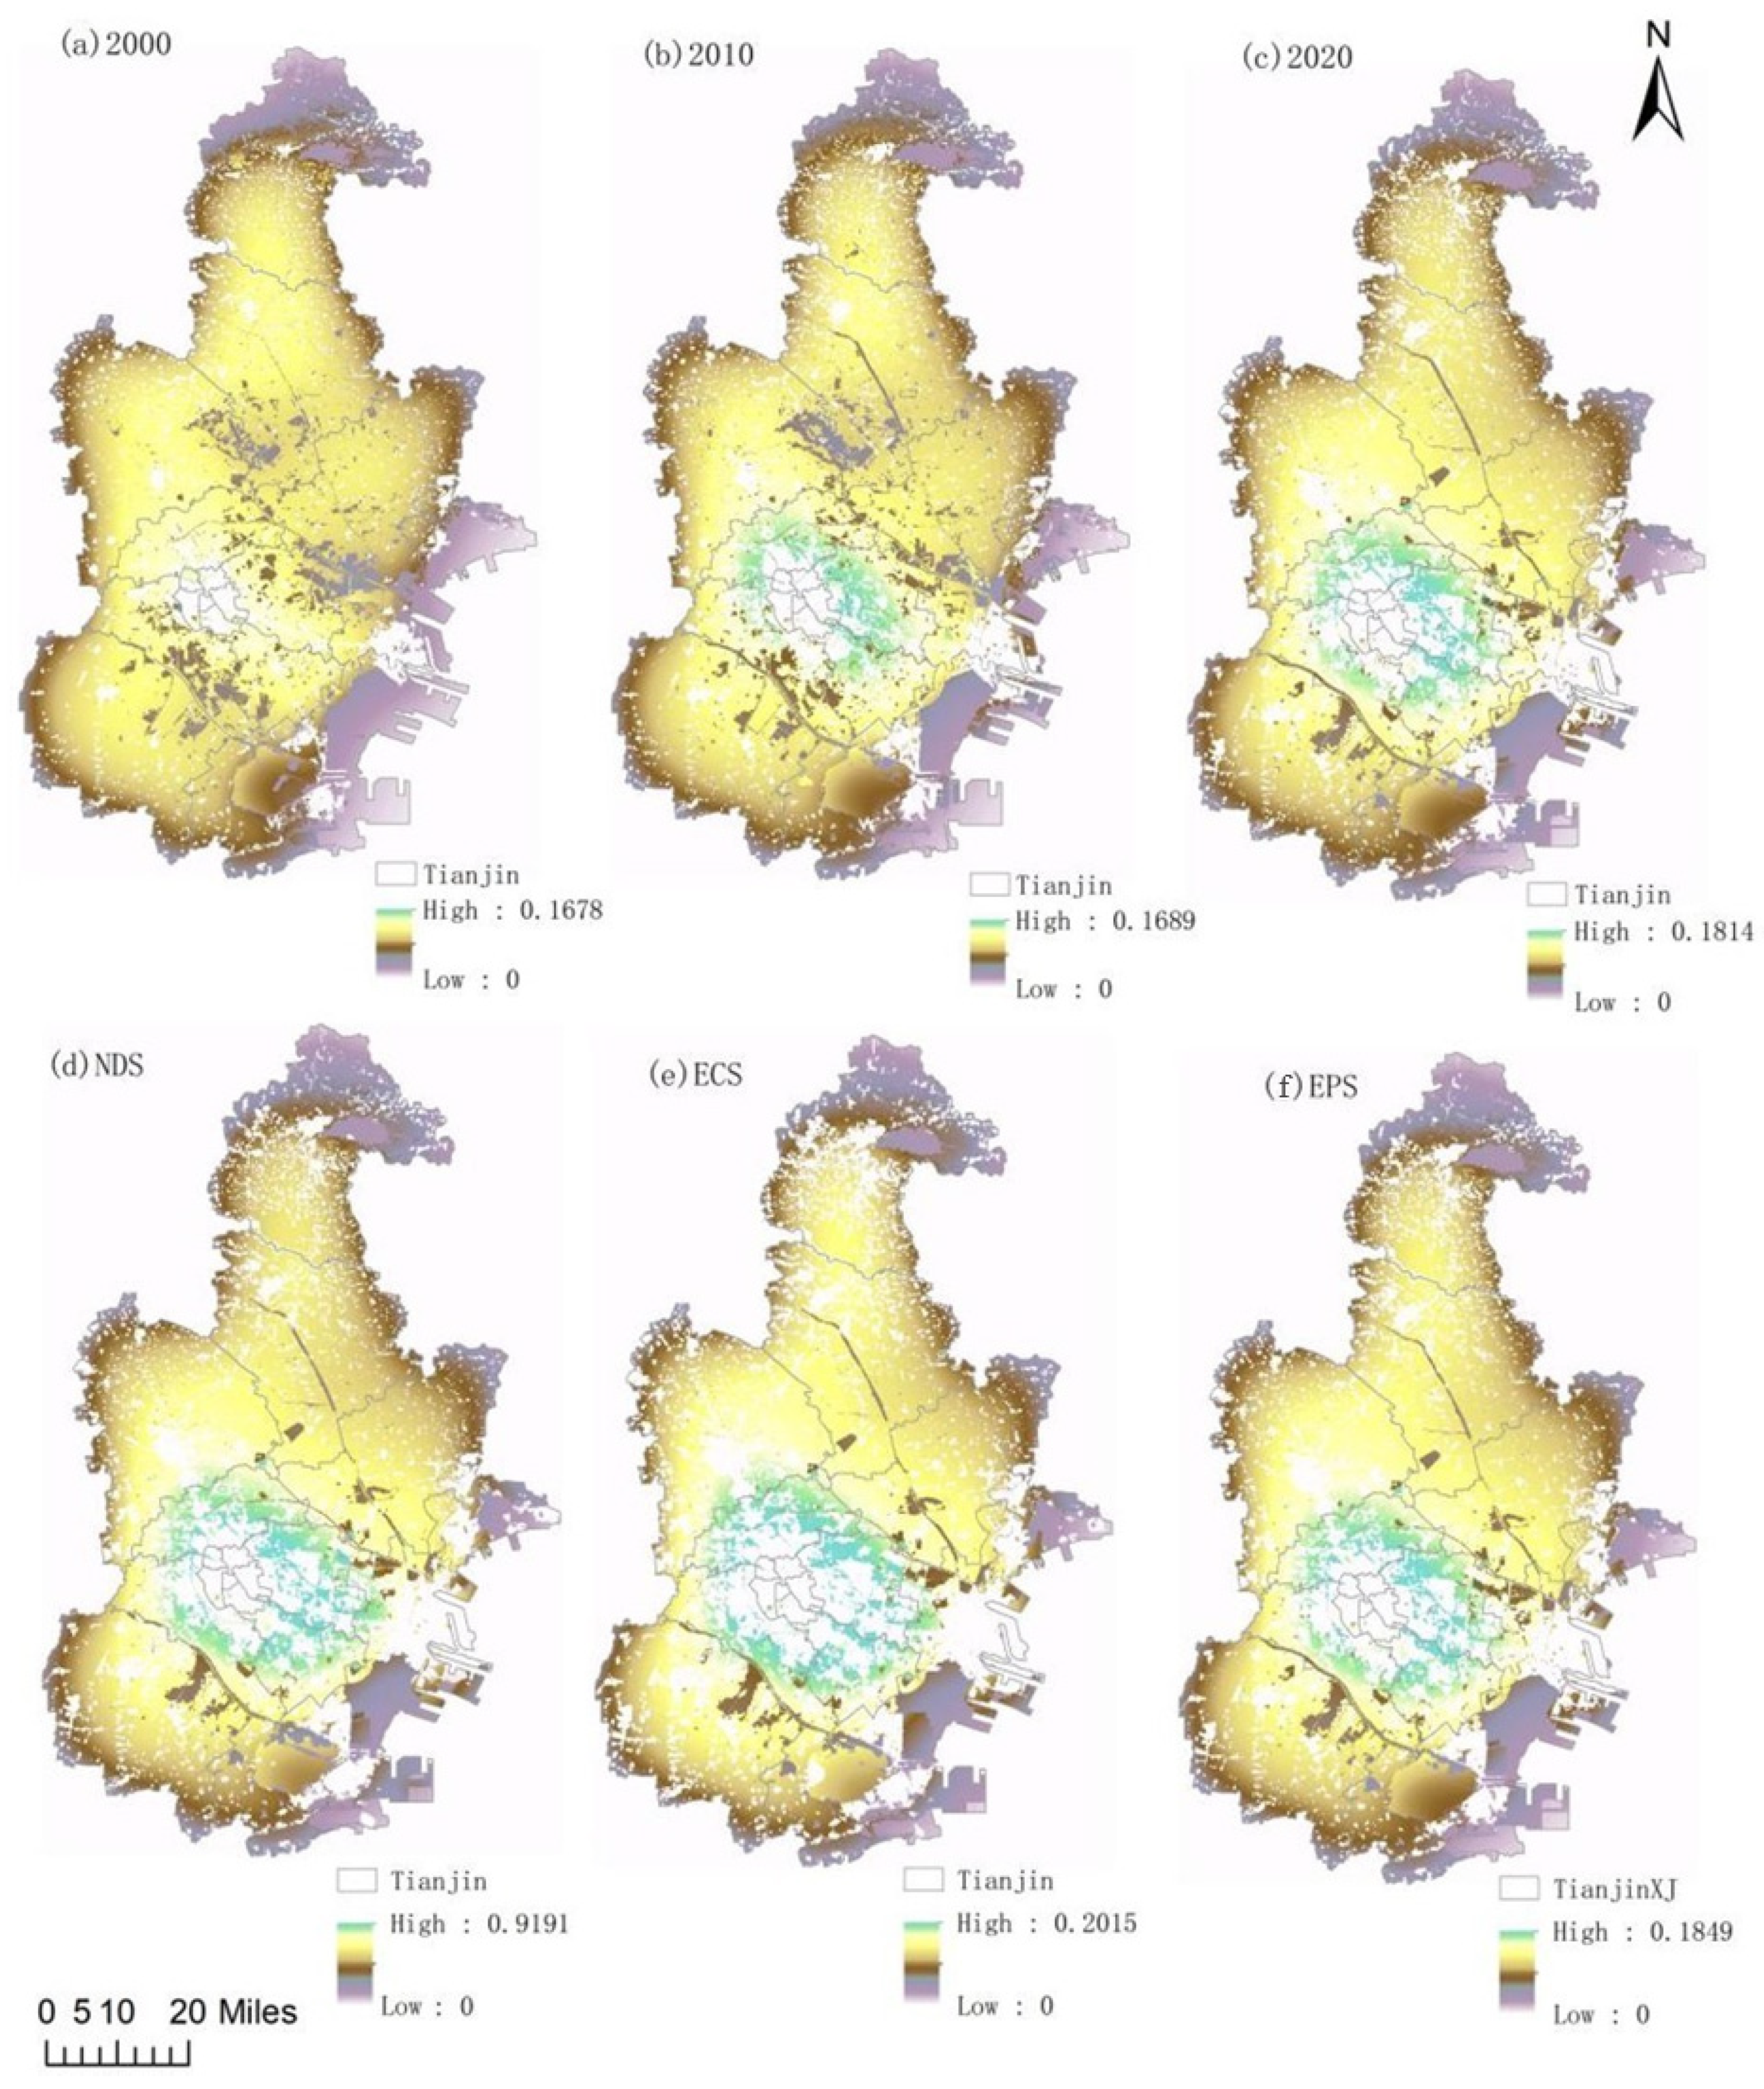
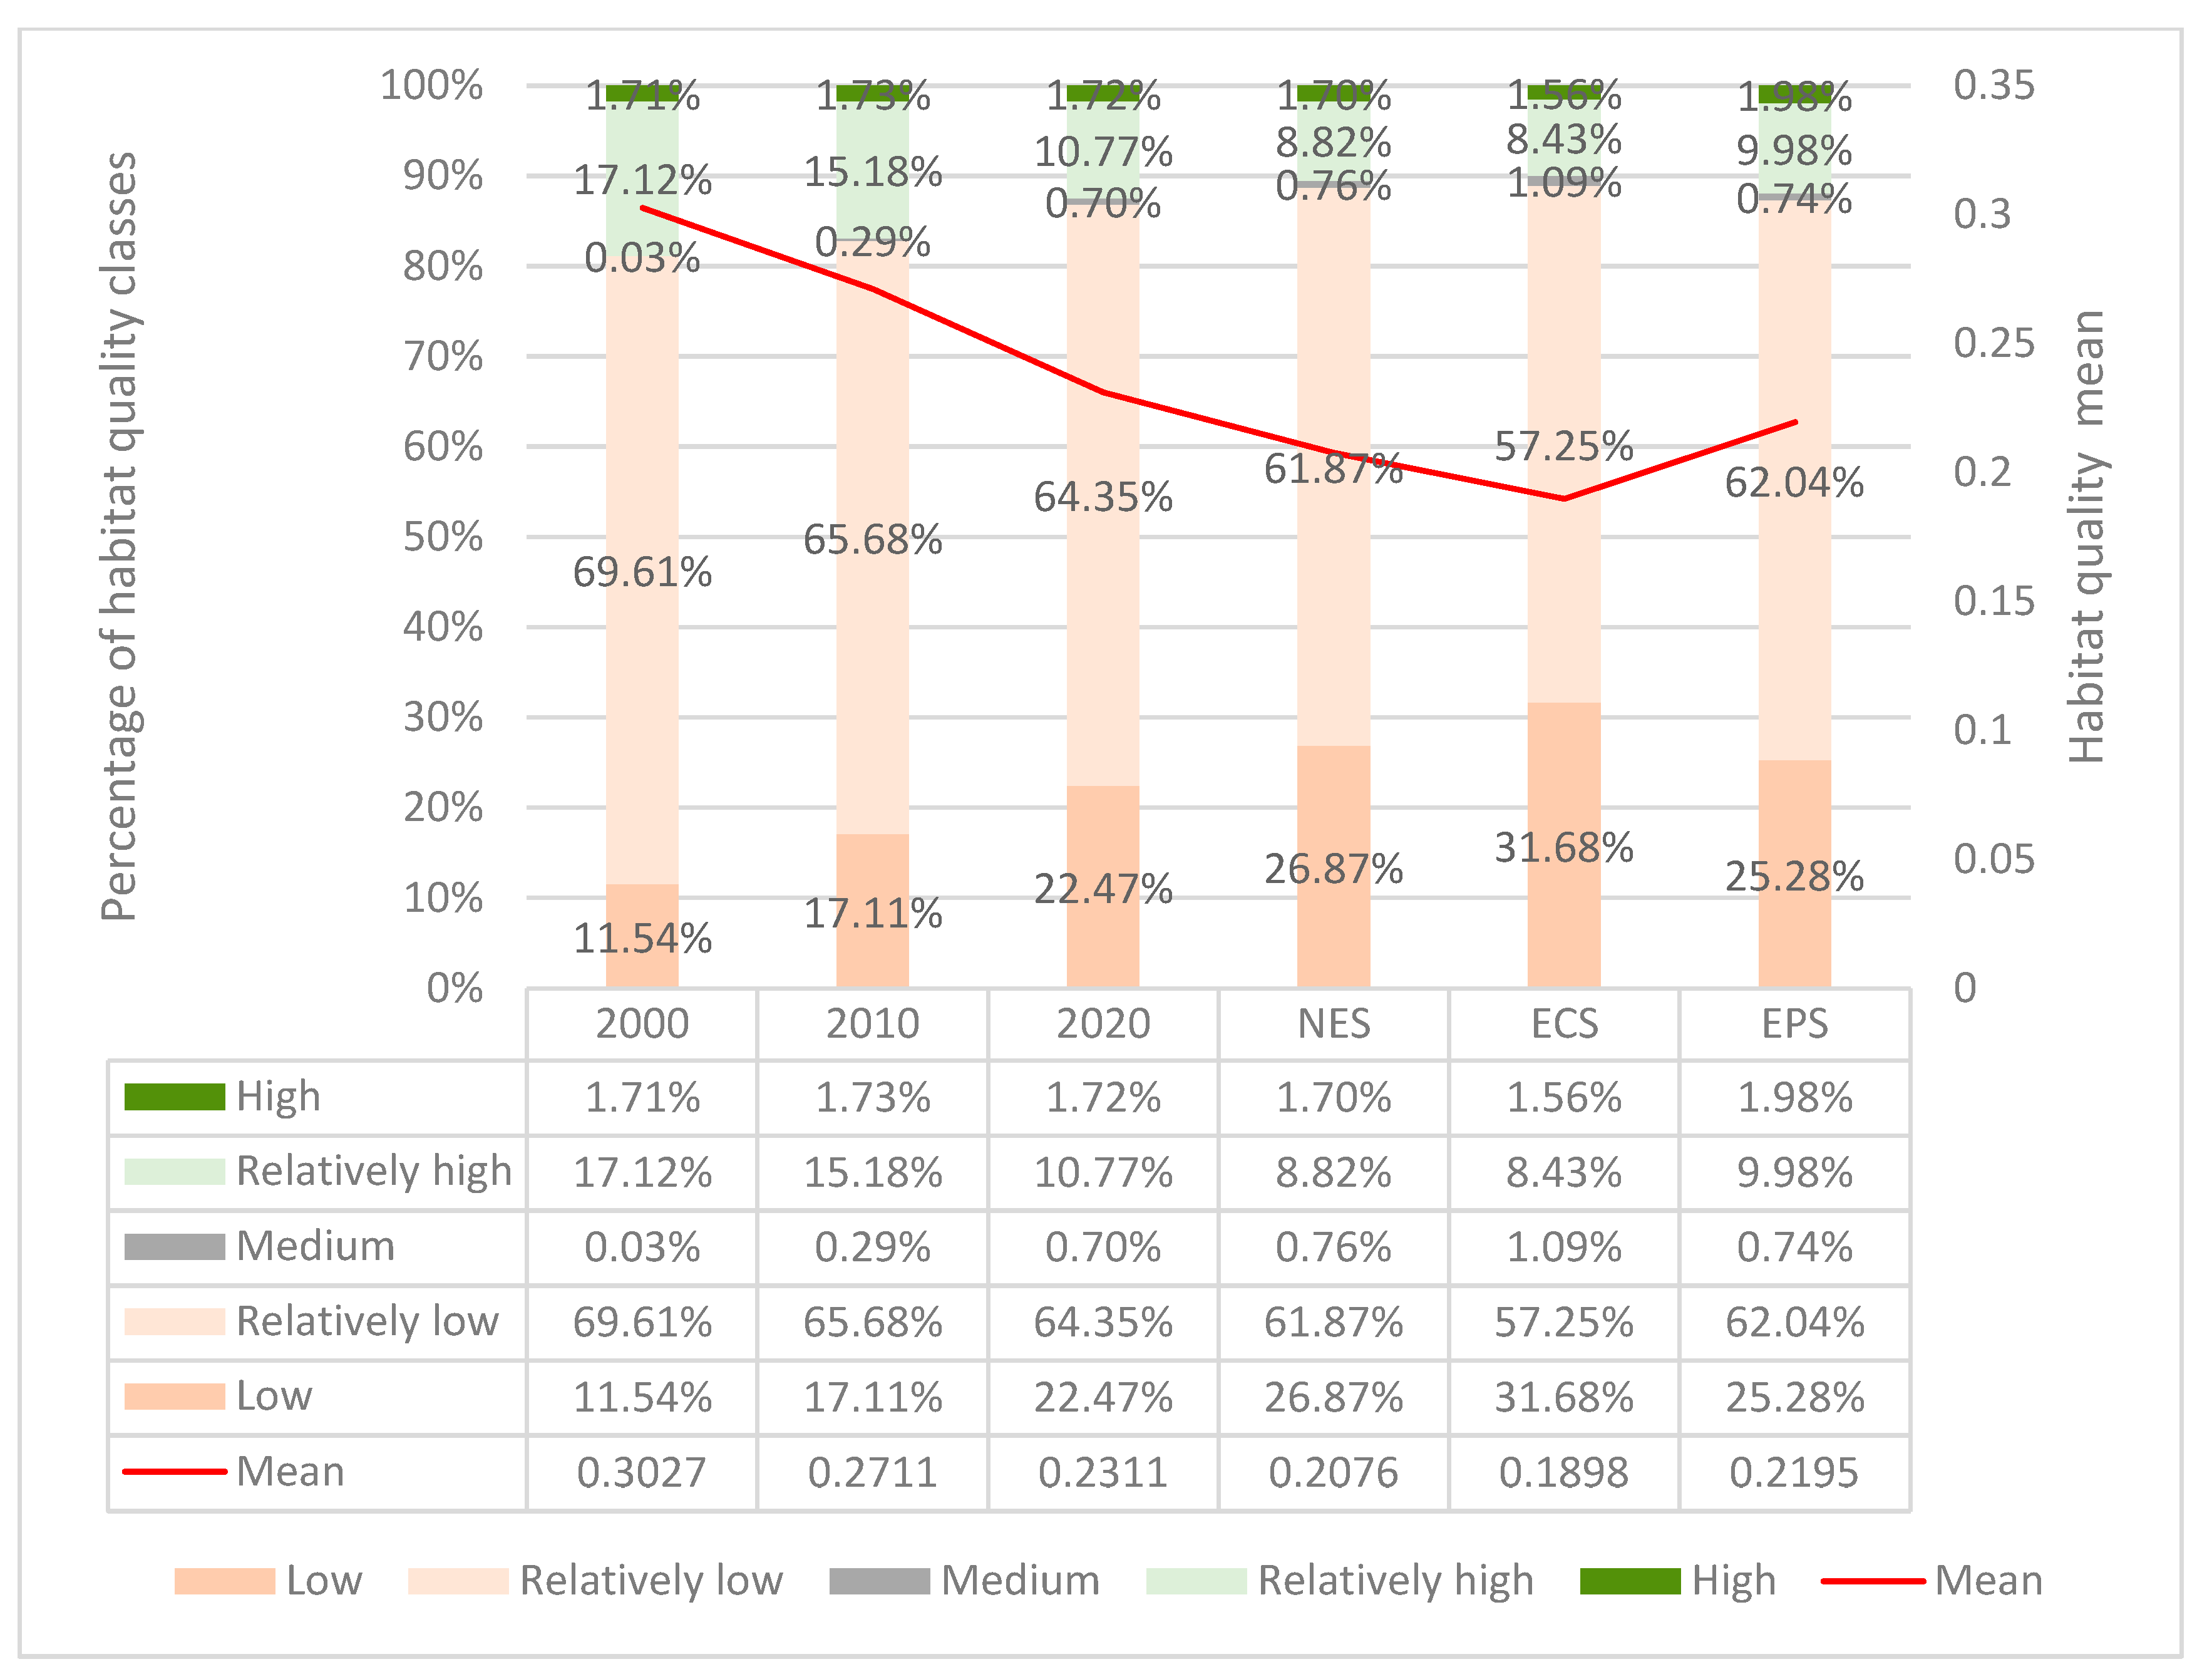
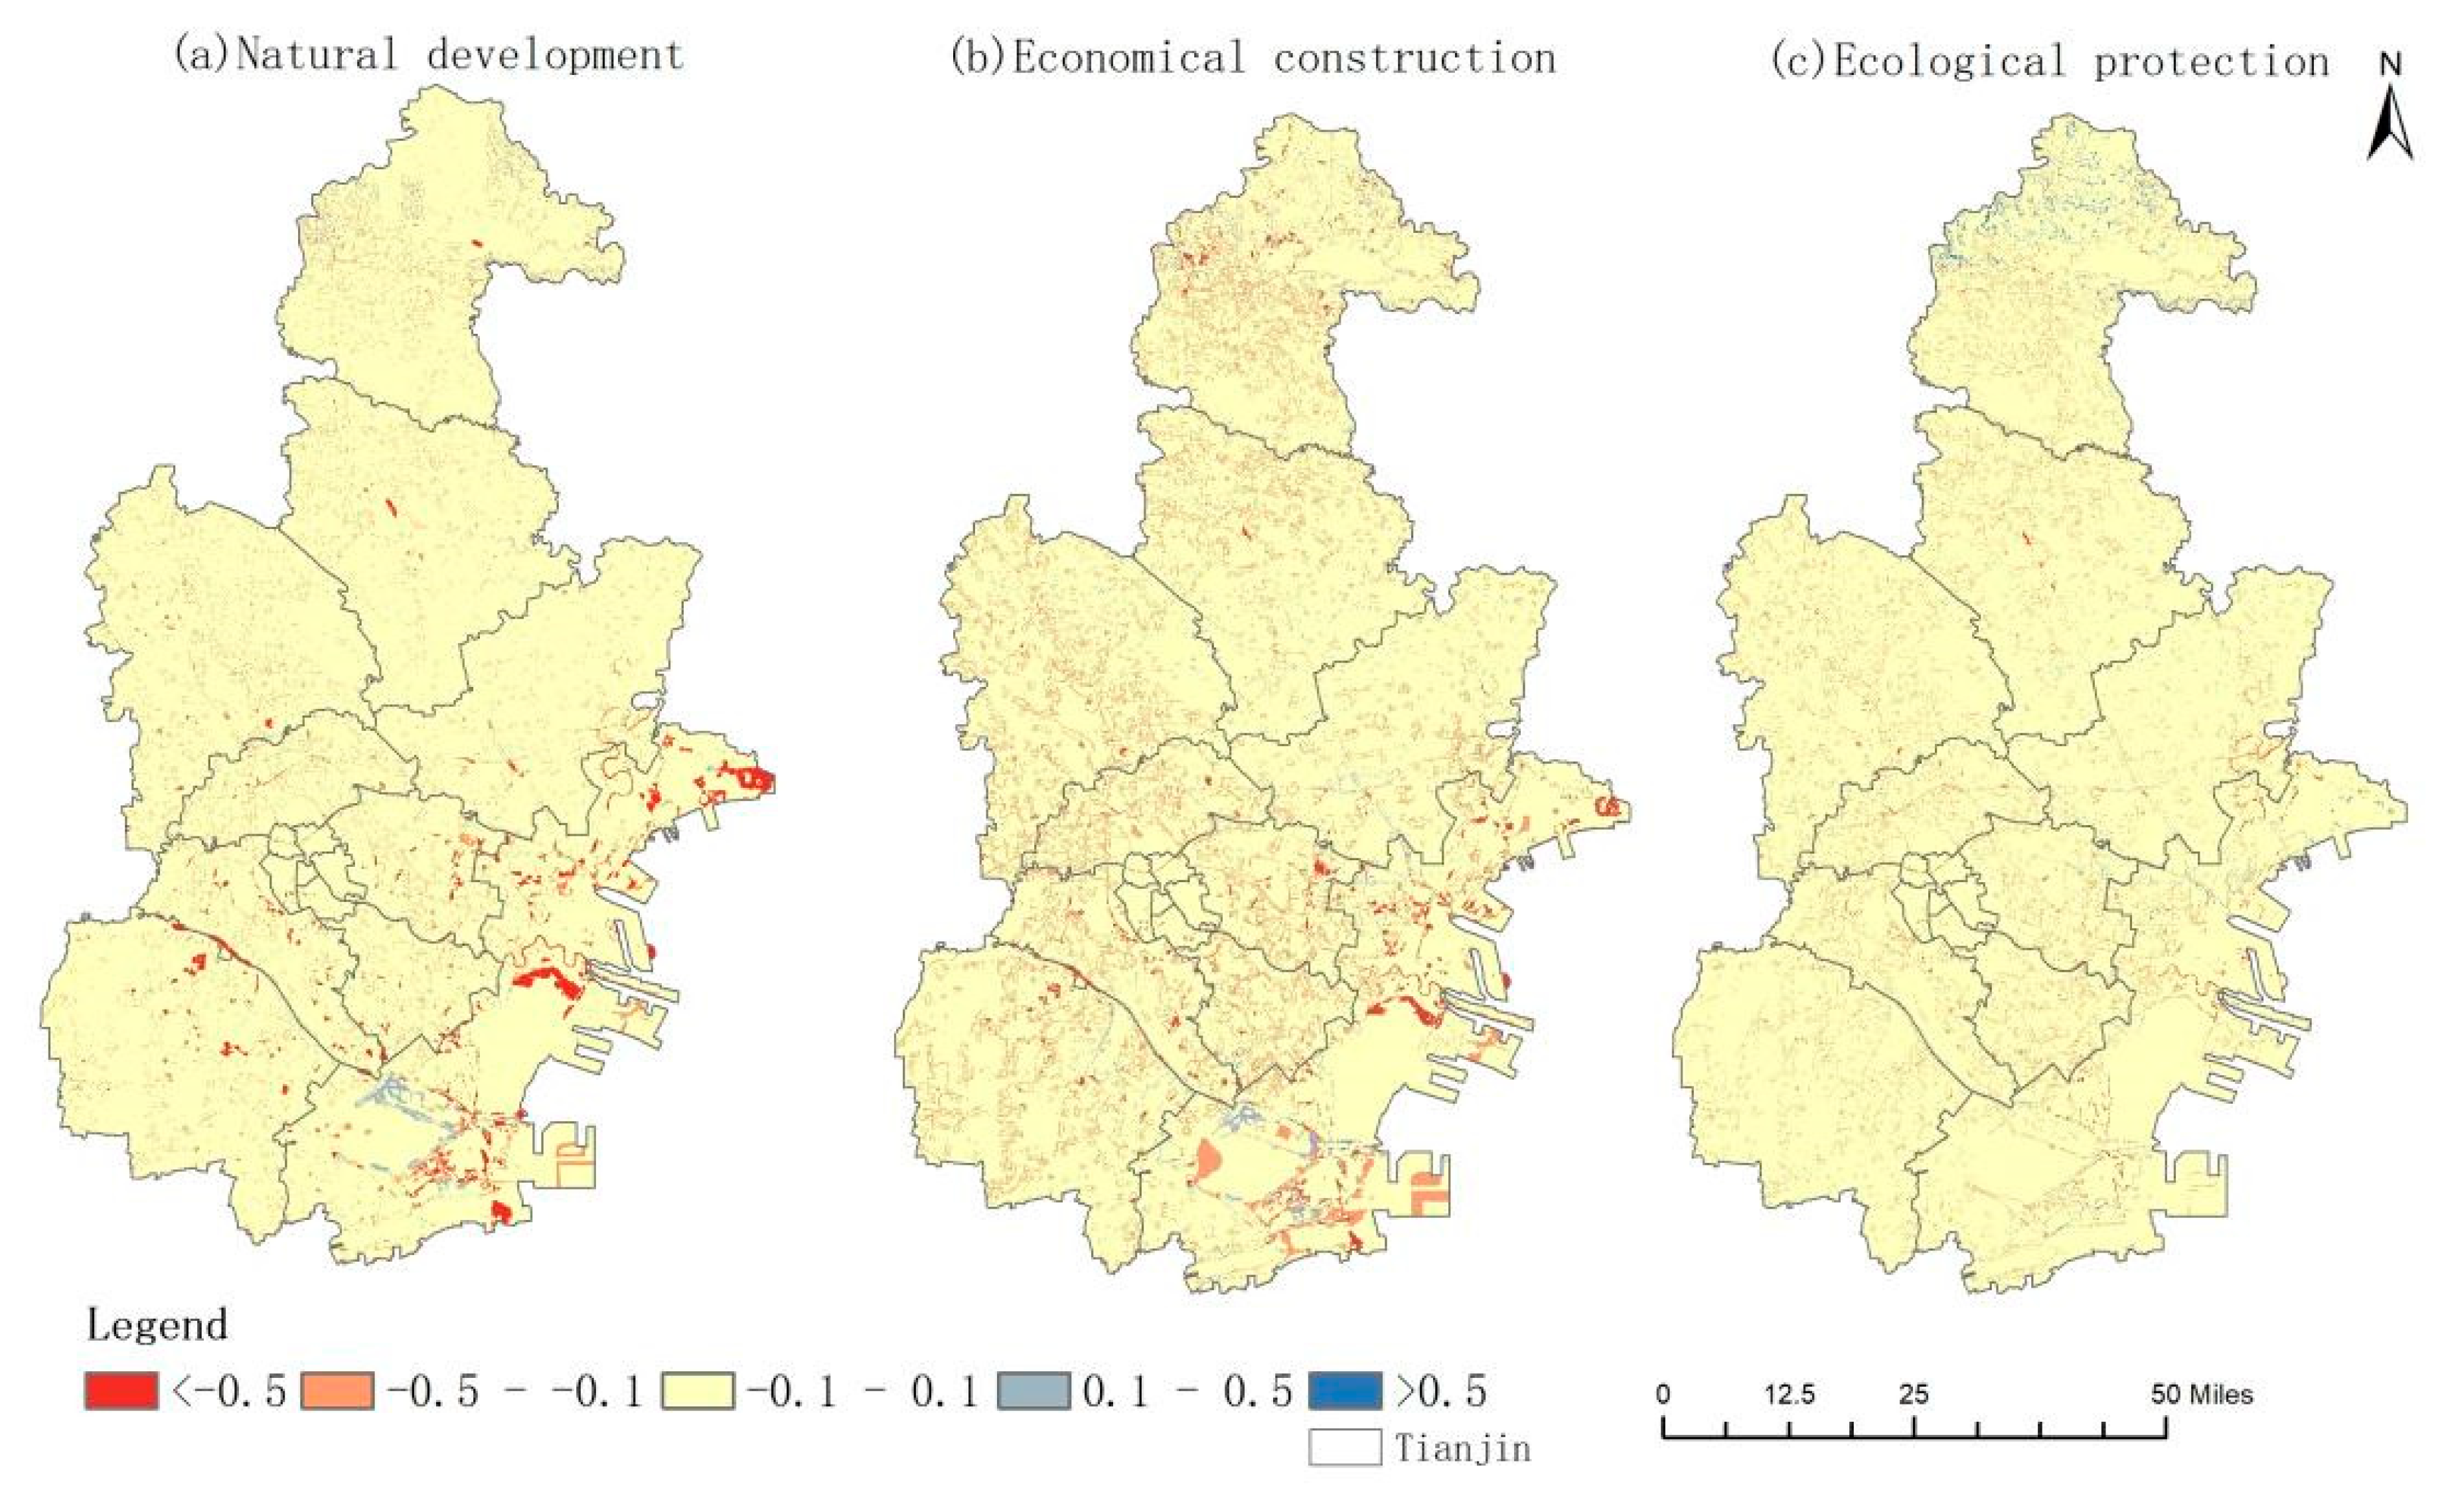
3.2. Habitat Degradation

The Habitat Degradation Index (HDI) measures the threat level to a site, with values close to zero indicating a low threat level and higher values indicating a higher threat level. From 2000 to 2020, the maximum value of HDI increased year by year (Figure 8), with values of 0.1678, 0.1689, and 0.1814, respectively. The main areas with high vales were concentrated at the edge of the central area, and construction land spread outwards in a dispersive manner, posing a greater threat to the arable land in the area. The main high value areas were concentrated at the edge of the central area, where construction land was spreading outwards in a dispersive manner, posing a greater threat to the arable land in the area. Additionally, some watersheds were covered by higher habitat degradation index areas, which also have certain ecological problems. This was highly correlated with the extent of human activity and the spatial pattern of construction land. The maximum values for 2030 in the three scenarios are as follows: ECS (1.1849) > NDS (1.1911) > EPS (1.2015), with the high value areas increasing significantly under the ECS and large areas of arable land and rivers becoming threatened.

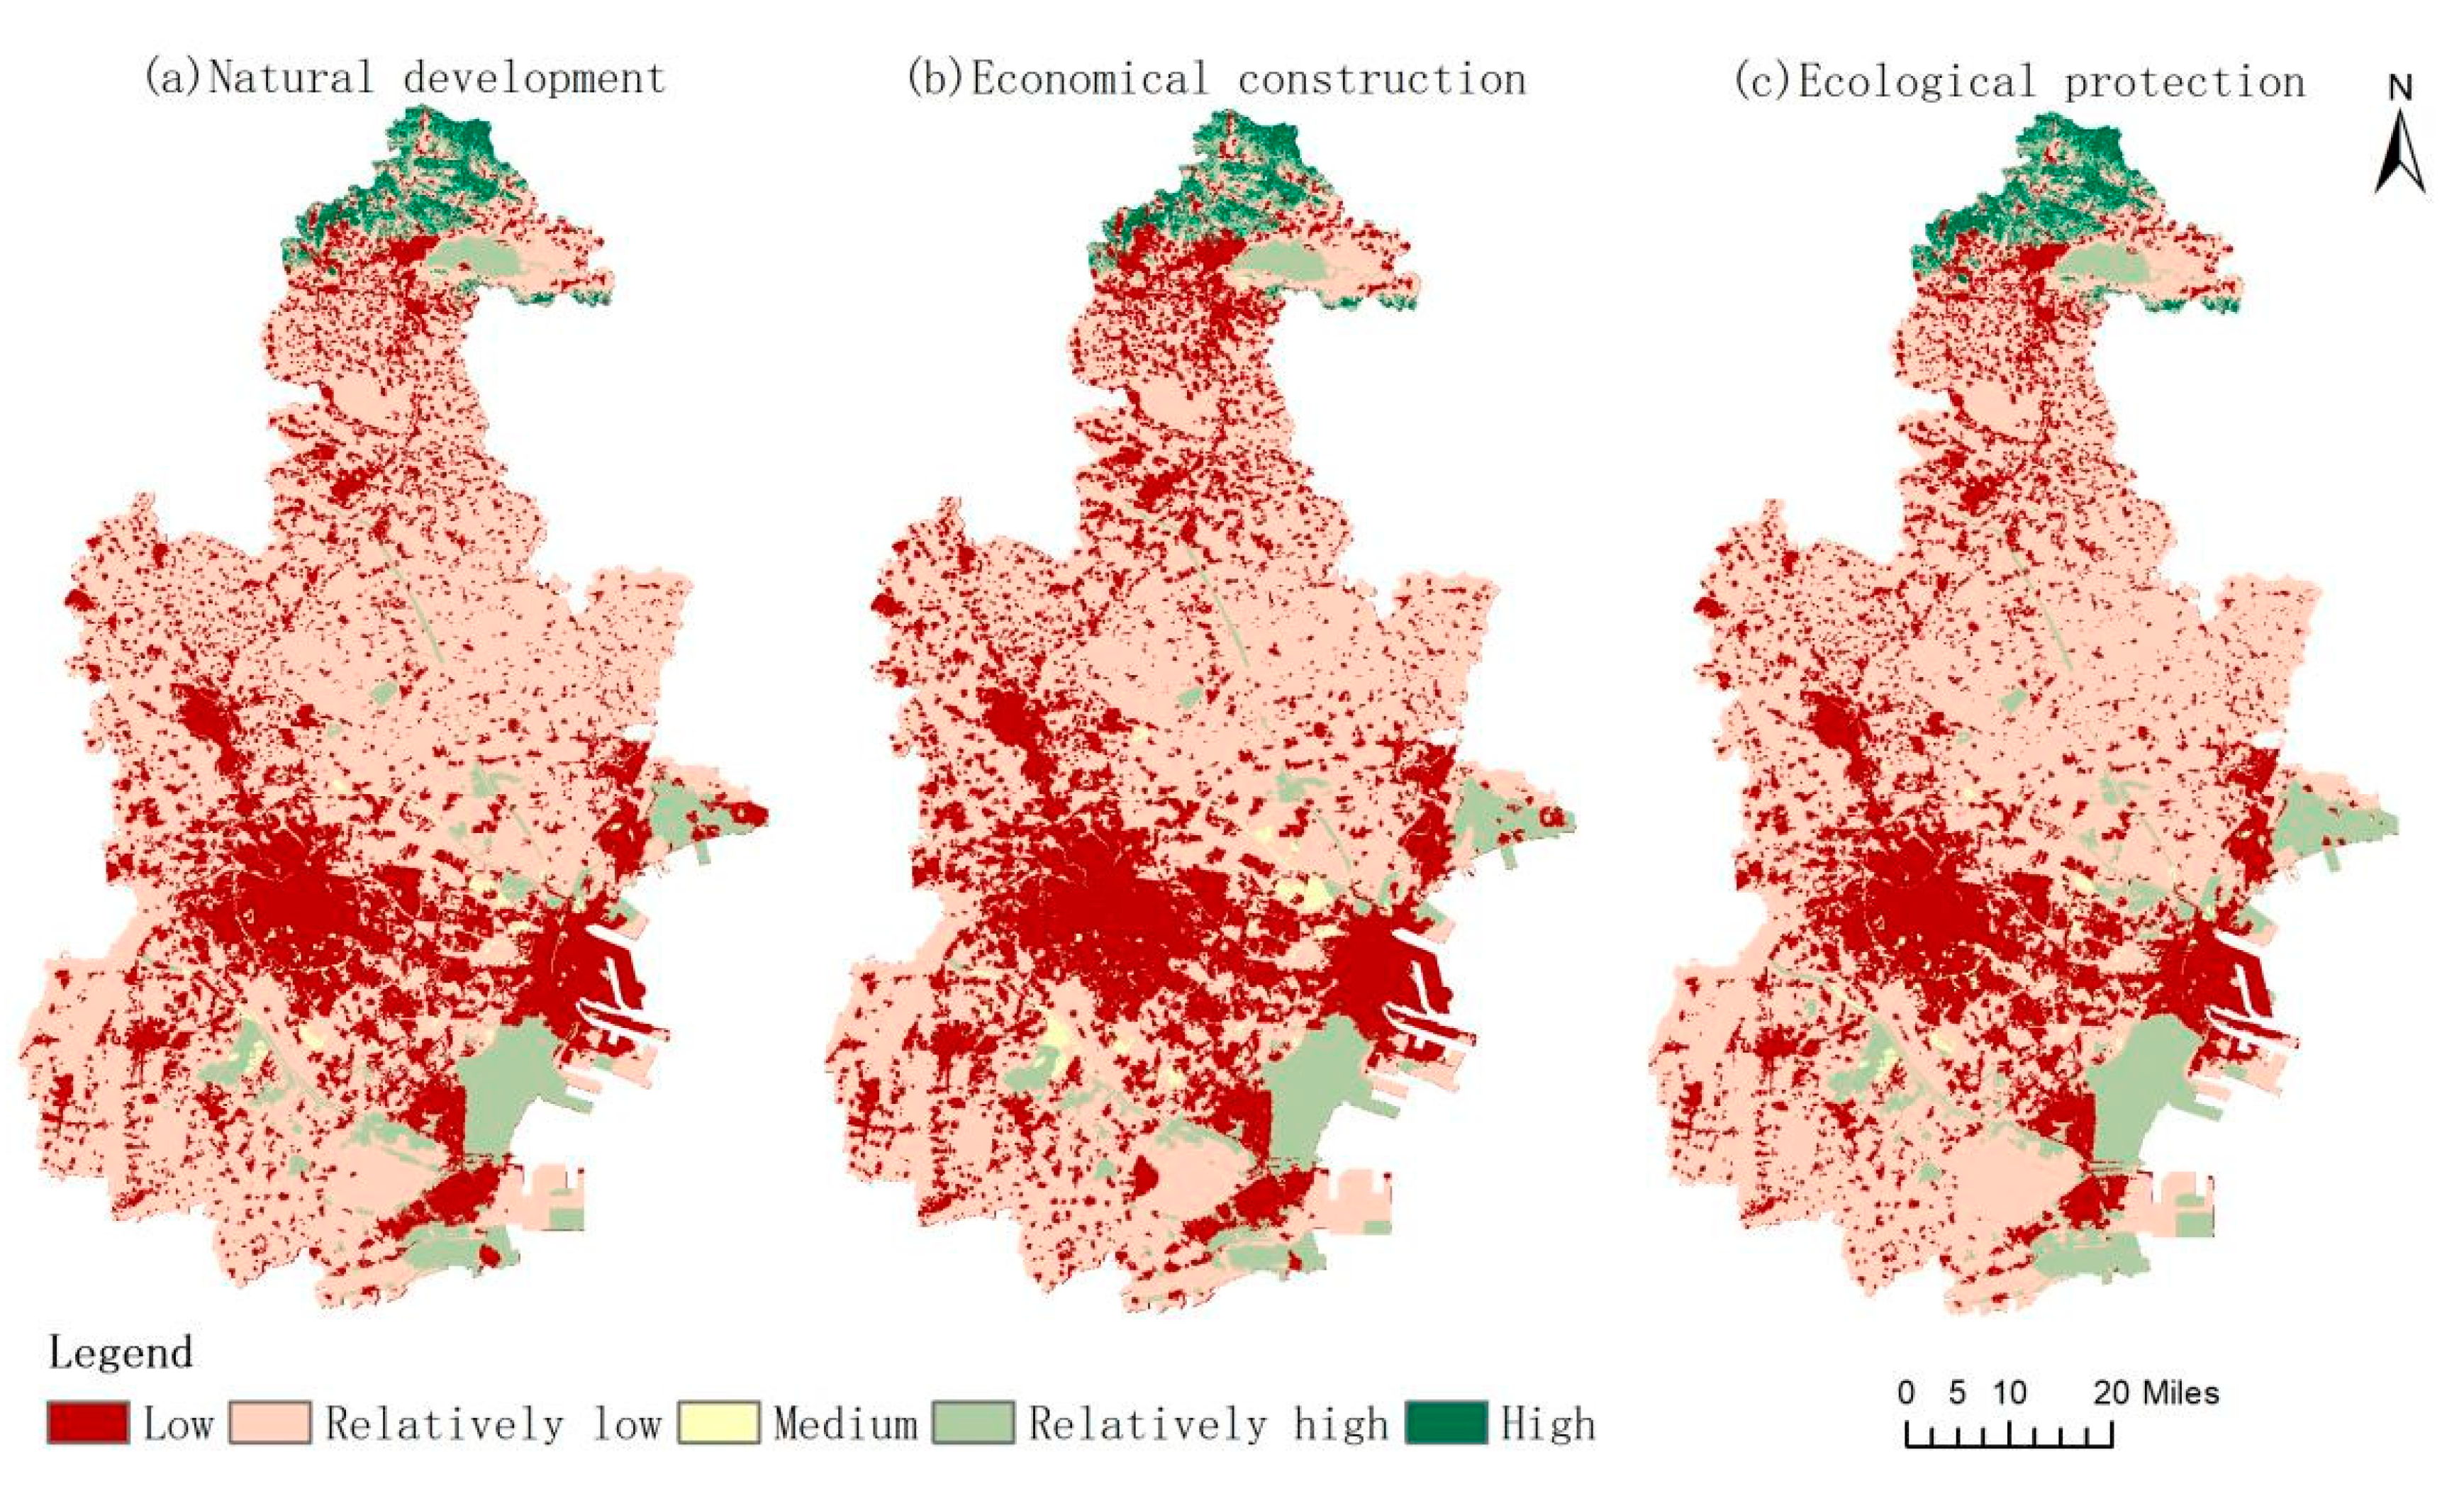
3.3. Habitat Quality Projections for Tianjin in 2030 under Different Scenarios

The Habitat Quality Index (HQI) measures the ability of the environment to provide the conditions and resources necessary for species and populations to sustain and reproduce, with values ranging from 0 to 1. The closer the value is to 0, the lower the habitat quality and the lower the biodiversity, and conversely, the closer the value is to 1, the higher the habitat quality. In this paper, the results are classified into five classes: low (0–0.1), relatively low (0.1–0.4), medium (0.4–0.6), relatively high (0.6–0.8), and high (0.8–1).
In terms of the temporal changes and percentages of each class (Figure 9), the mean values in 2000, 2010, and 2020 were 0.3027, 0.2711, and 0.2311, respectively, which were among the lower levels among cities in the country, and the Habitat Quality Index decreased year by year. To conclude, habitat quality as a whole was in a degraded stage. The low value areas surged from 11.54% to 22.47%, and these were inextricably linked to rapid urban expansion. High-value areas remained at around 1.7%, which shows that the woodland protection policy had some success.
This paper used a coupled Markov and Plus model to predict land use in 2030 for three different scenarios and evaluated the habitat quality under the three scenarios using the INVEST model (Figure 9). The habitat quality values were ranked from highest to lowest: EPS (0.2195) > NDS (0.2076) > ECS (0.1898). An analysis was performed to determine the area share of each class: (1) The low value area in the NDS accounted for 27.2%% of the area, which was one of the reasons for its lower mean value. (2) In the EDS, the address area was 4.81% higher than in the NDS, with a corresponding decrease in all other values and an overall shift towards lower habitat quality values. (3) In the EPS, the high-value area increased by 0.26% even though the proportion was not large, but considering the actual situation, this part of the increase can be achieved by considering afforestation and the protection of woodland. This result had a certain degree of reliability and feasibility. Therefore, it was proposed that an effective ecological protection policy will lead to some improvement in habitat quality.
In order to clearly observe the changes in the habitat quality values, they were divided into five categories at natural intervals according to the above (Figure 10). The spatial pattern of the biblical and habitat quality from 2000 to 2020 showed a clear pattern of evolution, with high values mainly being concentrated in the forests of the Jizhou District in the north of Tianjin, the increase in which was related to the implementation of the “forest manager system”, which attached great importance to forest protection and ecological restoration; the most noteworthy areas were those with low levels, indicating areas where the habitat quality is severely affected by urban expansion. These areas included all of the central areas (Hongqiao, Nankai, Henan, Hebei, and Tuanbo Lakes). Expansion was characterized by the eastward and northward movement of the low habitat quality area from the central area and its gradual expansion, with a tendency to link up with the Binhai New Area.
In terms of the spatial pattern, the difference in habitat quality between the three scenarios in 2030 was obvious. (1) The change in each value area under the NPS was basically the same as the change trend in the previous decades. It was noteworthy that the low-value areas spread more rapidly towards Binhai New Area and the northern part of Tianjin (Figure 11a). (2) Under the ECS, the low-value areas spread from the city center to the surrounding area, with the eastern part directly approaching the coastal boundary line of the Binhai New Area. They spread northwards to occupy part of the Wuqing District and Baodi District, extending to the Jizhou District and even approaching the protected forest area (Figure 11b). (3) Under the EPS, the high-value areas were mainly concentrated in the woodlands and reservoirs to its north, and the high value areas and higher value areas basically corresponded to the ecological red line areas, and the overall habitat quality was relatively high (Figure 11c).
To determine the changes in the habitat quality spatially, the difference between the habitat quality of the three scenarios and the habitat quality in 2020 was plotted. Changes were divided into five categories: drastic decline (<−0.5), decline (−0.5–0.1), basically unchanged (−0.1–0.1), rise (0.1–0.5), and drastic rise (>0.5). (1) Under the NDS, areas with a declining habitat quality were clustered in the Wuqing District, Binhai New Area, and Dongli District. (2) Under the ECS, the habitat quality declined over a large area in the whole region, with the declining areas mostly located around the central area. (3) Under the EPS, the areas with increasing habitat quality were concentrated in the woodland areas of the Jizhou District. The reason why there are no areas with increasing habitat quality in the southern part of the Binhai New Area is because wetlands are protected from encroachment by water bodies under the wetland ecosystem protection policy.

4. Discussion

4.1. Causes of Land Use Change

Land use change in Tianjin is the result of a combination of natural and human factors, and the main causes of such change vary from place to place. Tianjin has large plains and sufficient water resources, and these unique advantages make the area convenient for urban construction. As a result, the urbanization of Tianjin was ranked among the top cities in China. However, because of this, the expansion of land for construction had led to the increasing fragmentation of arable land [29], which, if not restricted and planned by the government, would threaten sustainable development. Although some ecological areas have been degraded, major ecological function areas are still present. This is due to the document “The Twelfth Five-Year Plan for the Construction of Tianjin Eco-city” released in 2013, which specified three important ecological functional areas, namely the Jibei Mountain Ecological Function Area, the Dahangbao-Qilihai Wetland, and the Tuanbowa-Beidagang Wetland, for effective protection.

4.2. Relationship between Habitat Quality Change and Land Use Change

The studies referenced in this paper reconfirm that the spatial pattern of habitat quality values is highly correlated with the distribution of land use types [24,30]. On the one hand, there was an increase in areas with low habitat quality values, the growth of which coincides with urban expansion and the expansion of construction land [31]. This is concentrated in the central areas of the Heping District, Hedong District, Hexi District, Nankai District, Hebei District, and Hongqiao District. Therefore, the expansion of construction land was the main cause of habitat quality decline, which was in line with previous studies on the causes of habitat quality decline in the Beijing–Tianjin–Hebei region [32,33]. Secondly, the existence of a lower value area on the periphery of the central area that was about to be transformed into an even lower value area was consistent with the outward expansion of urban centers encroaching on arable land on the periphery of the central area. On the other hand, despite the conversion of arable land and water to land for construction, the quality of habitats within the ecological red line categories remained high. This suggests that the delineation of the ecological red line and the control of land class shifts in Tianjin have played a protective role [34], again demonstrating that habitat quality changes are closely related to land use changes. In addition, it was found that habitat quality is highly sensitive to construction land expansion, with areas of lower habitat quality values predicting areas of future construction land expansion.

4.3. Causes of Habitat Quality in the Multi-Scenario Simulation

(1) In the case of natural development, the dispersal of built-up land from the central area to the periphery was the main cause of habitat quality degradation (Figure 12) [35]. Most of the habitat quality degradation areas are located in the four districts bordering the central area (Hedong, Jinbei, etc.) and in the western part of the Jizhou District. The Binhai New Area showed an aggregated decline in the habitat quality classes. Although habitat quality classes have increased in the Binhai New Area where wetlands border rivers (Figure 12), this was due to an increase in the water area, a change that will be prevented by the wetland protection policy. (2) Compared to the NDS, the ECS demonstrate a larger area with declining grades. Among them, the Dongli District, Jinan District, Jizhou District, and Binhai New Area were the most prominent (Figure 12). This was consistent with the fact that the state should plan specific areas of arable land in these areas for orderly expansion [36]. This also coincides perfectly with the current areas of support policies, such as the National Rapid Urbanization Pilot Area and the Binhai Industrial Development Talent Introduction Policy. Combining the population raster data and GDP distribution data for Tianjin also showed that areas with a higher population and a higher GDP had lower habitat quality values and that human disturbances to the ecological environment were the factors causing the most disturbance [37]. This indicates that urban construction should be based on national territorial spatial planning conditions and scientific planning for the moderate development of urban boundary areas [38]. (3) Under the EPS, ecology was effectively protected [39]. Controlling land-use type shifts can effectively maintain ecology and reduce ecological risks [40]. A comparison of the graphs shows that the state should make great efforts to restore the vegetation in the Jizhou District (Figure 12) and that such efforts would have promising results [10], but woodland restoration is still constrained by the small grassland area and the relatively concentrated area.

5. Conclusions

This study analyzed the land use changes in Tianjin from 2000 to 2020, predicted the land use in Tianjin in 2030 under different scenarios using the coupled Markov and Plus models, and assessed the habitat quality from 2000 to 2030 using the habitat quality module in Invest 3.9, allowing the following conclusions to be drawn:
(1)
From 2000 to 2020, the construction land increased by 1309.35 km2, and the existing construction land had nearly doubled compared to in 2000. It was mainly transferred from arable land. The overall habitat quality value in Tianjin was low and decreasing year by year. Habitat quality was closely related to the land use type.
(2)
In all three scenarios, construction land expands further. Habitat quality values in 2030 were lower than the average habitat quality values in 2020 for all three scenarios, in the following order: EPS > NPS > ECS. Under the NPS, the low-value areas continue to expand. Under the ECS, habitat quality decreases significantly.
(3)
Based on the above research this paper makes the following recommendations. In the future, there will be a large increase in construction land in the Dongli, Jinan, Binhai, and Jizhou districts; therefore, the existing arable land in these areas should be designated as protected areas as early as possible. The government should control the existing boundaries of construction land to achieve orderly urbanization. It is also important to plan for the connected areas between the two centers, Tianjin city center and the Binhai New Area, which will gradually link up. With the further increase in woodland area in Jizhou District, we should continue to implement the existing vegetation restoration policy and adhere to the ecological red line policy. The shift in ecological land types should be effectively controlled to improve the ecological environment. We should continue to strictly control the benchmark farmland, improve the level of intensive land use, and seek new development models for ecological agriculture.
The development of territorial spatial planning and the enactment of spatial governance policies have a substantial impact on urban land use change. However, policies cannot be quantified, and relatively few policies are considered in this paper. In the future, it may be possible to find ways to quantify quantifiable policies to improve accuracy.

Author Contributions

Conceptualization, Z.L. and S.L.; data curation, Z.L.; formal analysis, X.L.; funding acquisition, S.L.; project administration, S.L.; resources, X.L.; software, X.L. and Y.L.; supervision, Z.L.; validation, X.L. and Z.L.; visualization, X.L. and Y.L.; writing—original draft, X.L.; writing—review and editing, Z.L. and Y.L. All authors have read and agreed to the published version of the manuscript.

Funding

This research was funded by the Natural Science Foundation of Jilin Province, China (20210101395JC).

Institutional Review Board Statement

Not applicable.

Informed Consent Statement

Not applicable.

Data Availability Statement

Not applicable.

Conflicts of Interest

The authors declare no conflict of interest.

References

  1. Zhou, B.B.; Lv, L. Understanding the dynamics of farmland loss in a rapidly urbanizing region: A problem-driven, diagnostic approach to landscape sustainability. Landsc. Ecol. 2020, 35, 2471–2486. [Google Scholar] [CrossRef]
  2. Han, R.; Zhang, J.; Zhu, W.; Wang, L.; Zhang, L.; Zhu, L. Impact of land use change on habitat in the Qihe River Basin of Taihang Mountains. Prog. Geogr. 2018, 37, 1693–1704. [Google Scholar]
  3. Hall, L.S.; Krausman, P.R.; Morrison, M.L. The habitat concept and a plea for standard technology. Wildl. Soc. Bull. 1997, 25, 173–182. [Google Scholar]
  4. Li, F.; Wang, L.; Chen, Z.; Clarke, K.C.; Li, M.; Jiang, P. Extending the SLEUTH model to integrate habitat quality into urban growth simulation. J. Environ. Manag. 2018, 217, 486–498. [Google Scholar] [CrossRef] [Green Version]
  5. Polasky, S.; Nelson, E.; Pennington, D.; Johnson, K.A. The Impact of Land-Use Change on Ecosystem Services, Biodiversity and Returns to Landowners: A Case Study in the State of Minnesota. Environ. Resour. Econ. 2011, 48, 219–242. [Google Scholar] [CrossRef]
  6. Yohannes, H.; Soromessa, T.; Argaw, M.; Dewan, A. Spatio-temporal changes in habitat quality and linkage with landscape characteristics in the Beressa watershed, Blue Nile basin of Ethiopian highlands. J. Environ. Manag. 2021, 281, 111885. [Google Scholar] [CrossRef] [PubMed]
  7. Chu, L.; Zhang, X.R.; Wang, T.W.; Zhao, X. Spatial-temporal evolution and prediction of urban landscape pattern and habitat quality based on CA-Markov and InVEST model. Ying Yong Sheng Tai Xue Bao J. Appl. Ecol. 2018, 29, 4106–4118. [Google Scholar]
  8. He, B.; Chang, J.; Guo, A.; Wang, Y.; Wang, Y.; Li, Z. Assessment of river basin habitat quality and its relationship with disturbance factors: A case study of the Tarim River Basin in Northwest China. J. Arid. Land 2022, 14, 167–185. [Google Scholar] [CrossRef]
  9. Salata, S.; Ozkavaf-Senalp, S.; Velibeyoglu, K. Integrating Ecosystem Vulnerability in the Environmental Regulation Plan of Izmir (Turkey)—What Are the Limits and Potentialities? Urban Sci. 2022, 6, 19. [Google Scholar] [CrossRef]
  10. Liu, S.; Liao, Q.; Xiao, M.; Zhao, D.; Huang, C. Spatial and Temporal Variations of Habitat Quality and Its Response of Landscape Dynamic in the Three Gorges Reservoir Area, China. Int. J. Environ. Res. Public Health 2022, 19, 3594. [Google Scholar] [CrossRef]
  11. Zhang, X.; Lyu, C.; Fan, X.; Bi, R.; Xia, L.; Xu, C.; Sun, B.; Li, T.; Jiang, C. Spatiotemporal Variation and Influence Factors of Habitat Quality in Loess Hilly and Gully Area of Yellow River Basin: A Case Study of Liulin County, China. Land 2022, 11, 127. [Google Scholar] [CrossRef]
  12. Huo, J.; Shi, Z.; Zhu, W.; Xue, H.; Chen, X. A Multi-Scenario Simulation and Optimization of Land Use with a Markov-FLUS Coupling Model: A Case Study in Xiong’an New Area, China. Sustainability 2022, 14, 2425. [Google Scholar] [CrossRef]
  13. Artikanur, S.D.; Widiatmaka, W.; Setiawan, Y.; Marimin, M. Predicting Sugar Balance as the Impact of Land-Use/Land-Cover Change Dynamics in a Sugarcane Producing Regency in East Java, Indonesia. Front. Environ. Sci. 2022, 10, 76. [Google Scholar] [CrossRef]
  14. Liang, X.; Guan, Q.; Clarke, K.C.; Liu, S.; Wang, B.; Yao, Y. Understanding the drivers of sustainable land expansion using a patch-generating land use simulation (PLUS) model: A case study in Wuhan, China. Comput. Environ. Urban Syst. 2021, 85, 101569. [Google Scholar] [CrossRef]
  15. Wang, J.; Zhang, J.; Xiong, N.; Liang, B.; Wang, Z.; Cressey, E.L. Spatial and Temporal Variation, Simulation and Prediction of Land Use in Ecological Conservation Area of Western Beijing. Remote Sens. 2022, 14, 1452. [Google Scholar] [CrossRef]
  16. Zhang, S.; Zhong, Q.; Cheng, D.; Xu, C.; Chang, Y.; Lin, Y.; Li, B. Landscape ecological risk projection based on the PLUS model under the localized shared socioeconomic pathways in the Fujian Delta region. Ecol. Indic. 2022, 136, 108642. [Google Scholar] [CrossRef]
  17. Zhang, X.R.; Zhou, J.; Li, G.N.; Chen, C.; Li, M.M. Spatial pattern reconstruction of regional habitat quality based on the simulation of land use changes from 1975 to 2010. J. Geogr. Sci. 2020, 30, 90–109. [Google Scholar] [CrossRef]
  18. Raimundo Lopes, N.D.; Li, T.; Qian, D.; Matomela, N.; Sá, R.M. Factors influencing coastal land cover change and corresponding impact on habitat quality in the North-western Coastline of Guinea-Bissau (NC-GB). Ocean. Coast. Manag. 2022, 224, 106181. [Google Scholar] [CrossRef]
  19. Li, S.; Dong, B.; Gao, X.; Xu, H.; Ren, C.; Liu, Y.; Peng, L. Study on spatio-temporal evolution of habitat quality based on land-use change in Chongming Dongtan, China. Environ. Earth Sci. 2022, 81, 220. [Google Scholar] [CrossRef]
  20. Zhang, D.C.; Liu, X.P.; Yao, Y.; Zhang, J.B. Simulating Spatiotemporal Change of Multiple Land Use Types in Dongguan by Using Random Forest Based on Cellular Automata. Geogr. Geo-Inf. Sci. 2016, 32, 29–36. [Google Scholar]
  21. Luo, Z.; Zeng, J. Spatial growth simulation of land use in Tianjin from the perspective of resource and environmental protection. Geogr. Res. 2022, 41, 341–357. [Google Scholar]
  22. Hu, F.; Zhang, Y.; Guo, Y.; Zhang, P.P.; Lv, S.; Zhang, C.C. Spatial and temporal changes in land use and habitat quality in the Weihe River Basin based on the PLUS and InVEST models and predictions. Arid. Land Geogr. 2021, B08039, 1–15. [Google Scholar]
  23. Wang, Z.; Wang, Y.; Zhang, J.; Sun, D.; Zhou, Z. Response of land use change and ecosystem services based on different functional scenarios: Case study of Nanjing. bioRxiv 2020. [CrossRef]
  24. Li, Z.; Cheng, X.; Han, H. Analyzing Land-Use Change Scenarios for Ecosystem Services and their Trade-Offs in the Ecological Conservation Area in Beijing, China. Int. J. Environ. Res. Public Health 2020, 17, 8632. [Google Scholar] [CrossRef]
  25. Wang, X.; Bo-Wen, M.A.; Dan, L.I.; Chen, K.L.; Yao, H.S. Multi-scenario simulation and prediction of ecological space in Hubei province based on FLUS model. J. Nat. Resour. 2020, 35, 230–242. [Google Scholar]
  26. Li, Y.; Duo, L.; Zhang, M.; Wu, Z.; Guan, Y. Assessment and Estimation of the Spatial and Temporal Evolution of Landscape Patterns and Their Impact on Habitat Quality in Nanchang, China. Land 2021, 10, 1073. [Google Scholar] [CrossRef]
  27. Sharp, R.; Chaplin-Kramer, R.; Wood, S.; Guerry, A.; Douglass, J. InVEST User’s Guide; Stanford University: Stanford, CA, USA, 2018. [Google Scholar]
  28. Chen, Y.; Qiao, F.; Jiang, L. Effects of Land Use Pattern Change on Regional Scale Habitat Quality Based on InVEST Model—A Case Study in Beijing. Acta Sci. Nat. Univ. Pekin. 2016, 52, 553–562. [Google Scholar]
  29. Chu, M.; Lu, J.; Sun, D. Influence of Urban Agglomeration Expansion on Fragmentation of Green Space: A Case Study of Beijing-Tianjin-Hebei Urban Agglomeration. Land 2022, 11, 275. [Google Scholar] [CrossRef]
  30. Wang, H.; Tang, L.; Qiu, Q.; Chen, H. Assessing the Impacts of Urban Expansion on Habitat Quality by Combining the Concepts of Land Use, Landscape, and Habitat in Two Urban Agglomerations in China. Sustainability 2020, 12, 4346. [Google Scholar] [CrossRef]
  31. Wang Shihao; Huang Lin; Xu Xinliang; Xu Shuwan, Spatial and temporal evolution of habitat quality in Guangdong-Hong Kong-Macao Greater Bay Area based on InVEST model. Acta Ecol. Sin. 2020, 40, 8403–8416.
  32. Wu, J.S.; Cao, Q.W.; Shi, S.Q.; Huang, X.L.; Lu, Z.Q. Spatio-temporal variability of habitat quality in Beijing-Tianjin-Hebei Area based on land use change. Chin. J. Appl. Ecol. 2015, 26, 3457–3466. [Google Scholar]
  33. Li, A.L.; Zhou, Y.; Tang, L.Y.; Niu, L.D.; Pan, M. Urban expansion led to the degradation of habitat quality in the Beijing-Tianjin-Hebei Area. Chin. J. Agric. Resour. Reg. Plan. 2018, 12, 4516–4525. [Google Scholar]
  34. Xu, M.; Wang, Y.; Zou, C.; Liu, D. NPP-Based Evaluation of Ecological Assets in China’s Ecological Conservation Redline Area. In Proceedings of the IEEE International Geoscience and Remote Sensing Symposium (IGARSS), Yokohama, Japan, 28 July–2 August 2019; pp. 4399–4402. [Google Scholar]
  35. Song, S.; Liu, Z.; He, C.; Lu, W. Evaluating the effects of urban expansion on natural habitat quality by coupling localized shared socioeconomic pathways and the land use scenario dynamics-urban model. Ecol. Indic. 2020, 112, 106071. [Google Scholar] [CrossRef]
  36. Ouyang, X.; Xu, J.; Li, J.; Wei, X.; Li, Y. Land space optimization of urban-agriculture-ecological functions in the Changsha-Zhuzhou-Xiangtan Urban Agglomeration, China. Land Use Policy 2022, 117, 106112. [Google Scholar] [CrossRef]
  37. Chen, X.; Yu, L.; Du, Z.; Xu, Y.; Zhao, J.; Zhao, H.; Zhang, G.; Peng, D.; Gong, P. Distribution of ecological restoration projects associated with land use and land cover change in China and their ecological impacts. Sci. Total Environ. 2022, 825, 153938. [Google Scholar] [CrossRef]
  38. Guo, S.; Wang, Y.; Wang, Y.; Wang, M.; He, P.; Feng, L. Inequality and collaboration in north China urban agglomeration: Evidence from embodied cultivated land in Jing-Jin-Ji’s interregional trade. J. Environ. Manag. 2020, 275, 111050. [Google Scholar] [CrossRef]
  39. Zhang, C.; Wang, P.; Xiong, P.; Li, C.; Quan, B. Spatial Pattern Simulation of Land Use Based on FLUS Model under Ecological Protection: A Case Study of Hengyang City. Sustainability 2021, 13, 10458. [Google Scholar] [CrossRef]
  40. Qian, Y.; Dong, Z.; Yan, Y.; Tang, L. Ecological risk assessment models for simulating impacts of land use and landscape pattern on ecosystem services. Sci. Total Environ. 2022, 833, 155218. [Google Scholar] [CrossRef] [PubMed]
Figure 1. Diagram of the study area (Projected Coordinate System: Map of China: GAUSS KRUGER CGCS2000_3_Degree_GK_Zone_39; map of Tianjin: GAUSS KRUGER CGCS2000_3_Degree_GK_Zone_39).
Sustainability 14 06923 g001
Figure 2. The research framework.
Sustainability 14 06923 g002
Figure 3. Spatial land use patterns in 2000, 2010, and 2020.
Sustainability 14 06923 g003
Figure 4. Sanger diagram of land class.
Sustainability 14 06923 g004
Figure 5. Sanger diagram for land class transfer for 2000–2010. Transfer 2010–2020.
Sustainability 14 06923 g005
Figure 6. 2000–2030 Land Use Area Statistics.
Sustainability 14 06923 g006
Figure 7. 2030 spatial land use pattern.
Sustainability 14 06923 g007
Figure 8. The Habitat Degradation Index(HDI).
Sustainability 14 06923 g008
Figure 9. Percentage of area in each class of habitat quality and the mean.
Sustainability 14 06923 g009
Figure 10. Spatial distribution of habitat quality for 2000–2020.
Sustainability 14 06923 g010
Figure 11. Spatial distribution of the habitat quality level under different scenarios.
Sustainability 14 06923 g011
Figure 12. Spatial distribution of habitat quality changes.
Sustainability 14 06923 g012
Table 1. Table of driving factors.
FactorDriving Factors
Natural factorsElevationGDC 1
SlopeCalculated using ArcGIS10.8
Slope directionCalculated using ArcGIS10.8
PrecipitationRAESADC 2, calculated by interpolation
TemperatureRAESADC, calculated by interpolation
Social factorsPopulation densityWorldpop 3
Distance to medical facility sitesORM 4, calculated using ArcGIS10.8
Distance to scientific and educational centersORM, calculated using ArcGIS10.8
Distance to city centerORM, calculated using ArcGIS10.8
GDP2020 Government work, calculated using ArcGIS10.8
Transportation factorsDistance to railwaysORM, calculated using ArcGIS10.8
Distance to motorwaysORM, calculated using ArcGIS10.8
Distance to national highwaysORM, calculated using ArcGIS10.8
Distance to provincial roadsORM, calculated using ArcGIS10.8
Distance to waterwaysORM, calculated using ArcGIS10.8
1 GDC represent Geospatial Data Cloud (http://www.gscloud.cn/ accessed on 1 March 2022). 2 RAESADC, Resource and Environment Science and Data Center (https://www.resdc.cn/ accessed on 1 March 2022). 3 Worldpop (https://www.worldpop.org accessed on 1 March 2022). 4 ORM represent Open Road Map database (http://www.openstreetmap.org accessed on 1 March 2022).
Table 2. Neighborhood factor weight.
Land Use TypeFarm LandWoodlandGrasslandWetlandWaterConstruction LandUnutilized LandSea Area
Neighborhood weighting factor0.60.50.40.40.410.80.1
Table 3. Maximum distances, weights, and spatial distribution types of threat factor sensitivities.
Threat FactorMaximum Impact Distance/kmWeightingDistance Decay Function
Construction land101Index
Farmland50.4Index
Unutilized70.5Linear
Table 4. Threat factor sensitivities.
Landscape
Types
Habitat SuitabilityConstruction LandUnutilizedFarmland
Farmland0.30.60.30.4
Woodland10.50.80.5
Grassland0.80.40.40.8
Wetland0.30.70.40.5
Water0.70.30.30.2
Construction land000.20
Unutilized land00.600
Sea area0.70.30.10.2
Table 5. Land use area changes and land dynamics in 2000, 2010, and 2020.
Landscape Types2000 (km2)2000–2010 Dynamic Degree of Land Use (%)2010 (km2)2010–2020 Dynamic Degree of Land Use (%)2020 (km2)2000–2020 Total Change Rate (%)Total Change Area
Farmland7982.43−0.707423.90−0.267228.82−9.44−753.61
Woodland204.481.09226.76−0.48215.905.5811.42
Grassland266.46−1.72220.631.66257.16−3.49−9.30
Wetland320.652.79410.210.37425.3932.66104.74
Water1408.220.131426.95−2.671046.45−25.69−361.77
Construction land1364.144.892031.033.162673.4995.981309.35
Unutilized land1.111.241.2514.303.03172.971.92
Sea area376.56−5.19181.03−6.0671.34−81.05−305.22
Publisher’s Note: MDPI stays neutral with regard to jurisdictional claims in published maps and institutional affiliations.

