Article

An Integrated Gray DEMATEL and ANP Method for Evaluating the Green Mining Performance of Underground Gold Mines

School of Resources and Safety Engineering, Central South University, Changsha 410083, China
*
Author to whom correspondence should be addressed.
Sustainability 2022, 14(11), 6812; https://doi.org/10.3390/su14116812
Submission received: 1 May 2022 / Revised: 21 May 2022 / Accepted: 31 May 2022 / Published: 2 June 2022
(This article belongs to the Topic Green Mining)

Abstract

:
Green mining (GM) can achieve the harmonious development of mineral resource exploitation and environmental protection. Performance evaluation is the key to promoting GM. This research explores favorable methods to evaluate the green mining performance (GMP) of underground gold mines. First, according to the specific characteristics of underground gold mines, an evaluation criteria system for GM is formulated. Meanwhile, the weights are calculated using an integrated gray DEMATEL and ANP technique, which considers the correlation between indicators. Subsequently, the solution methodology for performance evaluation is proposed based on normalization of indicators. Finally, six underground gold mines are utilized as case studies to verify the methodological feasibility. The results of the empirical study show that there is a significant gap between ordinary mines and pilot green mines, and this study, via comparison analysis and cause–effect analysis, gives direction for mines improvement. Not only will the work provide technical and theoretical support for the evaluation and construction of similar green mines, it will also serve as a reference for government policy implementation.

1. Introduction

The mining industry provides raw materials for socio-economic development, while unregulated mining operations may also cause serious ecological problems [1]. China, as a major mining country, faces an even tougher situation [2]. To solve the environmental problems and achieve sustainable development, China has proposed a green mining (GM) policy [2,3,4], with financial and tax incentives. Furthermore, many mines have joined the ranks of GM construction. Now comes the question of which mine is performing better. The government has to implement policy according to green mining performance (GMP), and mine enterprises have to improve by comparison. GMP evaluation of mines using appropriate and scientific approaches becomes particularly important [5,6], playing a critical role in promoting GM [6,7].
Considering the diversity of GM evaluation criteria, this would be a complicated matter of multicriteria decision-making (MCDM). Scholars have conducted studies on specific mines using different methods. Zhou et al. [1] adopted a fuzzy comprehensive evaluation method to assess the green surface mine in China. Chen et al. [5] put forward a Driver–Pressure–State–Impact–Response framework to formulate the GM evaluation indicator, and the PCA method was used to evaluate the interactions between human and environmental systems. Jiskani et al. [8] analyzed the Green and climate-smart mining of open-pit mines, fuzzy AHP was applied to determine weights, and the Grey clustering method was used to classify the result into concrete levels. Liang et al. respectively assessed the GMP through the Hesitant Fuzzy ORESTE–QUALIFLEX method [6] and MCDM combined with a picture fuzzy information approach [9]. Qi et al. [10] proposed an evaluation system of GM construction, and determined the critical factor of GM by the two-step fuzzy DEMATEL model. Based on uncertainty measurement theory, Wang et al. [11] evaluated GM grades with six coupled methods, and finally selected the optimal method by credible degree recognition.
Although the above research addressed similar GMP evaluation tasks, the criteria system and MCDM methods are quite different. This is because the mineral species and mining method have to be considered while developing the evaluation criteria, and MCDM methods are selected based on the collected indicator data. Thus, it would be significant to develop specific appropriate and efficient evaluation methods [9,12]. For this purpose, in order to formulate an applicable GMP evaluation system to underground gold mines, the characteristics of mines have to be fully considered [13], and the principles of GM [14,15,16,17] are required for referencing.
The study area is located in Jiaodong Peninsula, one of the most important gold origins for China [18]. Firstly, the geological conditions in the region are exceedingly complicated, with fault structures and fractured zones [19] dispersed across the mining sites, posing safety risks, and the risk for accidents to occur is greater due to underground space limitations. Accordingly, safety production (SP) holds great meaning for GM, with this criterion being the basic condition for evaluating GMP [1,11]. Secondly, waste rock stockpiles and unregulated discharge of tailings [20] can cause environmental damage. However, the utilization rates of solid waste are quite low in local underground gold mines. To some extent, these solid wastes can be used in alternative ways. For example, tailings can be used for underground filling, and the waste rock crushed into stone as building materials. Thus, the comprehensive utilization (CU) of mining solid wastes should be considered as the evaluation criterion for GMP [7,21]. Thirdly, gold ore mined by drilling and blasting, emits dust and blasting fumes [22]. In addition, hydrogenated tailings can contaminate water bodies and soil without proper disposal [23,24,25]. Green emphasizes environmental protection (EP), which is also an essential criterion for GMP. Finally, the original intention of GM is to obtainn resources in an eco-friendly and efficient manner, with mining efficiency (ME) [26] representing the key component. In summary, SF-CU-EP-ME should be considered comprehensively to formulate a GMP evaluation criteria system for underground gold mines.
For the sake of relative fairness, indicators should be accurately calculable to eliminate subjective judgments. In terms of weight, the determination is a multilevel, complex, and comprehensive procedure, thus correlation and constraints between the indicators [1] should be considered. However, previous GMP evaluation research works have not employed indicator correlations to calculate weights. Therefore, it is necessary to devise a method for determining weights based on the relationship between indicators. For this goal, integrated DEMATEL-ANP [27,28] is extremely capable of solving this issue; DEMATEL is used to determine the factors influencing interaction, with ANP used to obtain the relative weight. However, crisp values occur in this method, which is inappropriate and imprecise for describing the information [9,29,30]. To conquer this limitation, the gray theory was exploited to transform crisp values into interval gray numbers, which improves the reality of decision-making data. Consequently, gray DEMATEL is adopted to examine the causal relationship in an uncertain environment, and then the ANP method to calculate the relative weight based on the influential relationship acquired from gray DEMATEL [31,32]. Finally, metrics need to be converted into scores. However, traditional grading methods, will yield no distinction between the same levels. A linear transformation approach would be a reasonable option.
In summary, an evaluation system is established to evaluate GMP for underground gold mines. In this respect, an evaluation criteria system is formulated in consideration of the characteristics and principles of GM, while an integrated gray DEMATEL and ANP method are devised to determine the relative weights, and a linear transformation strategy is used to convert index values to corresponding scores. Compared to other methods, the criteria system constructed in this work is more target-oriented. In addition, the indicators can be calculated accurately to avoid human error, and the weighting and converting procedures of indicators are relatively fair. With regard to the above advantages, this study is rendered both feasible and reasonable.
The structure of this paper is designed as follows. Section 2 introduces the methodology in detail, including the technical route, indicators, and method. Section 3 provides a case study using the collected decision-making data from experts and indicator values from underground gold mines, with the results computed. Section 4 makes cause–effect and comparative analysis based on the results, and some managerial implications are also involved. Section 5 summarizes the paper and presents suggestions.

2. Methodology

In this section, the clear GMP evaluation system for underground gold mines is established, as well as the calculation method of each indicator. Procedures of the adopted integrated methods are described in detail. The entire flowchart is indicated in Figure 1.

2.1. Evaluation Criteria

The GMP evaluation criteria for underground gold mines are first identified. Selecting suitable indicators is essential for the performance evaluation of green mines [6]. To find suitable indicators for the criteria layer, some principles must be followed. Data with easy accessibility principle is a prerequisite. The calculable principle ensures data accuracy and relative fairness, and the independence principle guarantees sensible structure. Within the SF-CU-EP-ME framework defined earlier, indicator layers also need to be determined, considering the specific characteristics of underground gold mines and referencing literature [1,5,6,9,11] related to GMP, the indicators under each criterion level were determined gradually. The evaluation system includes four criteria and twenty indicators. For clarity, the framework is shown in Figure 2. The calculation method of each indicator is shown in Table A1, and the following are thorough explanations of these criteria.

2.1.1. Safety Production

Safety production is a policy that must be followed by mining enterprises, requiring the minimization of work-related injuries among workers. Consequently, three indications of work-related injuries [1,11] are identified, containing the annual number of serious injuries SF1, annual number of slight injuries SF2 and deaths per million working hours SF3, these indicators meet smaller-is-better. Safety training [33,34] and management are critical for improving the safety situation in underground mining. Workers’ emergency reaction capabilities may be improved by safety training, which can successfully prevent and reduce the occurrence of safety accidents. Safety management [1,34] is primarily concerned with the organization and implementation of enterprise safety management planning, guidance, inspection, and decision making. It is also the critical link in ensuring that production is conducted in the best possible safety conditions. As a result, the full staff safety training rate SF4 and the proportion of safety management staff SF5 were determined, with higher is better.

2.1.2. Comprehensive Utilization

Comprehensive utilization of resources includes two aspects. One is to improve the utilization rate of the resources themselves, and the other is to realize the comprehensive utilization of solid waste. In the case of underground gold mines, the resources are mainly gold metal or other associated resources. From this aspect, improving the mining recovery rate (CU1) [7], mineral processing recovery rate (CU2) [5] and the utilization rate of associated resources (CU3) [6,14] are conducive to the CU of resources. The solid waste includes waste rock from mining and tailings from processing, which will occupy industrial land and pollute the environment without depositing. Actually, the waste produced in gold mines is also a valuable resource, which is worth developing and utilizing [13,14]. Through comprehensive utilization, the waste can be turned into treasure, which not only can solve the problem of solid waste pollution, but can also create economic benefits. Therefore, comprehensive utilization rate of tailings (CU4) [7,8] and waste rock (CU5) [8] are determined.

2.1.3. Environmental Protection

On the one hand, the mining landscape is very important. However, waste rock piles and tailing ponds occupy land, which destroys the natural landscape, and causes environmental pollution. Land reclamation is the activity of restoring damaged land to a usable state, the strength can be demonstrated by land reclamation rate EP1 [1,5,11,14]. The main focus of mine greening is to restore vegetation by greening and planting barren areas to increase the vegetation coverage rate of mining area (EP2) [5,6,11,14] and fulfill the goal of optimizing the landscape. On the other hand, pollution emission [3,7] control is extremely important for environmental protection, including three wastes [6] and noise [8]. Pollution emissions need to meet national standards, thus two indicators (EP3, EP4) related to compliance rate are used to describe the process. Finally, the environmental investment ratio (EP5) [5,26], is one of the main indicators to measure the harmonious relationship between environmental protection and economic development, which can improve the quality of the environment and prevent ecological degradation. All these indicators present with higher being better.

2.1.4. Mining Efficiency

Ore dilution refers to the reduction of ore grade due to the mixing of waste rock during the mining process. Ore losses describe the phenomenon of ore being discarded or not fully extracted during mine production due to various reasons (such as complex geological conditions, improper mining methods and transportation problems, etc.). Ore dilution and losses severely affect mining efficiency [26], with the ore dilution rate (ME1) [14] and mining losses rate (ME2) [14] being used to quantify this process. Per capita work efficiency (ME3) [11] is used for measuring the labor efficiency of mining enterprises, with higher values for the mechanization degree and mining efficiency being better. Mining intensity in underground mines refers to the annual amount of ore produced per square meter of mining area. Mining intensity [35] is high if there is good continuity and a high rate of progress of mining preparation, and more blocks are being retrieved at the same time; conversely, mining intensity is poor when continuity, mining area, and rate of block retrieval are low. Mining intensity is a comprehensive indicator reflecting the mining efficiency, denoted by ME4. During the mining process, it is highly efficient to achieve the same production goal with less energy. Hence, ME5 is exploited to reflect the energy consumption [5,7,14] level of mining.

2.2. Integrated Gray DEMATEL and ANP

DEMATEL is a system science technique proposed by American scholars A.Gabus and E.Fontela [36] in 1972. It is applicable for analyzing the interdependent relationships among factors in a complex system and ranking them for long-term strategic decision making [37]. The Gray DEMATEL technique is upgraded from the typical DEMATEL approach, the general steps are gray number normalization and clarification, and the remaining steps are consistent with the typical DEMATEL technique.
To obtain the initial decision data, decision-makers are asked to specify the influence degree of one indicator on another indicator, utilizing five different integer scales [36], as shown in Table 1. Next, according to Table 1, crisp values are converted into interval gray numbers, which contain the upper and lower bounds. The Gray DEMATEL method consists of the following steps.
Step 1: Normalization of the upper and lower bounds.
̲ x ˜ i j k = ̲ x i j k min ̲ x i j k / min max ¯ x ˜ i j k = ¯ x i j k min ¯ x i j k / min max min max = max ¯ x i j k min ̲ x i j k
where ̲ x ˜ i j k is the lower bound of the expert’s raw score after transforming it into the interval gray number. Correspondingly, ¯ x ˜ i j k is the normalized upper bound.
Step 2: Converting fuzzy data into crisp Scores.
Y i j k = ̲ x ˜ i j k 1 ̲ x ˜ i j k + ̲ x ˜ i j k × ̲ x ˜ i j k 1 ̲ x ˜ i j k + ¯ x ˜ i j k Z i j k = ̲ x ˜ i j k + Y i j k min max
Y i j k is the calculated preliminary crisp value, and Z i j k is ultimate crisp value.
Step 3: Generating the direct influence matrix combining experts’ weights.
Z i j = w 1 Z i j 1 + w 2 Z i j 2 + + w k Z i j k
where w i is the attribute weight of expert i, and the sum of w 1 , w 2 , , w k is one.
As a result, make the diagonal elements as zero, the group direct influence matrix is Z.
Z = 0 z 12 z 1 n z 21 0 z 2 n 0 z n 1 z n 2 z n n = z i j n × n
Step 4: Normalizing the initial influence matrix.
X = Z max j = 1 n x i j , 1 i n
Step 5: Constructing the total influence matrix T.
T = X + X 2 + X 3 + + X h = X 1 X 1
Step 6: Producing the influential relation map.
M i = D i + C i = j = 1 n t i j + i = 1 n t i j R i = D i C i = j = 1 n t i j i = 1 n t i j
Let D i denote the sum of rows, which indicates the degree of influence, while C i represents the sum of columns, which shows the degree of being influenced. M i denotes centrality and prominence in the system, whereas R i denotes the causality of indicators, and reflects the relationship in the system.
At last, the total influence matrix is regarded as the unweighted supermatrix of ANP [38]. After normalization, we can obtain the weighted supermatrix, while it self-multiplies, has converged and become a stable supermatrix [39]. This new matrix is called a limited supermatrix, and the relative weights of each criterion can be obtained from this matrix.

2.3. Performance Evaluation

There are large gaps in the collected evaluation data, and normalization of the data is necessary, which facilitates scientific calculations and accuracy.
For “smaller-is-better” indicators, the normalized value x i ( k ) can be calculated as:
x i k = min x i x i k , f o r 1 i n , 1 k m .
For “larger-is-better” indicators, the normalized value x i ( k ) can be calculated as:
x i k = x i k max x i , f o r 1 i n , 1 k m .
where max ( x i ) and min ( x i ) represent the maximum and minimum values.
S c o r e s = i = 1 n w i x i k , i = 1 , , n ; k = 1 , , m .
Finally, a simple additive weighting method [40] is used to rank the performance, which reflects the advantages of indicators while maintaining simplicity of calculation [41]. The weight of each indicator can be calculated by the GDANP method, the normalized evaluation data multiplied by weights obtain the score of each indicator, and summing up the scores gives the evaluation results, as shown in Equation (10).

3. Case Study

3.1. Case Description

Shandong Gold Mining Co., Ltd is the largest gold producer in China, and it is devoted to GM for environmental protection and sustainable development. This corporation has so far established a series of national pilot green mines, with the remainder of the numerous mines still under construction. Discovering the gaps between the pilot sites and the rest of the mines becomes crucial, facilitating reference and experience learning. For this purpose, six underground gold mines were selected. Three of them are pilot green mines (denoted as M1, M2, M3), the rest are under construction (denoted as M4, M5, M6).
M1 has taken the initiative to collaborate with nationally renowned scientific research institutes, picking appropriate mining methods based on rock classification, and optimizing mining parameters. To accomplish safe and effective mining, the upward approach filling mining technique, wide approach filling mining method, and automated pan area mining method are employed thoroughly. Mining loss and depletion rates have been significantly lowered. M2 focuses on the comprehensive utilization of resources, which applies the medium-deep hole pre-controlled top section filling mining method to improve the ore recovery rate. At the same time, the beneficiation process has been modified to improve the recovery rate of gold. M3 is dedicated to the reuse of solid waste. Parts of the tailings and waste rocks are used to solidify and fill the quarry area, while the remainder is utilized to manufacture concrete bricks, resulting in greater economic advantages and the transformation of trash into treasure. Each mine bears its own unique characteristics, and by adjusting to local conditions, each mine has achieved significant achievements in the GM process. Therefore, it is essential to pick these three pilot mines as a study reference.

3.2. Data Collection

Data collection is divided into two parts: expert decision data and evaluation data of underground mines. Expert decision data were acquired from the questionnaires. Three conditions must be met for the selection of experts: first, the experts must be independent of the mines involved in the evaluation; second, they must have extensive work experience in underground gold mining; and third, they must be familiar with or have participated in the evaluation of green mining. After screening, six experts were confirmed, and the statistic information and gray weights of the selected experts are illustrated in Table 2.
The questionnaire was completed by all six of the selected experts, who carefully answered pertinent topics. The initial decision matrix can be derived from the surveys, and all of the data are valid. The expert decision matrix was calculated by using the GDANP method, the total influence matrix Table A2, the weighted supermatrix in Table A3 and the limited supermatrix Table A4 can be obtained, respectively.
The evaluation data of underground gold mines are obtained through onsite investigation, assisted by the relevant mine production manager. The collected original evaluation data are shown in Table A5. For these “smaller-is-better” indicators (SP1, SP2, SP3, ME1, ME2, ME5), which can be normalized through Equation (8), indicators with a minimum value of zero need to be handled by the overall moving method, and the rest are “larger-is-better” indicators, which can be normalized by Equation (9). The normalized evaluation data are shown in Table A6.

3.3. Results

In this study, the formulated evaluation index comprises three hierarchical layers: the target layer, the criterion layer, and the indicator layer. Based on corresponding principles, the evaluation system for underground mines including four criteria and twenty indicators are determined.
Considering the correlation of indicators, an integrated evaluation method based on GDANP is used to calculate the weight of indicators, from the limited supermatrix, the weight of each indicator can be calculated, as shown in Table 3. Finally, the ranking order of the criteria is CU≻ME≻EP≻SP, CU becomes the most important criterion for GM.
The score of each underground gold mine can be calculated according to Equation (10), and the results are shown in Table A7. For clarity, Figure 3 depicts the results. There is a clear gap between the mines under construction and the pilot green mines, and this also demonstrates the validity of the method proposed in this study, which can efficiently discriminate between two types of mines. Finally, the rankings for these mines are as follows: M3≻M1≻M2≻M5≻M4≻M6.

4. Discussions

4.1. Cause–Effect Analysis

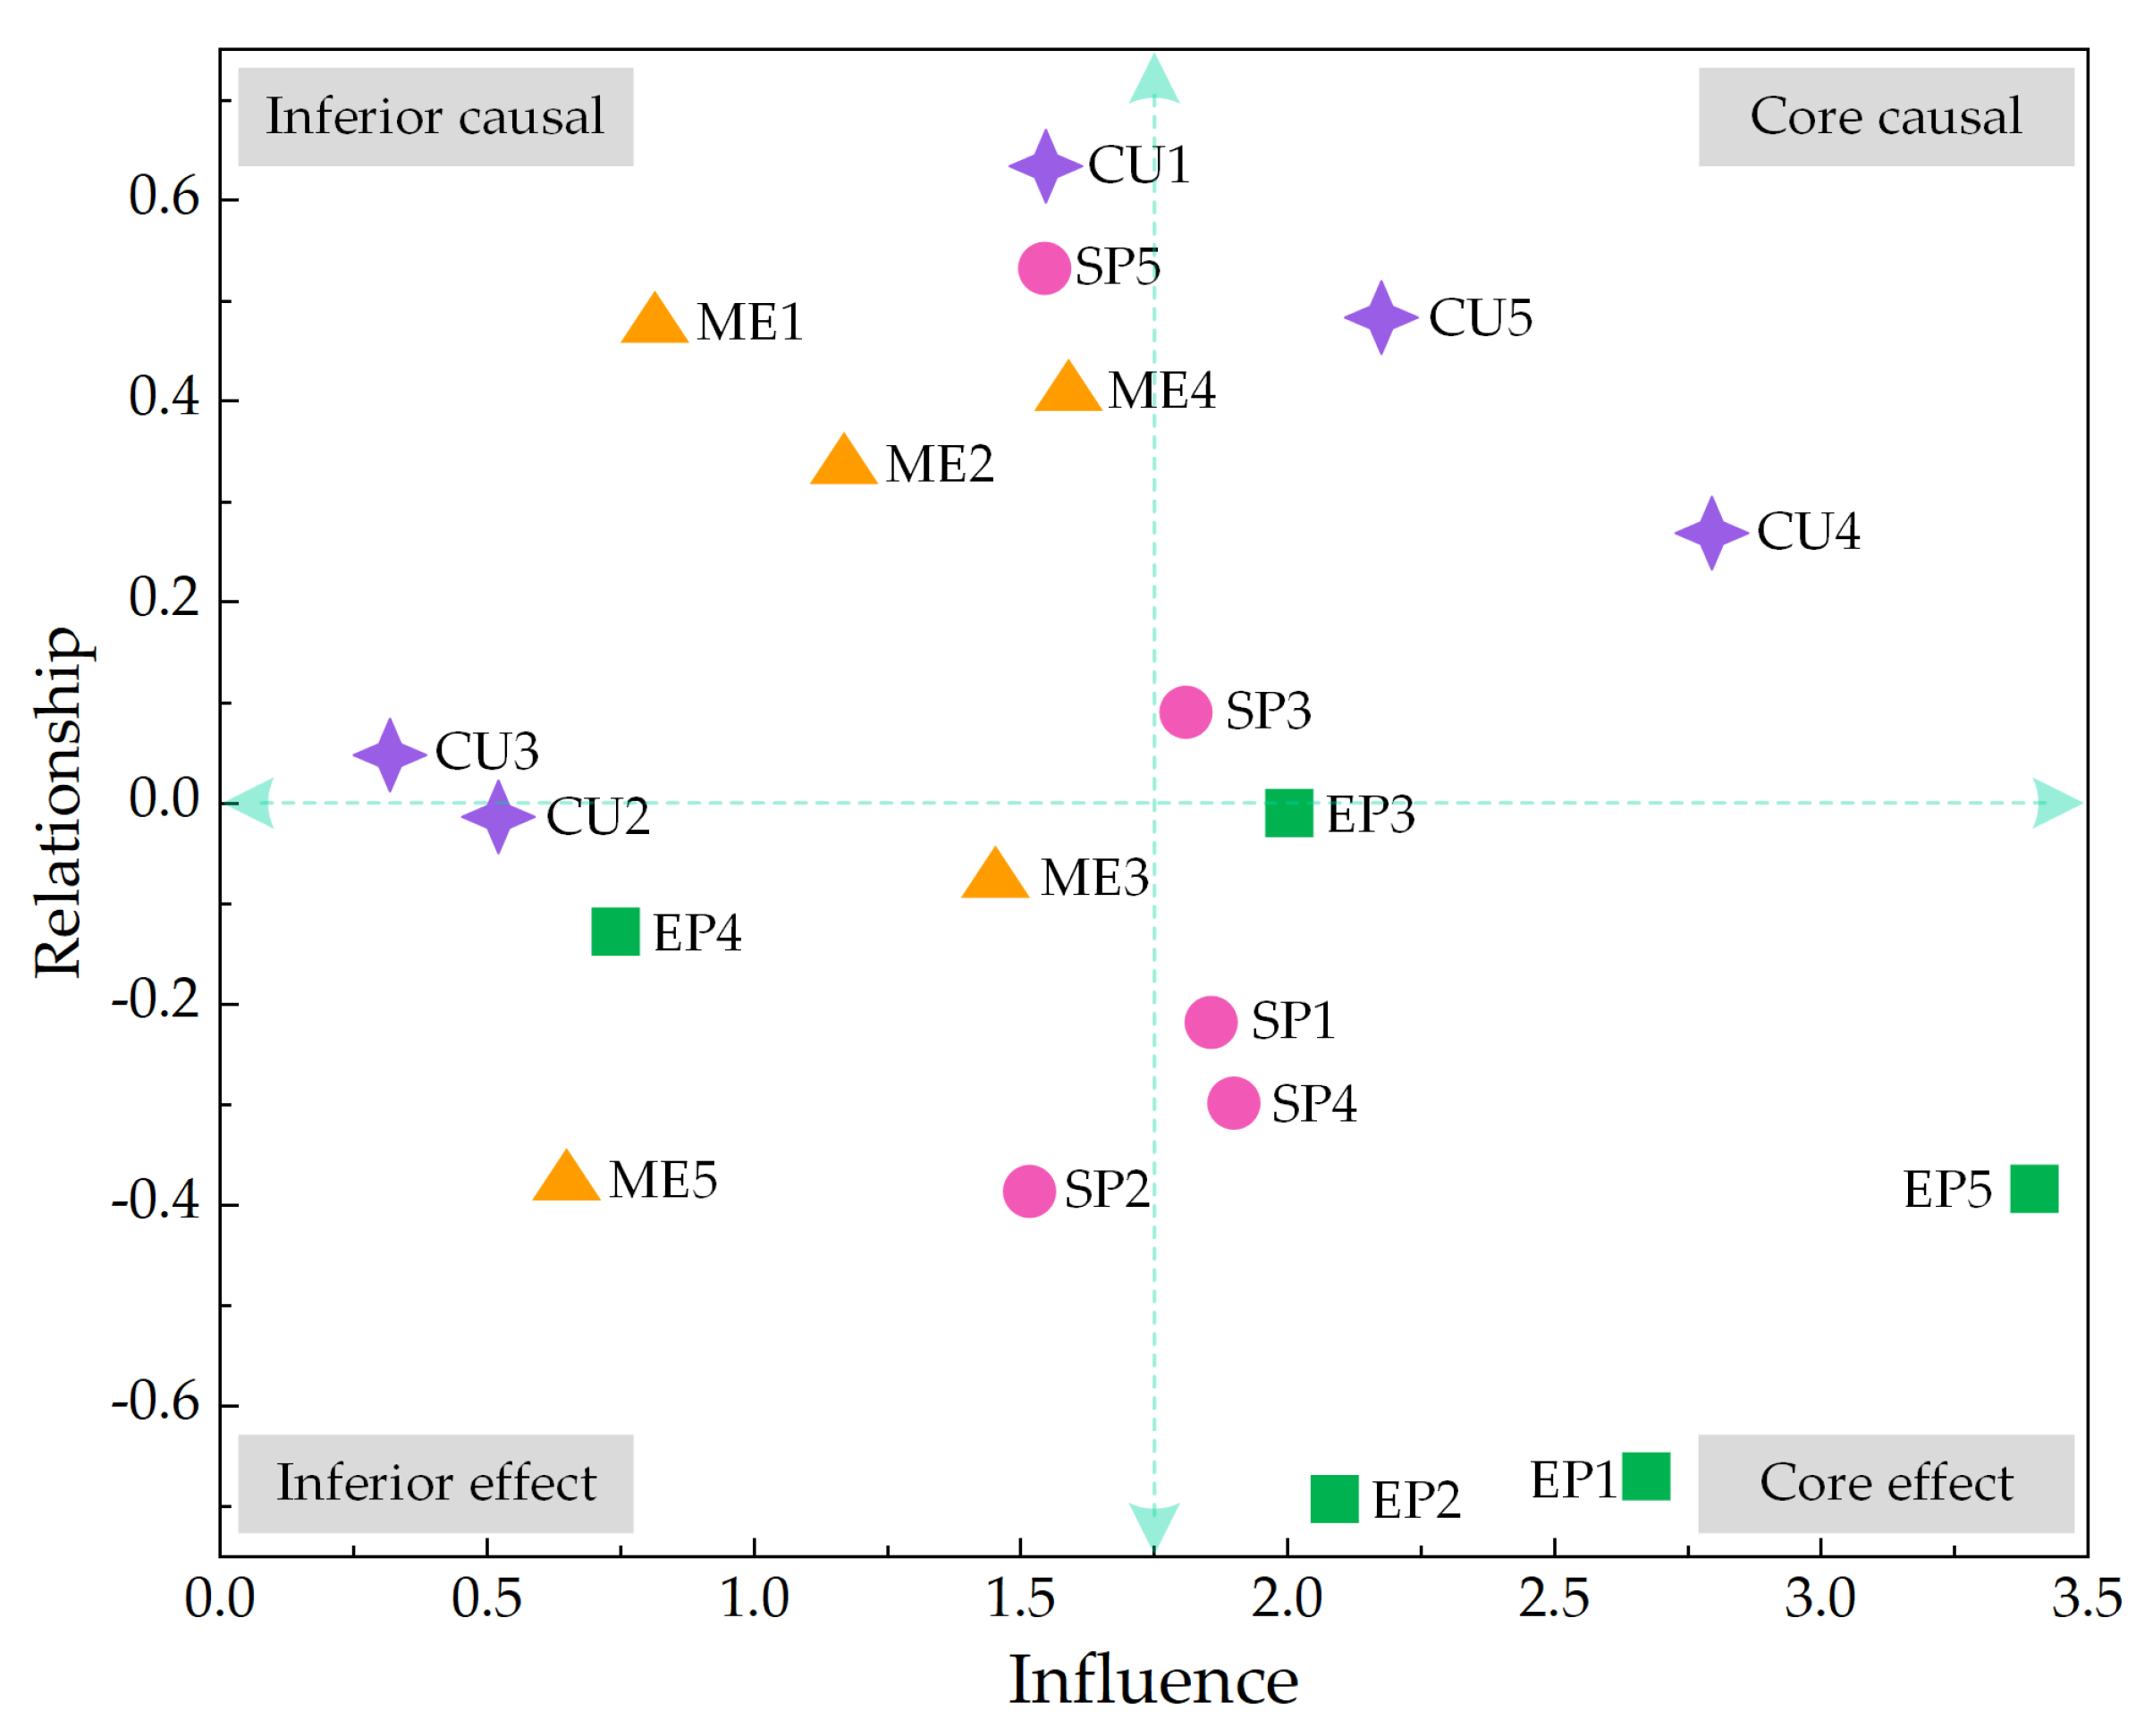
The influence index and relationship index are the core factors of DEMATEL analysis [10]. The former indicates the factor’s ability to influence the system. The larger the value, the higher the degree of influence. The latter has positive and negative values, belonging to the cause group and effect group, respectively. This is because the relationship index is calculated by ( D i C i ), positive values indicate the influence degree exceeds the influenced degree, and negative values are dominated by the influenced degree. Theoretically, the cause group affects the factors in the effect group, thus they are the system-identified issues that demand priority improvement. The results are shown in Table 4.
A cause–effect diagram is a tool to logically organize and graphically display the causes associated with specific effects [29]. The influence and relationship values were used to plot the cause–effect diagram, as shown in Figure 4. Typically, this diagram is divided into four categories, core causal, inferior causal, core effect and inferior effect.
The core causal group with large prominence and positive relation, CU5, CU4, and SP3 are concluded in this cluster, elements in this group have the topmost priority for improvement. The inferior causal group with small prominence and positive relation, SP5, CU1, CU3, ME1, ME2, ME4 are classified in this region, they require immediate improvement but with high priority. SP2, CU2, EP4, ME3, ME5 with small prominence and negative relation, affiliated to the inferior effect group, are improved indirectly with medium priority. The rest with large prominence and negative relation belong to the core effect group, which are affected by elements in other groups. In this way, the elements in the causal groups are improved, and the corresponding effect groups will be upgraded as well. Therefore, the order of improvements can be determined based on the priority of indicators, as shown in Table A8, red for topmost priority, purple for high priority, and cyan for medium priority.

4.2. Comparative Analysis

A comparative analysis is required to understand the strengths and weaknesses of specific mines. Figure 5 indicates the performance of the underground gold mine in different fields. From each dimension, M1 and M2 underperform in terms of SP, M4, M5, and M6 has a poor degree of CU, M6 has the lowest EP score, and M4 and M6 have significant weaknesses in terms of ME. Each mine includes aspects that need to be improved when broken down into distinct indicators. Table A8 demonstrates the prospective improvement elements for each mine.
From a holistic view, the pilot green mines are developed in a more balanced way, and they have great advantages in terms of CU. This is because CU has a high degree of association with other indicators, especially CU4 and CU5 which are used for underground filling. These not only control ground pressure and prevent surface collapse (benefits for SP), but also solve the EP pressure, and the filling mining method improves ME. Correspondingly, these are the driving factors for green mines to enhance CU.
In terms of scores, M3 performs the best, M1 and M2 still show space for improvement, M4 and M6 perform poorly and have a large gap between the pilot green mine. M5 has the most potential to develop into a green mine.
More importantly, to validate the feasibility of this research, a comparative analysis with other related studies is crucial.
(1) Comparison of evaluation criteria
This paper proposed an evaluation criteria framework, applicable to underground metal mines. Compared with the most similar GMP evaluation study, the criteria system in the literature [9] is very abstract, which is not conducive to the accuracy of evaluation. Meanwhile, the selection of indicators was kept simple based on the essential requirements of green mining [7]. Thus, the easy accessibility of evaluation information is determined as a prerequisite to choosing indicators. The proposed evaluation system is flexible, and the criterion can be more specific in future studies.
(2) Comparison of weight determination methods
The analytic network process method is widely used for MCDM [42,43], but the calculation process is complicated. To compensate for the shortcomings of this single method, hybrid evaluation methods with ANP [44,45] were proposed. The weights in this research were determined using an integrated Gray DEMATEL and ANP approach, which was employed for the first time in the GMP evaluation sector. In comparison to other methods, this approach fully utilizes the correlation between indicators and simplifies the calculation process [39]. Therefore, the calculated weights are more reasonable.
(3) Comparison of the results
The GMP evaluation studies usually assess the same type of mines [6,9], and this paper selected three pilot green mines as control group. The proposed method is capable of distinguishing between two types of mines, which verifies the feasibility of this research. The results show that CU is the most important criterion in GM, and this can be corroborated by the related research [7]. Moreover, the cause–effect analysis provided a reasonable order for mine improvements, which has not been found in GMP evaluation studies. Thus, the proposed suggestions are more informative than similar studies.
To sum up, the advantages of proposed approaches summarized as follows:
  • Evaluation indicators are specific and data easy to obtain, the calculability of evaluation information guarantees the relative fairness of evaluation.
  • Weights are calculated by correlation between indicators, and with the cause–effect analysis guide for mine improvements, the suggestions are more informative.
  • Data of six underground gold mines were collected, the proposed method can distinguish between two types of mines, which verify the feasibility of proposed method.

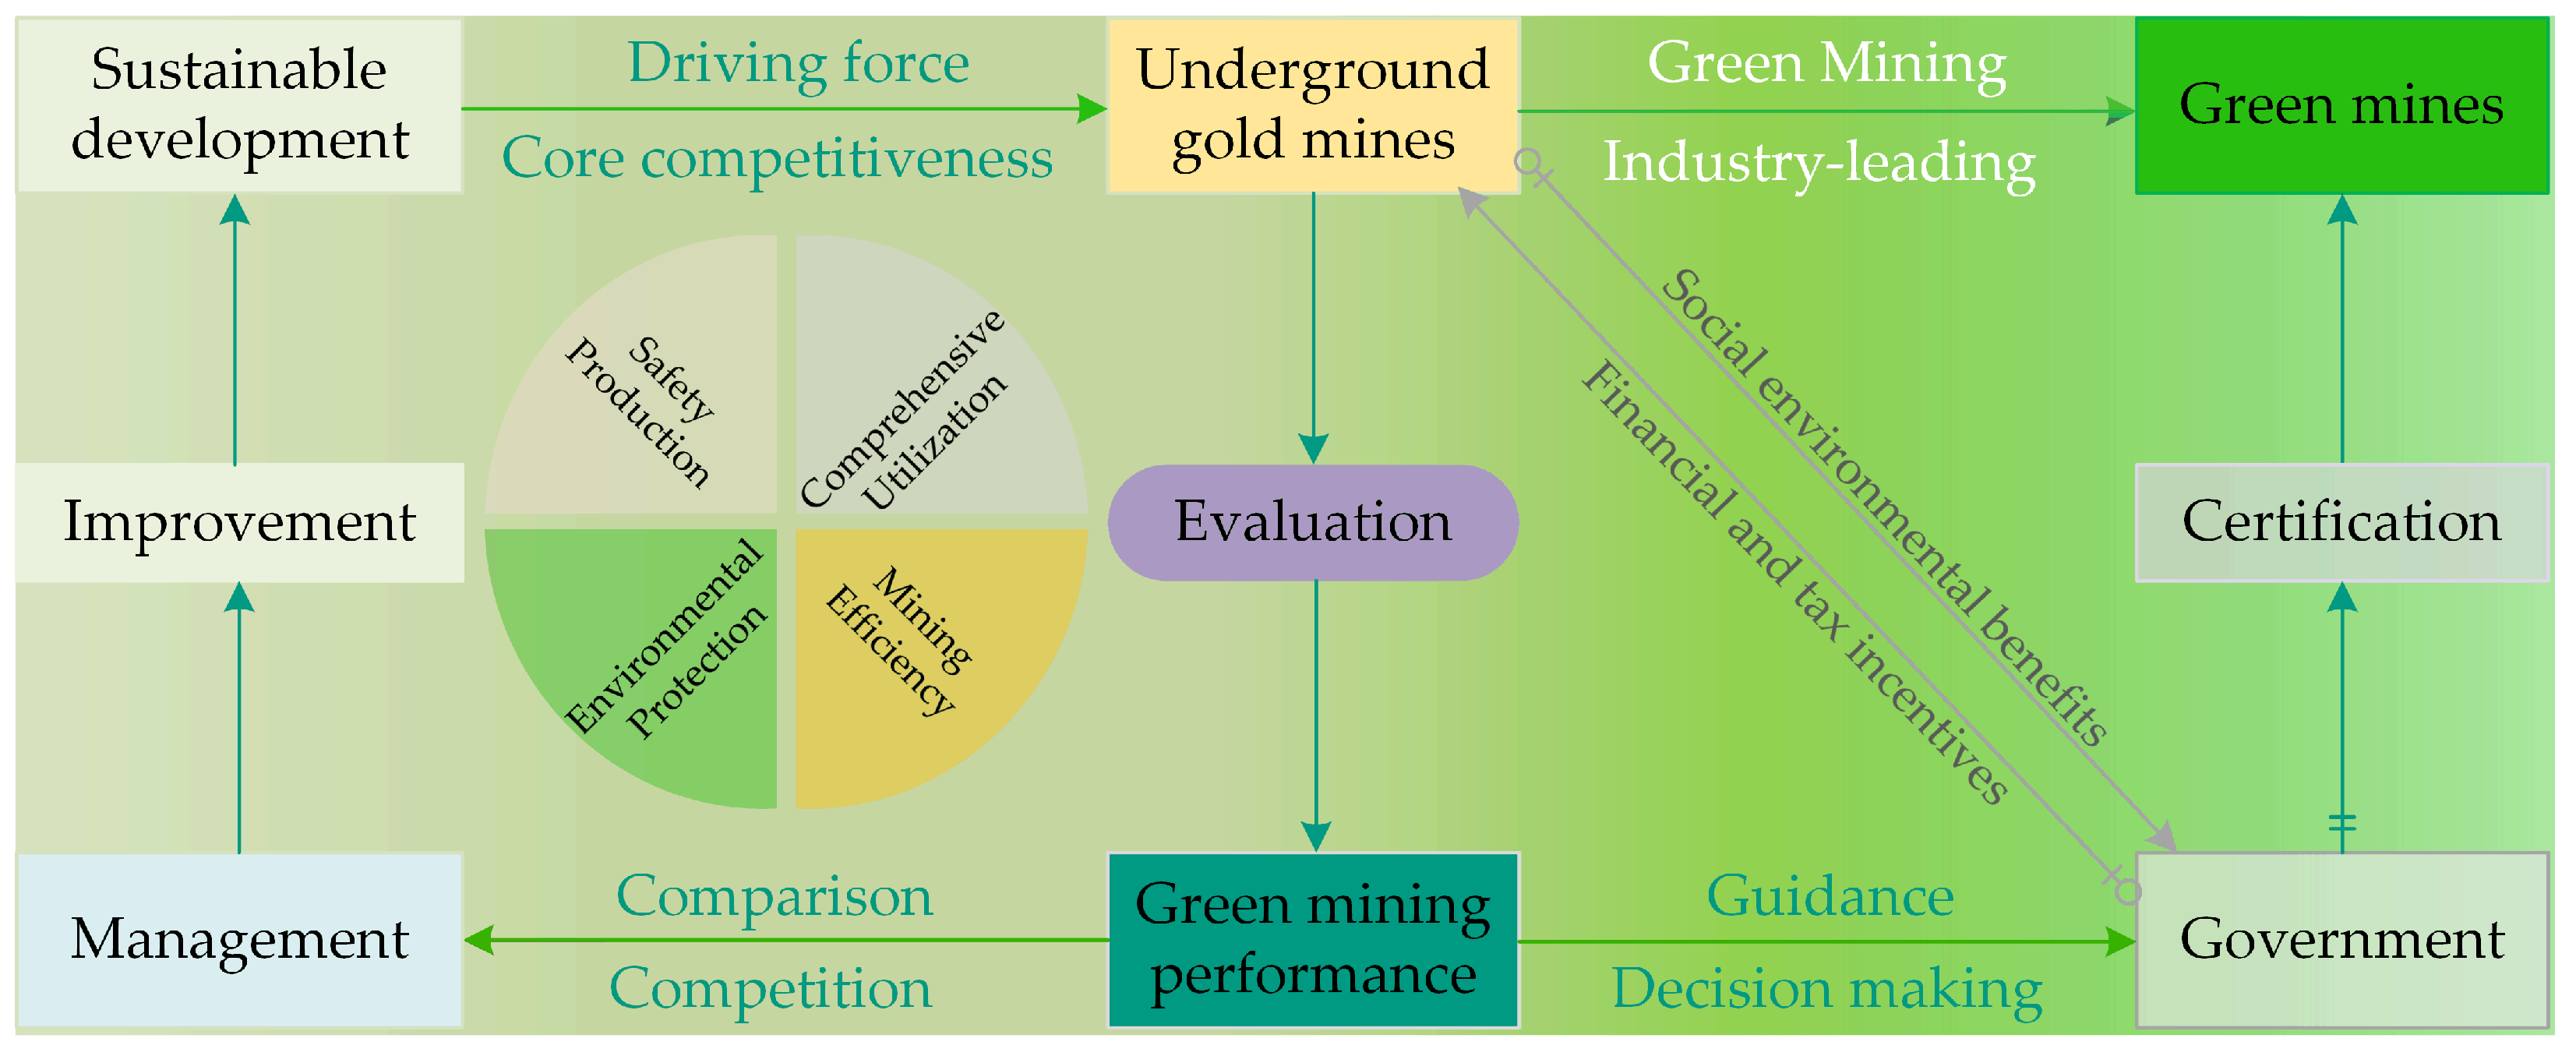
4.3. Managerial Implications

Management of mining processes and monitoring of their performance is a basic prerequisite for continual improvement [46], and the performance evaluation of mines is the key to promoting green mine construction [7]. Figure 6 reveals the role of evaluation in GM. The evaluation has profound implications and broad application value, pushing mines to practice green mining, and serving as a strong tool for the government to encourage policy implementation.
Mines are compared in the evaluation process, and the results point out the advantages and weaknesses of mines, which indicate the way forward for improvement and upgrading. For sustainable development, mines have to identify and solve gaps; this purpose becomes the driving force for GM. When the mines have performed excellently in green mining and reached the industry-leading level, they will be recognized as green mines. The designation is certificated by the government, and evaluation plays an important role in this procedure, guiding the decision-making of the government. The mines create social environmental benefits, and the government supports financial and tax incentives to mines depending on the GMP, highlighting a mutually beneficial situation. Mines provide social and environmental benefits, while the government provides financial and tax incentives to mines based on GMP, creating a win–win scenario.

5. Conclusions

The integral elements of the GM for underground gold mines include safety production, comprehensive utilization of resources, environmental protection, and mining efficiency. In order to measure the GMP of different mines, an evaluation system is proposed in this study, which consists of four criteria and twenty indicators. Considering the correlation of indicators, an integrated GDANP method has been exploited to evaluate the GMP for six underground gold mines. The results demonstrate the rank order as well as the gap between the mines. Furthermore, the weaknesses of each mine are analyzed in a broad dimension, and the advantages of pilot green mines are explained in a reasonable manner. Subsequently, the cause–effect analysis categorizes indicators into four groups, with the priority defined by the prominence and relation of each indicator. To solve the gaps, mines have to implement improvements sensibly. Finally, this research explored the effect of evaluation on mining management and the government.
Indeed, there are some limitations to this study, e.g., the lack of evidence to prove which proposed method was the best. Perhaps the presented evaluation framework can be extended with other MCDM approaches. Indicators can be added to make the system more comprehensive, and the evaluation criteria can be improved in future studies.
In summary, this paper mainly evaluated the GMP for underground gold mines and provided ideas for improvements. The evaluation framework applies to underground metal mines, and some indicators in the formulated system are likely to work for similar environments. The proposed methodology can also be exploited in other evaluation studies where the indicators are correlated. The results of this research may be used as a reference for GM in other mines, as well as to assist government policy implementation.

Author Contributions

Conceptualization, Y.L. and J.Q.; methodology, data curation, writing—original draft preparation, visualization, Y.L.; validation, P.W.; writing—review and editing, G.Z. and P.W.; supervision, funding acquisition, G.Z. All authors have read and agreed to the published version of the manuscript.

Funding

This research was funded by the National Key Research and Development Program of China (2018YFC0604606).

Institutional Review Board Statement

Not applicable.

Informed Consent Statement

Not applicable.

Data Availability Statement

Not applicable.

Acknowledgments

The authors would like to thank all those at gold mines under Shandong Gold Mining Co., Ltd., who provided considerable support during data collection.

Conflicts of Interest

The authors declare no conflict of interest.

Abbreviations

The following abbreviations are used in this manuscript:
CUComprehensive utilization
EPEnvironmental protection
GDANPGray DEMATEL and ANP
GMGreen mining
GMPGreen mining performance
MCDMMulti-Criteria Decision-Making
MEMining efficiency
SPSafety production

Appendix A

Table A1. Calculation method for indicators.
IndicatorCalculation MethodUnit
SP1Number of serious injuries per yearperson
SP2Number of light injuries per yearperson
SP3Number of deaths/Million working hours × 10 6 person
SP4Number of people receiving systematic security training/All staff × 100%%
SP5Number of people engaged in full-time safety production management/All staff × 100%%
CU1Mined ore/Reserves of ore owned by the mining area × 100%%
CU2Mass of useful fraction in concentrate/Mass of useful fraction in the ore inducted × 100%%
CU3Mass of co-associated minerals that have been utilized/Mass of contained co-associated minerals × 100%%
CU4Annual tailings utilization/Total annual tailings production × 100%%
CU5Annual amount of waste rocks utilized/Total amount of waste rocks produced annually × 100%%
EP1Reclaimed land area/Damaged land area × 100%%
EP2Greening area/Actual greenable area × 100%%
EP3Actual emission of three wastes/Permitted emission of three wastes × 100%%
EP4The area where the noise control meets the national standard/The noise area of the mine × 100%%
EP5Annual environmental protection investment/Annual revenue of the mine × 100%%
ME1(Geological grade of original ore - grade of extracted ore)/Geological grade of original ore × 100%%
ME2(Industrial reserves - actual ore mined)/Industrial reserves × 100%%
ME3Total monthly ore production/Number of all employeest/person
ME4The annual amount of ore mined from the mining face/Gross area of the back-mining areat/m 2 ·a
ME5Annual power consumption/Annual gold ore productionkWh/t
Table A2. The total influence matrix.
SP1SP2SP3SP4SP5CU1CU2CU3CU4CU5EP1EP2EP3EP4EP5ME1ME2ME3ME4ME5
SP10.07670.15900.14650.20190.10790.00140.00030.00010.00730.00490.01080.00890.00950.00500.03670.00160.00180.02220.01690.0030
SP20.14180.04850.10390.13040.05760.00070.00040.00010.00380.00190.00360.00270.00340.00110.00740.00180.00190.02400.01940.0022
SP30.18870.16190.09030.29880.18730.00030.00010.00000.00170.00100.00220.00180.00190.00090.00680.00050.00050.00660.00520.0008
SP40.21910.23030.17370.09200.05320.00040.00010.00010.00200.00120.00260.00210.00230.00110.00800.00060.00070.00860.00670.0010
SP50.23730.16950.22250.31250.05780.00040.00010.00000.00200.00130.00270.00220.00240.00120.00840.00060.00060.00760.00600.0009
CU10.01480.00630.00540.00390.00210.01810.03410.02580.08360.08460.07420.06350.04620.01960.13940.03300.18480.11290.09490.0439
CU20.00250.00270.00170.00100.00050.00490.00020.01840.03000.01060.02610.01940.04760.00880.06530.00020.00100.00120.00180.0067
CU30.00230.00250.00160.00090.00050.00430.00020.00010.02730.00750.01940.01290.04840.00460.03300.00020.00090.00140.00190.0108
CU40.05650.04320.04520.02230.01250.16180.00550.00410.08910.16710.25830.25480.11040.02330.14460.00560.02980.02290.02030.0554
CU50.01530.01160.01130.00580.00320.11450.00390.00290.22260.06460.27210.21050.08010.02700.17230.00400.02110.01640.01440.0570
EP10.01880.01100.01410.00690.00390.02890.00100.00070.15980.08980.09870.21440.05810.04760.21580.00110.00540.00480.00480.0152
EP20.00700.00600.00530.00280.00150.01980.00070.00050.10320.07240.12790.06880.04640.02540.18070.00070.00370.00320.00340.0113
EP30.02360.03270.01290.00910.00470.01520.00080.00050.08380.04730.22230.08010.05220.03080.20820.00200.00420.01340.03000.1193
EP40.00560.03240.00410.00440.00200.00310.00010.00010.01550.01250.02950.02510.02520.01530.11530.00020.00070.00140.00160.0038
EP50.01480.01740.01030.00600.00320.03060.00110.00080.15320.12320.29210.24860.24970.15130.14330.00140.00600.00700.01010.0371
ME10.00250.00240.00180.00100.00050.00700.18420.06990.03550.02700.02820.02310.02730.00950.06930.00490.03530.09000.01800.0117
ME20.00350.00360.00250.00140.00080.00910.01080.00110.04380.03990.05530.04520.04620.02280.16650.01070.01220.15970.09590.0191
ME30.00280.00280.00200.00110.00060.00680.01050.00390.03780.02070.03780.02920.03520.01270.08750.05390.05620.04280.17190.0789
ME40.01050.00930.00780.00410.00230.02680.00880.00360.15830.06610.10790.07390.10930.01620.07080.04220.04560.16890.03480.0313
ME50.00040.00030.00030.00010.00010.00090.00070.00030.00550.00250.00430.00310.00420.00100.00610.00370.00390.05830.03170.0048
Table A3. The weighted supermatrix for indicators.
SP1SP2SP3SP4SP5CU1CU2CU3CU4CU5EP1EP2EP3EP4EP5ME1ME2ME3ME4ME5
SP10.07350.16680.16970.18240.21480.00310.00130.00110.00580.00580.00650.00640.00950.01170.01950.00950.00440.02860.02860.0058
SP20.13580.05090.12030.11790.11460.00150.00130.00100.00300.00230.00210.00190.00340.00260.00390.01040.00450.03100.03290.0044
SP30.18060.16980.10460.27010.37290.00070.00040.00030.00130.00120.00130.00130.00190.00220.00360.00290.00130.00860.00880.0015
SP40.20970.24150.20120.08320.10600.00080.00050.00040.00160.00150.00160.00150.00230.00260.00420.00370.00160.01110.01140.0019
SP50.22720.17780.25780.28240.11510.00080.00040.00040.00160.00150.00160.00160.00240.00270.00450.00330.00150.00990.01010.0018
CU10.01410.00670.00630.00350.00420.03980.12920.19360.06610.10000.04430.04570.04590.04620.07400.19530.44410.14610.16090.0853
CU20.00240.00280.00200.00090.00110.01080.00070.13830.02370.01250.01560.01390.04730.02070.03460.00140.00230.00150.00310.0130
CU30.00220.00260.00180.00080.00100.00950.00060.00090.02160.00880.01160.00930.04810.01080.01750.00140.00210.00180.00320.0209
CU40.05410.04530.05240.02020.02490.35550.02080.03100.07040.19750.15410.18330.10970.05480.07670.03340.07150.02960.03450.1076
CU50.01470.01220.01310.00530.00640.25170.01470.02190.17590.07640.16230.15140.07960.06360.09140.02370.05070.02130.02440.1108
EP10.01800.01150.01630.00630.00780.06350.00380.00560.12620.10610.05890.15420.05770.11200.11440.00640.01290.00610.00820.0295
EP20.00670.00630.00620.00250.00300.04350.00260.00380.08150.08560.07630.04950.04610.05980.09580.00440.00890.00410.00580.0220
EP30.02260.03430.01500.00820.00940.03340.00300.00370.06620.05590.13270.05760.05190.07240.11040.01160.01010.01740.05090.2320
EP40.00540.03400.00470.00400.00400.00680.00050.00060.01230.01470.01760.01810.02510.03590.06120.00110.00160.00180.00270.0074
EP50.01420.01830.01190.00540.00640.06730.00420.00600.12100.14560.17430.17880.24820.35590.07600.00830.01430.00900.01720.0722
ME10.00240.00250.00210.00090.00110.01530.69880.52500.02800.03190.01680.01660.02710.02220.03680.02900.08480.11640.03050.0228
ME20.00330.00380.00290.00130.00150.02010.04110.00840.03460.04720.03300.03250.04600.05350.08830.06340.02940.20650.16260.0372
ME30.00270.00290.00240.00100.00120.01490.03990.02930.02990.02450.02260.02100.03500.02990.04640.31900.13500.05530.29150.1535
ME40.01000.00980.00900.00370.00450.05890.03340.02670.12510.07810.06440.05320.10860.03820.03760.24970.10960.21850.05900.0609
ME50.00040.00040.00030.00010.00020.00210.00280.00210.00430.00300.00260.00230.00420.00240.00330.02220.00950.07540.05370.0094
Table A4. The limited supermatrix for indicators.
SP1SP2SP3SP4SP5CU1CU2CU3CU4CU5EP1EP2EP3EP4EP5ME1ME2ME3ME4ME5
SP10.03960.03960.03960.03960.03960.03960.03960.03960.03960.03960.03960.03960.03960.03960.03960.03960.03960.03960.03960.0396
SP20.02780.02780.02780.02780.02780.02780.02780.02780.02780.02780.02780.02780.02780.02780.02780.02780.02780.02780.02780.0278
SP30.04390.04390.04390.04390.04390.04390.04390.04390.04390.04390.04390.04390.04390.04390.04390.04390.04390.04390.04390.0439
SP40.03420.03420.03420.03420.03420.03420.03420.03420.03420.03420.03420.03420.03420.03420.03420.03420.03420.03420.03420.0342
SP50.04260.04260.04260.04260.04260.04260.04260.04260.04260.04260.04260.04260.04260.04260.04260.04260.04260.04260.04260.0426
CU10.09500.09500.09500.09500.09500.09500.09500.09500.09500.09500.09500.09500.09500.09500.09500.09500.09500.09500.09500.0950
CU20.01390.01390.01390.01390.01390.01390.01390.01390.01390.01390.01390.01390.01390.01390.01390.01390.01390.01390.01390.0139
CU30.01010.01010.01010.01010.01010.01010.01010.01010.01010.01010.01010.01010.01010.01010.01010.01010.01010.01010.01010.0101
CU40.10650.10650.10650.10650.10650.10650.10650.10650.10650.10650.10650.10650.10650.10650.10650.10650.10650.10650.10650.1065
CU50.08760.08760.08760.08760.08760.08760.08760.08760.08760.08760.08760.08760.08760.08760.08760.08760.08760.08760.08760.0876
EP10.05650.05650.05650.05650.05650.05650.05650.05650.05650.05650.05650.05650.05650.05650.05650.05650.05650.05650.05650.0565
EP20.03990.03990.03990.03990.03990.03990.03990.03990.03990.03990.03990.03990.03990.03990.03990.03990.03990.03990.03990.0399
EP30.04970.04970.04970.04970.04970.04970.04970.04970.04970.04970.04970.04970.04970.04970.04970.04970.04970.04970.04970.0497
EP40.01380.01380.01380.01380.01380.01380.01380.01380.01380.01380.01380.01380.01380.01380.01380.01380.01380.01380.01380.0138
EP50.07850.07850.07850.07850.07850.07850.07850.07850.07850.07850.07850.07850.07850.07850.07850.07850.07850.07850.07850.0785
ME10.04520.04520.04520.04520.04520.04520.04520.04520.04520.04520.04520.04520.04520.04520.04520.04520.04520.04520.04520.0452
ME20.05580.05580.05580.05580.05580.05580.05580.05580.05580.05580.05580.05580.05580.05580.05580.05580.05580.05580.05580.0558
ME30.06680.06680.06680.06680.06680.06680.06680.06680.06680.06680.06680.06680.06680.06680.06680.06680.06680.06680.06680.0668
ME40.08000.08000.08000.08000.08000.08000.08000.08000.08000.08000.08000.08000.08000.08000.08000.08000.08000.08000.08000.0800
ME50.01270.01270.01270.01270.01270.01270.01270.01270.01270.01270.01270.01270.01270.01270.01270.01270.01270.01270.01270.0127
Table A5. Collected data from underground gold mines.
SP1SP2SP3SP4SP5CU1CU2CU3CU4CU5EP1EP2EP3EP4EP5ME1ME2ME3ME4ME5
M10.006.000.00100.002.2093.1094.96100.0065.14100.00100.00100.00100.00100.000.603.476.90118.858.3422.11
M20.007.000.00100.001.1595.7995.1371.4684.30100.0067.90100.00100.00100.001.284.254.2119.769.8047.03
M30.000.000.00100.003.2095.5292.5260.0094.93100.0020.00100.00100.00100.002.004.004.00141.589.4528.50
M40.001.000.00100.004.9593.6296.5072.630.00100.00100.00100.00100.00100.001.4212.006.3822.385.3824.58
M50.000.000.00100.001.4596.4495.9583.325.33100.0038.5397.00100.00100.003.1013.951.4456.304.138.83
M60.000.000.00100.004.1089.5585.0081.7130.00100.0020.0099.0099.0098.001.0010.0810.4541.425.75108.81
Table A6. The normalized evaluation matrix.
SP1SP2SP3SP4SP5CU1CU2CU3CU4CU5EP1EP2EP3EP4EP5ME1ME2ME3ME4ME5
M11.00000.53851.00001.00000.44440.96540.98401.00000.68621.00001.00001.00001.00001.00000.19351.00000.20870.83950.85100.3994
M21.00000.50001.00001.00000.23190.99330.98580.71460.88801.00000.67901.00001.00001.00000.41340.81650.34200.13951.00000.1878
M31.00001.00001.00001.00000.64650.99050.95880.60001.00001.00000.20001.00001.00001.00000.64520.86750.36001.00000.96430.3098
M41.00000.87501.00001.00001.00000.97081.00000.72630.00001.00001.00001.00001.00001.00000.45810.28920.22570.15810.54900.3592
M51.00001.00001.00001.00000.29291.00000.99430.83320.05611.00000.38530.97001.00001.00001.00000.24871.00000.39770.42141.0000
M61.00001.00001.00001.00000.82830.92860.88080.81710.31601.00000.20000.99000.99000.98000.32260.34420.13780.29260.58670.0812
Table A7. The weighted normalized evaluation matrix.
SP1SP2SP3SP4SP5CU1CU2CU3CU4CU5EP1EP2EP3EP4EP5ME1ME2ME3ME4ME5Scores
M10.03960.01500.04390.03420.01890.09170.01370.01010.07310.08760.05650.03990.04970.01380.01520.04520.01160.05610.06810.00510.7889
M20.03960.01390.04390.03420.00990.09440.01370.00720.09460.08760.03840.03990.04970.01380.03240.03690.01910.00930.08000.00240.7608
M30.03960.02780.04390.03420.02750.09410.01330.00600.10650.08760.01130.03990.04970.01380.05060.03920.02010.06680.07720.00390.8531
M40.03960.02440.04390.03420.04260.09220.01390.00730.00000.08760.05650.03990.04970.01380.03590.01310.01260.01060.04390.00460.6662
M50.03960.02780.04390.03420.01250.09500.01380.00840.00600.08760.02180.03870.04970.01380.07850.01130.05580.02660.03370.01270.7112
M60.03960.02780.04390.03420.03530.08820.01220.00820.03370.08760.01130.03950.04920.01350.02530.01560.00770.01950.04690.00100.6403
Table A8. Potential improvements for underground gold mines.
SP1SP2SP3SP4SP5CU1CU2CU3CU4CU5EP1EP2EP3EP4EP5ME1ME2ME3ME4ME5
M1
M2
M3
M4
M5
M6

References

  1. Zhou, Y.; Zhou, W.; Lu, X.; Jiskani, I.M.; Cai, Q.; Liu, P.; Lin, L. Evaluation Index System of Green Surface Mining in China. Min. Metall. Explor. 2020, 37, 1093–1103. [Google Scholar] [CrossRef]
  2. Qi, R.; Liu, T.; Jia, Q.; Sun, L.; Liu, J. Simulating the Sustainable Effect of Green Mining Construction Policies on Coal Mining Industry of China. J. Clean Prod. 2019, 226, 392–406. [Google Scholar] [CrossRef]
  3. Zhao, Y.; Zhao, G.; Zhou, J.; Pei, D.; Liang, W.; Qiu, J. What Hinders the Promotion of the Green Mining Mode in China? A Game-Theoretical Analysis of Local Government and Metal Mining Companies. Sustainability 2020, 12, 2991. [Google Scholar] [CrossRef] [Green Version]
  4. Liu, Y.; Zhang, C.; Huang, Y.; Xiao, Z.; Han, Y.; Ren, G. Climate Impact of China’s Promotion of the Filling Mining Method: Bottom-Up Estimation of Greenhouse Gas Emissions in Underground Metal Mines. Energies 2021, 14, 3273. [Google Scholar] [CrossRef]
  5. Chen, J.; Jiskani, I.M.; Jinliang, C.; Yan, H. Evaluation and Future Framework of Green Mine Construction in China Based on the DPSIR Model. Sustain. Environ. Res. 2020, 30, 13. [Google Scholar] [CrossRef]
  6. Liang, W.; Dai, B.; Zhao, G.; Wu, H. Assessing the Performance of Green Mines via a Hesitant Fuzzy ORESTE–QUALIFLEX Method. Mathematics 2019, 7, 788. [Google Scholar] [CrossRef] [Green Version]
  7. Chen, J.; Jiskani, I.M.; Lin, A.; Zhao, C.; Jing, P.; Liu, F.; Lu, M. A Hybrid Decision Model and Case Study for Comprehensive Evaluation of Green Mine Construction Level. Environ. Dev. Sustain. 2022. [Google Scholar] [CrossRef]
  8. Jiskani, I.M.; Cai, Q.; Zhou, W.; Ali Shah, S.A. Green and Climate-Smart Mining: A Framework to Analyze Open-Pit Mines for Cleaner Mineral Production. Resour. Policy 2021, 71, 102007. [Google Scholar] [CrossRef]
  9. Liang, W.; Dai, B.; Zhao, G.; Wu, H. Performance Evaluation of Green Mine Using a Combined Multi-Criteria Decision Making Method with Picture Fuzzy Information. IEEE Access 2019, 7, 174139–174154. [Google Scholar] [CrossRef]
  10. Qi, R.; Li, S.; Qu, L.; Sun, L.; Gong, C. Critical Factors to Green Mining Construction in China: A Two-Step Fuzzy DEMATEL Analysis of State-Owned Coal Mining Enterprises. J. Clean Prod. 2020, 273, 122852. [Google Scholar] [CrossRef]
  11. Wang, J.; Hu, B.; Chang, J.; Li, H. Case Studies and Evaluation of Green Mining Considering Uncertainty Factors and Multiple Indicator Weights. Geofluids 2020, 2020, 1–15. [Google Scholar] [CrossRef]
  12. Zhang, P.; Duan, N.; Dan, Z.; Shi, F.; Wang, H. An Understandable and Practicable Cleaner Production Assessment Model. J. Clean Prod. 2018, 187, 1094–1102. [Google Scholar] [CrossRef]
  13. Ashraf, S.; Abdullah, S.; Mahmood, T.; Aslam, M. Cleaner Production Evaluation in Gold Mines Using Novel Distance Measure Method with Cubic Picture Fuzzy Numbers. Int. J. Fuzzy Syst. 2019, 21, 2448–2461. [Google Scholar] [CrossRef]
  14. Liang, W.; Luo, S.; Zhao, G. Evaluation of Cleaner Production for Gold Mines Employing a Hybrid Multi-Criteria Decision Making Approach. Sustainability 2019, 11, 146. [Google Scholar] [CrossRef] [Green Version]
  15. Huang, J.; L, Y.; Yue, P. Review on the Evaluation of Green Development of Mining Industry. IOP Conf. Ser. Earth Environ. Sci. 2021, 859, 012094. [Google Scholar] [CrossRef]
  16. Yu, G.; Huang, Q.; Zhao, X.; Wang, W. Efficiency Evaluation and Optimization of Green Mining for Coal Enterprises Based on DEA. Appl. Mech. Mater. 2013, 295-298, 2864. [Google Scholar] [CrossRef]
  17. Li, X.; Yang, J.; Yan, H.; Cao, H. Study on Evaluation Index System of Green Mine Construction. IOP Conf. Ser. Earth Environ. Sci. 2017, 94, 012182. [Google Scholar] [CrossRef]
  18. Zhu, S.; Chu, Z.; Li, L.; Miao, S.; Xu, J. Deep Geological Characteristics and Ore Predition of Vein 175 in Linglong Gold Field in Jiaodong Area, Shandong Province. Earth Sci. 2021, 10, 128. [Google Scholar]
  19. Na, Y.; Yang, Y. Study on Genesis of Gold Deposit and Mineralization Enrichment Regularity Based on Mapping Analysis. In Proceedings of the 2017 9th International Conference on Measuring Technology and Mechatronics Automation (ICMTMA), Changsha, China, 14–15 January 2017; pp. 236–239. Available online: https://www.webofscience.com/wos/alldb/full-record/WOS:000401696400055 (accessed on 30 April 2022).
  20. Chen, C. Hazards Identification and Characterisation of the Tailings Storage Facility Dam Failure and Engineering Applications. Int. J. Min. Reclam. Environ. 2022, 1–20. [Google Scholar] [CrossRef]
  21. Li, L.; Xu, L.J.; Chen, D.M. Connotation and Technology System of Green Mining of Manganese Resources. Adv. Mater. Res. 2013, 734–737, 540–545. [Google Scholar] [CrossRef]
  22. Mensah, M.K.; Drebenstedt, C.; Annam, B.V.; Armah, E.K. Occupational Respirable Mine Dust and Diesel Particulate Matter Hazard Assessment in an Underground Gold Mine in Ghana. J. Health Pollut. 2020, 10, 200305. [Google Scholar] [CrossRef] [PubMed] [Green Version]
  23. Amoakwah, E.; Ahsan, S.; Rahman, M.A.; Asamoah, E.; Essumang, D.K.; Ali, M.; Islam, K.R. Assessment of Heavy Metal Pollution of Soil-Water-Vegetative Ecosystems Associated with Artisanal Gold Mining. Soil Sediment Contam. 2020, 29, 788–803. [Google Scholar] [CrossRef]
  24. Zhang, C.; Wang, X.; Jiang, S.; Zhou, M.; Li, F.; Bi, X.; Xie, S.; Liu, J. Heavy Metal Pollution Caused by Cyanide Gold Leaching: A Case Study of Gold Tailings in Central China. Environ. Sci. Pollut. Res. 2021, 28, 29231–29240. [Google Scholar] [CrossRef] [PubMed]
  25. Zhao, G.; Li, X.; Zhu, J.; Zhao, X.; Zhang, J.; Zhai, J. Pollution Assessment of Potentially Toxic Elements (PTEs) in Soils around the Yanzhuang Gold Mine Tailings Pond, Pinggu County, Beijing, China. Int. J. Environ. Res. Public Health 2021, 18, 7240. [Google Scholar] [CrossRef] [PubMed]
  26. Wang, Y.; Lei, Y.; Wang, S. Green Mining Efficiency and Improvement Countermeasures for China’s Coal Mining Industry. Front. Energy Res. 2020, 8, 18. [Google Scholar] [CrossRef]
  27. Nazir, M.; Cavus, N. Quality Evaluation of Learning Management Systems Using Dematel-Anp. In Proceedings of the International Technology, Education and Development Conference, Valencia, Spain, 6–8 March 2017; pp. 5754–5760. Available online: https://www.webofscience.com/wos/alldb/full-record/WOS:000427401300097 (accessed on 30 April 2022).
  28. Rostamzadeh, S.; Abouhossein, A.; Chalak, M.H.; Vosoughi, S.; Norouzi, R. An Integrated DEMATEL-ANP Approach for Identification and Prioritization of Factors Affecting Falls from Height Accidents in Construction Industry. Int. J. Occup. Saf. Ergon. 2022, 1–31. [Google Scholar] [CrossRef]
  29. Jiskani, I.M.; Cai, Q.; Zhou, W.; Lu, X.; Shah, S. An Integrated Fuzzy Decision Support System for Analyzing Challenges and Pathways to Promote Green and Climate Smart Mining. Expert Syst. Appl. 2022, 188, 116062. [Google Scholar] [CrossRef]
  30. Liang, W.; Zhao, G.; Wu, H.; Dai, B. Risk Assessment of Rockburst via an Extended MABAC Method under Fuzzy Environment. Tunn. Undergr. Space Technol. 2019, 83, 533–544. [Google Scholar] [CrossRef]
  31. Mubarik, M.S.; Kazmi, S.H.A.; Zaman, S.I. Application of Gray DEMATEL-ANP in Green-Strategic Sourcing. Technol. Soc. 2021, 64, 101524. [Google Scholar] [CrossRef]
  32. Liu, X.; Deng, Q.; Gong, G.; Zhao, X.; Li, K. Evaluating the Interactions of Multi-Dimensional Value for Sustainable Product-Service System with Grey DEMATEL-ANP Approach. J. Manuf. Syst. 2021, 60, 449–458. [Google Scholar] [CrossRef]
  33. Jiskani, I.M.; Han, S.; Rehman, A.U.; Shahani, N.M.; Tariq, M.; Brohi, M.A. An Integrated Entropy Weight and Grey Clustering Method–Based Evaluation to Improve Safety in Mines. Min. Metall. Explor. 2021, 38, 1773–1787. [Google Scholar] [CrossRef]
  34. Han, S.; Chen, H.; Long, R.; Qi, H.; Cui, X. Evaluation of the Derivative Environment in Coal Mine Safety Production Systems: Case Study in China. J. Clean Prod. 2017, 143, 377–387. [Google Scholar] [CrossRef]
  35. Xiao, W.; Chen, W.; Deng, X. Coupling and Coordination of Coal Mining Intensity and Social-Ecological Resilience in China. Ecol. Indic. 2021, 131, 108167. [Google Scholar] [CrossRef]
  36. Yazdi, M.; Khan, F.; Abbassi, R.; Rusli, R. Improved DEMATEL Methodology for Effective Safety Management Decision-Making. Saf. Sci. 2020, 127, 104705. [Google Scholar] [CrossRef]
  37. Si, S.; You, X.; Liu, H.; Zhang, P. DEMATEL Technique: A Systematic Review of the State-of-the-Art Literature on Methodologies and Applications. Math. Probl. Eng. 2018, 2018, 3696457. [Google Scholar] [CrossRef] [Green Version]
  38. Liu, C.; Li, K.; Jiang, P.; Li, D.; Su, L.; Lu, S.; Li, A. A Hybrid Multiple Criteria Decision-Making Technique to Evaluate Regional Intellectual Capital: Evidence from China. Mathematics 2021, 9, 1676. [Google Scholar] [CrossRef]
  39. Rao, S. A Hybrid MCDM Model Based on DEMATEL and ANP for Improving the Measurement of Corporate Sustainability Indicators: A Study of Taiwan High Speed Rail. Res. Transp. Bus. Manag. 2021, 41, 100657. [Google Scholar] [CrossRef]
  40. Hwang, C.; Yoon, K. Multiple Attribute Decision Making: Methods and Applications; Springer: Berlin/Heidelberg, Germany, 1981. [Google Scholar]
  41. Wudhikarn, R. The Hybrid Intellectual Capital Valuation Method. Ekon. Istraz. 2021, 34, 2115–2134. [Google Scholar] [CrossRef]
  42. Wudhikarn, R.; Chakpitak, N.; Neubert, G. An Analytic Network Process Approach for the Election of Green Marketable Products. Benchmarking 2015, 22, 994–1018. [Google Scholar] [CrossRef]
  43. Wudhikarn, R.; Chakpitak, N.; Neubert, G. Use of an Analytic Network Process and Monte Carlo Analysis in New Product Formula Selection Decisions. Asia Pac. J. Oper. Res. 2015, 32, 1550007. [Google Scholar] [CrossRef]
  44. Wudhikarn, R. Improving the Intellectual Capital Management Approach Using the Hybrid Decision Method. J. Intellect. Cap. 2018, 19, 670–691. [Google Scholar] [CrossRef]
  45. Wu, W. Choosing Knowledge Management Strategies by Using a Combined ANP and DEMATEL Approach. Expert Syst. Appl. 2008, 35, 828–835. [Google Scholar] [CrossRef]
  46. Teplická, K.; Khouri, S.; Beer, M.; Rybárová, J. Evaluation of the Performance of Mining Processes after the Strategic Innovation for Sustainable Development. Processes 2021, 9, 1374. [Google Scholar] [CrossRef]
Figure 1. Flowchart for evaluating GMP of underground gold mines.
Sustainability 14 06812 g001
Figure 2. GMP evaluation criteria system for underground gold mines.
Sustainability 14 06812 g002
Figure 3. The GMP evaluation results for underground gold mines.
Sustainability 14 06812 g003
Figure 4. Casual–effect diagram of indicators.
Sustainability 14 06812 g004
Figure 5. The GMP distributions of underground gold mines.
Sustainability 14 06812 g005
Figure 6. The role of evaluation in green mining.
Sustainability 14 06812 g006
Table 1. Relative influence index.
Crisp ValuesLinguistic VariablesInterval Gray Number
0No influence[0, 0]
1Low influence[0, 0.25]
2Medium influence[0.25, 0.5]
3High influence[0.5, 0.75]
4Very high influence[0.75, 1]
Table 2. Statistics of experts in GM.
ExpertsEducationWorking YearsPositionGray Weights
E1Bachelor17Engineer[0.3, 0.4]
E2Doctor28Professor[0.7, 1.0]
E3Master23Deputy mine manager[0.5, 0.6]
E4Bachelor19Senior Engineer[0.3, 0.5]
E5Master30Mine manager[0.6, 0.8]
E6Doctor25Supervisors[0.7, 0.9]
Table 3. Weights of indicators computed by using GDANP.
CriteriaWeightRankIndicatorLocal WeightGlobal WeightRank
SP10.21030.039614
SP20.14800.027816
SP0.18814SP30.23350.043911
SP40.18160.034215
SP50.22630.042612
CU10.30350.09502
CU20.04430.013917
CU0.31301CU30.03210.010120
CU40.34020.10651
CU50.27990.08763
EP10.23700.05657
EP20.16760.039913
EP0.23843EP30.20850.04979
EP40.05770.013818
EP50.32910.07855
ME10.17360.045210
ME20.21390.05588
ME0.26062ME30.25630.06686
ME40.30700.08004
ME50.04890.012719
Table 4. Prominence and relation of each indicator.
Row Sum ( D i )Column Sum ( C i )Influence IndexRelationship Index
SP10.82261.04461.8672−0.2220
SP20.55630.95341.5098−0.3971
SP30.95740.86331.82070.0941
SP40.80581.10661.9123−0.3008
SP51.03600.50231.53830.5337
CU11.09110.45501.54610.6362
CU20.25050.26360.5142−0.0131
CU30.18040.13300.31350.0474
CU41.53291.26582.79860.2671
CU51.33080.84632.17700.4845
EP11.00061.67602.6766−0.6754
EP20.69081.39022.0810−0.6993
EP30.99331.00611.9993−0.0128
EP40.29780.42530.7231−0.1274
EP51.50721.88533.3925−0.3781
ME10.64880.16900.81780.4799
ME20.75020.41611.16630.3341
ME30.69510.77321.4683−0.0780
ME40.99860.58971.58830.4089
ME50.13260.51420.6468−0.3817
Publisher’s Note: MDPI stays neutral with regard to jurisdictional claims in published maps and institutional affiliations.

