Article

An Evaluation of the Coupling Coordination Degree of an Urban Economy–Society–Environment System Based on a Multi-Scenario Analysis: The Case of Chengde City in China

1
China Architecture Design and Research Group, Beijing 100037, China
2
China National Engineering Research Center for Human Settlements, Beijing 100037, China
*
Author to whom correspondence should be addressed.
Sustainability 2022, 14(11), 6790; https://doi.org/10.3390/su14116790
Submission received: 6 May 2022 / Revised: 30 May 2022 / Accepted: 30 May 2022 / Published: 1 June 2022
(This article belongs to the Topic Resilience of Interdependent Urban Systems)

Abstract

:
Sustainable urban development requires the coordinated development of economic, social, and environmental subsystems. Evaluating the coordination degree of different urban subsystems is of great significance to supporting sustainable urban development. This study explores the method of combining a scenario analysis with the coupling coordination degree model, proposing a new approach to measure the correlation between the level of urban sustainable development and the coupling coordination degree of urban subsystems. This method is used to analyze the correlation between the sustainable development level of 11 district-level and county-level administrative regions in Chengde City and the coupling coordination degree under different scenarios. The evaluation results show that, under different scenarios, the coupling coordination degree of the 11 administrative regions in Chengde City is at three levels: imminent imbalance, near coordination, and primary coordination. Compared with the business-as-usual scenario, the changes in the coupling coordination degree of all administrative regions in Chengde City under the economic-led scenario, social-led scenario, and environment-led scenario are in line with the level of sustainable development evaluation outcomes. The results confirm that there is a correlation between the level of urban sustainable development and the coupling coordination degree in different scenarios.

1. Introduction

The United Nations’ 2030 Sustainable Development Agenda proposes 17 Sustainable Development Goals (SDGs) and 169 targets, including an urban-specific goal (Goal 11): “Make cities inclusive, safe, resilient and sustainable” [1]. The third United Nations Conference on Housing and Sustainable Urban Development in 2016 released the New Urban Agenda, which is a framework document to guide urban development over the next two decades [2], reflecting the importance of sustainable urban development to the realization of global sustainable development [3]. At present, most studies related to urban sustainable development focus on three aspects. One is to qualitatively study the overall idea of sustainable development at the urban level [4,5]. The second is to evaluate the level of urban sustainable development by constructing an index system. In this regard, the DPSIR (Driver–Pressure–State–Impact–Response) model [6,7] and MCDM (multicriteria decision making) method [8,9,10,11,12,13] are widely used for the evaluation of the urban sustainable development level. Based on the evaluation results, researchers can find the constraints of urban development and make suggestions for urban sustainable development. The third is to propose solutions to problems related to urban sustainable development from different fields, such as urban transport [14,15], urban disaster resilience [16,17], and public green spaces [18,19]. In the process of urban construction, urban sustainable development evaluation can help city managers to clearly understand the current level of sustainable development of the city, so as to make reasonable development plans, which is also increasingly recognized for its effectiveness in assisting decision making [8,20,21,22]. Therefore, urban sustainable development evaluation is an important tool to support urban planning and management and plays a crucial role in the decision-making process related to sustainable development.
Due to the increasing rate of economic globalization and urbanization, the contradiction between economic growth and environmental development has become more acute [23,24,25], and the rapid population concentration in the process of urban expansion has also brought about public health problems, unemployment, and other social issues [26,27]. Economy, society, and environment, as the three important subsystems of a city, are interrelated and interact with each other. Realizing the coordinated development of these three subsystems is the premise of sustainable urban development. Therefore, it is of great significance to evaluate the interaction between urban subsystems and study the coordination between different urban subsystems to support sustainable urban development. Coupling originates from physics and has been widely introduced in the field of social sciences. The coupling degree can evaluate the interaction relationship of multiple subsystems, and, on this basis, a “coupling coordination” analysis method is formed to evaluate the degree of coordinated development of various subsystems [28]. In recent years, the coupling coordination degree model (CCDM) has been widely used to evaluate the degree of coordinated development among urban subsystems [29,30,31,32,33,34], and the CCDM is also considered to be an effective tool to reveal the degree of coordination among different urban subsystems. In the process of rapid urban expansion, changes in external situations, such as opportunities and challenges, make urban development scenarios uncertain. How to evaluate the coordinated development of the economy, society, and the environment in the urbanization process under different urban development scenarios is an urgent problem to be solved. At present, some studies use the method of combining a scenario analysis and CCDM to evaluate the Coupling Coordination Degree (CCD) of various urban subsystems under different scenarios [35,36,37]. However, under different scenarios, the correlation between the level of urban sustainable development and the CCD of urban economic, social, and environmental subsystems has not been well studied. Zhang and Chen [38] used the CCDM to study the CCD between environmentally sustainable development and its subsystems in 17 cities in Shandong Province, China, and found that urban environmentally sustainable development is highly correlated with coordinated development among different subsystems, but their results did not involve different scenarios in cities.
As the country with the largest population and fastest urbanization in the world, China’s urban and rural construction and development have a profound impact on global sustainable development. In 2016, the Chinese government issued “China’s National Plan on Implementation of the 2030 Agenda for Sustainable Development”, which clearly proposed building the “National Innovation Demonstration Zone for the implementation of the 2030 Agenda for Sustainable Development” as one of the measures to implement the SDGs [39]. At present, the State Council has approved six cities to build National Innovation Demonstration Zones for the implementation of the 2030 Agenda for Sustainable Development. Among them, the city construction theme of Chengde is “sustainable development of water conservation functional zones in urban agglomerations”. As an important water source of Beijing City and Tianjin City, China, Chengde City is faced with economic, social, and environmentally sustainable development problems, such as weak economic development foundation, lagging infrastructure construction, and a fragile ecological environment [40]. Therefore, it is necessary to evaluate the sustainable development level of Chengde City, analyze the changes in the CCD of urban economy, society, and environment under different scenarios, explore the suitable development direction of the city, and provide suggestions and decision support for promoting the sustainable development of Chengde City, which has reference significance for the same type of city.
Taking Chengde City as an example, this study explores a comprehensive evaluation method combining scenario analysis and CCDM. First of all, on the basis of constructing an economy–society–environment index system for Chengde City, this study evaluates the sustainable development level of 11 district-level and county-level administrative regions of Chengde City. Secondly, the CCDM was used to compare the changes of CCD level under the business-as-usual scenario, economic-led scenario, social-led scenario, and environment-led scenario. Thirdly, this study explores the correlation between the level of urban sustainable development and the CCD of urban economic, social, and environmental subsystems under different scenarios, and proposes a reasonable development scenario that matches the city’s sustainable development level.

2. Materials and Methods

2.1. Study Area

Chengde City (115°54′ E–119°15′ E, 40°11′ N–42°40′ N) is located in northeastern China, in northeastern Hebei Province and is adjacent to Beijing City and Tianjin City to the south (Figure 1). It is 225 km from Beijing City and 300 km from Tianjin City. The total area of Chengde City is 39,500 km2, accounting for one-fifth of the total area of Hebei Province. The city’s total population is 3.35 million, of which ethnic minorities account for 46.39%. Chengde City includes 11 district-level and county-level administrative regions, of which Shuangqiao District (SQ), Shuangluan District (SL), and Yingshouyingzi Mining Area (YMA) are district-level administrative regions; the others are county-level administrative regions. Chengde City was approved to establish the National Innovation Demonstration Zone for the implementation of the 2030 Agenda for Sustainable Development in 2019. After more than two years of development, Chengde City has made progress in terms of industrial transformation and upgrading, infrastructure construction, and the sustainable utilization of water resources, and has accumulated experience in the transformation of sustainable development concepts at the city level [41].

2.2. Data Sources

Based on the statistical data of 11 district-level and county-level administrative regions in Chengde City from 2020, this study analyzes the level of sustainable development and the CCD of economic, social, and environmental subsystems in each administrative region. The evaluation indicators are selected from the “Chengde City Sustainable Development Plan (2018–2030)” [42], and the original data for each indicator come from the Chengde Municipal Science and Technology Bureau.

2.3. Methods

2.3.1. Index System

The “Chengde City Sustainable Development Plan (2018–2030)” builds a localized sustainable development index system including 34 indicators from four dimensions: innovation, the environment, economic development, and social progress [42]. The premise of sustainable urban development is to achieve the coordinated development of the three subsystems of the economy, society, and the environment. This paper reclassifies Chengde City’s localized index system from the dimensions of the economy, society, and the environment, and benchmarks against the United Nations’ SDGs. The economic dimension indicators are benchmarked against SDG1 (No Poverty), SDG8 (Decent Work and Economic Growth), and SDG9 (Industry, Innovation, and Infrastructure). The social dimension indicators are benchmarked against SDG3 (Good Health and Well-being), and SDG10 (Reduce Inequalities). The environmental dimension indicators are benchmarked against SDG6 (Clean Water and Sanitation), SDG11 (Sustainable Cities and Communities), SDG12 (Responsible Consumption and Production), and SDG15 (Life on Land). Considering the availability, completeness, correlation, and other characteristics of evaluation indicators, an economy–society–environment (ESE) index system for Chengde City (Table 1) is formed. The whole index system has two levels, in which there are 3 first-level indicators and 24 s-level indicators. These are divided into benefit and cost indicators. A benefit indicator indicates that the indicator has a positive feedback effect on the subsystem, and the higher the value, the stronger the promotion of sustainable development in this dimension. A cost indicator indicates that the indicator has a negative effect on the subsystem, and the higher the value, the more significant the negative effect on sustainable development.

2.3.2. Evaluation of Urban Sustainable Development Level

This study evaluates the sustainable development level of district and county-level administrative regions in Chengde City based on the comprehensive evaluation index model. In order to transform the actual performance values x i j into a uniform scale, the data were standardized using Equations (1) and (2) for obtaining the normalized indicator values [43].
Benefit indicator:
y i j = x i j max x i j   ( 0 < y i j 1 ) .
Cost indicator:
y i j = min x i j x i j   ( 0 < y i j 1 ) ,
where for indicator j of administrative region i , y i j represents the standardized value of the indicator, x i j represents the original value of the indicator, and max   x i j and min   x i j , respectively, indicate the maximum and minimum value of the indicator for each administrative region.
In the normalization process, the importance of each indicator to the final goal needs to be reflected in the weight. This study uses different weights for two levels of indicators. Among them, the first-level indicators are the economy, society, and the environment. As the 2030 Agenda for Sustainable Development emphasizes that the economy, society, and the environment are indivisible, they play a common role in supporting sustainable development [1]. Therefore, this study considers that the economy, society, and the environment are equally important, and assigns the same weight to the first-level indicators. The number of second-level indicators corresponding to each first-level indicator in the ESE index system of Chengde City constructed in this paper is different. An improvement in each second-level indicator leads to an improvement in the city’s overall situation, and so is mutually substitutable for an improvement in the overall score. In addition, each first-level indicator in this study is benchmarked against multiple SDGs. In order to ensure that all SDGs corresponding to the first-level indicators are treated fairly under the condition of equal weight of the first-level indicators, this study uses the same weight for the second-level indicators under each first-level indicator [44,45,46]. The weights of the three first-level indicators of the economy, society, and the environment are all 1.000. The second-level indicators are given weights under the first-level indicators: the weight W a of each second-level indicator under the economic dimension is 0.125, the weight W b of each second-level indicator under the social dimension is 0.250, and the weight W c of each second-level indicator in the environmental dimension is 0.083.
The comprehensive evaluation index of each dimension can be calculated via Equations (3)–(5), as follows [35]:
Economy dimension:
U 1 = j = 1 n y i j W a   ( 0 < U 1 1 ) .
Society dimension:
U 2 = j = 1 n y i j W b   ( 0 < U 2 1 ) .
Environment dimension:
U 3 = j = 1 n y i j W c   ( 0 < U 3 1 ) ,
where U 1 , U 2 , and U 3 represent the comprehensive evaluation index of the dimensions of the economy, society, and the environment, respectively; n represents the number of indicators in each field; and y i j represents the standardized value of indicator j for administrative region i . When U 1 , U 2 , or U 3 is larger, it indicates a higher level of sustainable development in this dimension.
Finally, we calculated the ESE system comprehensive evaluation index R i using Equation (6) [46]:
R i = ( U 1 × U 2 × U 3 ) 3 ( 0 < R i 1 ) ,
where R i represents the ESE system comprehensive evaluation score of administrative region i . A larger R i indicates a higher comprehensive level of sustainable development in the administrative region.

2.3.3. Urban Development Scenario

The National Innovation Demonstration Zone for the implementation of the 2030 Agenda for Sustainable Development is a main action from China to promote sustainable urban development. The “Chengde City Sustainable Development Plan (2018–2030)” clearly states: “by 2030, provide access to adequate, affordable, accessible basic public services for all, improving urban environment, with special attention to social harmony, and build as a model area for living and working around Beijing City and Tianjin City” [40]. The economy, society, and the environment are the three pillars of sustainable development. The “Chengde City Sustainable Development Plan (2018–2030)” clarifies the value orientation of “economic and social development” and “environmental governance”, which are closely related to “Chengde City National Economic and Social Development Fourteenth Five-Year Plan and 2035 Vision Outline”, and in line with the future urban development goals of Chengde City [47]. Based on the urban development goals of Chengde City, this study sets up four development scenarios and analyzes the CCD under different development scenarios. The business-as-usual scenario refers to the CCD of urban development without SDGs intervention. The economic-led scenario refers to the impact on the CCD of the various administrative regions of Chengde City when the three goals of SDG1, SDG8, and SDG9 are emphasized. The social-led scenario refers to the changes in the CCD among the administrative regions of Chengde City when the two goals of SDG3 and SDG10 that focus on social development are emphasized. The environment-led scenario refers to the impact on the CCD of the various administrative regions when the four goals of SDG6, SDG11, SDG12, and SDG15 that focus on environmental protection are emphasized.

2.3.4. Evaluation of Coupling Coordination Degree

This study uses the coupling degree model to reflect the trend of the subsystems of the economy, society, and the environment from disorder to order in the process of urban development. Through the comprehensive evaluation index of the dimensions of the economy, society, and the environment calculated above, the coupling degree of an ESE system can be defined as in Equation (7) [28]:
C = 3 × [ U 1 × U 2 × U 3 ( U 1 + U 2 + U 3 ) 3 ] 1 3 ( 0 C 1 ) ,
where C represents the degree of coupling. When C = 0 , the coupling degree is the lowest, indicating that the subsystems are in a disordered state. When C = 1 , the coupling degree is the highest, indicating that the subsystems develop in an orderly manner and reach a high level of coupling.
The coupling degree model only reflects the coupling state from order to disorder between the economy, society, and the environment, but cannot reflect the coordination degree of each subsystem. To solve the above problems, a CCDM is introduced, which is defined as follows [36]:
T = α U 1 + β U 2 + γ U 3
D = C × T .
In the above equations, T represents the comprehensive evaluation index of the ESE system and D is the degree of coupling coordination. α , β , and γ are weights to be determined. The weights reflect the importance of each subsystem in the overall system. The more important the role of the subsystem, the higher the weights to be determined correspondingly, and the sum of all weights is 1. In the system coupling, the contribution of other subsystems cannot be ignored too much. When there are multiple subsystems, the weights to be determined of a single subsystem can take the highest value of 0.5. According to the four urban development scenarios set up above, the weights to be determined are selected through the expert evaluation method. Four scenarios are compared in the model:
(1) Under the “business-as-usual scenario”, α = β = γ = 1 / 3 , (2) under the “economic-led scenario”, α = 1 / 2 , β = γ = 1 / 4 , (3) under the “social-led scenario”, α = γ = 1 / 4 , β = 1 / 2 , (4) under the “environment-led scenario”, α = β = 1 / 4 , γ = 1 / 2 . In this study, the coordinated development of urban ESE systems is divided into 10 levels, half coordinated and half unbalanced [38,48,49] (Table 2).

3. Results

3.1. Results of Urban Sustainable Development Evaluation

According to Equations (1)–(4), the comprehensive evaluation index of the dimensions of the economy, society, and the environment, and the ESE system comprehensive evaluation index in 11 district-level and county-level administrative regions of Chengde City, are calculated. The calculation results are shown in Table 3, and the evaluation results are illustrated in Figure 2.
As shown in Table 3, in the evaluation results of the ESE system comprehensive evaluation index of 11 administrative regions in Chengde City, XL and KMA achieved the best performance with the highest score (0.66). On the contrary, YMA, CD, and FMA were the three worst-performing administrative regions, with an evaluation score of 0.51. There was a large difference in the evaluation results of the economic and environmental dimensions of 11 administrative regions. In the evaluation results of the economic dimension, KMA obtained the highest value of 0.70 and YMA had the worst performance, with a value half that of KMA. In the evaluation results of the environmental dimension, XL and LH achieved the best performance with the highest value of 0.74, while SQ had the worst performance with an evaluation score of 0.39. The social dimension evaluation results of the 11 administrative regions had smaller differences, and the scores were higher compared with the economic and environmental dimensions. In the evaluation results of the social dimension, SL, SQ, LP, and XL achieved better performance and the evaluation value fluctuated approximately within a range 0.70–0.77. FMA had the worst performance, with the lowest point of 0.55.
As shown in Figure 2, among the 11 district-level and county-level administrative regions of Chengde City, except for KMA and SQ, the economic dimension evaluation results of the remaining administrative regions were significantly lower than their social and environmental dimension evaluation results. The social dimension evaluation results of SQ, SL, YMA, CD, PQ, and LP occupied a dominant position in the evaluation results of its three dimensions. The environmental dimension evaluation results of XL, LH, FMA, and WMMA were slightly higher than their economic and social dimension evaluation results.
The evaluation results of the social dimension of district-level administrative regions were significantly higher than in county-level administrative regions, but the difference between their evaluation results for the social dimension and the economic and environmental dimensions was also significantly larger than that of county-level administrative regions. Among the county-level administrative regions, PQ, FMA, KMA, and WMMA had smaller differences in the evaluation results of different dimensions.

3.2. Results of Coupling Coordination Degree Evaluation

Through Equations (5)–(7), the coupling degree in 11 administrative regions of Chengde City, as well as the CCD of the business-as-usual scenario, the economic-led scenario, the social-led scenario, and the environment-led scenario are calculated. The calculation results are shown in Table 4, and the evaluation results are illustrated in Figure 3.
As shown in Table 4 and Figure 3, the coupling degree of 11 administrative regions of Chengde City reached above 0.96, which were in the high-level coupling state. Overall, under the four scenarios, the CCD of the 11 administrative regions of Chengde City can be classified as among the three types of imminent imbalance, near coordination, and primary coordination. Compared with the business-as-usual scenario, the levels of CCD of 11 administrative regions under the economic-led scenario decreased significantly, and there was no significant difference in the levels of CCD in all administrative regions under the social-led and environment-led scenarios.
Specifically, under the business-as-usual scenario, the CCD of XL, PQ, LP, LH, and KMA reached the Primary Coordination level. Under the economic-led scenario, XL, LP, and KMA maintained the Primary Coordination level. Compared with the business-as-usual scenario, the CCD level of five administrative regions changed under the economic-led scenario. The level of CCD in YMA, CD, PQ, LH, and FMA decreased by one level. Among them, the CCD of YMA, CD, and FMA decreased from the near coordination level to the imminent imbalance level. PQ and LH decreased from the primary coordination level to the near coordination level. Under the social-led and environment-led scenarios, there was no change in the level of CCD in XL, PQ, LP, LH, and KMA, the same as the business-as-usual scenario. Compared with the business-as-usual scenario, only the CCD level of SL changed under the social-led scenario, transforming from near coordination level to primary coordination level. The level of CCD in the three administrative regions changed under the environment-led scenario compared with the business-as-usual scenario. Among them, the level of CCD in SL and WMMA increased from near coordination level to primary coordination level, and the CCD level of SQ decreased from near coordination level to imminent imbalance level.

3.3. Correlation between Urban Sustainable Development and Coupling Coordination Degree

Figure 4 illustrates the correlation between the level of urban sustainable development in different dimensions and the CCD under the four scenarios in 11 administrative regions of Chengde City. The figure combines Table 3 and Table 4, respectively, reporting the evaluation values.
As shown in Figure 4, XL, LP, and KMA reached the Primary Coordination level under the four scenarios. Combined with the evaluation results of the sustainable development level, the ESE system comprehensive evaluation index of XL, KMA, and LP was over 0.60, and in the sustainable development level of the economic, social, and environmental dimensions, the evaluation results of these administrative regions reached 0.60 or more in at least two dimensions. The CCD of the remaining administrative regions under the four scenarios fluctuated between two levels. The ESE system comprehensive evaluation index of these administrative regions fluctuated within a range 0.51–0.61, and there was a general difference between the three dimensions of sustainable development evaluation results.
Comparing the CCD of the 11 administrative regions under four scenarios, we see that they cannot achieve their best coordinated performance under the business-as-usual scenario. Under the economic-led scenario, the CCD of KMA was slightly higher than that of other scenarios, and KMA had a slightly better performance in economic sustainable development than in the social and environmental dimensions. Under the social-led scenario, the CCD of SQ, SL, YMA, CD, and PQ was the highest among the four scenarios. These administrative regions achieved significantly better performance in evaluation results for the social dimension than the economic and environmental dimensions. Under the environment-led scenario, the CCD of XL, LH, and WMMA was higher than for other scenarios, and these administrative regions achieved a significantly better performance in the environmental dimension than in the economic and social dimensions. LP and FMA reached the same CCD under the social-led scenario and environment-led scenario, and the two administrative regions had more similar sustainable development evaluation results in terms of the social and environmental dimensions.

4. Discussion and Conclusions

This study proposes an innovative method to measure the level of urban sustainable development and the CCD of urban subsystems under different scenarios by exploring the comprehensive evaluation method combining a scenario analysis and the CCDM. This method clarifies the correlation between the level of urban sustainable development and the CCD under different scenarios. The evaluation results can provide suggestions and decision support for exploring suitable urban development directions and promoting sustainable urban development.
The evaluation results show the following:
(1)
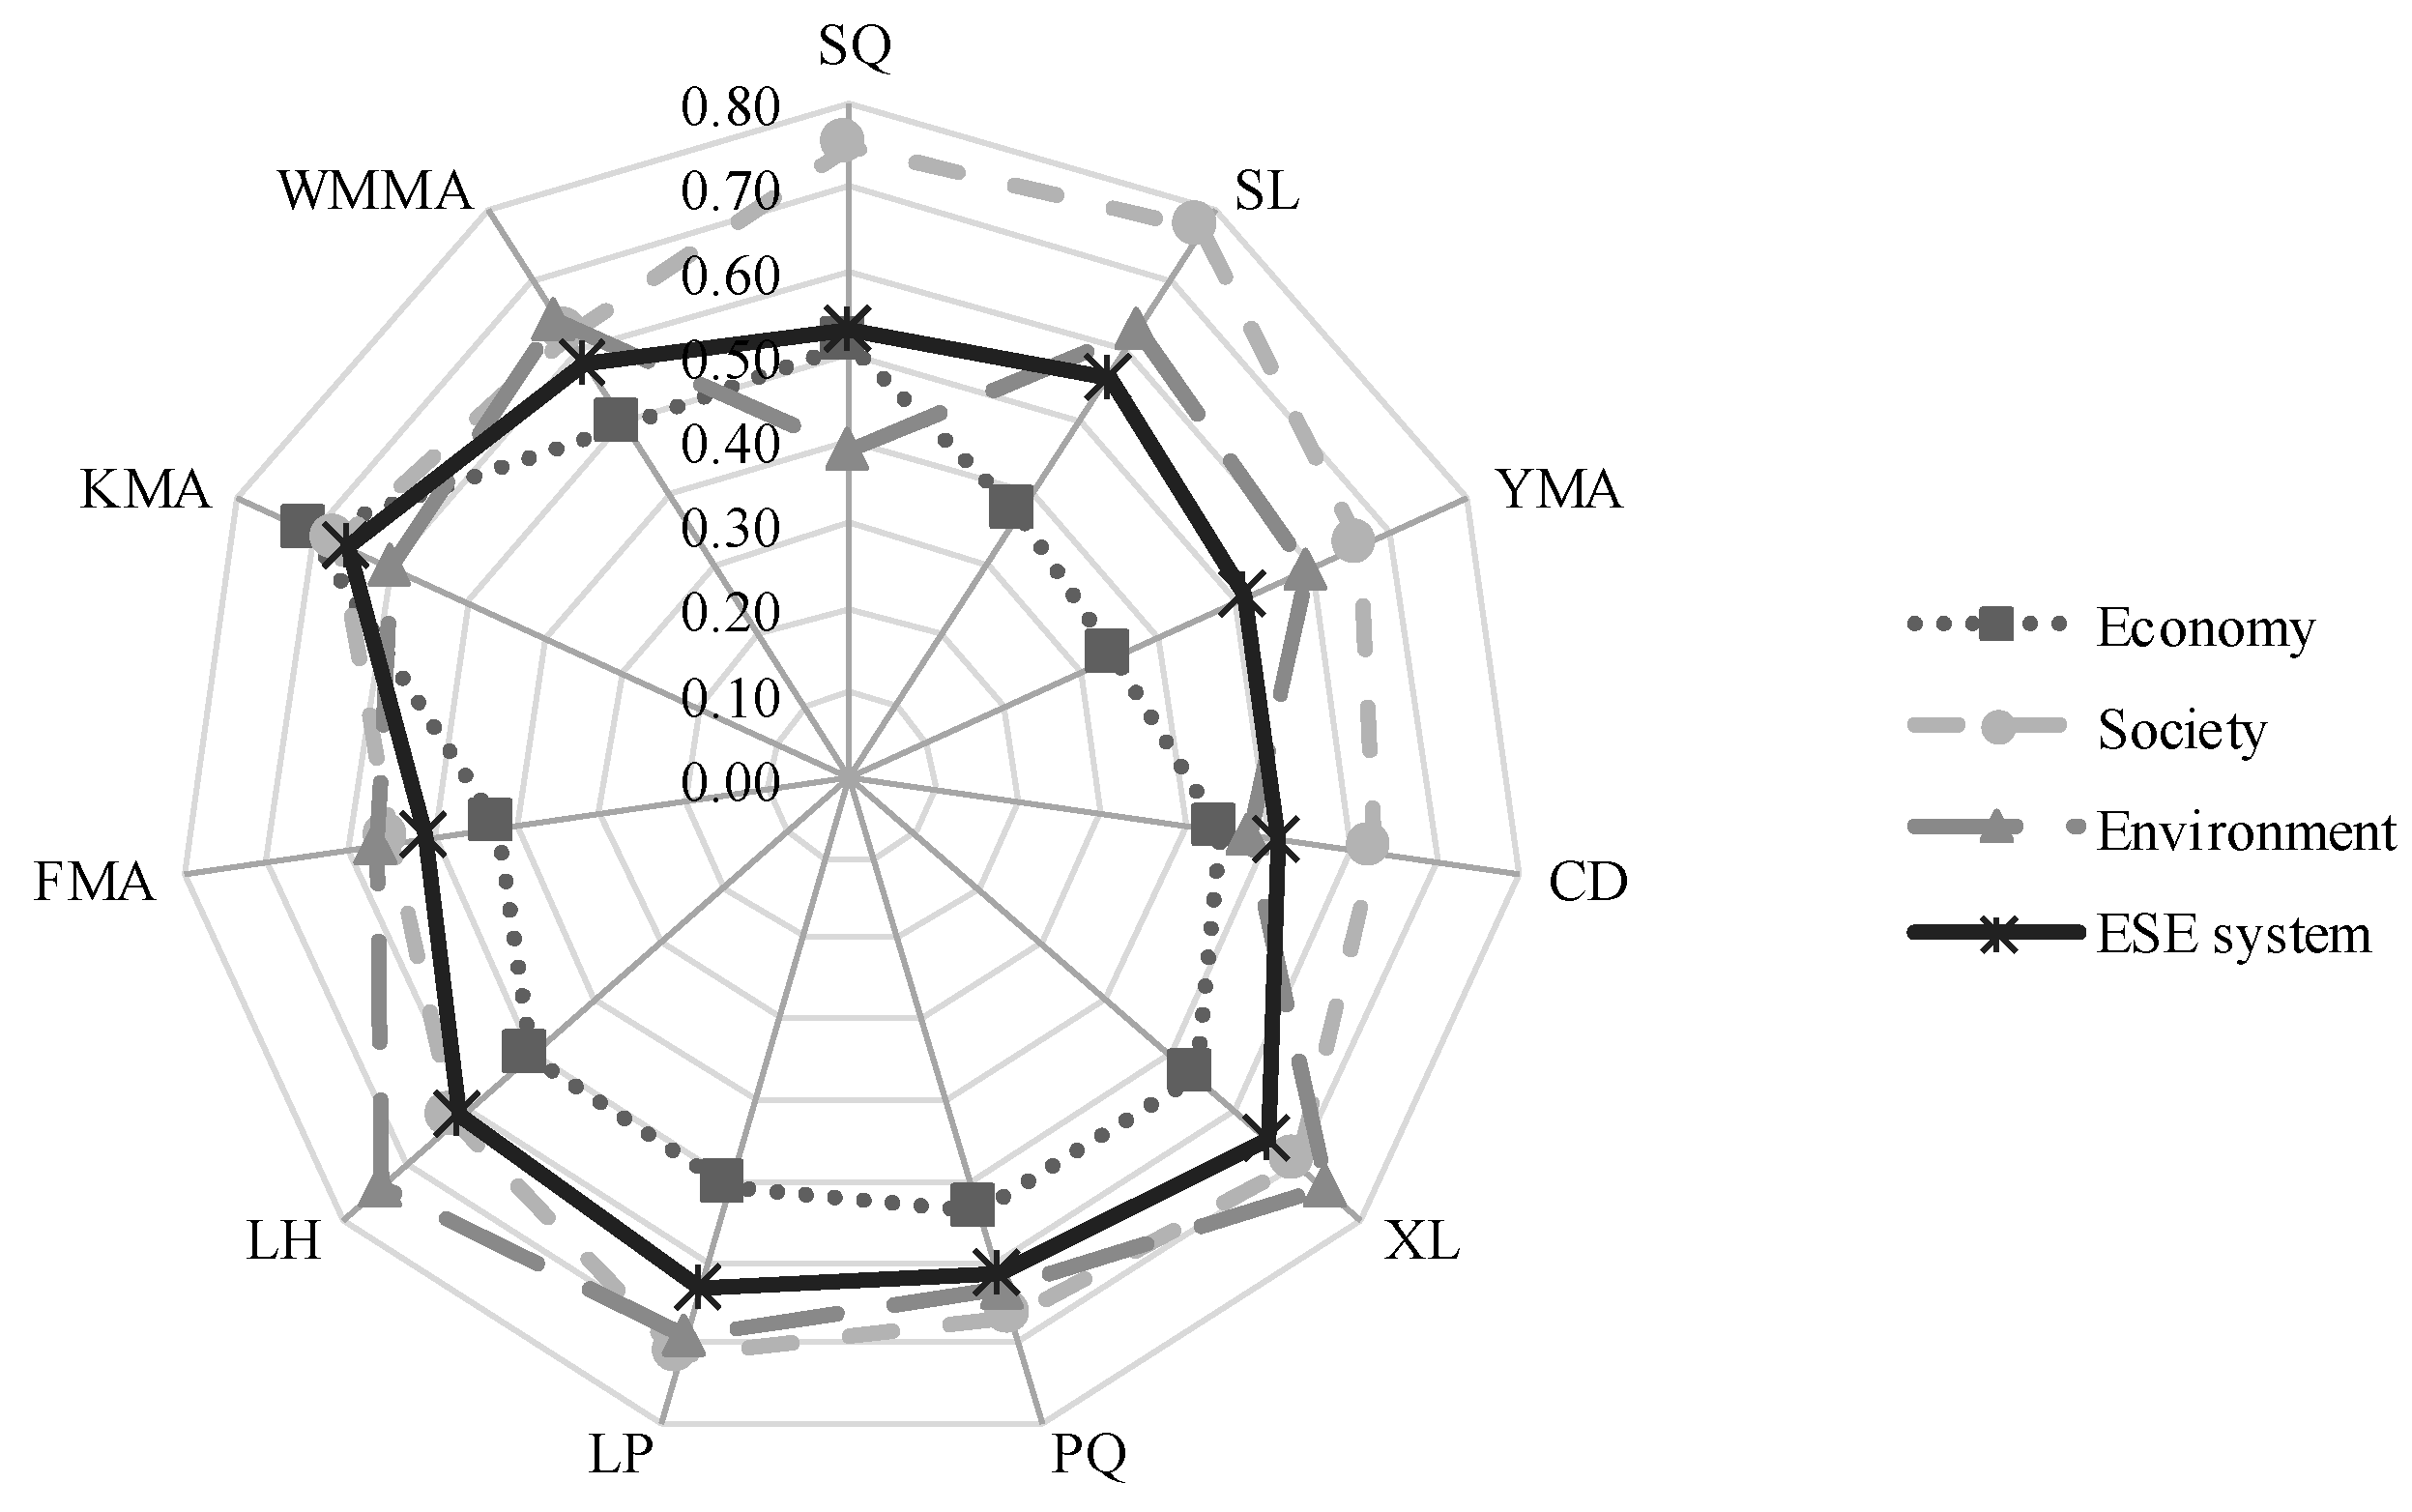
There was no significant difference in the evaluation results of the ESE system comprehensive evaluation index in 11 administrative regions of Chengde City. Comparing the different dimensions among the 11 administrative regions, there was a gap between the evaluation results of the economic dimension and the environmental dimension, and a small gap in the evaluation results of the social dimension. The evaluation results of the social dimension of district-level administrative regions were significantly higher than in county-level administrative regions, but the difference between their evaluation results for the social dimension and the economic and environmental dimensions was also significantly larger than that of county-level administrative regions.
(2)
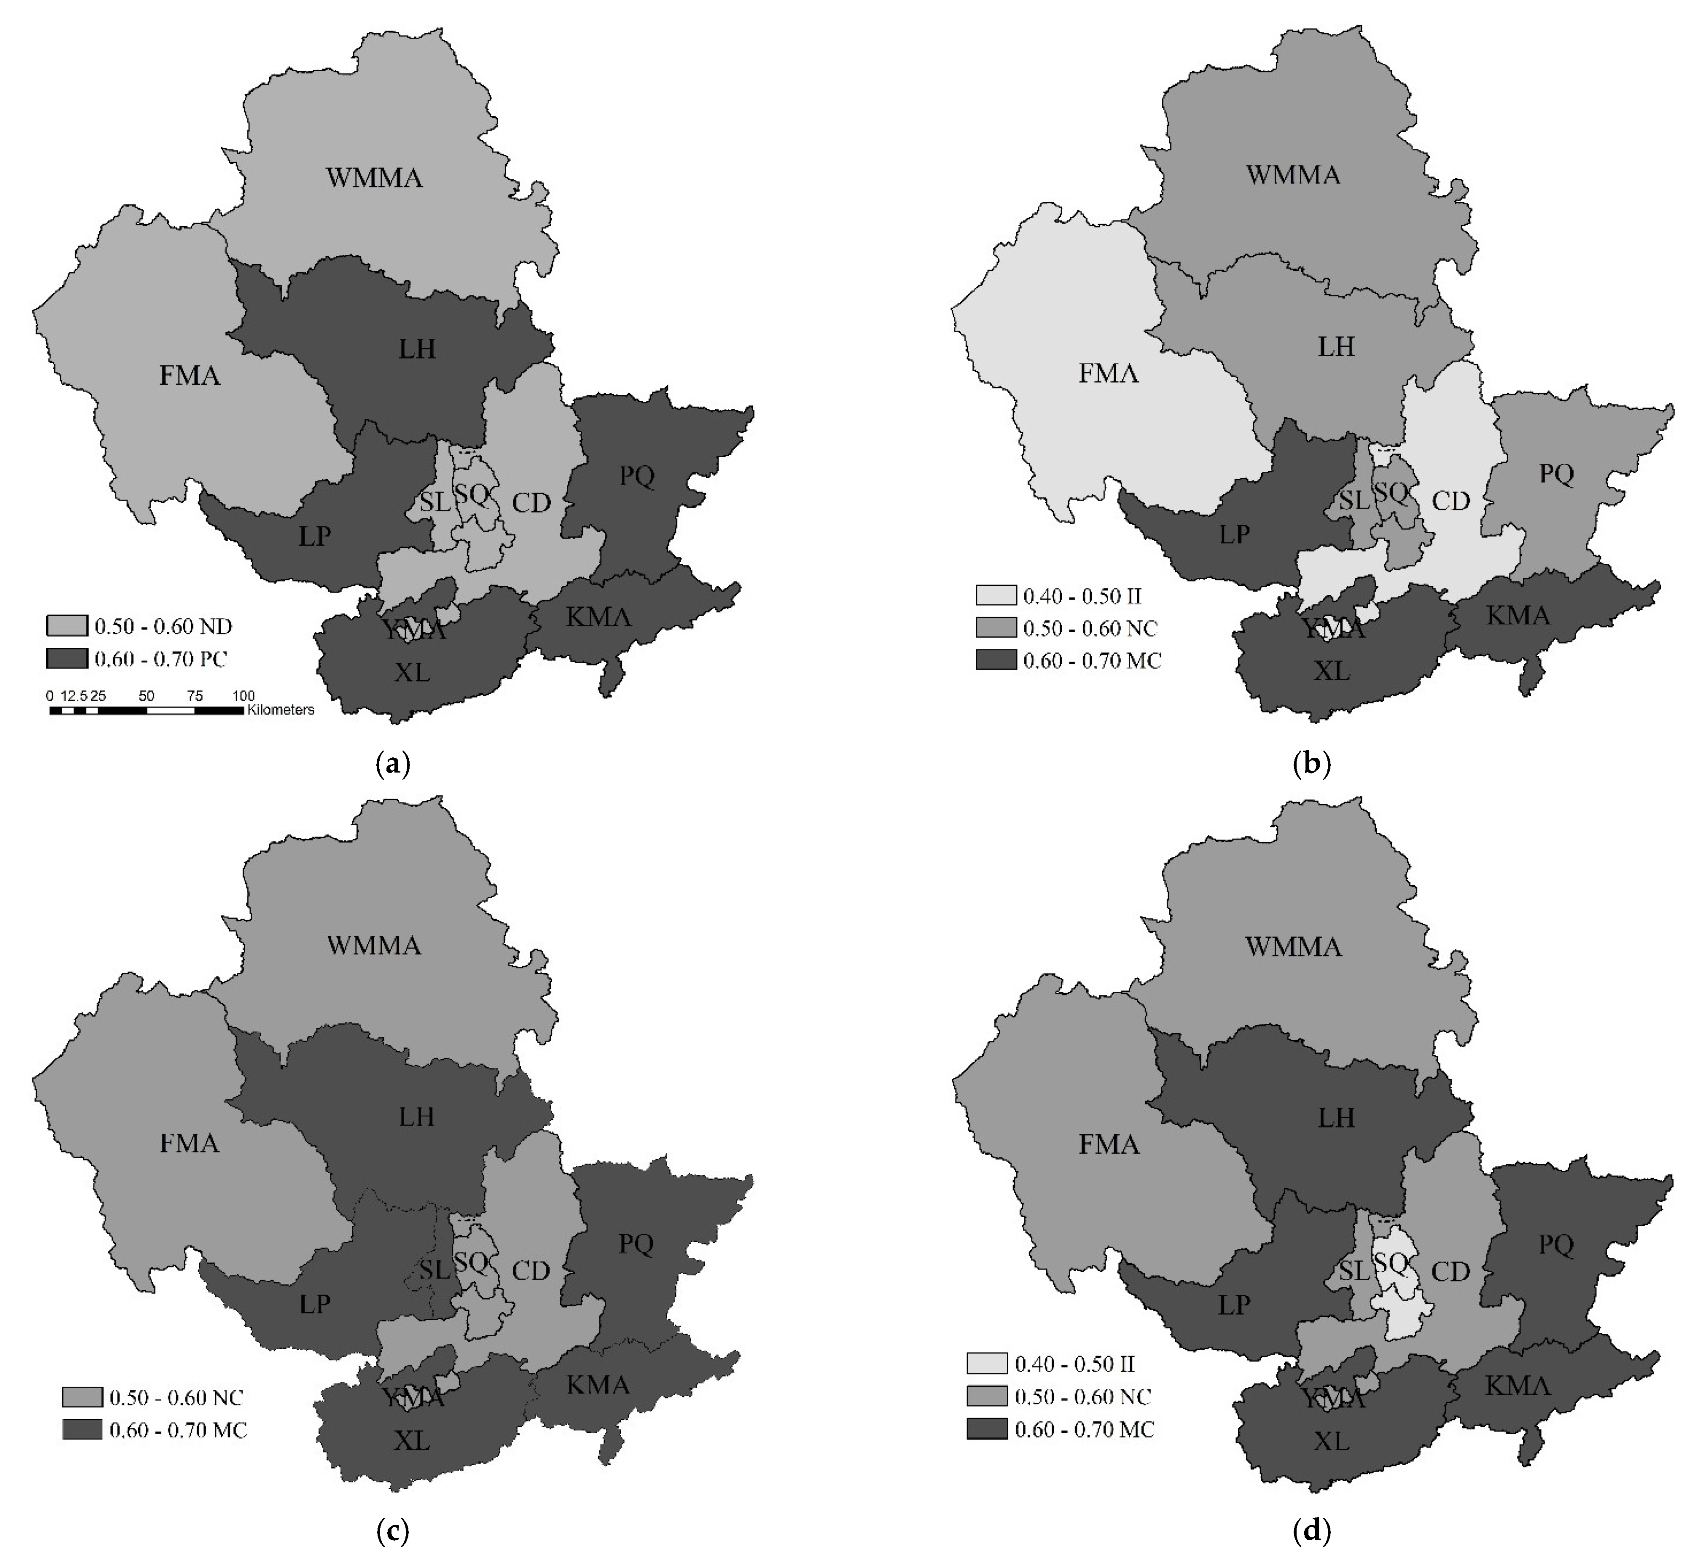
The CCD of 11 administrative regions in Chengde City was at the three levels of imminent imbalance, near coordination, and primary coordination under the four scenarios. Compared with the business-as-usual scenario, the CCD level of all administrative regions in Chengde City decreased significantly under the economic-led scenario, while there was no significant change in the level of CCD under the social-led scenario and environment-led scenario. For different types of administrative regions, under different scenarios, there is no significant correlation between the coupling coordination degree of each administrative region and the spatial differences in administrative regions.
(3)
Under the four scenarios, the CCD of three administrative regions of Chengde City reached the primary coordination level. These administrative regions obtained much higher scores in the evaluation results of the ESE system comprehensive evaluation index and achieved better performance in at least two dimensions. Under the business-as-usual scenario, the 11 administrative regions of Chengde City cannot achieve their best coordinated performance. Compared with the business-as-usual scenario, the changes in the CCD of all administrative regions under the remaining scenarios were positively correlated with the results of the sustainable development evaluation of the corresponding dimension.
It was found that the evaluation results of the economic dimension in the 11 administrative regions of Chengde City were generally lower than the evaluation results of the social and environmental dimensions in the evaluation process, especially in SL, YMA, XL, and XL. Among the four administrative regions, the evaluation score of YMA in the economic dimension was nearly half that of the social and environmental dimensions. The gap between the sustainable development level of the economic dimension and the social and environmental dimensions of Chengde City reflects the fact that, although all the administrative regions of Chengde City reached China’s poverty-eradication standard, restrictive factors, such as a weak development foundation, small economic aggregate, and lack of human resources, cannot be fundamentally changed in the short term [47]. Economic development is the driving force of sustainable development, but the administrative regions of Chengde City should avoid excessive promotion of urban economic development in the near future, give priority to promoting the transformation and upgrading of dominant industries, establish a talent introduction mechanism, enhance enterprise innovation capabilities, and promote industrial technological innovation. In addition, each administrative region can choose the corresponding dominant development scenario to improve the CCD level according to the level of sustainable development in the economic, social, and environmental dimensions. By giving play to comparative advantages, the dominant development scenario with a higher level of sustainable development is selected as the key development direction for the city.
For the evaluation of urban CCD, if the indicators are compared with consecutive years of data, the changing trends in the data can be better judged. Therefore, with the release of the index system data of Chengde City, the use of multiyear data can more accurately determine the spatiotemporal evolution rule of the urban CCD under different scenarios and predict the trend of the urban CCD, so as to propose the appropriate development direction of the city in a more targeted way, and provide decision support for local government. Second, although this study takes Chengde City as an example, the framework proposed in this study to measure the level of urban sustainable development and the CCD of urban subsystems under different scenarios has proven to be a method that can be generalized to other cities.

Author Contributions

Formal analysis, investigation, methodology, validation, writing-original draft preparation, Y.L.; conceptualization, methodology, writing—review and editing, supervision, X.Z.; writing—review and editing, supervision, X.G. All authors have read and agreed to the published version of the manuscript.

Funding

This research received no external funding.

Institutional Review Board Statement

Not applicable.

Informed Consent Statement

Not applicable.

Data Availability Statement

Restrictions apply to the availability of this data. Data were obtained from Chengde Municipal Science and Technology Bureau.

Acknowledgments

The authors would like to acknowledge Chengde Municipal Science and Technology Bureau for facilitating the data acquisition.

Conflicts of Interest

The authors declare no conflict of interest.

References

  1. United Nations. Transforming Our World: The 2030 Agenda for Sustainable Development. 2015. Available online: https://www.un.org/sustainabledevelopment/ (accessed on 5 May 2022).
  2. United Nations. New Urban Agenda. 2016. Available online: https://unhabitat.org/about-us/new-urban-agenda (accessed on 5 May 2022).
  3. Gao, X.X.; Zhang, X.T.; He, Z. Emergence of the urban goal and its practice: Background and progress of the SDG11. China Popul. Resour. Environ. 2021, 31, 144–154. (In Chinese) [Google Scholar]
  4. Zinkernagel, R.; Evans, J.; Neij, L. Applying the SDGs to Cities: Business as Usual or a New Dawn? Sustainability 2018, 10, 3201. [Google Scholar] [CrossRef] [Green Version]
  5. Khanjanasthiti, I.; Chandrasekar, K.S.; Bajracharya, B. Making the Gold Coast a Smart City—An Analysis. Sustainability 2021, 13, 10624. [Google Scholar] [CrossRef]
  6. Xue, B.; Liu, B.S.; Yang, Q.; Sun, X.Z. Formalizing an evaluation-prediction based roadmap towards urban sustainability: A case study of Chenzhou, China. Habitat Int. 2021, 112, 102376. [Google Scholar] [CrossRef]
  7. Wang, T.; Zhang, J.M.; Yu, X.; Liu, B.S.; Chen, P.Z. Sustainable development pathway of resource-based cities. China Popul. Resour. Environ. 2021, 31, 24–32. (In Chinese) [Google Scholar]
  8. Li, H.M.; Huang, X.; Xia, Q.; Jiang, Z.M. Dynamic Evaluation of Urban Sustainability Based on ELECTRE: A Case Study from China. Discret. Dyn. Nat. Soc. 2021, 3, 1–18. [Google Scholar] [CrossRef]
  9. Zinatizadeh, S.; Azmi, A.; Monavari, S.M.; Sobhanardakani, S. Evaluation and prediction of sustainability of urban areas: A case study for Kermanshah city, Iran. Cities 2017, 66, 1–9. [Google Scholar] [CrossRef]
  10. Yi, P.T.; Dong, Q.K.; Li, W.W. Evaluation of City Sustainability Using the Deviation Maximization Method. Sustain. Cities Soc. 2019, 50, 101529. [Google Scholar] [CrossRef]
  11. Xu, X.Y.; Zhang, Z.H.; Long, T.; Sun, S.M.; Gao, J. Mega-city region sustainability assessment and obstacles identification with GIS–Entropy–TOPSIS model: A case in Yangtze River Delta urban Agglomeration, China. J. Clean. Prod. 2021, 294, 126147. [Google Scholar] [CrossRef]
  12. Gao, J.L.; Shao, C.F.; Chen, S.H.; Zhang, X.T. Spatiotemporal Evolution of Sustainable Development of China’s Provinces: A Modelling Approach. Ecosyst. Health Sustain. 2021, 7, 1965034. [Google Scholar] [CrossRef]
  13. Chen, S.H.; Gao, J.L. SDG11 Evaluation. In China’s Implementation of Goal 11 of 2030 Agenda for Sustainable Development: Blue Book on Urban Human Settlements in China; Zhang, X.T., Zhang, C.W., Shao, C.F., Eds.; China City Press: Beijing, China, 2021; Volume 2, pp. 34–142. ISBN 978-7-5074-3408-8. [Google Scholar]
  14. Conticelli, E.; Gobbi, G.; Rosas, P.I.S.; Tondelli, S. Assessing the Performance of Modal Interchange for Ensuring Seamless and Sustainable Mobility in European Cities. Sustainability 2021, 13, 1001. [Google Scholar] [CrossRef]
  15. Magdolen, M.; von Behren, S.; Burger, L.; Chlond, B. Mobility Styles and Car Ownership—Potentials for a Sustainable Urban Transport. Sustainability 2021, 13, 2968. [Google Scholar] [CrossRef]
  16. Wang, Y.N.; Du, M.Y.; Zhou, L.; Cai, G.Y.; Bai, Y.L. A Novel Evaluation Approach of County-Level City Disaster Resilience and Urban Environmental Cleanliness Based on SDG11 and Deqing County Situation. Sustainability 2019, 11, 5713. [Google Scholar] [CrossRef] [Green Version]
  17. Sidek, L.M.; Jaafar, A.S.; Majid, W.H.A.W.A.; Basri, H.; Marufuzzaman, M.; Fared, M.M.; Moon, W.C. High-Resolution Hydrological-Hydraulic Modeling of Urban Floods Using InfoWorks ICM. Sustainability 2021, 13, 10259. [Google Scholar] [CrossRef]
  18. Zhong, Q.C.; Zhang, L.; Zhu, Y.; van den Bosch, C.K.; Han, J.G.; Zhang, G.L.; Li, Y.Z. A conceptual framework for ex ante valuation of ecosystem services of brownfield greening from a systematic perspective. Ecosyst. Health Sustain. 2020, 6, 1743206. [Google Scholar] [CrossRef] [Green Version]
  19. Shi, X.M.; Qin, M.Z.; Li, B.; Zhang, D. A Framework for Optimizing Green Infrastructure Networks Based on Landscape Connectivity and Ecosystem Services. Sustainability 2021, 13, 10053. [Google Scholar] [CrossRef]
  20. Bond, A.; Morrison-Saunders, A.; Pope, J. Sustainability assessment: The state of the art. Impact Assess. Proj. Apprais. 2012, 30, 53–62. [Google Scholar] [CrossRef]
  21. Singh, R.K.; Murty, H.R.; Gupta, S.K.; Dikshit, A.K. An overview of sustainability assessment methodologies. Ecol. Indic. 2012, 15, 281–299. [Google Scholar] [CrossRef]
  22. Zijp, M.C.; Heijungs, R.; van der Voet, E.; van de Meent, D.; Huijbregts, M.A.J.; Hollander, A.; Posthuma, L. An identification key for selecting methods for sustainability assessments. Sustainability 2015, 7, 2490–2512. [Google Scholar] [CrossRef] [Green Version]
  23. Muhammad, S.; Long, X.L.; Salman, M.; Dauda, L. Effect of urbanization and international trade on CO2 emissions across 65 Belt and Road Initiative Countries. Energy 2020, 196, 117102. [Google Scholar] [CrossRef]
  24. Balsalobre-Lorente, D.; Shahbaz, M.; Roubaud, D.; Farhani, S. How economic growth, renewable electricity and natural resources contribute to CO2 emissions? Energy Policy 2018, 113, 356–367. [Google Scholar] [CrossRef] [Green Version]
  25. Inthasaro, P.; Wu, W.M. One-dimensional Model of Water Quality and Aquatic Ecosystem/ecotoxicology in River Systems. In Advances in Water Resources Management; Wang, L.K., Yang, C.T., Wang, M.H., Eds.; Springer Publishers: Cham, Switzerland, 2016; pp. 247–292. ISBN 978-3-319-22924-9. [Google Scholar]
  26. Patil, R.R. Urbanization as a Determinant of Health: A Socioepidemiological Perspective. Soc. Work Public Health 2014, 29, 335–341. [Google Scholar] [CrossRef] [PubMed]
  27. Chen, M.X.; Huang, X.R.; Huang, G.Z.; Yang, Y.S. New urbanization and informal employment: Scale, pattern, and social integration. Prog. Geogr. 2021, 40, 50–60. (In Chinese) [Google Scholar] [CrossRef]
  28. Cong, X.N. Expression and Mathematical Property of Coupling Model, and Its Misuse in Geographical Science. Econ. Geogr. 2019, 4, 18–25. (In Chinese) [Google Scholar] [CrossRef]
  29. Li, W.W.; Yi, P.T. Assessment of city sustainability—Coupling coordinated development among economy, society and environment. J. Clean. Prod. 2020, 256, 120453. [Google Scholar] [CrossRef]
  30. Ma, L.B.; Chen, M.M.; Che, X.L.; Fang, F. Research on Population-Land-Industry Relationship Pattern in Underdeveloped Regions: Gansu Province of Western China as an Example. Sustainability 2019, 11, 2434. [Google Scholar] [CrossRef] [Green Version]
  31. Wang, Y.; Zhou, L.H. Assessment of the coordination ability of sustainable social-ecological systems development based on a set pair analysis: A case study in Yanchi county, China. Sustainability 2016, 8, 733. [Google Scholar] [CrossRef] [Green Version]
  32. Tomal, M. Evaluation of coupling coordination degree and convergence behaviour of local development: A spatiotemporal analysis of all Polish municipalities over the period 2003–2019. Sustain. Cities Soc. 2021, 71, 102992. [Google Scholar] [CrossRef]
  33. Cui, D.; Liu, H.H.; Xiao, Y.; Cui, J.J.; Wu, D.T. Spatiotemporal Evolution and the Driving Forces of the Coupling Coordination Degree between Urbanization and Urban Residents’ Livelihood Level in Mongolia. Sustainability 2019, 11, 781. [Google Scholar] [CrossRef] [Green Version]
  34. Chu, N.; Zhang, P.; Wu, X. Spatiotemporal evolution characteristics of urbanization and its coupling coordination degree in Russia—Perspectives from the population, economy, society, and eco-environment. Environ. Sci. Pollut. Res. 2022, 1–18. [Google Scholar] [CrossRef]
  35. Cui, D.; Chen, X.; Xue, Y.L.; Zeng, W.H. An integrated approach to investigate the relationship of coupling coordination between social economy and water environment on urban scale—A case study of Kunming. J. Environ. Manag. 2019, 234, 189–199. [Google Scholar] [CrossRef] [PubMed]
  36. Xing, L.; Xue, M.G.; Hu, M.S. Dynamic simulation and assessment of the coupling coordination degree of the economy–resource–environment system: Case of Wuhan City in China. J. Environ. Manag. 2019, 230, 474–487. [Google Scholar] [CrossRef] [PubMed]
  37. Song, Q.J.; Zhou, N.; Liu, T.L.; Siehr, S.A.; Qi, Y. Investigation of a “coupling model” of coordination between low-carbon development and urbanization in China. Energy Policy 2018, 121, 346–354. [Google Scholar] [CrossRef] [Green Version]
  38. Zhang, D.N.; Chen, Y. Evaluation on urban environmental sustainability and coupling coordination among its dimensions: A case study of Shandong Province, China. Sustain. Cities Soc. 2021, 75, 103351. [Google Scholar] [CrossRef]
  39. Ministry of Foreign Affairs of the People’s Republic of China. China’s National Plan on Implementation of the 2030 Agenda for Sustainable Development. 2016. Available online: http://www.gov.cn/xinwen/2016-10/13/content_5118514.htm (accessed on 5 May 2022).
  40. Chengde Municipal People’s Government. Chengde National Sustainable Development Agenda Innovation Demonstration Zone Construction Plan (2018–2020). 2019. Available online: http://kxjsj.chengde.gov.cn/art/2019/8/20/art_1562_130849.html (accessed on 5 May 2022). (In Chinese)
  41. Chengde Municipal People’s Government. Chengde Municipal Government Work Report in 2021. Available online: http://www.chengde.gov.cn/art/2021/2/3/art_360_683800.html (accessed on 5 May 2022). (In Chinese)
  42. Chengde Municipal People’s Government. Chengde City Sustainable Development Plan (2018–2030). 2019. Available online: http://kxjsj.chengde.gov.cn/art/2019/8/20/art_1562_130847.html (accessed on 5 May 2022). (In Chinese)
  43. Li, M.J.; Chen, G.H.; Chen, Y.T. Study on target standardization method of comprehensive evaluation. Chin. J. Manag. Sci. 2004, 12, 49–52. (In Chinese) [Google Scholar] [CrossRef]
  44. Sustainable Development Solutions Network. SDG Index and Dashboards Report 2017. 2017. Available online: https://www.sdgindex.org/reports/sdg-index-and-dashboards-2017/ (accessed on 5 May 2022).
  45. Zhu, J.; Sun, X.Z.; He, Z. Research on China’s sustainable development evaluation indicators in the framework of SDGs. China Popul. Resour. Environ. 2018, 28, 9–18. (In Chinese) [Google Scholar]
  46. Li, C.Y.; Zhang, S.Q. Chinese provincial water-energy-food coupling coordination degree and influencing factors research. China Popul. Resour. Environ. 2020, 30, 120–128. (In Chinese) [Google Scholar]
  47. Chengde Municipal People’s Government. Chengde City National Economic and Social Development Fourteenth Five-Year Plan and 2035 Vision Outline. 2021. Available online: http://www.chengde.gov.cn/art/2021/6/15/art_360_760807.html (accessed on 5 May 2022). (In Chinese)
  48. Ren, B.P.; Du, Y.X. Coupling coordination of economic growth, industrial development and ecology in the Yellow River Basin. China Popul. Resour. Environ. 2021, 31, 119–129. (In Chinese) [Google Scholar]
  49. Ren, X.P.; Yin, Z.Y. Spatial-temporal coupling and driving factors of provincial population agglomeration, public resource allocation and service industry development in China. China Popul. Resour. Environ. 2019, 29, 77–86. (In Chinese) [Google Scholar]
Figure 1. (a) Chengde City’s location in China and (b) the division of Chengde City into district-level and county-level administrative regions (image obtained from China National Platform for Common Geospatial Information Service and processed by the author). Note: SQ, Shuangqiao District; SL, Shuangluan District; YMA, Yingshouyingzi Mining Area; CD, Chengde County; XL, Xinglong County; PQ, Pingquan City; LP, Luanping County; LH, Longhua County; FMA, Fengning Manchu Autonomous County; KMA, Kuancheng Manchu Autonomous County; WMMA, Weichang Manchu and Mongolian Autonomous County.
Sustainability 14 06790 g001
Figure 2. Comparison with evaluation results of urban sustainable development on different dimensions in 11 administrative regions of Chengde City. Note: SQ, Shuangqiao District; SL, Shuangluan District; YMA, Yingshouyingzi Mining Area; CD, Chengde County; XL, Xinglong County; PQ, Pingquan City; LP, Luanping County; LH, Longhua County; FMA, Fengning Manchu Autonomous County; KMA, Kuancheng Manchu Autonomous County; WMMA, Weichang Manchu and Mongolian Autonomous County.
Sustainability 14 06790 g002
Figure 3. CCD under four scenarios in 11 administrative regions of Chengde City (image processed by ArcGIS.). (a) Business-as-usual Scenario; (b) Economic-led Scenario; (c) Social-led Scenario; (d) Environment-led Scenario. Note: SQ, Shuangqiao District; SL, Shuangluan District; YMA, Yingshouyingzi Mining Area; CD, Chengde County; XL, Xinglong County; PQ, Pingquan City; LP, Luanping County; LH, Longhua County; FMA, Fengning Manchu Autonomous County; KMA, Kuancheng Manchu Autonomous County; WMMA, Weichang Manchu and Mongolian Autonomous County.
Sustainability 14 06790 g003
Figure 4. Correlation between the evaluation results of urban sustainable development on different dimensions and CCD under four scenarios in 11 administrative regions of Chengde City. Note: SQ, Shuangqiao District; SL, Shuangluan District; YMA, Yingshouyingzi Mining Area; CD, Chengde County; XL, Xinglong County; PQ, Pingquan City; LP, Luanping County; LH, Longhua County; FMA, Fengning Manchu Autonomous County; KMA, Kuancheng Manchu Autonomous County; WMMA, Weichang Manchu and Mongolian Autonomous County.
Sustainability 14 06790 g004
Table 1. ESE index system of Chengde City.
DimensionIndicatorUnitPropertySDG
EconomyGDP per capita10,000
Chinese Yuan
BenefitSDG1
Proportion of GDP generated by value-added of service industry%BenefitSDG8
Tourism income per capitaChinese YuanBenefit
Water consumption per 10,000 Chinese yuan of GDPm3/10,000
Chinese Yuan
Cost
Ratio of R&D expenditure in the whole society to GDP%BenefitSDG9
Value-added of high-tech industry above designated size accounts for the proportion of value-added of industry%Benefit
Contribution rate of scientific and technological progress%Benefit
Proportion of citizens with basic scientific quality%Benefit
SocietyNumber of hospital beds per 10,000 peopleUnitBenefitSDG3
Number of old-age beds per 1000 elderly populationUnitBenefit
Per capita disposable income of urban residentsChinese YuanBenefitSDG10
Per capita disposable income of rural residentsChinese YuanBenefit
EnvironmentAmount of groundwater mining per square kilometers100 million m3CostSDG6
Amount of surface water controlling per square kilometers100 million m3Benefit
Rate of sewage treatment%Benefit
Annual average concentration of PM2.5 in urban areasμg/m3CostSDG11
Annual COD emission decreased by a proportion compared with 2015%Benefit
Annual NH3-N emission decreased by a proportion compared with 2015%Benefit
Rate of household waste treatment in rural areas%Benefit
Resource utilization rate of manure from livestock and poultry farm %BenefitSDG12
Amount of fertilizer applicationkg/667 m2Cost
Usage of agrochemical pesticideg/667 m2Cost
Rate of forest coverage%BenefitSDG15
Rate of water and soil loss controlling %Benefit
Table 2. Classification criteria of CCD.
Imbalance TypeCoordination Type
0.00 D < 0.10 Extreme imbalance 0.50 D < 0.60 Near Coordination
0.10 D < 0.20 Serious imbalance 0.60 D < 0.70 Primary Coordination
0.20 D < 0.30 Moderate imbalance 0.70 D < 0.80 Moderate Coordination
0.30 D < 0.40 Mild imbalance 0.80 D < 0.90 Good Coordination
0.40 D < 0.50 Imminent Imbalance 0.90 D 1.00 Extreme Coordination
Table 3. The evaluation results of urban sustainable development of 11 administrative regions of Chengde City in different dimensions.
Administrative RegionsESE SystemEconomy DimensionSociety DimensionEnvironment Dimension
Shuangqiao District (SQ)0.530.510.740.39
Shuangluan District (SL)0.590.430.770.64
Yingshouyingzi
Mining Area (YMA)
0.510.350.660.59
Chengde County (CD)0.510.440.630.48
Xinglong County (XL)0.660.540.700.74
Pingquan City (PQ)0.610.540.670.64
Luanping County (LP)0.630.510.720.69
Longhua County (LH)0.610.510.620.74
Fengning Manchu Autonomous County (FMA)0.510.420.550.57
Kuancheng Manchu Autonomous County (KMA)0.660.700.670.60
Weichang Manchu and Mongolian Autonomous County (WMMA)0.580.500.620.65
Table 4. The coupling degree and CCD under four scenarios in 11 administrative regions of Chengde City.
Administrative RegionsCoupling DegreeCoupling Coordination Degree
Business-as-Usual ScenarioEconomic-Led ScenarioSocial-Led ScenariosEnvironment-Led Scenarios
Shuangqiao District (SQ)0.960.530.520.580.49
Shuangluan District (SL)0.970.590.550.630.60
Yingshouyingzi
Mining Area (YMA)
0.960.510.470.540.53
Chengde County (CD)0.990.510.490.540.50
Xinglong County (XL)0.990.660.630.670.68
Pingquan City (PQ)0.990.610.590.630.62
Luanping County (LP)0.990.630.600.650.65
Longhua County (LH)0.990.610.590.610.64
Fengning Manchu Autonomous County (FMA)0.990.510.490.520.52
Kuancheng Manchu Autonomous County (KMA)0.990.660.670.660.64
Weichang Manchu and Mongolian Autonomous County (WMMA)0.990.580.560.590.60
Publisher’s Note: MDPI stays neutral with regard to jurisdictional claims in published maps and institutional affiliations.

