1. Introduction
With the gradual development of global carbon emission reduction actions, vigorously developing renewable energy has become an inevitable choice in the new situation. Renewable energy has the advantage of being clean and pollution-free. It has many defects such as instability and difficulty in storage which urgently need corresponding energy storage technology innovation to match. Compressed air energy storage (CAES) is one of the most promising large-scale energy storage technologies. Compared with pumped hydroelectric storage (PHS), CAES is not limited by water source and is a better choice for efficient storage and utilization of clean energy [
1].
Today, two existing commercial CAES plants are in operation: a 290 MW unit built in Huntorf, Germany, in 1978, and a 110 MW unit built in McIntosh, AL, USA, in 1991 [
2]; the monitoring data of their successful operation bring some valuable validation data for the research related to compressed air energy storage caverns [
3]. The research and development progress on energy storage technologies in China has also developed more rapidly [
4]. The grid connection of the Feicheng salt cavern advanced CAES plant was realized in 2021 [
5]. Other caverns, such as salt caverns [
6], abandoned mine caverns [
7], underground aquifers [
8], and artificial rock-lined caverns [
9], can also be used as gas storage design alternatives. Moreover, compared with natural reservoir caverns, artificial caverns with lining, which are more flexible in site selection and more adaptable to the design of large-scale energy storage, are one of the preferred options for achieving energy storage in the future.
Kushnir et al. [
10] derived an analytical solution for the temperature and pressure variation of the air in the cavern in adiabatic mode. Then, the theoretical solution for the thermodynamics of the cavern in the heat transfer model was derived based on the air mass and energy conservation equations considering the heat transfer at the cavern wall. It significantly affects the air temperature and pressure variation compared to the adiabatic model [
11]. Many scholars also cite this calculation model, and the calculation results are compared with the test data of the Huntorf power station [
12]. Kim et al. [
13] applied TOUGH-FLAC to study the thermodynamic and mechanical response of lined caverns, and Zhou et al. [
14] calculated the heat–flow–solid (THM) coupling process of lined caverns based on COMSOL. Many thermodynamic simulations of CAES caverns show that the temperature field inside the air storage caverns is unevenly distributed and may form extremely high temperatures locally, which poses a significant threat to the lining and surrounding rocks [
15]. At the same time, the gas inside the cavern may produce significant temperature fluctuations during the cyclic gas filling and discharging process of the air storage caverns. Under the coupling effect of cyclic temperature and stress, the chambers are prone to thermal stress disasters and safety risks in long-term operation [
16]. One of the significant problems of CAES systems is the air temperature rise or fall during the compression or expansion operation, resulting in low efficiency. Some works of literature describe enhancing heat transfer by implementing thermal management measures [
17]. Others use numerical and experimental methods to characterize fluid flow patterns and heat transfer behavior at the local level [
18,
19,
20]. GOUDA proposed a 3D CFD model to simulate the air compression process to achieve near-isothermal operation [
21]. It is essential to carry out a thermodynamic simulation of the cavern chamber filling and discharging process and to intervene manually in the possible extreme temperature conditions to realize piezo gas storage power generation [
22].
In order to gain insight into the thermodynamic and mechanical response of the operation process of CAES caverns, many countries internationally have carried out experimental cavern tests. Ishihata et al. [
23] tested the sealability of a deeply buried underground gas storage reservoir with a test air pressure of 0.9 MPa. However, the test results showed severe cracking of the sealing layer. Swedish scholars GEISSBÜ conducted AA-CAES demonstration plant gas storage adiabatic mode thermal storage test. Due to concrete plug leakage, the air pressure only reached 7 bar, and the thermodynamic response was consistent with the simulation results [
24]. An underground lined rock cavern for small-scale pressure gas storage tests as a storage reservoir was tested by Kim. At 100 m underground burial depth, the radius of the cylindrical tunnel designed for gas storage was 2.5 m, and the maximum gas storage pressure was 5 MPa [
13]. It is a tremendous challenge for a compressed air energy storage plant to determine whether the test can be conducted for high internal pressure in an underground storage cavern without guaranteeing leakage.
Taking the exploration tunnel of Pingjiang Pumped Storage Plants in Hunan Province, China’s first underground gas storage test cavern with a shallowly buried lining of hard rock has been reconstructed to realize the gas storage test with a high internal pressure of 10 MPa. In this paper, we would like to develop a temperature field analysis model for a model underground high-pressure air storage cavern, analyze the temperature fluctuation law of the gas filling and discharging process, and design a heat transfer system in the cavern. Based on thermodynamic, heat transfer, and numerical heat transfer methods, air charging and discharging and heat transfer performance tests in the cavern will be conducted.
3. Numerical Models of Thermodynamic Processes
3.1. Modeling
The simplified axisymmetric numerical calculation physical model was established according to the CAES cavern structure diagram shown in
Figure 2. Considering the low thermal conductivity and small thermal diffusivity of the surrounding rock and concrete layer and the limited influence of the air temperature change in the cavern, the surrounding rock, and concrete areas were simplified to a certain extent. The calculation results had little affection. Because of the small calculation area, the calculation speed would be accelerated, and the calculation cost would be saved. The calculated thickness of the surrounding rock and the cylindrical concrete layer was 1000 mm and 480 mm, respectively.
The charging–maintaining–discharging of the underground CAES cavern was a complex thermodynamic process coupled with multiple physical phenomena, as shown in
Figure 2. The process includes: air compression (charging process)/expansion (discharging process) in the cavern, convection heat transfer between high-pressure air and the wall of the glass fiber-reinforced plastic cylinder, heat conduction inside the solid area such as the glass fiber-reinforced plastic cylinder, concrete layer and surrounding rock, the area absorbs or releases heat due to its heat capacity, as well as convection heat exchange with the outside air in the FRP door area. Considering that the air pressure and temperature fields in the cavern were approximately uniform, a simplified thermodynamic equilibrium equation could be adopted to obtain the internal air’s average temperature and pressure. The solid region heat conduction model was coupled to form a complete thermodynamic model of the air storage cavern.
In order to study the thermodynamic process of the gas and solid in the cavern during different charging and discharging processes, numerical simulations were carried out for different charging and discharging flow rates (1000 Nm3/h, 500 Nm3/h). The initial temperature field was set to 298 K. Before charging, the pressure of the cavern was 0.1 MPa, and the maximum air pressure was about 10.0 MPa. The gas storage time was two hours, and then the gas was released at (1000 Nm3/h, 500 Nm3/h) until the pressure in the cave was close to 0.1 MPa.
According to the conservation of energy, the change of the total internal energy of the air in the cavern is equal to the total enthalpy of the charged/discharged air and the coupled heat transfer between the cylinder wall and the air:
where
is the unit internal energy of air,
is the total volume of air at the current moment,
is the unit enthalpy of air,
is the air flow rate, which is negative when discharged,
is the convective heat transfer coefficient between the wall of the cavern and the air,
is the air temperature,
is the average temperature of the cavern surface,
is the coupling heat exchange between the cavern surface and the air, and
.
From Equation (1), the unit internal energy change can be obtained as:
High pressure air temperature increment can be obtained as:
The unit internal energy, temperature, and density of the gas at the moment
are:
The pressure value of the compressed air can be calculated by the Peng–Robinson equation:
where
is the universal gas constant and
,
is the air temperature in the critical state and
,
is the air pressure in the critical state and
,
is the eccentricity factor and
,
is the unit molar volume of air and
,
is the air molar mass and
.
In solid areas, such as glass fiber-reinforced plastic cylinders, concrete lining, surrounding rock, and steel doors, the temperature change can be obtained by solving the two-dimensional axisymmetric unsteady heat conduction energy equation:
where
is the thermal conductivity,
is the density,
is the internal heat source, which is taken as 0 in this project, the
direction is the radial, and the x-direction is the axial direction.
The boundary condition settings include thermal boundary conditions for the solid region, where the outer surfaces of the surrounding rock and concrete can be set as isothermal wall boundary conditions:
where
= 298 K is the ambient temperature.
The outer surface of the steel door can be set as the convective heat transfer boundary condition:
where
is the convective heat transfer coefficient between the steel door and the air in the access hole, which can be taken as a constant,
The inner surface of the FRP cylinder is the convection heat transfer boundary condition of the inner surface of the FRP cylinder and can be described as:
where
is the average convective heat transfer coefficient between the wall and the compressed air. According to the formula for the heat transfer coefficient of gas-filled convection in a closed storage tank proposed by Heath et al. [
25] and Bourgeois et al. [
26], the heat exchange system can be calculated by the following formula:
where
is the Nusselt number, the first term on the right is the convective heat transfer effect, which is related to the size of the inlet pipe, and the second term is the natural convection heat transfer effect, which is related to the Rayleigh number
. The outgassing process only needs to consider the effects of natural convection.
The relationship between the convective heat transfer coefficient and
can be described as:
The above equations can be compiled into the fluent two-dimensional axisymmetric solid thermal conductivity model through a user-defined function (UDF), and the values can be updated after the calculation of each time step to realize the calculation of the temperature field in the entire cavern area.
3.2. Simulated Result
The variation law of air average temperature, inner cavern surface average temperature, and air pressure over time in the whole process obtained by numerical calculation is shown in
Figure 3. It can be seen that the whole process is divided into the charging stage, the pressure-holding stage, the discharging stage, and the stop stage. The temperature and pressure changes in each stage have apparent characteristics.
The average air pressure rises steadily during the charging process. For the two charging and discharging processes with a flow rate of 1000 Nm3/h and 500 Nm3/h, the time used to charge the air with 10 MPa is 9542 s and 19,684 s, respectively. The air and cavern temperature increases rapidly at the beginning of the charging, especially in the first 100~200 s. Due to the low air pressure and small total mass in the storage cavern, the compression effect is powerful, and the air temperature rises rapidly from 25 °C to about 50 °C. After that, the air temperature gradually slowed down due to the relative weakening of the compression effect and the combined effect of the high-temperature air on the increase of heat dissipation on the cavern surface. At the end of the charging, the average air temperature reached 62.5 °C and 52.4 °C, and the average cavern surface temperature reached 58.0 °C and 49.4 °C, respectively. In the pressure-holding stage, the inlet pipe is neither filled with air nor released and does not perform work on the air.
At this time, since the air with a higher temperature continues to dissipate heat to the wall with a lower temperature, the average temperature of the air begins to drop continuously, and the inner cavern surface passes the heat through. The heat is transferred to the lower temperature solid area, and the average temperature of the inner cavern surface also continues to drop and gradually approaches the air temperature. After the holding stage, the average air temperature is 43.0 °C and 40.3 °C, respectively, and the average wall temperature is 41.9 °C and 39.5 °C. As the average air temperature dropped, the air pressure in the cave also dropped slightly. During the discharging stage, the average temperature and pressure of the air in the cave dropped rapidly.
Moreover, the air temperature drops rapidly below the average temperature of the inner cavern surface. The cavern surface begins to provide heat for the air, but the heat transfer from the cavern surface is limited. At the end of the discharging stage, the air pressure drops to 0.1 MPa (due to the pressure gradient on the outlet pipe under actual conditions, the pressure in the cavern should be slightly higher than the atmospheric pressure). According to the equation of state, a decrease in air pressure results in a decrease in temperature, and the rate of temperature decrease is proportional to the rate of decrease in air pressure. The average air temperature drops to −40.4 °C and −20.9 °C, and the average temperature of the inner cavern decreases to 1.9 °C and 8.5 °C, respectively. The hot cylinder cavern and surrounding rock heat the air at the stop stage. Both air temperature and pressure increase slightly. The slower the discharging rate, the more heat the compressed air gets from the cavern surface and surrounding rock, and the lower the rate of air temperature drop. It can be seen from the simulation of the air storage process that the temperature in the cavern during the charging and discharging process fluctuates wildly, which brings security risks to the safety and stability of the cavern. It is necessary to control the heat transfer of the air temperature in the cavern.
4. Heat Exchange System Design
Figure 4 shows the schematic diagram of thermodynamics in the air storage cavern with a heat exchange circulation system. With the influx of external air during the charging process, the internal energy gradually increases with air temperature. Part of the heat is transferred to the FRP cylinder through the convection heat exchange between the cavern surface and the air, and then it dissipates through the FRP cylinder and the concrete. Another part of the heat is transferred to the circulating cooling water in the tube. The heated circulating cooling water loses heat through the circulating cooling tower. During the discharging process, the internal energy and air temperature gradually decrease with the release of the air. Due to the temperature difference, the cavern surface and the hot water in the tube transfer heat to the air. In order to maintain the stable air temperature in the cavern, the outside (cavern surface or heat exchange tube) needs to transfer a certain amount of heat to the air or take away a certain amount of heat.
The energy conservation equation for the whole thermodynamic system can be expressed as:
where
is the convective heat transfer coefficient of the heat exchange tube wall, and
is the temperature of the water in the heat exchange tube.
Therefore, the heat transferred from the hot water in the heat exchange tube to the air can be obtained:
where
is the heat transfer from the cavern surface to the air,
is the total internal energy change of the air in the tube,
is the total mass change of air,
is the internal energy change per unit of air,
is the energy of the outlet air.
Assuming the air temperature control in the cylinder is stable at 25 °C, which means the temperature change is equal to 0 and the temperature difference between the cavern surface and the air is also kept at 0, the heat transferred from the cavern surface to the air is close to zero:
In order to keep the air temperature stable, the heat exchange power that the heat exchange tube needs to provide should satisfy the following equation:
The additional heat required from the heat exchanger piping to maintain a constant air temperature of 25 °C at different pressures is essentially the same. The heating powers for different flow rates are between 30.4 kW~30.7 kW (1000 Nm3/h) and 15.2 kW~15.3 kW (500 Nm3/h), respectively.
Typical finned heat exchanger tube dimensions are shown in
Figure 5.
The heat exchange power can be calculated as:
where
is the heat exchange power,
is the thermal resistance of the water in the tube and
,
is the convective heat transfer coefficient between water and the inner wall of the heat exchange tube and
,
is the thermal resistance of the tube,
is the external thermal resistance.
According to the Gnielinski equation, the turbulent convective heat transfer Nussle number,
, can be calculated as [
27]:
where the friction factor f can be calculated the turbulent flow resistance coefficient and
.
The fluid resistance in a straight tube section can be calculated as:
The thermal resistance of the tube be calculated as:
where
is thermal conductivity of the tube.
The outer surface of the tube can be calculated according to natural convection, and the convection intensity can be characterized by the Grashof number
:
where
is the density (kg/m
3),
is the viscosity (kg/ms),
is gravity acceleration (m/s
2),
is the thermal expansion coefficient,
is the temperature of the air (K), and
is the temperature of the tube (K).
The Nussle number,
, and the heat transfer coefficient,
, can be calculated as:
where
and
are constants, when
,
and
; when
,
; when
,
and
.
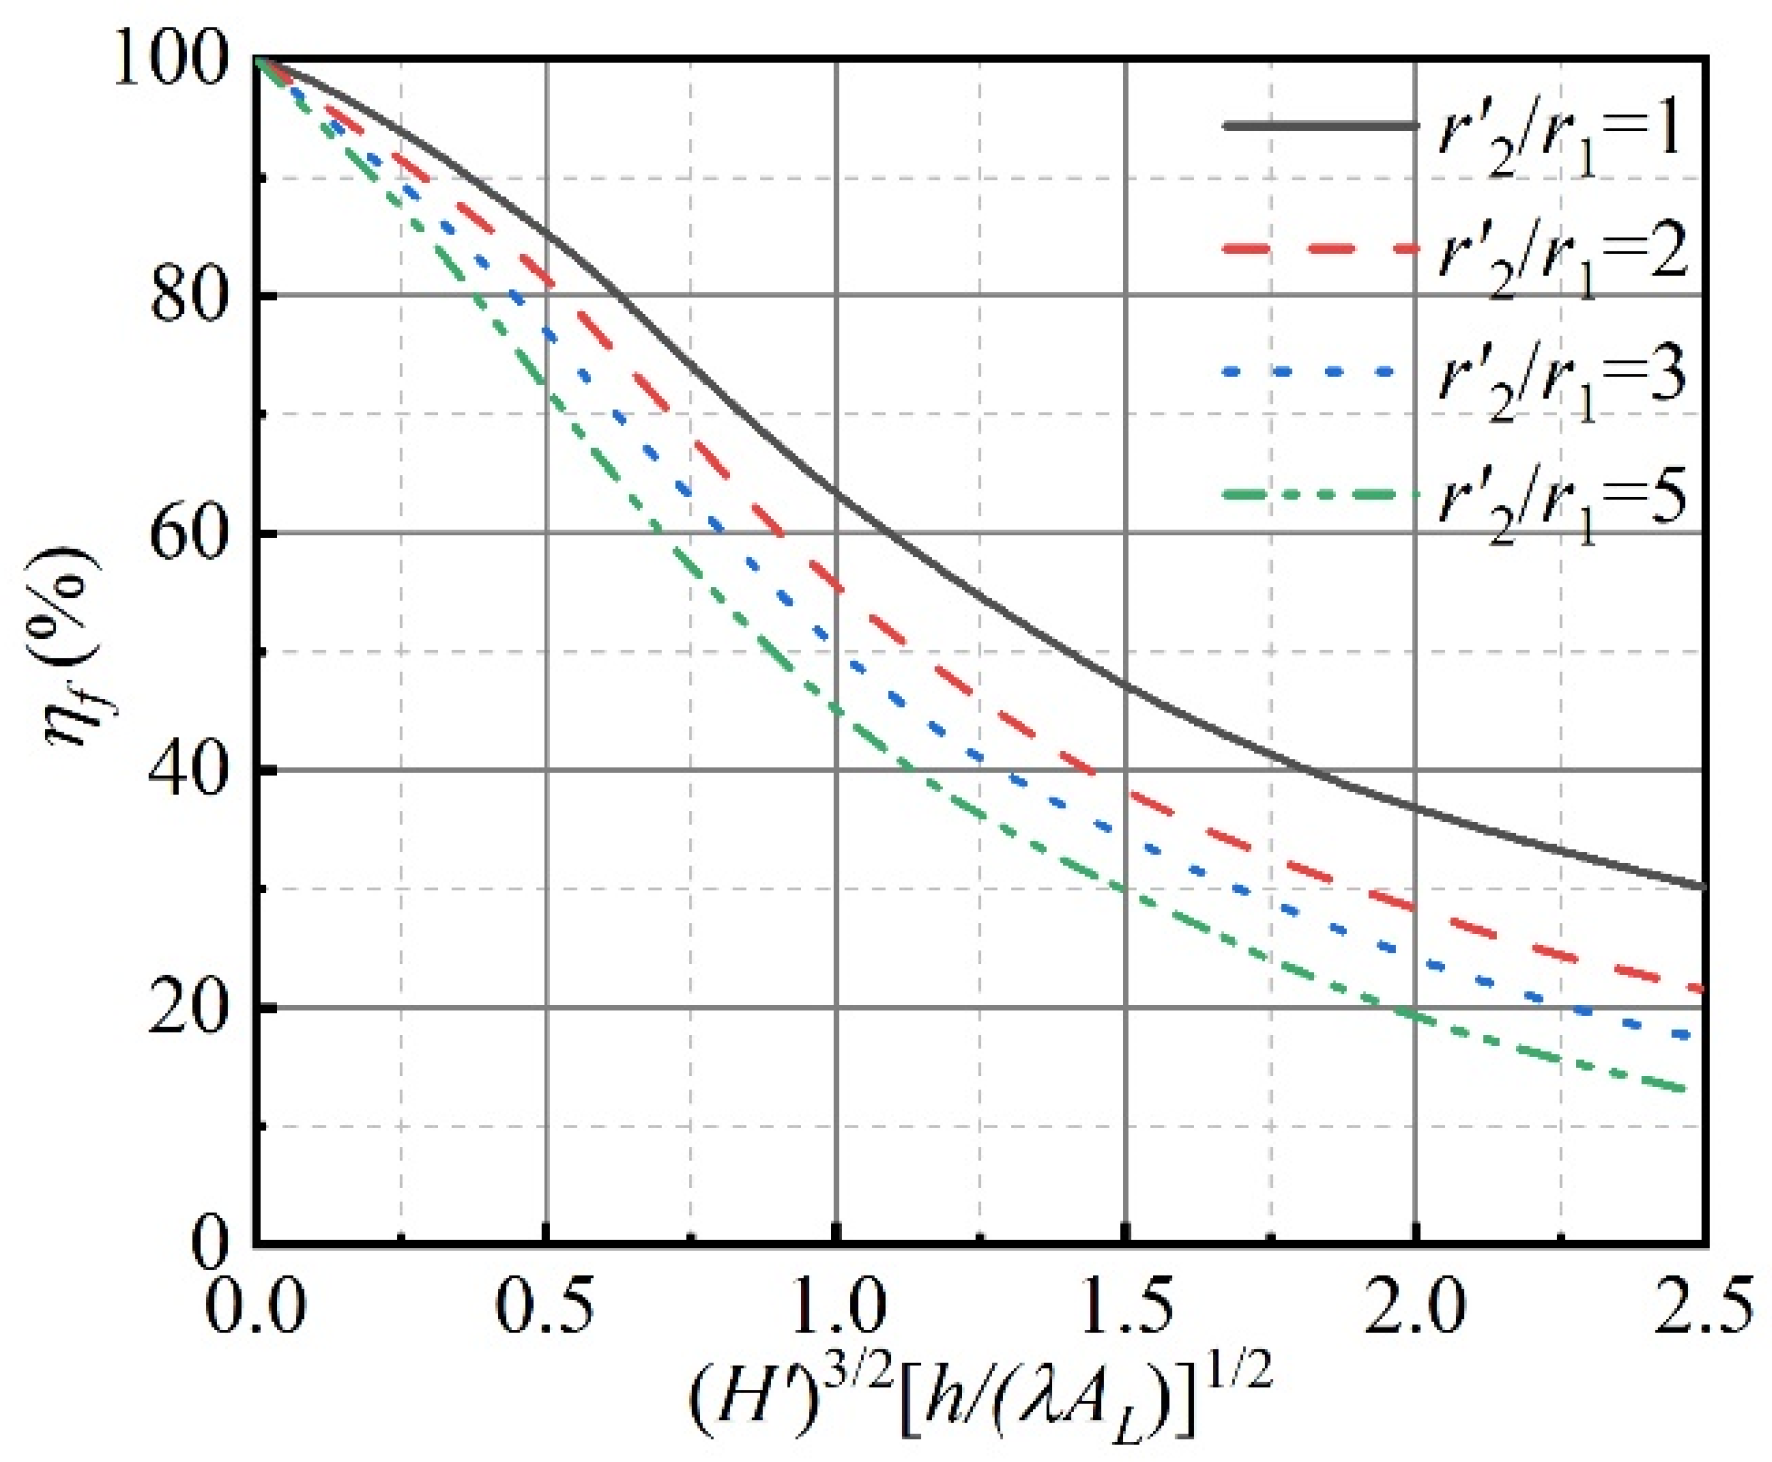
The fin efficiency
can be obtained through
Figure 6 [
28]:
where
,
,
,
.
The external thermal resistance
can be obtained as:
where
is the outside surface area of tube and
,
is the fin area and
,
is the outside diameter of the tube,
is the inside diameter of the tube,
is the tube length,
P is the fin spacing, and
is the fin height.
The heat exchange heat is all carried out by the circulating cooling water, and the internal energy added by the circulating water at the inlet and outlet is equal to the heat exchange power:
The heat exchange area can be maintained by increasing the number of tubes. The water circuit can be divided into N processes in parallel to control the flow speed and reduce the flow resistance to less than 50 kPa.
The flow of each waterway can be obtained as:
where
is the water flow rate.
Two types of finned tubes with fin height H = 12 mm, fin thickness
δ = 0.5 mm, fin pitch P = 6 mm, and tube thickness (
r2 −
r1) = 8 mm are selected (pipe outer diameter is 50 mm and 40 mm, respectively) to calculate the required heat exchange area and waterway loss. The two-way parallel connection method is adopted, and the air temperature, water temperature difference, and water flow rate are 25 °C, 4 °C, and 6.6 t/h, respectively. The calculation results are shown in
Figure 7.
It can be seen from
Figure 7 that the tube temperature decreases significantly with the increase of pressure. The higher the circulating water temperature, the higher the tube’s temperature. The heat transfer coefficient also increases as the pressure increases, and the higher the water temperature, the greater the heat transfer coefficient. The outer surface area of the tube, the number of ribs, and the fluid resistance decrease rapidly and then slowly with the increase of pressure.
Two schemes have been calculated here to ensure the efficient operation of the heat exchange system. Based on a two-way parallel finned tube system with a single tube length of 4 m, the number of loop tubes needs to be 10 and 13, respectively, for a tube diameter of 50 mm and 40 mm. To provide circulating hot water through an electric heater, it should meet the following requirements: the electric heater must meet the heating power of not less than 47 kW (considering the heat dissipation loss outside the cave), and the heating temperature should not be lower than 50 °C. The water volume of the pump is not less than 10.0 t h−1, and the water head should be equal to the flow resistance of the tube outside the cavern plus 50 kPa.
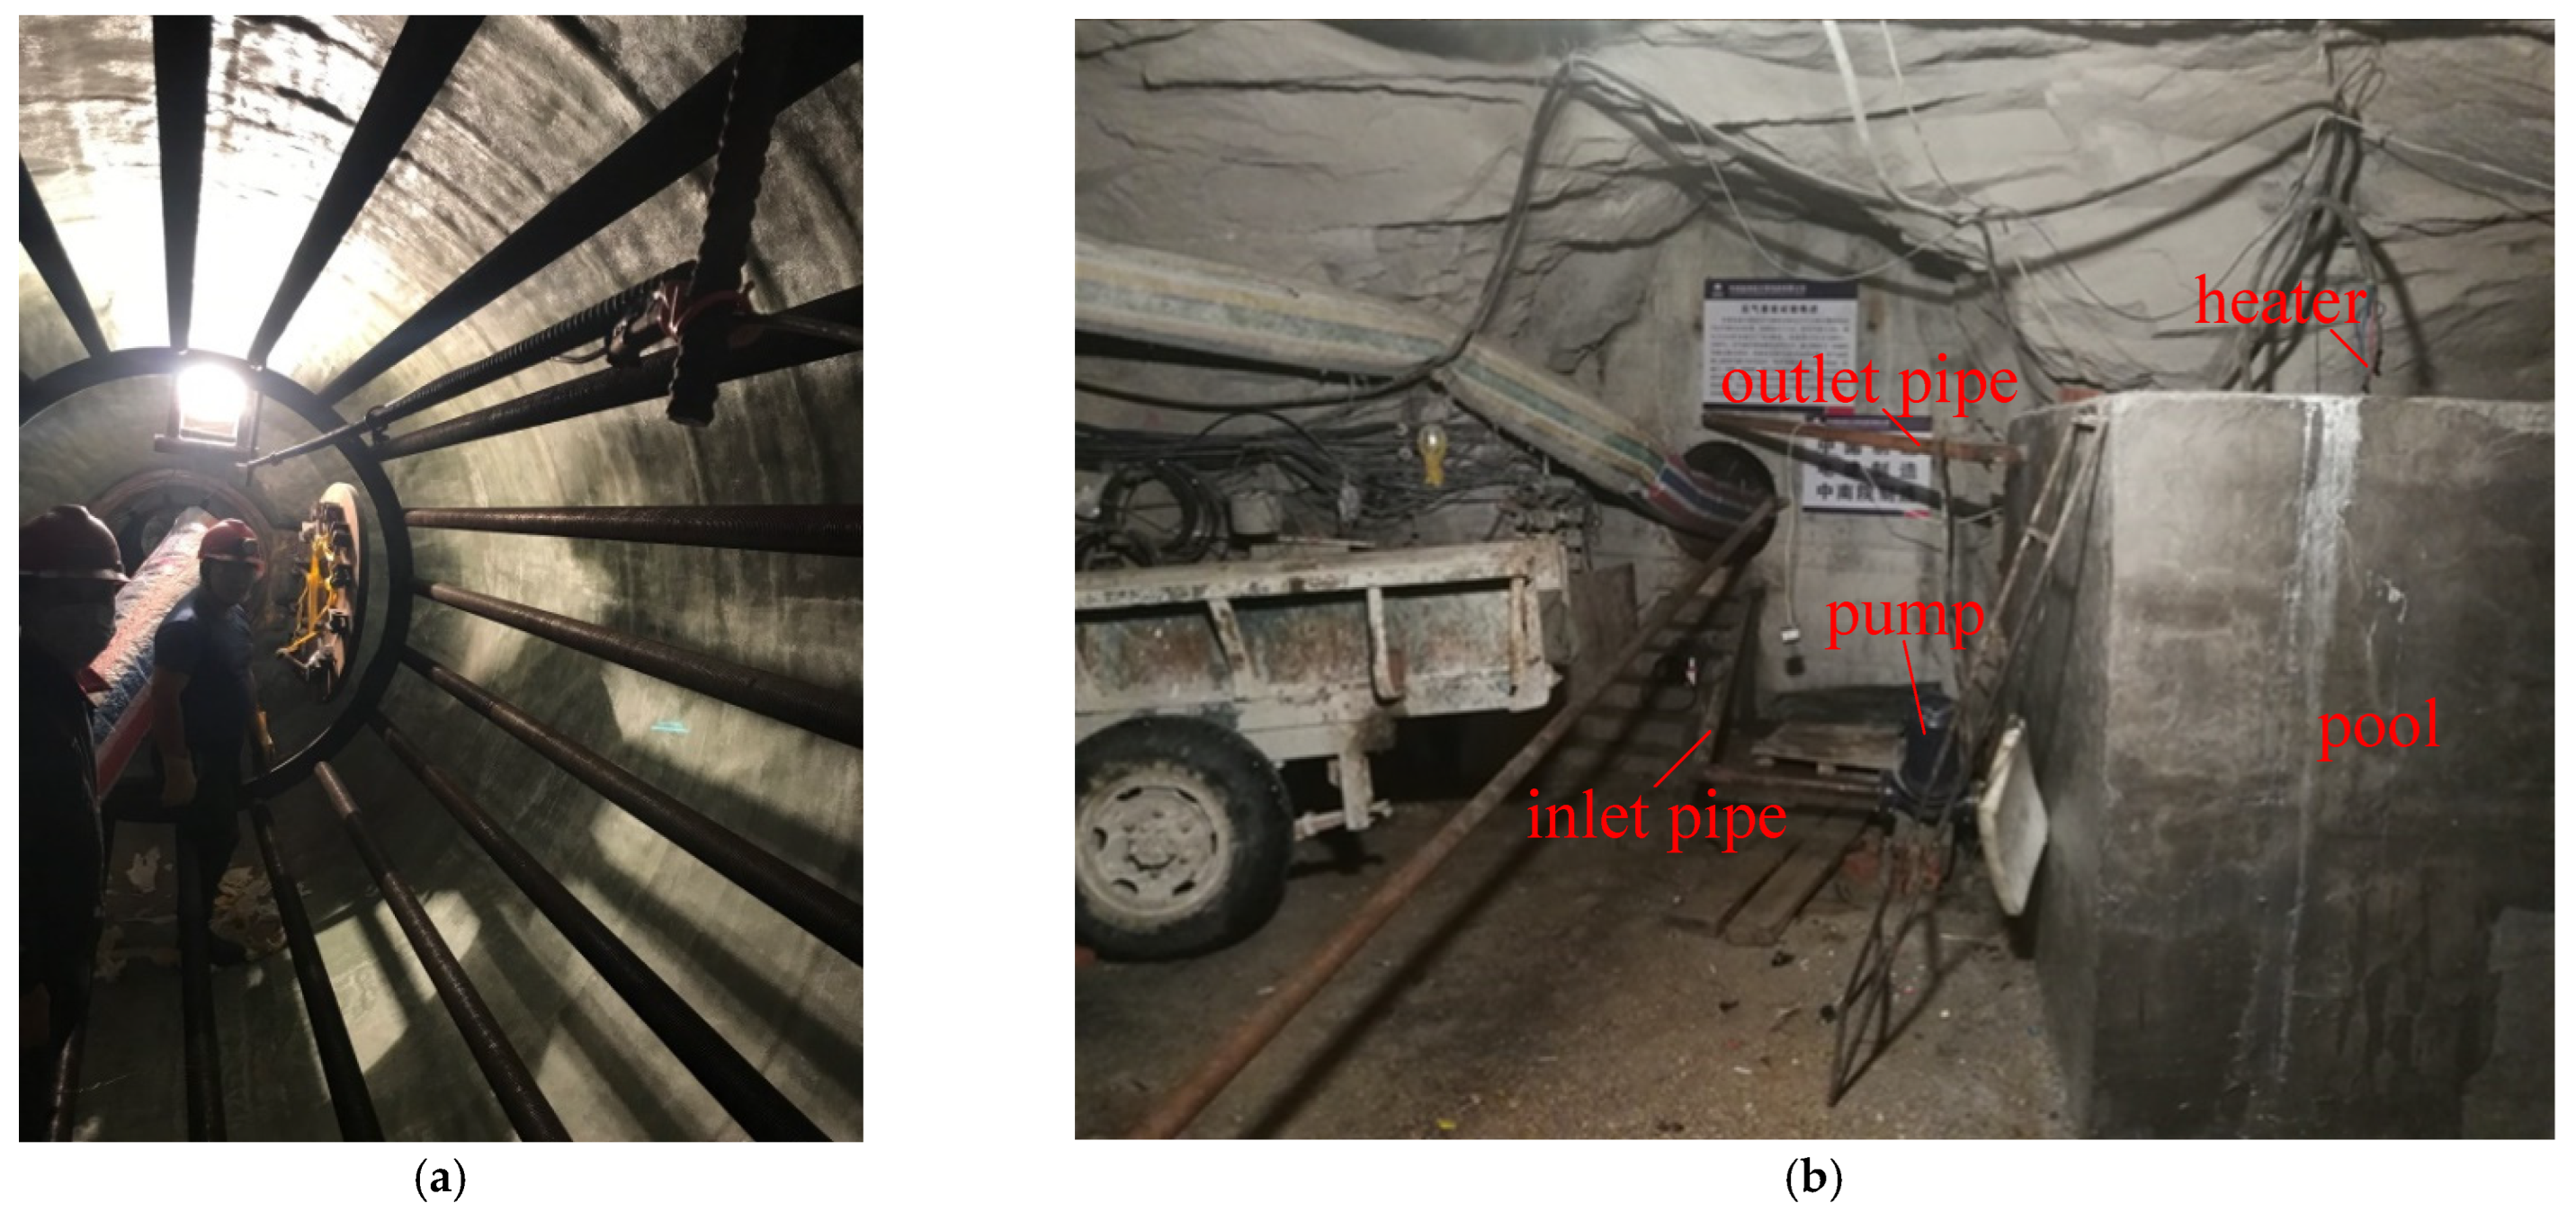
According to the design and calculation results of the heat exchange system, combined with the internal dimensions of the Pingjiang CAES cavern and the processing limitations of the finned tubes, the final selected finned tubes had an outer diameter of 51 mm, an inner diameter of 40 mm, a fin height of 11 mm, a fin thickness of 1 mm, and a pitch of 5 mm. The structure of the heat exchange system is shown in
Figure 8.
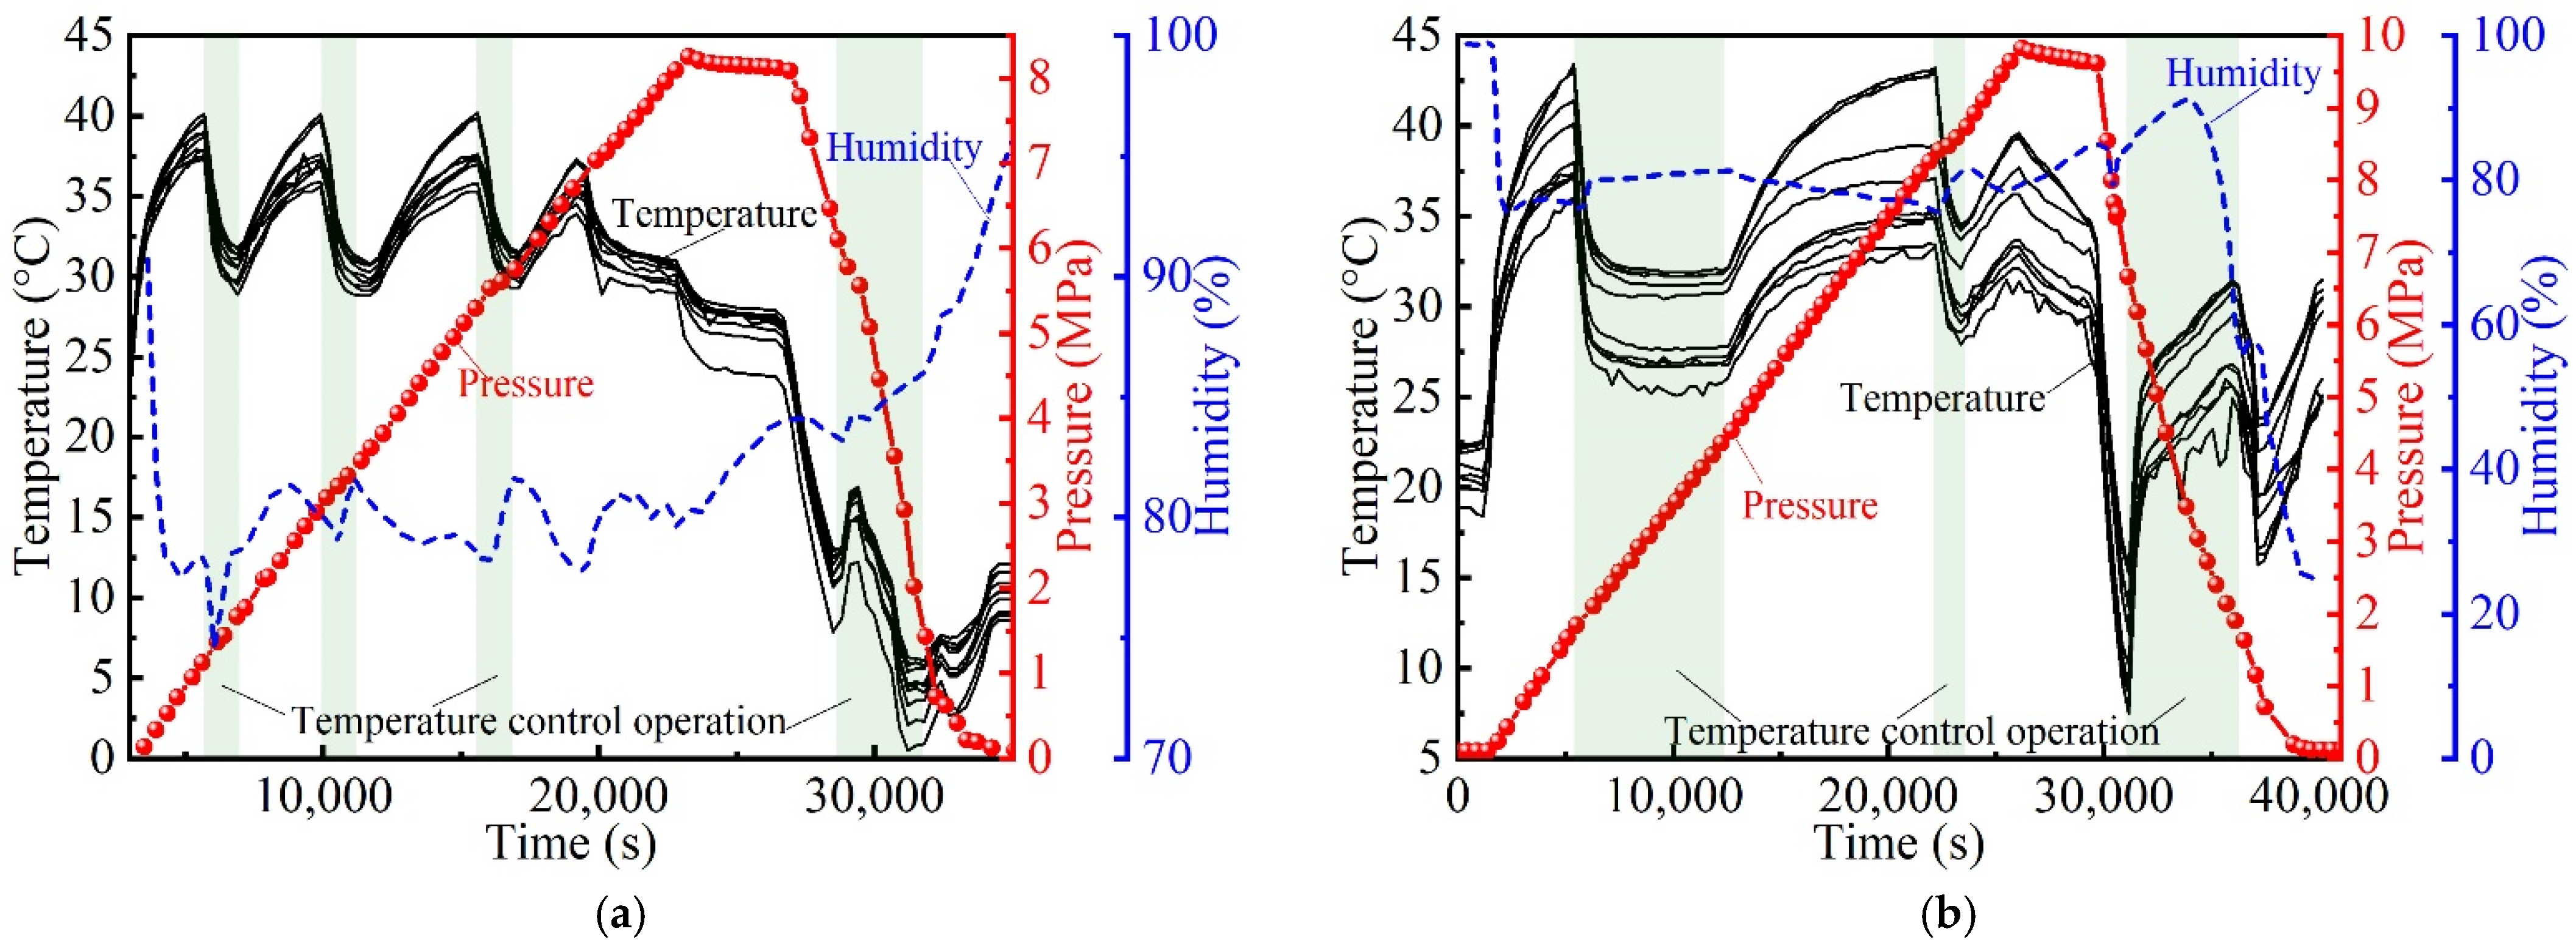
The thermodynamic and heat transfer calculations were carried out for the air temperature change in the cavern during the charging–maintaining–discharging of the heat exchange system. The calculation results are shown in
Figure 9. Since the heat exchange system could use the circulating water at room temperature to take away a large amount of compression heat generated by air compression during the charging stage. Except that the large amount of heat generated by the severe compression in the early stage could not be quickly discharged, the air temperature in the cave was significantly reduced and stabilized at 35 ± 3 °C (1000 Nm
3/h) and 30 ± 3 °C (500 Nm
3/h). At the same time, due to the decrease in air temperature, the time of the compression stage was prolonged, and the amount of air stored in the cave increased. In the discharging stage, the heated circulating cooling water could continue to provide heat for the low-temperature air to expand and cool. The heat could not be replenished in time due to the violent expansion in the later stage of discharging. The air temperature in the cavern was maintained at about 30 °C (1000 Nm
3/h) and 25 °C (500 Nm
3/h). A stable temperature was maintained, and air temperatures below 0 °C could be avoided. From the calculation results of the complete charging and discharging cycle, the air temperature was maintained between 20–40 °C (1000 Nm
3/h) and 20–40 °C (500 Nm
3/h). In particular, when the pressure was greater than 1.6 MPa, the temperature range was controlled between 25−38 °C (1000 Nm
3/h) and 25–31 °C (500 Nm
3/h). The heat exchange system can sufficiently suppress the temperature fluctuation during the charging and discharging process.


