
Unravelling the Paradoxical Seasonal Food Scarcity in a Peasant Microregion of Mexico

 ,
,  , , and
Abstract
:1. Introduction
- A.
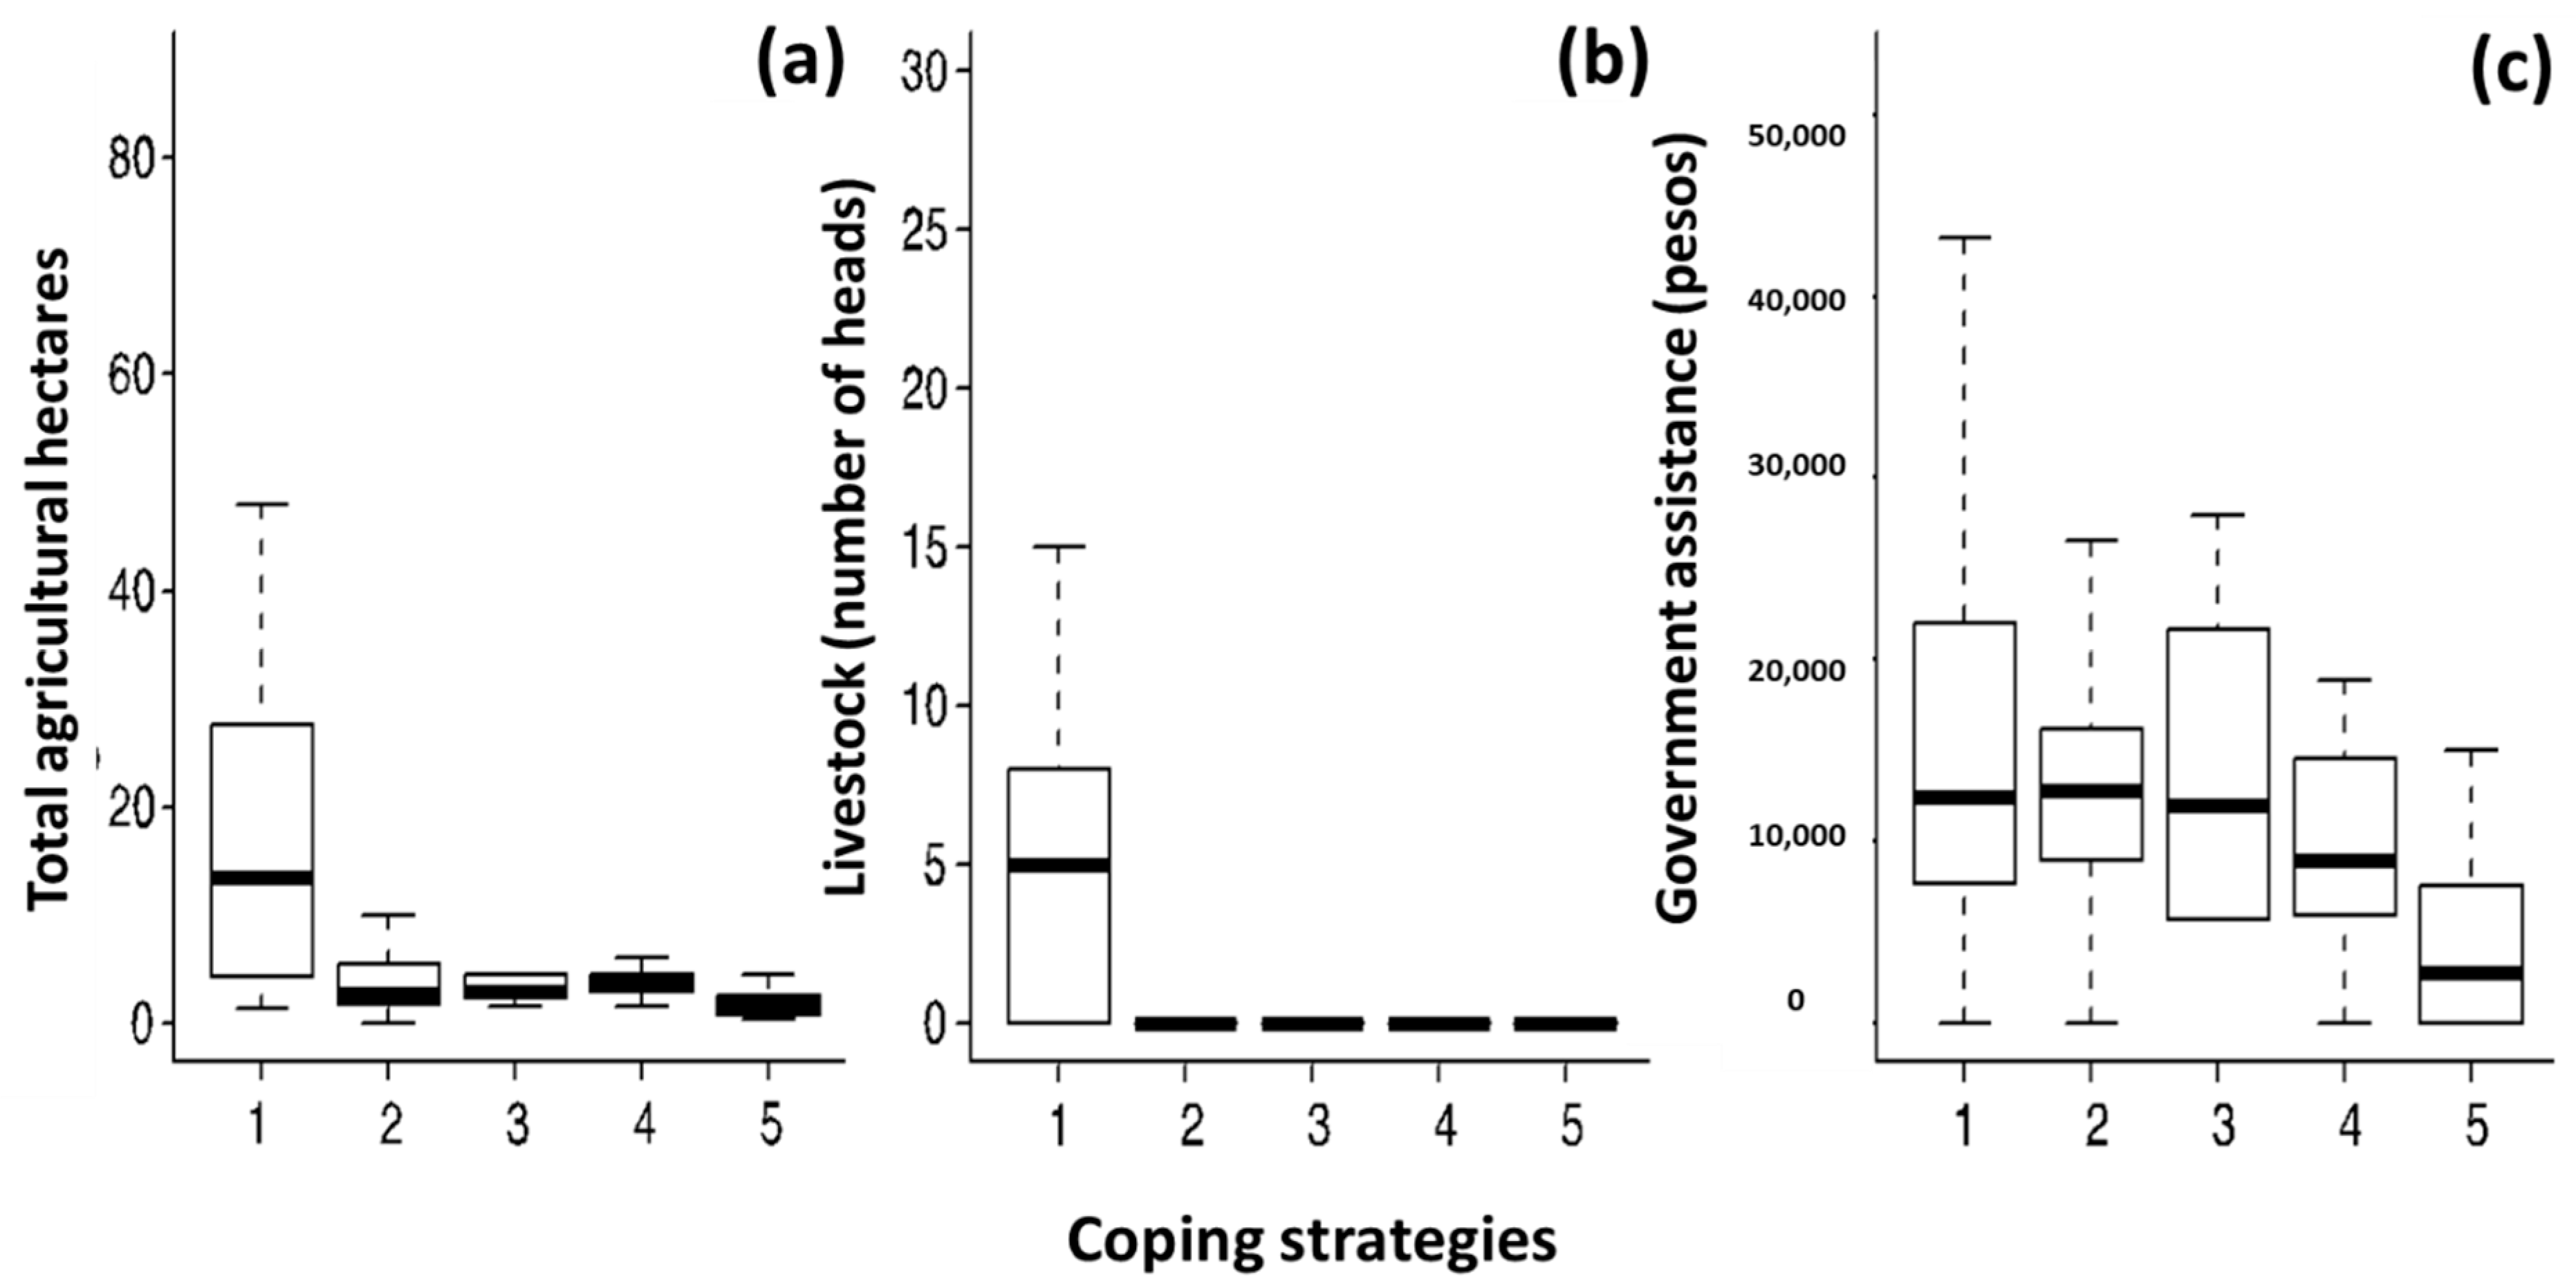
- Greater production of maize and beans (which are the bases of the peasant diet) reduces the duration of scarcity and the intensity of coping strategies.
- B.
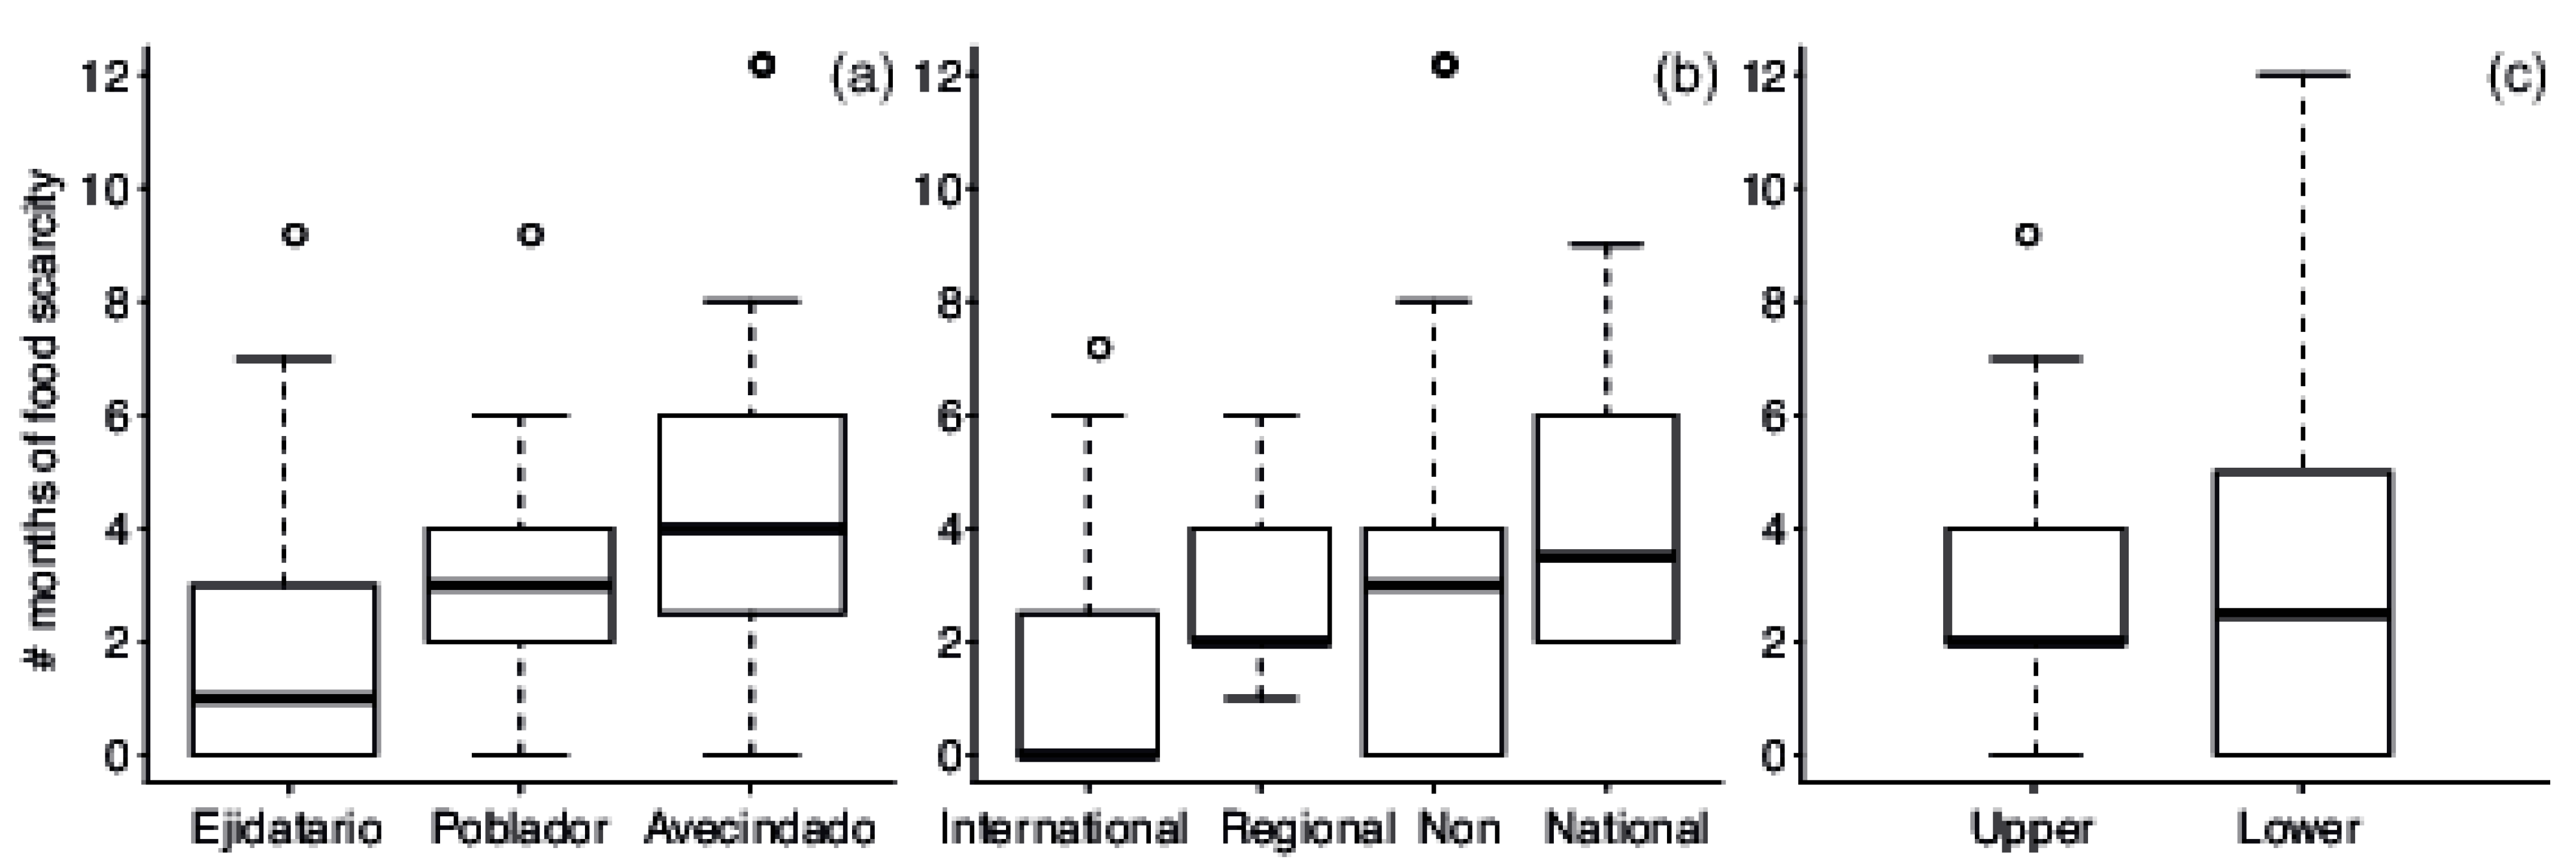
- Households with more-precarious land tenancy face longer periods of scarcity, and adopt the most intense coping strategies.
- C.
- International migration—although not national or regional migration—significantly reduces the duration of food scarcity and the intensity of coping strategies.
- D.
- Means of production are positively correlated to government support, which determines fewer months of food scarcity, as well as less-intense coping strategies.
- E.
- Significant differences exist in the duration of food scarcity and intensity of coping strategies between the communities that focus on agroforestry versus those that focus on agriculture.
2. Methods
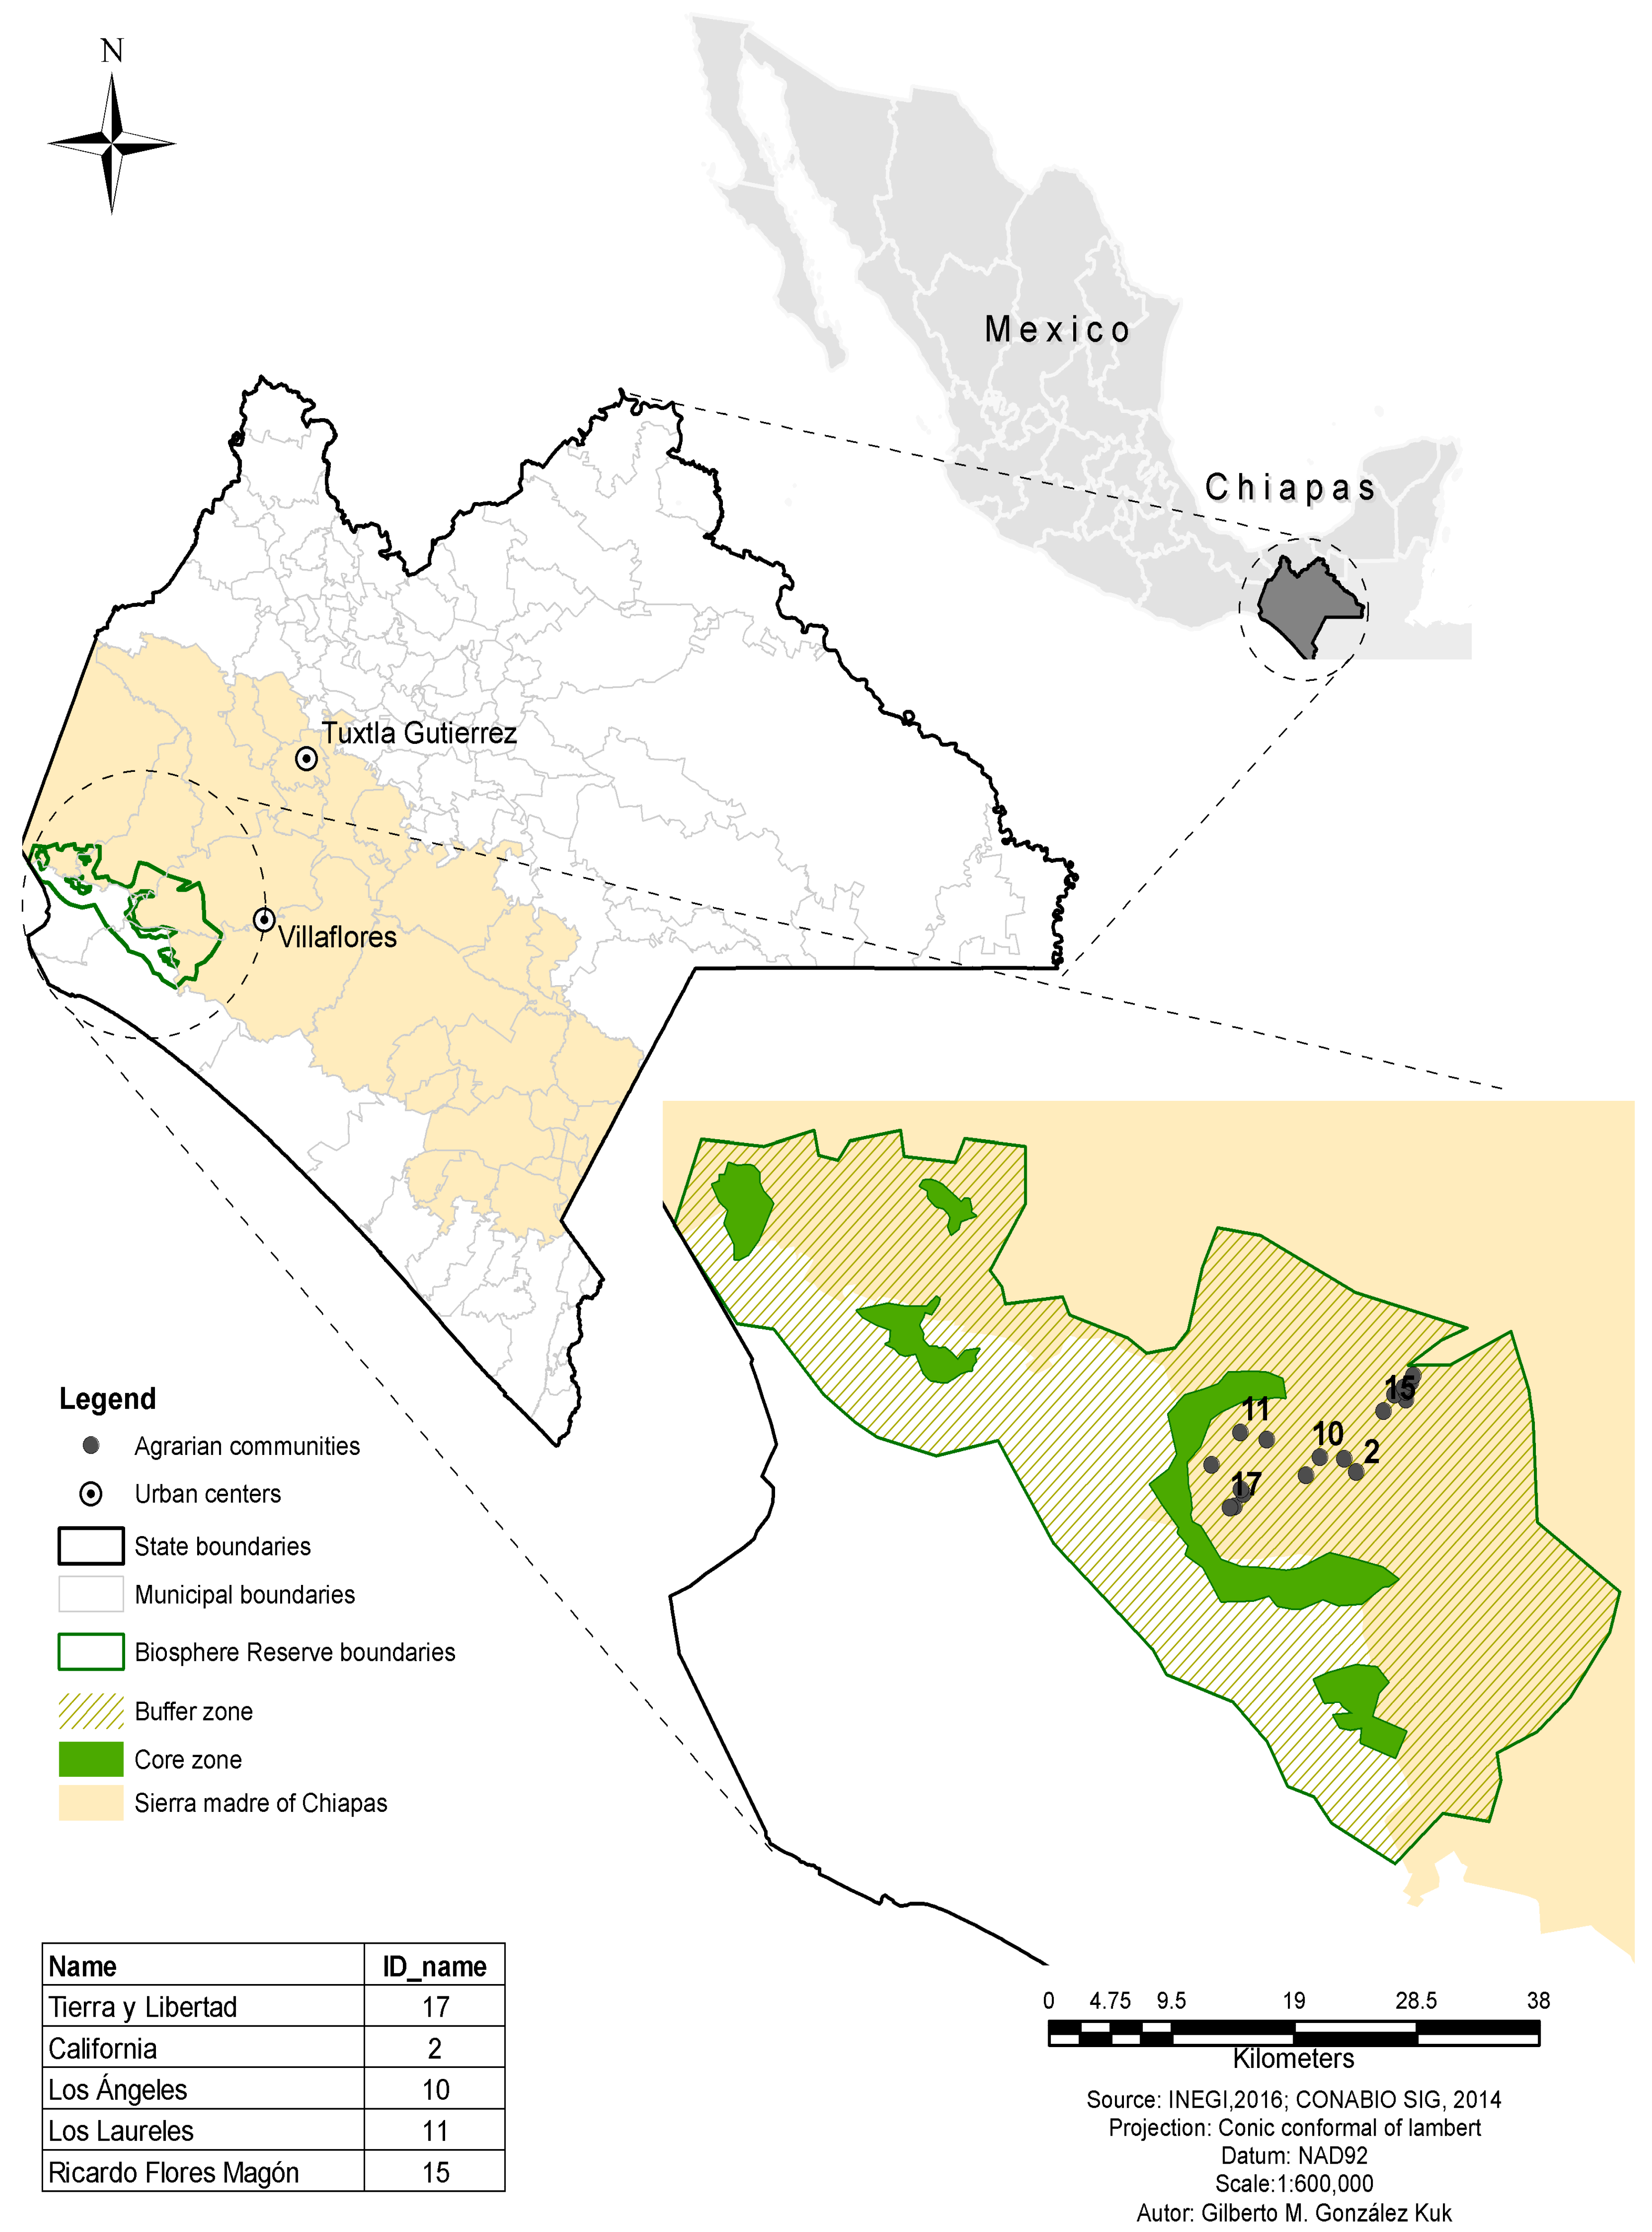
2.1. Study Area and Research Sample
2.2. Ethnographic Fieldwork
2.3. Statistical Analyses
2.4. Social Network Analysis and Visualizations
3. Results
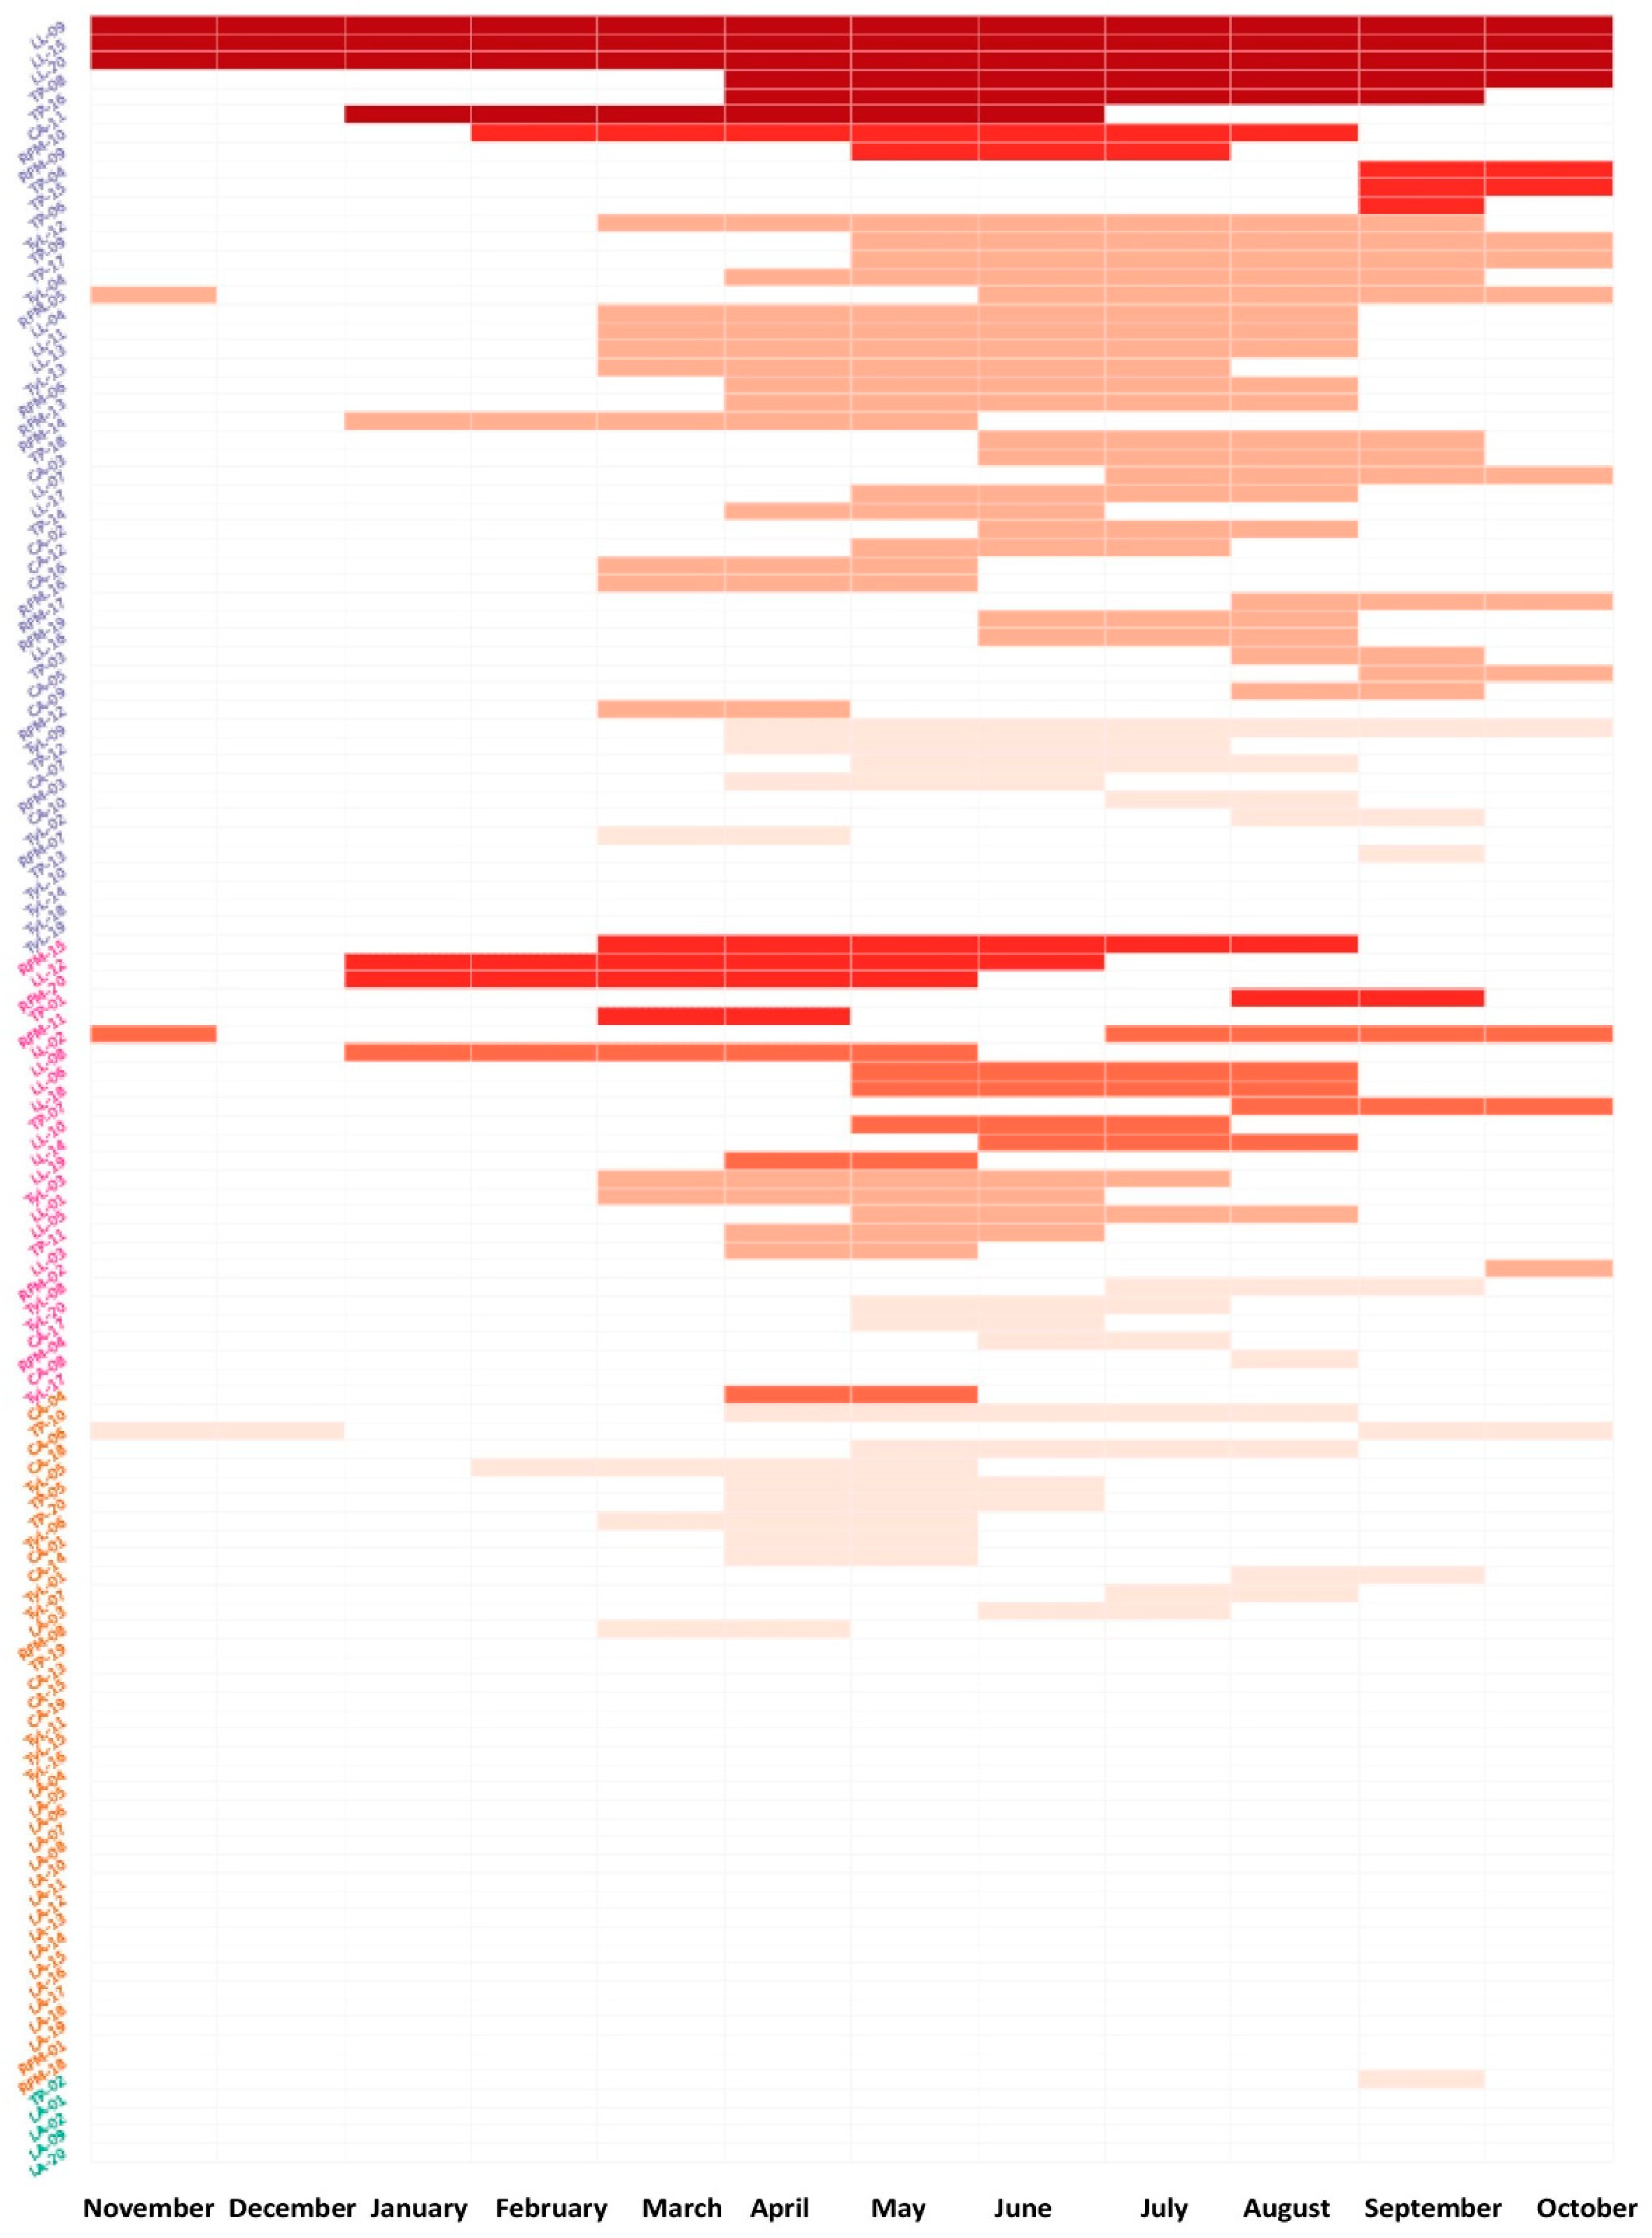
3.1. Temporality and Acuity in Seasonal Food Scarcity and Coping Strategies
3.2. Land Tenancy and Socioeconomic Determinants of Seasonal Food Scarcity and Coping Strategies
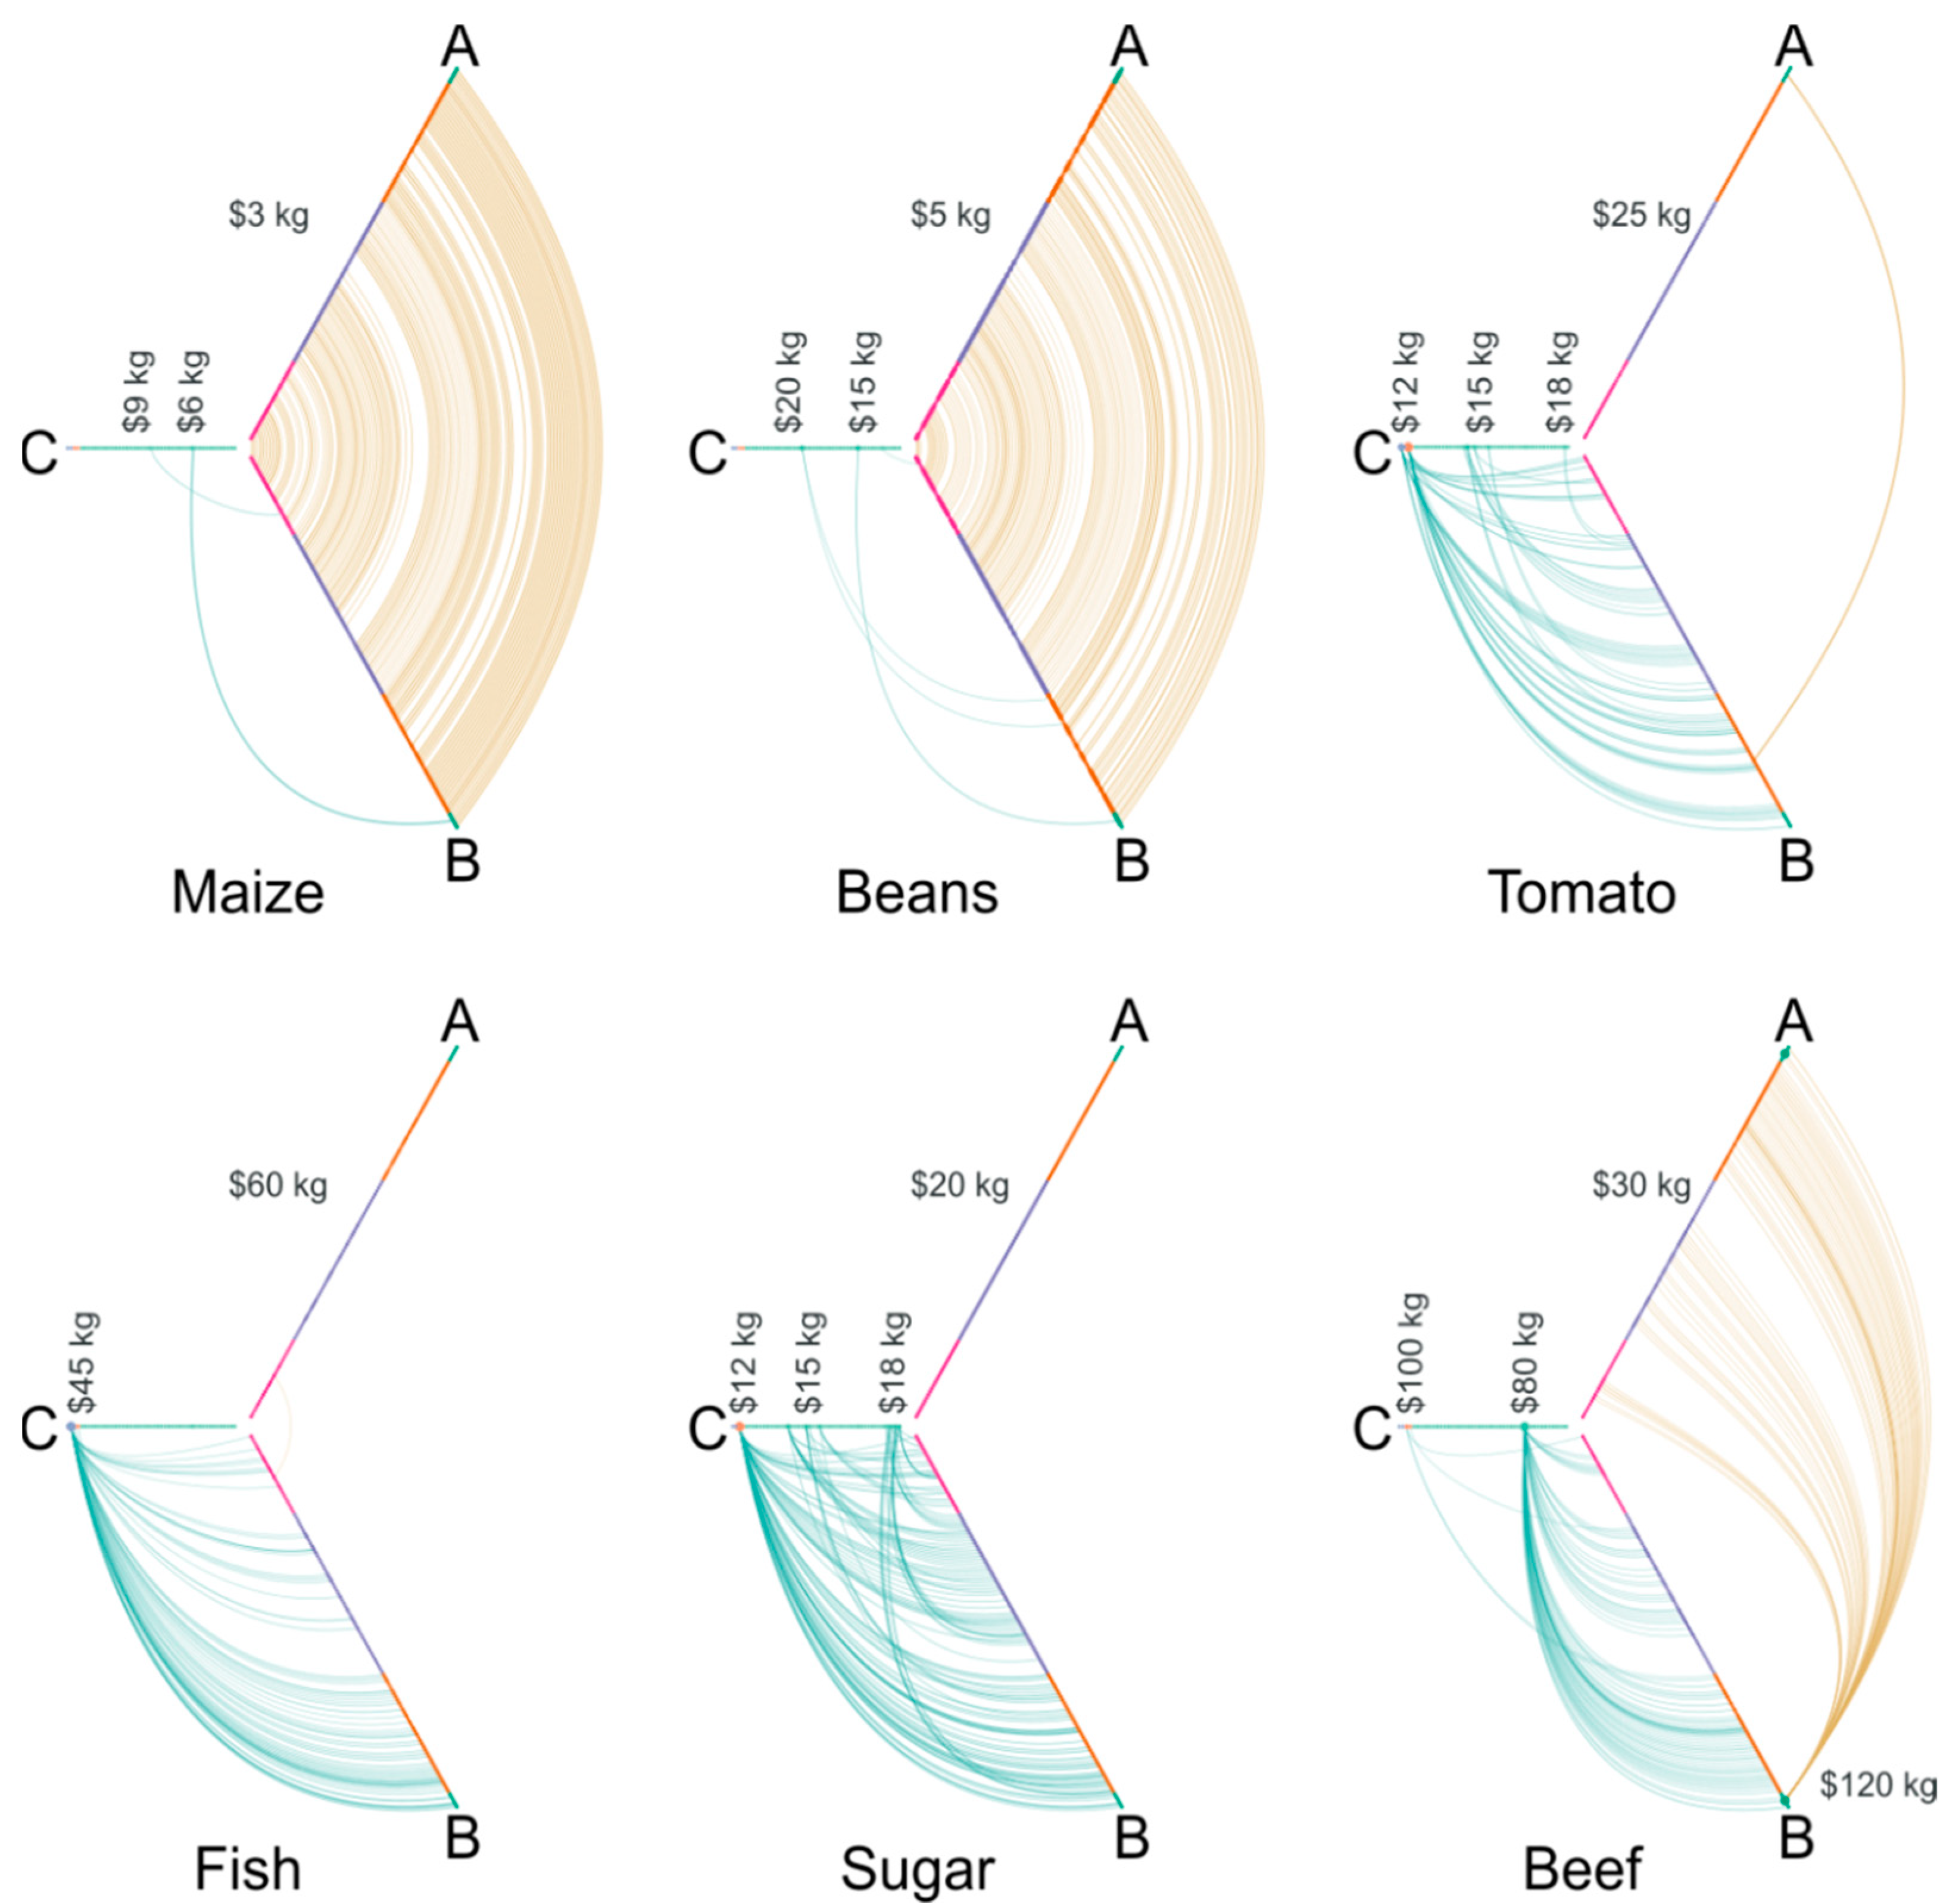
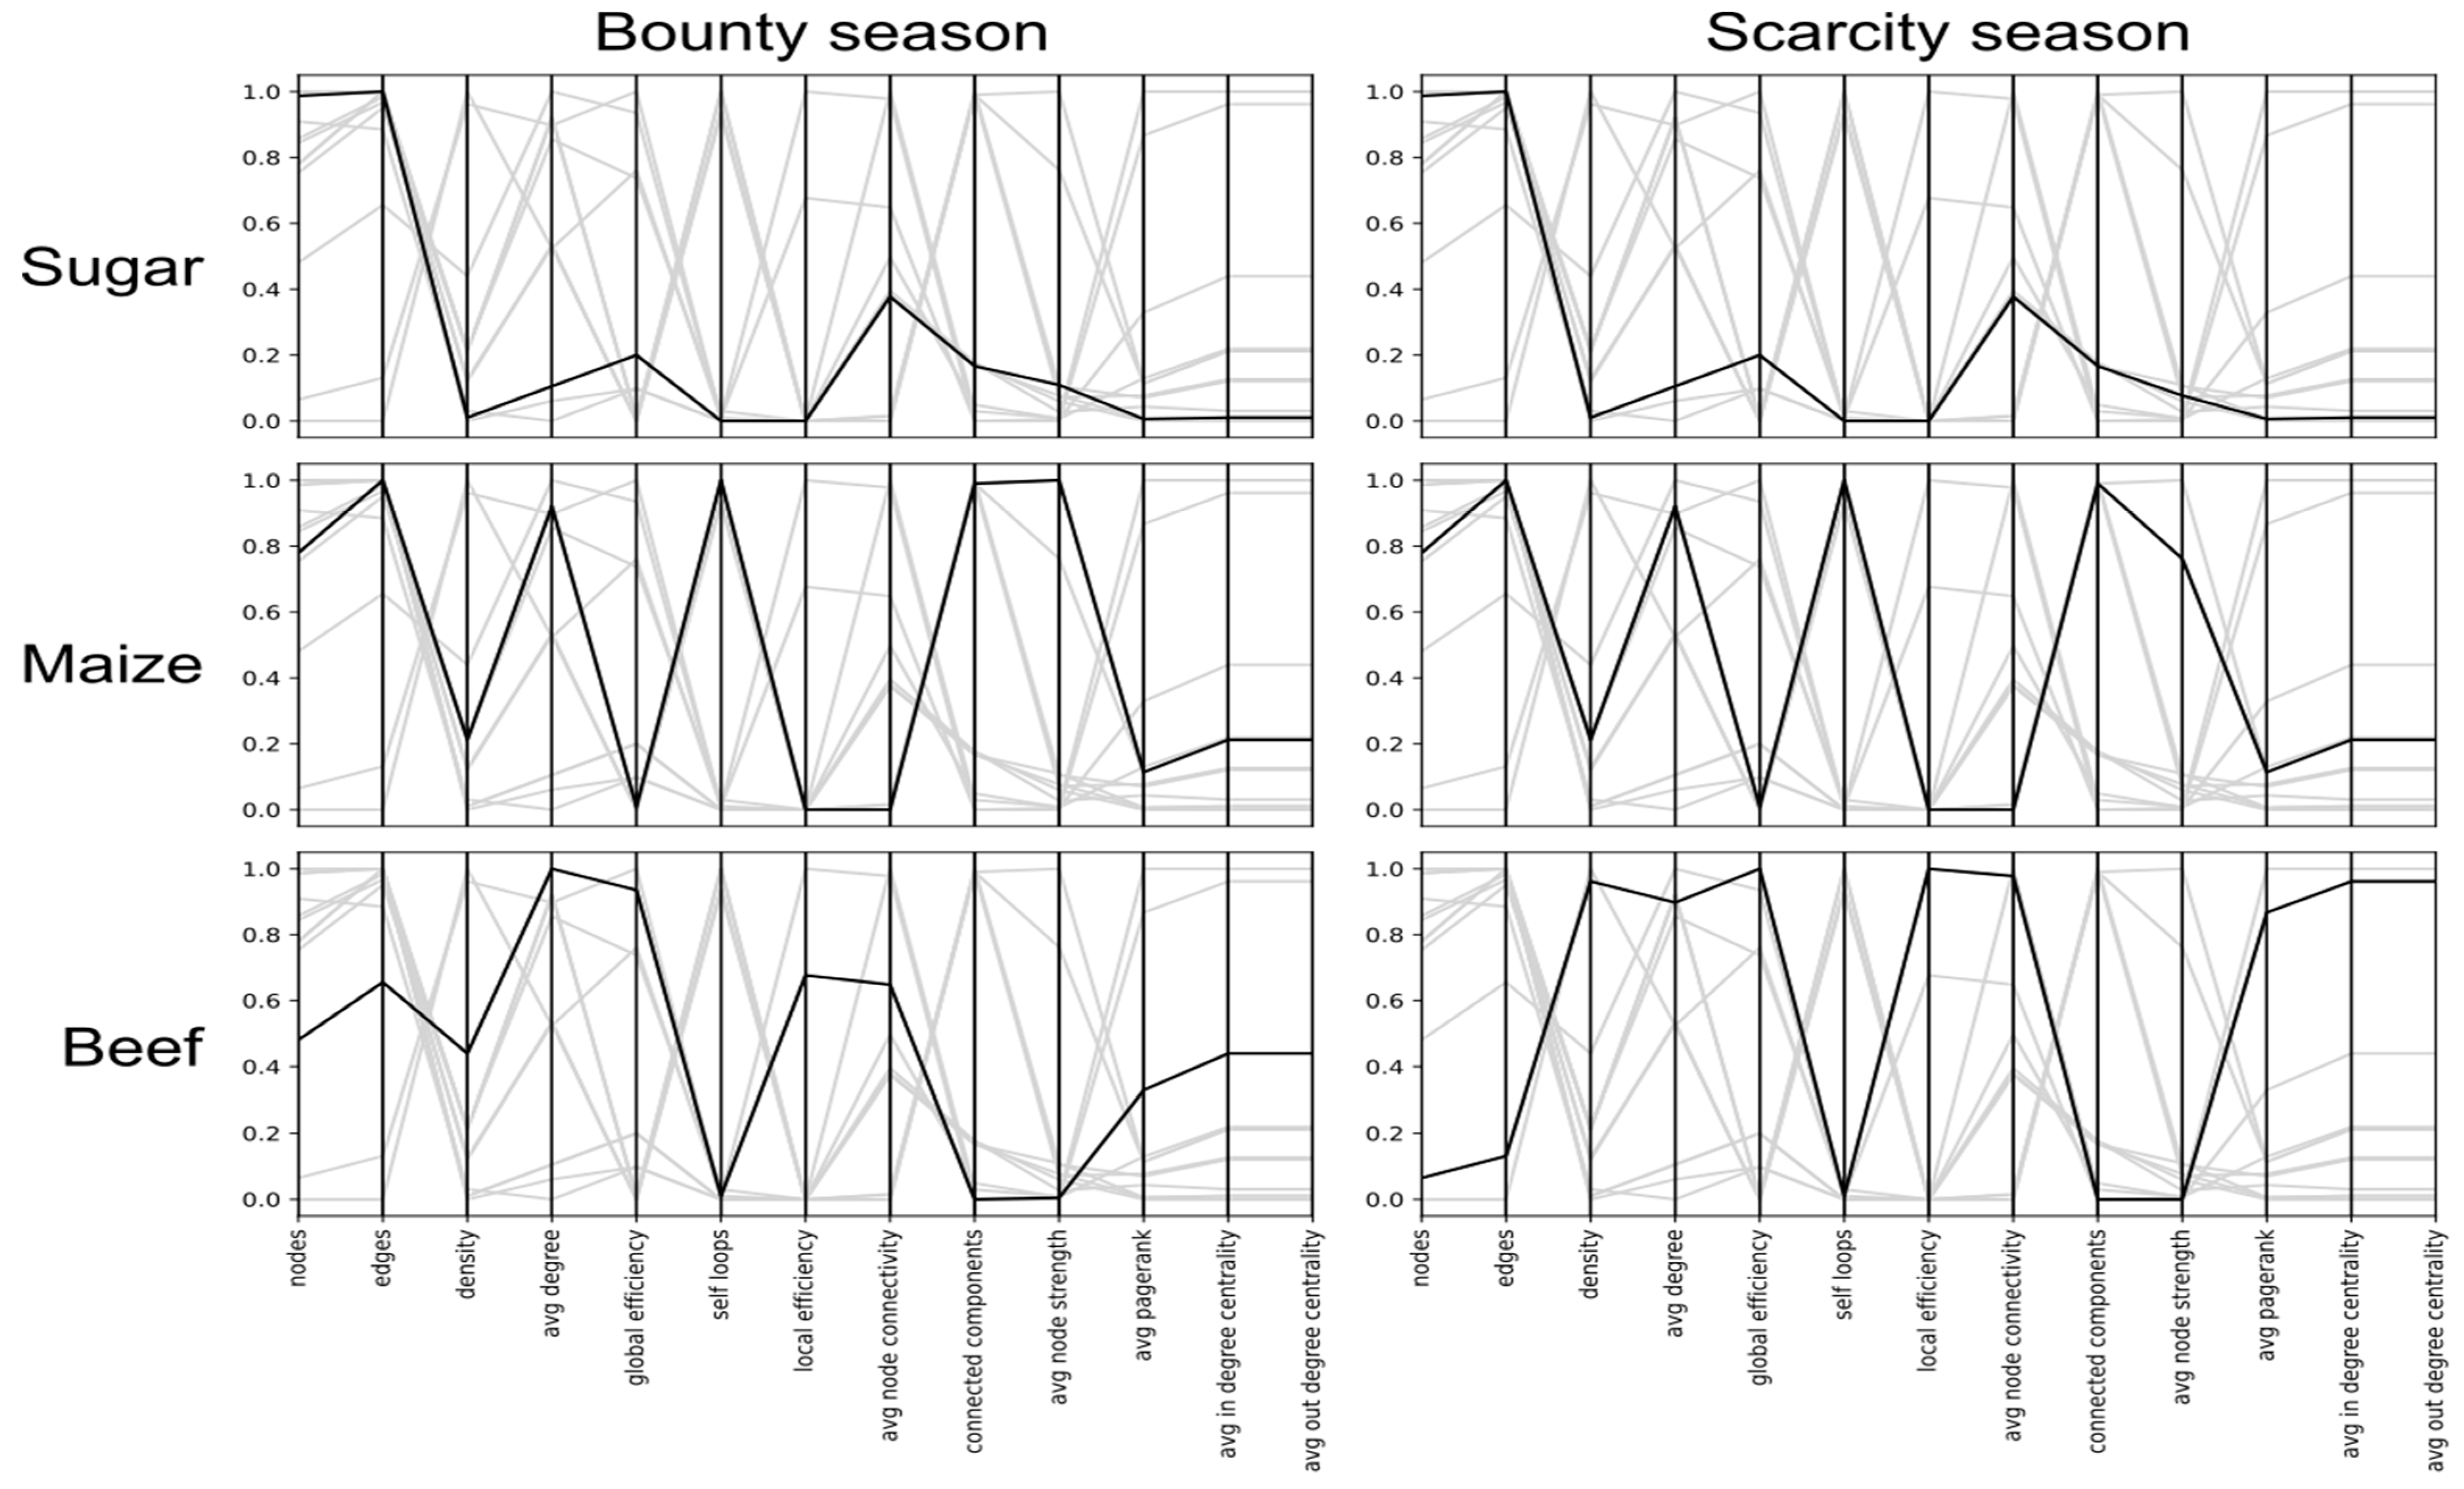
3.3. Peasant Agrifood Supply Networks during Scarce and Abundant Seasons
4. Discussion
4.1. Scarcity and Coping-Strategies in the CART, as Compared to Other Peasant Contexts in Central America
4.2. Breaking down Seasonal Food Scarcity in an Attempt to Counteract It in a Targeted Manner
4.3. Seasonal Vulnerability and Robustness in Peasant Food-Supply Networks
5. Conclusions
Author Contributions
Funding
Institutional Review Board Statement
Informed Consent Statement
Acknowledgments
Conflicts of Interest
Appendix A. Characterization of Food Coping during the Scarce Season

| Magnitude Code | Coping Strategy | Description |
|---|---|---|
| S1 | Reduction in food diversity or consumption | The diversity of more than 50 food products frequently consumed by peasant households is reduced to fewer than 10 products, depending, mainly, on maize and beans. The amount of food consumed regularly during the bounty season can be reduced by almost half during the scarce season. |
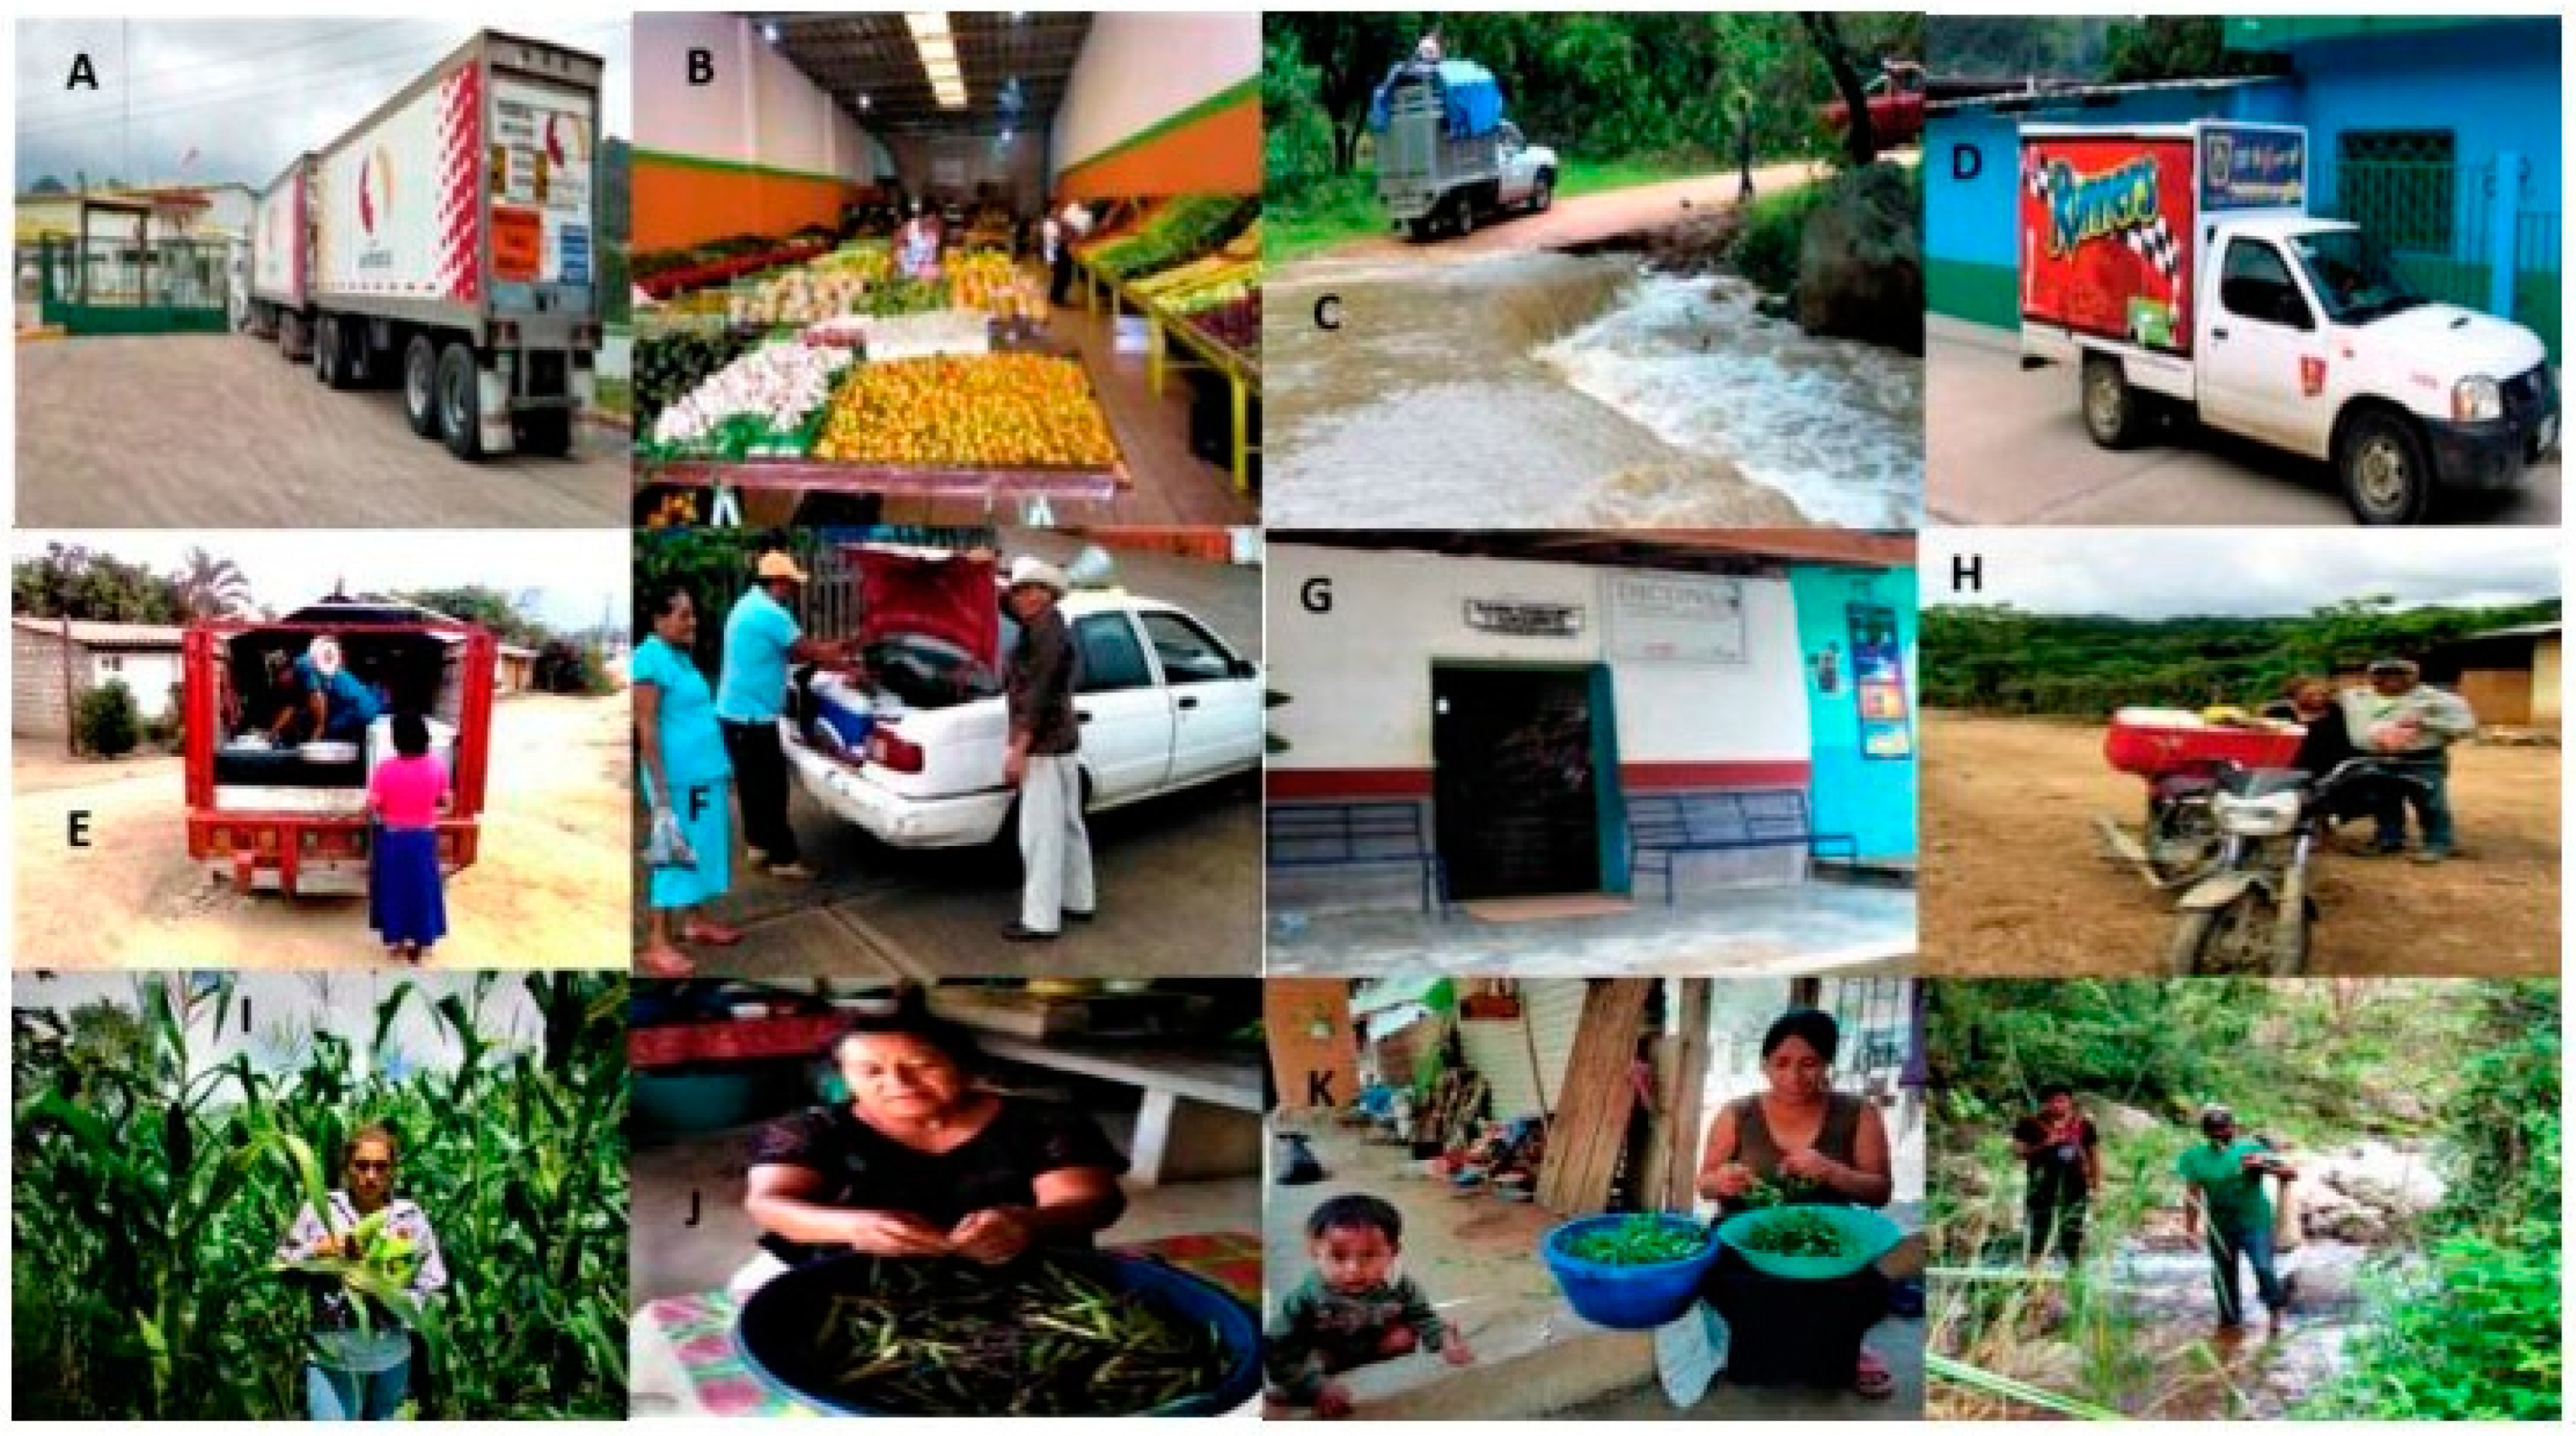
| S2 | Gathering wild foods | In total, 35 species including greens, fungi, insects, amphibians, small fish, and crustaceans are collected for food from agriculture plots, home gardens, bush, and riverbeds. Some households, practically, base their diets on these products during the scarce season. |
| S3 | Sale of backyard animals | Mainly chickens, but turkeys, pigs, and, even, cattle are considered rural savings, so they are sold locally to earn income during the scarce season. |
| Pursue agricultural wage labour | It is very common that, to improve their income during the scarce season, which coincides with the agricultural renewal cycle when more paid work is needed, the most disadvantaged households increase the rural daily wages they provide to other productive units. | |
| S4 | Temporary migration | Internationally, to the United States through migration networks; nationally, to the north of the country to work as agricultural labourers or to tourist areas to work in construction; and regionally, to nearby cities to work as salaried employees. |
| High interest rate loans | Local loan sharks often charge high interest rates on rural loans, in addition to making loans conditional upon mortgaging the means of production, such as land or livestock, on account of repayment. | |
| S5 | Parental buffering | Parents stop consuming food for a few days during the lean season, so that their children can continue to eat. |
References
- Devereux, S.; Bapu, V.; Hauenstein, S. Seasons of Hunger: Fighting Cycles of Quiet Starvation among the World’s Rural Poor; Pluto Press: London, UK, 2008. [Google Scholar]
- Apata, T.G.; Apata, O.M.; Kehinde, A.L. Explaining the ‘hungry farmer paradox’: Through dynamics of Nutritional Scarcity and Its Determinants among Farming Households in Southwestern, Nigeria. In Proceedings of the Presentation to the International Association of Agricultural Economists’ 2015 Conference, Milan, Italy, 9–14 August 2015. [Google Scholar]
- FAO. El Estado de la Seguridad Alimentaria y la Nutrición en el Mundo 2019: Protegerse Frente a la Desaceleración y el Debilitamiento de la Economía; FAO: Roma, Italy, 2019. [Google Scholar]
- Van der Ploeg, J. Peasants and the Art of Farming: A Chayanovian Manifesto; Fernwood Publishing: Halifax, NS, Canada, 2014. [Google Scholar]
- Ellis, F.; Manda, E. Seasonal food crises and policy responses: A narrative account of three food security crises in Malawi. World Dev. 2012, 40, 1407–1417. [Google Scholar] [CrossRef]
- Gebrehiwot, T.; Van der Veen, A. Coping with food insecurity on a micro-scale: Evidence from Ethiopian rural households. Ecol. Food Nutr. 2014, 53, 214–240. [Google Scholar] [CrossRef] [PubMed]
- Morris, K.; Mendez, E.; Olson, M.B. ‘Los meses flacos’: Seasonal food insecurity in a Salvadoran organic coffee cooperative. J. Peasant. Stud. 2013, 40, 423–446. [Google Scholar] [CrossRef]
- Bacon, C.; Sundstrom, W.; Gomez-Flores, M.; Mendez, E.; Santos, R.; Goldoftas, B.; Dougherty, I. Explaining the ‘hungry farmer paradox’: Smallholders and fair trade cooperatives navigate seasonality and change in Nicaragua’s corn and coffee markets. Glob. Environ. Change 2014, 25, 133–149. [Google Scholar] [CrossRef]
- Nimoh, F.; Ayaburi, S.A.; Ransford, Y. Seasonal food shortages and coping strategies adopted by rural households in Northern Ghana. J. Dev. Agric. Econ. 2012, 4, 62–70. [Google Scholar]
- Herdt, R. Food shortages and international agricultural programs. Crit. Rev. Plant Sci. 2004, 23, 505–517. [Google Scholar] [CrossRef]
- Collier, P. Poverty reduction in Africa. Proc. Natl. Acad. Sci. USA 2007, 104, 16763–16768. [Google Scholar] [CrossRef] [Green Version]
- Devereux, S. The New Famines; Routledge: London, UK, 2009. [Google Scholar]
- Vaitla, B.; Stephen, D.; Samuel, S. Seasonal hunger: A neglected problem with proven solutions. PLoS Med. 2009, 6, e1000101. [Google Scholar] [CrossRef] [Green Version]
- Radchenko, N.; Corral, P. Agricultural commercialisation and food security in rural economies: Malawian experience. J. Dev. Stud. 2018, 54, 256–270. [Google Scholar] [CrossRef] [Green Version]
- Hadley, C.; Patil, C. Seasonal changes in household food insecurity and symptoms of anxiety and depression. Am. J. Phys. Anthropol. 2008, 135, 225–232. [Google Scholar] [CrossRef]
- Spyros, K.; Zavala, G.; Leijen, L.; Melgar-Quiñonez, H.; van Tulder, M. Household food insecurity is associated with depressive symptoms: Results from a Mexican population-based survey. Food Secur. 2020, 12, 407–416. [Google Scholar]
- Rivera-Núñez, T.; Estrada-Lugo, E.; García-Barrios, L.; Lazos, E.; Gracia, A.; Benítez, M.; Rivera-Yoshida, N.; García-Herrera, R. Peasant micropower in an agrifood supply system of the Sierra Madre of Chiapas, Mexico. J. Rural. Stud. 2020, 78, 185–198. [Google Scholar] [CrossRef]
- García-Barrios, L.; Rivera-Núñez, T.; Cruz-Morales, J.; Urdapilleta-Carrasco, J.; Castro-Salcido, E.; Peña-Azcona, I.; Martínez-López, O.; López-Cruz, A.; Morales, M.; Espinoza, E. The Flow of Peasant Lives: A board game that simulates livelihood strategies and trajectories derived from complex rural household’s decisions. Ecol. Soc. 2020, 25, 48. [Google Scholar] [CrossRef]
- Fromm, E.; Maccoby, M. Sociopsicoanálisis del Campesino Mexicano: Estudio de la Economía y la Psicología de Una Comunidad Rural; Fondo de Cultura Económica: Mexico City, Mexico, 1973. [Google Scholar]
- Misturelli, F.; Claire, H. Perceptions of poverty among poor livestock keepers in Kenya: A discourse analysis approach. J. Int. Dev. 2001, 13, 863–875. [Google Scholar] [CrossRef]
- Maxwell, D. Measuring food insecurity: The frequency of coping strategies. Food Policy 1996, 21, 291–303. [Google Scholar] [CrossRef] [Green Version]
- Asprilla-Perea, J.; Díaz-Puente, J. Importance of wild foods to household food security in tropical forest areas. Food Secur. 2019, 11, 15–22. [Google Scholar] [CrossRef] [Green Version]
- Webb, P.; Coates, J.; Frongillo, E.; Rogers, B.; Swindale, A.; Bilinsky, P. Measuring household food insecurity: Why it’s so important and yet so difficult to do. J. Nutr. 2006, 136, 1404S–1408S. [Google Scholar] [CrossRef]
- Gelli, A.; Masset, E.; Folson, G.; Kusi, A.; Arhinful, D.; Asante, F.; Ayi, I.; Bosompem, W.; Watkins, K.; Abdul-Rahman, L.; et al. Evaluation of alternative school feeding models on nutrition, education, agriculture and other social outcomes in Ghana: Rationale, randomised design and baseline data. Trials 2006, 17, 37. [Google Scholar] [CrossRef] [Green Version]
- Tittonell, P.; Giller, K. When yield gaps are poverty traps: The paradigm of ecological intensification in African smallholder agriculture. Field Crops Res. 2013, 143, 76–90. [Google Scholar] [CrossRef] [Green Version]
- Lade, S.; Haider, L.J.; Engström, G.; Schlüter, M. Resilience offers escape from trapped thinking on poverty alleviation. Sci. Adv. 2017, 3, e1603043. [Google Scholar] [CrossRef] [Green Version]
- García-Barrios, L.; González-Espinosa, M. Investigación ecológica participativa como apoyo de procesos de manejo y restauración forestal, agroforestal y silvopastoril en territorios campesinos. Experiencias recientes y retos en la sierra Madre de Chiapas, México. Rev. Mex. Biodivers. 2017, 88, 129–140. [Google Scholar] [CrossRef]
- Cruz-Morales, J. Desafíos para construir la democracia ambiental en la Cuenca Alta del Río El Tablón, Reserva de la Biosfera La Sepultura, Chiapas, México. In Paradojas de las Tierras Protegidas: Democracia y Política Ambiental en Reservas de la Biosfera en Chiapas; Legorreta Díaz, C., Márquez Rosano, C., Trench, T., Eds.; UNAM/Universidad Autónoma Chapingo: Mexico City, Mexico, 2014; pp. 31–70. [Google Scholar]
- Appendini, K. Reconstructing the Maize Market in Rural Mexico. J. Agrar. Change 2014, 14, 1–25. [Google Scholar] [CrossRef]
- Valdivieso-Pérez, A.; García-Barrios, L.; Álvarez-Solís, D.; Nahed-Toral, J. De maizales a potreros: Cambio en la calidad del suelo. Terra Latinoam. 2012, 30, 363–374. [Google Scholar]
- Adams, W. Sleeping with the enemy? Biodiversity conservation, corporations and the green economy. J. Political Ecol. 2017, 24, 243–257. [Google Scholar]
- Speelman, E.; Groot, J.; García-Barrios, L.; Kok, K.; Van Keulen, H.; Tittonell, P. From coping to adaptation to economic and institutional change: Trajectories of change in land use management and social organization in a Biosphere Reserve community, Mexico. Land Use Policy 2014, 41, 31–44. [Google Scholar] [CrossRef]
- Valencia, V.; García-Barrios, L.; West, P.; Sterling, E.; Naeem, S. The role of coffee agroforestry in the conservation of tree diversity and community composition of native forests in a Biosphere Reserve. Agric. Ecosyst. Environ. 2014, 189, 154–163. [Google Scholar] [CrossRef]
- Braasch, M.; García-Barrios, L.; Ramírez-Marcial, N.; Huber-Sannwald, E.; Cortina-Villar, S. Can cattle grazing substitute fire for maintaining appreciated pine savannas at the frontier of a montane forest biosphere-reserve? Agric. Ecosyst. Environ. 2017, 250, 59–71. [Google Scholar] [CrossRef]
- Heinze, A.; Bongers, F.; Marcial-Ramírez, N.; García-Barrios, L.; Kuyper, T. The montane multifunctional landscape: How stakeholders in a biosphere reserve derive benefits and address trade-offs in ecosystem service supply. Ecosyst. Serv. 2020, 44, 101–134. [Google Scholar] [CrossRef]
- García-Barrios, L.; Cruz-Morales, J.; Braasch, M.; Dechnik-Vázquez, Y.; Gutiérrez-Navarro, A.; Meza-Jiménez, A.; Rivera-Núñez, T.; Speelman, E.; Trujillo-Díaz, G.; Valencia, V.; et al. Challenges for rural livelihoods, participatory agroforestry, and biodiversity conservation in a neotropical biosphere reserve in Mexico. In Participatory Biodiversity Conservation; Baldauf, C., Ed.; Springer: Cham, Switzerland, 2020; pp. 69–89. [Google Scholar]
- Zabala, A.; Pascual, U.; García-Barrios, L. Payments for pioneers? Revisiting the role of external rewards for sustainable innovation under heterogeneous motivations. Ecol. Econ. 2017, 135, 234–245. [Google Scholar]
- García-Barrios, L.; Galván-Miyoshi, Y.; Valdivieso-Pérez, A.; Masera, O.; Bocco, G.; Vandermeer, J. Neotropical forest conservation, agricultural intensification, and rural out-migration: The Mexican experience. BioScience 2009, 59, 863–873. [Google Scholar] [CrossRef] [Green Version]
- Agar, M. We have met the other and we’re all nonlinear: Ethnography as a nonlinear dynamic system. Complexity 2004, 10, 16–24. [Google Scholar] [CrossRef]
- Bernard, R. Research Methods in Anthropology; Walnut Creek: AltaMira, CA, USA, 2011. [Google Scholar]
- Chayanov, A. La Organización de la Unidad Económica Campesina; Nueva Visión: Buenos Aires, Argentina, 1985. [Google Scholar]
- Netting, R. Households: Comparative and Historical Studies of the Domestic Group; University of California Press: Berkeley, CA, USA, 1984. [Google Scholar]
- Hothorn, T.; Hornik, K.; van de Wiel, M.; Achim, Z. A lego system for conditional inference. Am. Stat. 2006, 60, 257–263. [Google Scholar] [CrossRef] [Green Version]
- Agresti, A. An Introduction to Categorical Data Analysis; Wiley & Sons: Hoboken, NJ, USA, 2009. [Google Scholar]
- R Development Core Team. R: A Language and Environment for Statistical Computing; R Foundation for Statistical Computing: Vienna, Austria, 2019. [Google Scholar]
- Wasserman, S.; Faust, K. Social Network Analysis; Cambridge University Press: Cambridge, UK, 1994. [Google Scholar]
- Borgatti, S.; Mehra, A.; Brass, D.; Labianca, G. Network analysis in the social sciences. Science 2009, 323, 892–895. [Google Scholar] [CrossRef] [PubMed] [Green Version]
- Krzywinski, M.; Birol, I.; Jones, S.; Marra, M. Hive plots—Rational approach to visualizing networks. Brief. Bioinform. 2011, 13, 627–644. [Google Scholar] [CrossRef] [PubMed]
- Bacon, C.; Mendez, E.; Flores-Gomez, M.; Douglass, S.; Diaz Flores, S. Are sustainable coffee certifications enough to secure farmer livelihoods? The millennium development goals and Nicaragua’s fair trade cooperatives. Globalizations 2008, 5, 259–274. [Google Scholar]
- Shriar, A. In search of sustainable land use and food security in the arid hillside regions of Central America: Putting the horse before the cart. Hum. Ecol. 2007, 35, 275–287. [Google Scholar] [CrossRef]
- Scoones, I.; Melnyk, M.; Pretty, J. (Eds.) The Hidden Harvest: Wild Foods and Agricultural Systems: A Literature Review and Annotated Bibliography; International Institute for Environmental and Development: London, UK, 1992. [Google Scholar]
- Bye, R.; Linares, E. The role of plants found in the Mexican markets and their importance in ethnobotanical studies. J. Ethnobiol. 1983, 3, 1–13. [Google Scholar]
- Bharucha, Z.; Pretty, J. The roles and values of wild foods in agricultural systems. Philos. Trans. R. Soc. B Biol. Sci. 2010, 365, 2913–2926. [Google Scholar] [CrossRef] [Green Version]
- Baldermann, S.; Blagojević, L.; Frede, K.; Klopsch, R.; Neugart, S.; Neumann, A.; Schreiner, M. Are neglected plants the food for the future? Crit. Rev. Plant Sci. 2016, 35, 106–119. [Google Scholar] [CrossRef] [Green Version]
- Maxwell, D.; Caldwell, R.; Langworthy, M. Measuring food insecurity: Can an indicator based on localized coping behaviours be used to compare across contexts? Food Policy 2008, 33, 533–540. [Google Scholar] [CrossRef]
- Isakson, R. No hay ganancia en la milpa’: The agrarian question, food sovereignty, and the on-farm conservation of agrobiodiversity in the Guatemalan highlands. J. Peasant. Stud. 2009, 36, 725–759. [Google Scholar] [CrossRef] [Green Version]
- Sánchez López, M.; Coporo Quintana, G.; Galindo Albores, J. Defensoría de jornaleros agrícolas migrantes del estado de Chiapas. Cuad. Intercamb. Sobre Cent. Y El Caribe 2020, 17, e40364. [Google Scholar] [CrossRef]
- Büscher, B.; Fletcher, R. Towards convivial conservation. Conserv. Soc. 2019, 17, 283–296. [Google Scholar] [CrossRef]
- Barkin, D. The end to food self-sufficiency in Mexico. Lat. Am. Perspect. 1987, 14, 271–297. [Google Scholar] [CrossRef]
- Valkila, J. Fair Trade organic coffee production in Nicaragua- Sustainable development or a poverty trap? Ecol. Econ. 2009, 68, 3018–3025. [Google Scholar] [CrossRef]
- Neimark, B.; Mahanty, S.; Dressler, W.; Hicks, C. Not just participation: The rise of the eco-precariat in the green economy. Antipode 2020, 52, 496–521. [Google Scholar] [CrossRef] [PubMed] [Green Version]
- Arslan, A.; Taylor, E. Farmers’ subjective valuation of subsistence crops: The case of traditional maize in Mexico. Am. J. Agric. Econ. 2009, 91, 956–972. [Google Scholar] [CrossRef] [Green Version]
- Rosset, P.; Altieri, M. Agroecology: Science and Politics; Fernwood Publishing: Black Point, NS, Canada, 2017. [Google Scholar]
- Jarosz, L. Understanding agri-food networks as social relations. Agric. Hum. Values 2020, 17, 279–283. [Google Scholar] [CrossRef]
- Van Der Vorst, J. Performance measurement in agrifood supply chain networks: An overview. In Quantifying the Agri-Food Supply Chain; Ondersteijen, C., Wijnands, J., Huirne, R., Kooten, O., Eds.; Springer: Dordrecht, The Netherlands, 2005; pp. 13–24. [Google Scholar]
- Aguilar Gallegos, N.; Olvera Martínez, J.; González Martínez, E.; Aguilar Ávila, J.; Muñoz Rodríguez, M.; Santoyo Cortés, H. La intervención en red para catalizar la innovación agrícola. Redes Rev. Hisp. Para El Análisis De Redes Soc. 2017, 28, 9–31. [Google Scholar]
- Crespo, J.; Réquier-Desjardins, D.; Jérôme, V. Why can collective action fail in local agri-food systems? A social network analysis of cheese producers in Aculco, Mexico. Food Policy 2014, 46, 165–177. [Google Scholar] [CrossRef]
- Ercsey-Ravasz, M.; Toroczkai, Z.; Lakner, Z.; Baranyi, J. Complexity of the international agro-food trade network and its impact on food safety. PLoS ONE 2012, 7, e37810. [Google Scholar] [CrossRef] [PubMed] [Green Version]
- Porfirio, L.; Newth, D.; Finnigan, J.; Cai, Y. Economic shifts in agricultural production and trade due to climate change. Palgrave Commun. 2018, 4, 1–9. [Google Scholar] [CrossRef]
- Borgatti, S.; Li, X. On social network analysis in a supply chain context. J. Supply Chain. Manag. 2009, 45, 5–22. [Google Scholar] [CrossRef]
- Baggio, J.; Burn Silver, S.; Arena, A.; Magdanz, J.; Kofinas, G.; De Domenico, M. Multiplex social ecological network analysis reveals how social changes affect community robustness more than resource depletion. Proc. Natl. Acad. Sci. USA 2016, 113, 13708–13713. [Google Scholar] [CrossRef] [PubMed] [Green Version]
- Karrer, B.; Levina, E.; Newman, M.E.J. Robustness of community structure in networks. Phys. Rev. E 2008, 77, 046119. [Google Scholar] [CrossRef] [PubMed] [Green Version]
- Callaway, D.; Newman, M.E.J.; Strogatz, S.; Watts, D. Network robustness and fragility: Percolation on random graphs. Phys. Rev. Lett. 2000, 85, 5468. [Google Scholar] [CrossRef] [PubMed] [Green Version]


| Variable | Description | Type | Coding or Mean (% or Range) |
|---|---|---|---|
| Type of ejido membership | 1. Ejidatario (landholders with voice and vote), 2. Poblador (settlers with voice but no vote), or 3. Avecindado (neighbours with neither voice nor vote) | Categorical | 1 (45%), 2 (21%), 3 (34%) |
| Stage of household development cycle | 1. Expansion (newly constituted), 2. dispersal (with children already leaving), or 3. replacement (old) | Categorical | 1 (46%), 2 (26%), 3 (28%) |
| Household members | Total number of members in the household | Continuous | 4.4 (2–11) |
| Agricultural labour force | Household members whose principal occupation is agriculture | Continuous | 1.5 (0–4) |
| Economic activities | Number of agricultural and non-agricultural practiced by the household | Continuous | 2.8 (1–6) |
| Type of migration | 1. No migration, 2. regional, 3. national, or 4. international | Categorical | 1 (68%), 2 (7%), 3 (8%), 4 (17%) |
| Total labour-days worked | Days worked by all household members | Continuous | 46.2 (0–300) |
| Total labour-days paid | Days paid for all economic activities | Continuous | 121.2 (0–1910) |
| Total agricultural hectares | Hectares used for agriculture | Continuous | 18.1 (0.5–139) |
| Maize production | Tons of total maize yield (for self-supply, animal feed or sale) | Continuous | 4654.6 (0–30,000) |
| Bean production | Tons of total bean yield (for self-supply or sale) | Continuous | 285.9 (0–4000) |
| Months of food scarcity | Number of months the household reported shortages | Continuous | 2.9 (0–12) |
| Eating wild foods | 1. Whether or 2. not the household consumed wild foods | Categorical | 1 (57%), 2 (43%) |
| Government assistance | Amount of government assistance the household received | Continuous | 16,045 (0–62,000) |
| Income | Total income of the household | Continuous | 56,806 (0–300,000) |
| Livestock | Total head of cattle | Continuous | 6.8 (0–80) |
| Location in the watershed | 1. Upper (agroforestry in the headwaters) or 2. lower (agropecuary in the central valleys) | Categorical | 1 (50%), 2 (50%) |
| Cluster identity | 1 and 2 (social reproduction in accumulation), 3 and 4 (social reproduction squeeze) | Categorical | 1 (4%), 2 (32%), 3 (43%), 4 (21%) |
| Metric | Level | Description | Interpretation |
|---|---|---|---|
| Nodes | Global | Total number of basic data structure units | Shows changes in size, cohesion and dissociation of the supply by food type between abundant and scarce seasons |
| Edges | Global | Total number of links | |
| Density | Global | Total number of existing links, divided by total links possible in the network | |
| Average degree | Global | Measurement of the number of edges versus the number of nodes | |
| Average in degree centrality | Global | Average connectivity per node | |
| Global efficiency | Global | Efficiency of a node pair in a graph is the multiplicative inverse of the shortest path distance between nodes. Average global efficiency of a graph is the average efficiency of all node pairs | Enables observation of changes in the food-supply flow between abundant and scarce seasons |
| Average page rank | Global | A centrality metric that results from an algorithm, which measures the network ranking on a scale of 1–10, based on the weight, the quantity, and the quality of links | Enables the observation of changes in the robustness of the supply by food type, between seasons |
| Average node connectivity | Global | The minimum number of nodes that must be removed to break all paths from source to target | Enables observation of supply vulnerability by food type between seasons |
| Connected components | Global | Number of subgraphs in which any two vertices are connected to each other by paths and which are connected to no additional vertices in the supergraph | Enables observation of changes in food supply groupings between seasons |
| Average out-degree centrality | Global | The out-degree centrality for a node is the fraction of nodes that its outgoing edges are connected to | Captures the centrality of a provider in the supply for all households |
| Local efficiency | Local | The local efficiency of a node in the graph is the average global efficiency of the subgraph, induced by the neighbours of the node. The average local efficiency is the average of the local efficiencies of each node | Allows observation of changes in the food supply flows at node level, between abundant and scarce seasons |
| Average node strength | Local | The sum of link weights connected to all nodes | Reports changes in the food flows that the nodes hold within the network |
| Self-loops | Local | Nodes connected to themselves | Shows directly the importance of self-sufficiency, for each food and season |
| Variables | Seasonal Food-Scarcity Months | Livestock | Government Assistance |
|---|---|---|---|
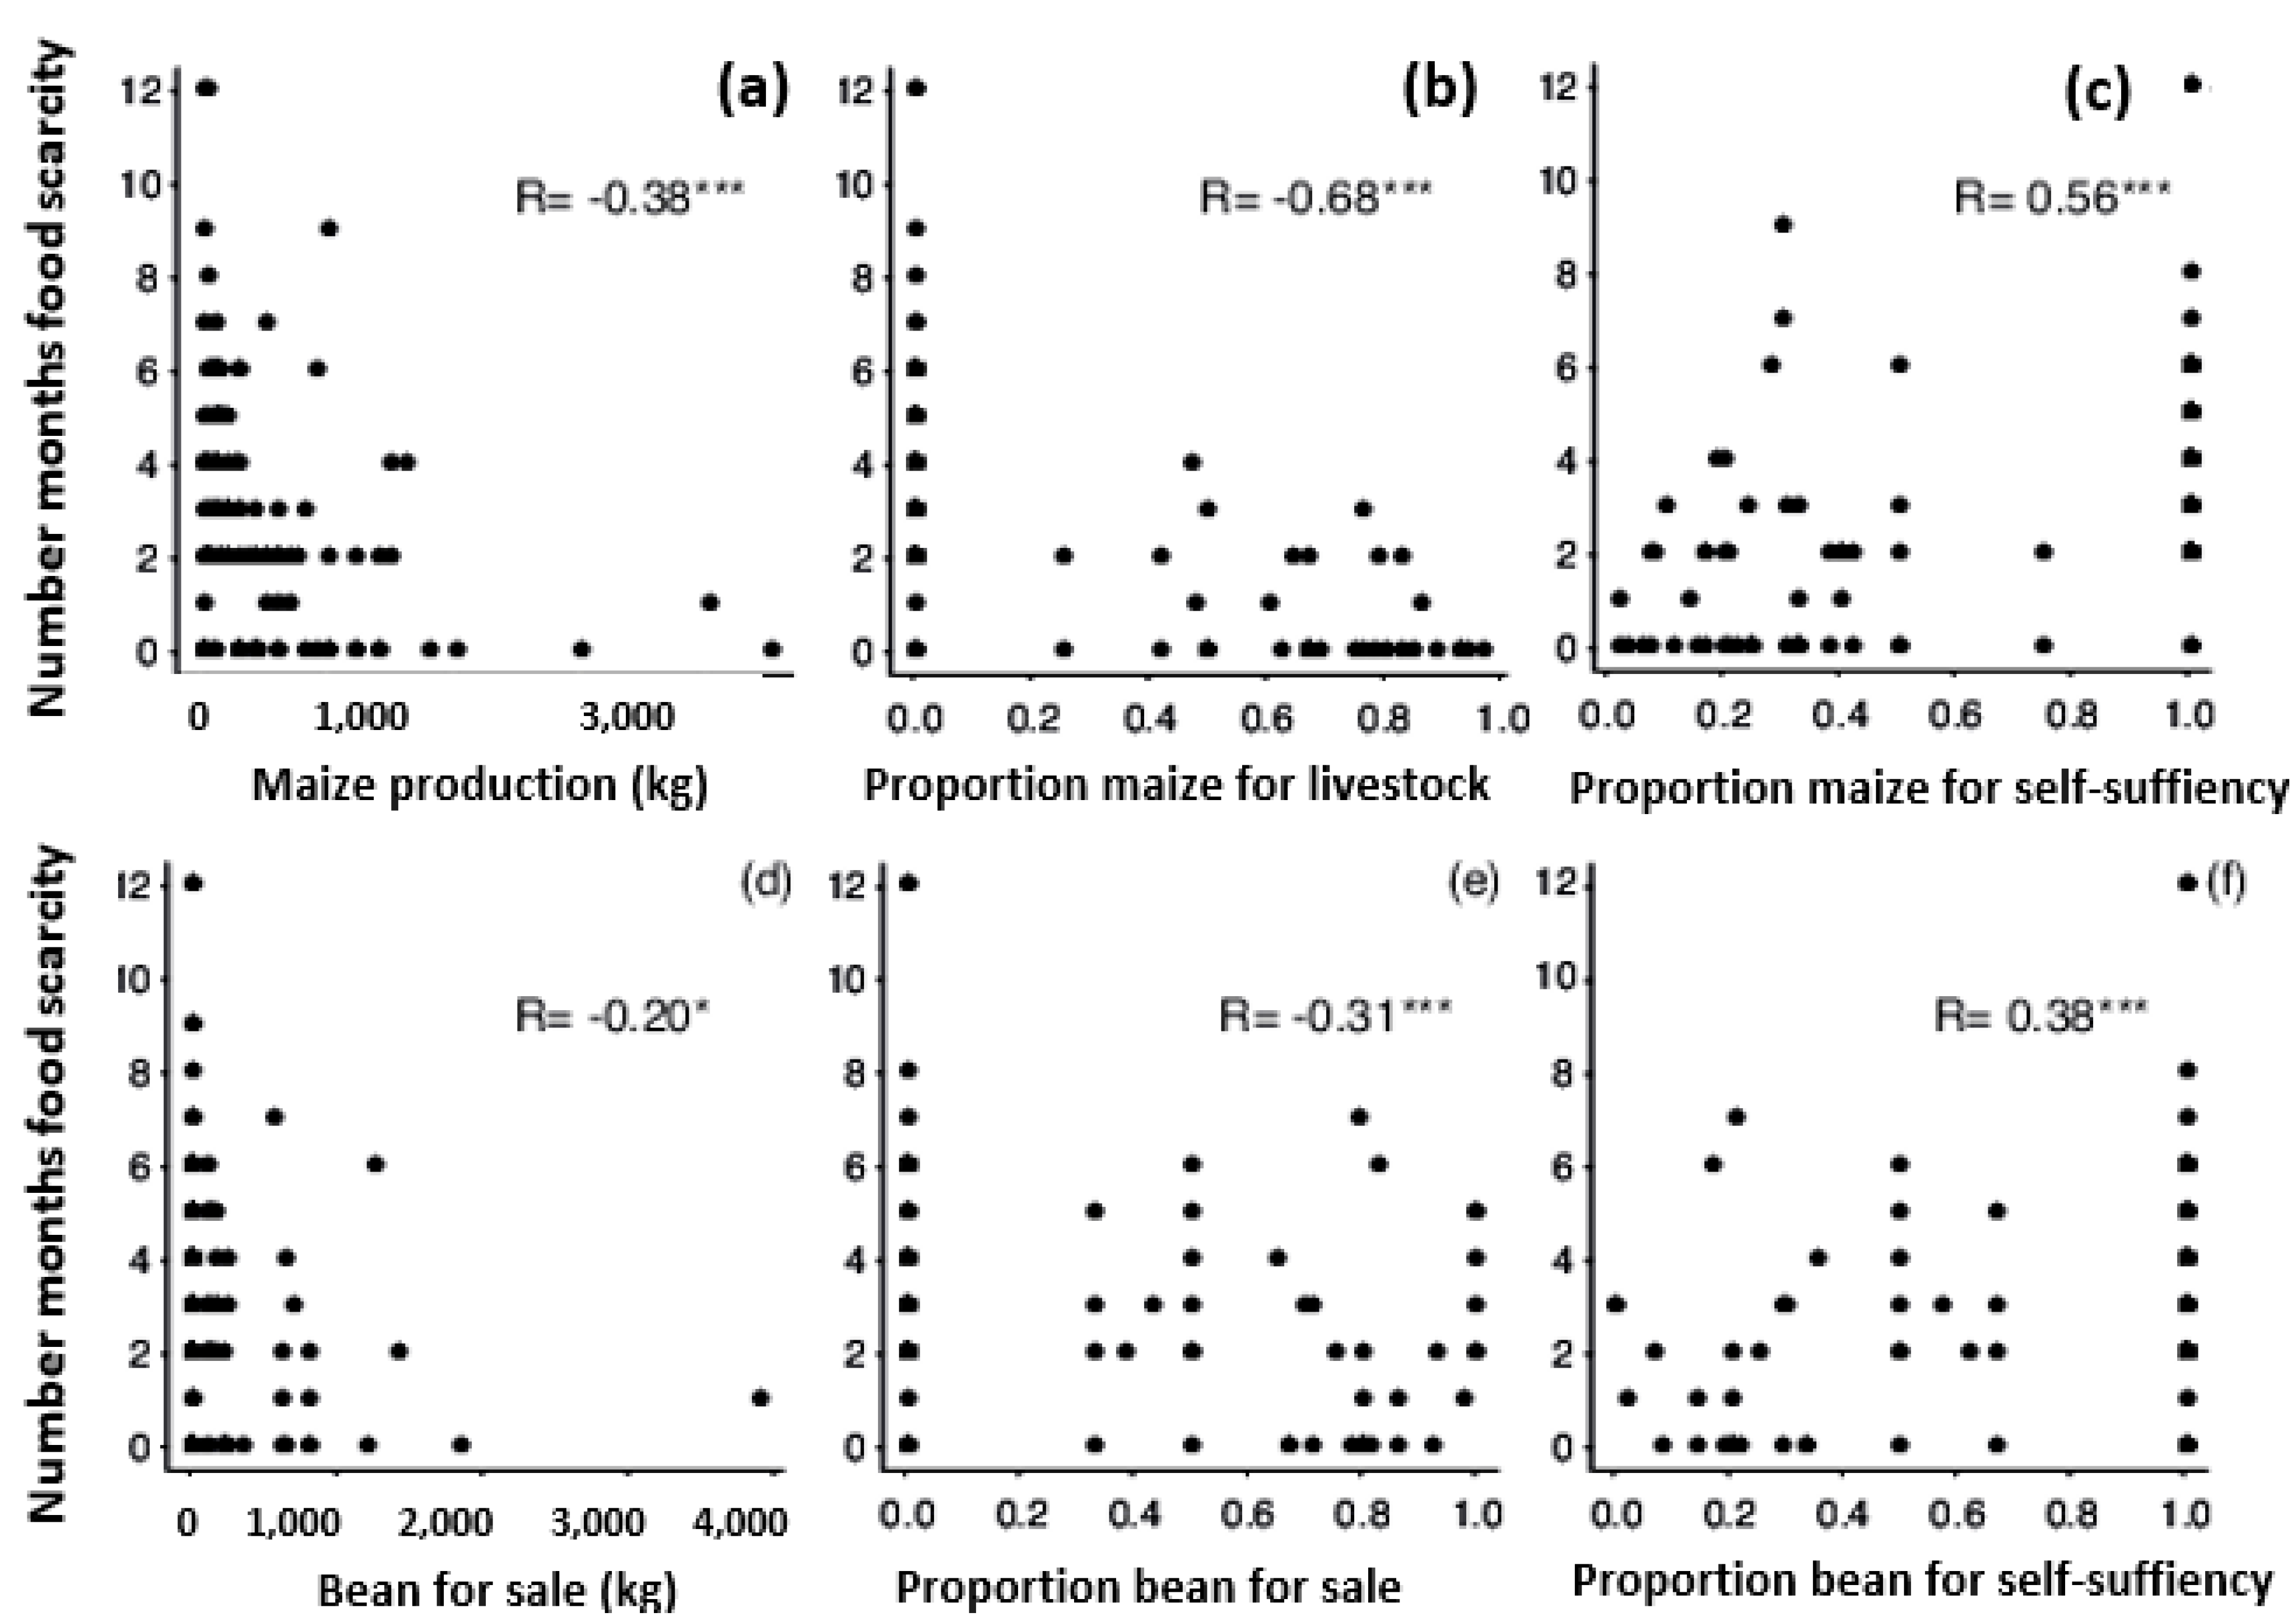
| Total maize production (kg) | −0.38 *** | ||
| Maize production for self-sufficiency | −0.12 ns | ||
| Proportion of maize production for self-sufficiency | 0.56 *** | ||
| Maize production for sale | −0.01 ns | ||
| Proportion of maize production for sale | −0.01 ns | ||
| Maize production for livestock | −0.59 *** | ||
| Proportion of maize production for livestock | −0.68 *** | ||
| Total bean production | −0.10 ns | ||
| Bean production for self-sufficiency | 0.03 ns | ||
| Proportion of bean production for self-sufficiency | 0.38 *** | ||
| Bean production for sale | −0.20 * | ||
| Proportion of bean production for sale | −0.31 *** | ||
| Total agricultural hectares | −0.64 *** | 0.84 *** | 0.53 *** |
| Livestock | −0.65 *** | - | 0.51 *** |
| Government assistance | −0.39 *** | 0.51 *** | - |
| Economic activities | −0.10 ns | ||
| Number of household members | 0.15 ns | ||
| Agricultural labour force | 0.20 * |
| Coping Strategies | |||||
|---|---|---|---|---|---|
| Type of ejido membership | 1 | 2 | 3 | 4 | 5 |
| Avecindado | 4 (−3.70) | 14 (−0.06) | 8 (3.04) | 6 (0.93) | 5 (2.15) |
| Poblador | 7 (−0.09) | 12 (1.82) | 0 (−1.81) | 2 (−0.53) | 1 (0.47) |
| Ejidatario | 18 (3.94) | 8 (−1.60) | 1 (−1.51) | 3 (−0.48) | 0 (−1.81) |
| Type of migration | 1 | 2 | 3 | 4 | 5 |
| International | 2 (0.76) | 0 (−1.61) | 0 (−0.69) | 2 (2.34) | 0 (−0.55) |
| National | 3 (−0.19) | 0 (2.64) | 0 (−1.13) | 7 (5.88) | 0 (−0.90) |
| No migration | 20 (−0.96) | 34 (4.25) | 8 (1.00) | 0 (−6.18) | 5 (0.47) |
| Regional | 4(1.10) | 0 (−2.33) | 1 (0.23) | 2 (1.14) | 1 (0.68) |
| Location in the watershed | 1 | 2 | 3 | 4 | 5 |
| Upper | 24 (3.51) | 16 (−1.36) | 2 (−2.17) | 5 (−0.77) | 3 (−0.32) |
| Lower | 5 (−3.51) | 18 (1.36) | 7 (2.17) | 6 (0.77) | 3 (0.32) |
| Food Type | Local Name | Scientific Name | Gathering Unit |
|---|---|---|---|
| Herbs and vegetables | Hierba mora | Solanum nigrum | Polycrop |
| Chipilín | Crotalaria longirostrata | Polycrop | |
| Orejita | Porophylum ruderale | Polycrop | |
| Bledo | Amaranthus blitoides | Polycrop | |
| Canutillo | Hamelia patens | Polycrop | |
| Hierba santa | Piper auritum | Bush | |
| Berro | Nasturtium officinale | Polycrop | |
| Chaya | Cnidoscolus aconitifolius | Bush | |
| Verdolaga | Portulaca oleracea | Bush | |
| Nabito | Brassica napus | Polycrop | |
| Ejote de monte | Phaseolus vulgaris | Bush | |
| Cilantro de monte | Peperomia peltilimba | Bush | |
| Inflorescences, fruits, meristems, and roots | Flor y puntas de Calabaza | Cucurbita lundelliana | Polycrop |
| Puntas de chayote | Sechium chinantlense | Bush | |
| Pacaya | Chamaedorea tepejilote | Bush | |
| Anona | Annona reticulata | Bush | |
| Cuscuta | Amphipterygium adstringens | Bush | |
| Tomatillo de monte | Lycopersico esculentum | Bush | |
| Tubercles | Madre maíz | Mirabilis sp. | Bush |
| Stalks | Nopal espinero | Opuntia | Bush |
| Nopal masetero | Opuntia | Home garden | |
| Mushrooms | Hongo blanco | Tremelloscypha gelatinosa | Bush |
| Hongo orejita de cochi | Hypomyces lactifluorum | Bush | |
| Insects | Hormiga chicatana | Atta mexicana | Bush |
| Gusano zats | Arsenura armida | Bush | |
| Chapulín | Sphenarium purpurascens | Polycrop | |
| Reptiles | Iguana verde | Iguana iguana | Bush |
| Iguana negra | Ctenosaura pectinata | Bush | |
| Turipache | Corytophanes percarinatus | Bush | |
| Fish | Macabí | Albula vulpes | River |
| Mojarra de río | Diplodus vulgaris | River | |
| Charal de río | Chirostoma sp. | River | |
| Carpa de río | Cyprinus carpio | River | |
| Crustaceans | Cangrejos de río | Astacoidea and Parastacoidea | River |
| Snails | Caracoles chuti | Pachychilidae | River |
Publisher’s Note: MDPI stays neutral with regard to jurisdictional claims in published maps and institutional affiliations. |
© 2022 by the authors. Licensee MDPI, Basel, Switzerland. This article is an open access article distributed under the terms and conditions of the Creative Commons Attribution (CC BY) license (https://creativecommons.org/licenses/by/4.0/).
Share and Cite
Rivera-Núñez, T.; García-Barrios, L.; Benítez, M.; Rosell, J.A.; García-Herrera, R.; Estrada-Lugo, E. Unravelling the Paradoxical Seasonal Food Scarcity in a Peasant Microregion of Mexico. Sustainability 2022, 14, 6751. https://doi.org/10.3390/su14116751
Rivera-Núñez T, García-Barrios L, Benítez M, Rosell JA, García-Herrera R, Estrada-Lugo E. Unravelling the Paradoxical Seasonal Food Scarcity in a Peasant Microregion of Mexico. Sustainability. 2022; 14(11):6751. https://doi.org/10.3390/su14116751
Chicago/Turabian StyleRivera-Núñez, Tlacaelel, Luis García-Barrios, Mariana Benítez, Julieta A. Rosell, Rodrigo García-Herrera, and Erin Estrada-Lugo. 2022. "Unravelling the Paradoxical Seasonal Food Scarcity in a Peasant Microregion of Mexico" Sustainability 14, no. 11: 6751. https://doi.org/10.3390/su14116751