
Decision-Tree Based Methodology Aid in Assessing the Sustainable Development of a Manufacturing Company


Abstract
:1. Introduction
- The overview of the related works is presented and discussed by pointing out the additional contribution of the research to the recent state of the research field.
- The methodology for developing a model aid in assessing the level of SD of a manufacturing company based on the developed objectives and indicators of SD is proposed in this paper.
- The fuzzy rules for a decision-tree (DT) based support model was developed in collaboration with manufacturing experts.
- The presented model involves decision tree theory for the purpose of creating the recommended decisions for the Management Board in order to increase the level of SD within a manufacturing company.
- The proposed model is explained by an example of a real-life manufacturing company.
2. Materials and Methods
2.1. Analytic Hierarchy Process (AHP) Method and Decision-Tree (DT)
2.2. The Methodology for Developing a Methodology Aid Assessing a Level of SD
- (1)
- Determination of SD indicators based on literature analysis.
- economic, including activities related to production, distribution, supply, and consumption [23]. The SD indicators in the economic aspect include, e.g., [23,24,25,26,27] total space, new investments, total sales, total tax paid, innovations created through supplier partnerships, energy consumption, turnover, absenteeism, return on investment, service cost, labour costs, zero customer complaints or product returns, quality, production rate/productivity, stakeholder review and participation in decision-making.
- social, which relates to human activities, including job vacancies, safety, and protection of workers and the public during production processes [23]. The SD indicators in the social aspect include, e.g., [23,24,25,26,27,28]: annual number of recordable accidents per employee, average annual training time per employee, increasing employment opportunities for the local community, green image, health and safety, and employee compensation.
- environmental, which refers to the conditions surrounding human life [23]. The SD indicators in the environmental aspect include e.g., [23,24,25,26,28,29]: material consumption, water consumption, air emissions, waste segregation, waste minimization, number of implemented ISO standards, the share of facilities using renewable energy, biodiversity, GHG emissions, recycled materials, reprocessed materials, hazardous waste, design of green products, biodegradable packaging.
- A1: production processes involve the re-assignment of a number of resources according to market needs. This re-assignment of resources is carried out by using buildings, machines and equipment, computers, and people. In this area, the main parameters are energy and water consumption, production and labour costs, the level of pollution resulting from production, production efficiency, and the efficiency of the machinery and equipment.
- A2: product durability is primarily a need for creativity, resources, and time. An important parameter in this area is the quality that maps the use of the product. Reliability and durability are equally important parameters in this area.
- A3: product development refers to all stages of product creation, from product design to launch. An important aspect here is customer satisfaction, the environmental impact of the product as well as its price and quality, as compared to that of the competition.
- (2)
- Using the Analytic Hierarchy Process (AHP) method which determines the priority of the SD criteria.
- Step I: Development of a pair comparison matrix;
- Step II: Calculation of weights for individual variants;
- Step III: Determination of the inconsistency index ƛmax;
- Step IV: Determination of the value of the compatibility factor of the CI matrix;
- Step V: Determination of the value of the non-compliance factor CR.
- (3)
- Collecting data to determine the values of the key objectives of SD
- (4)
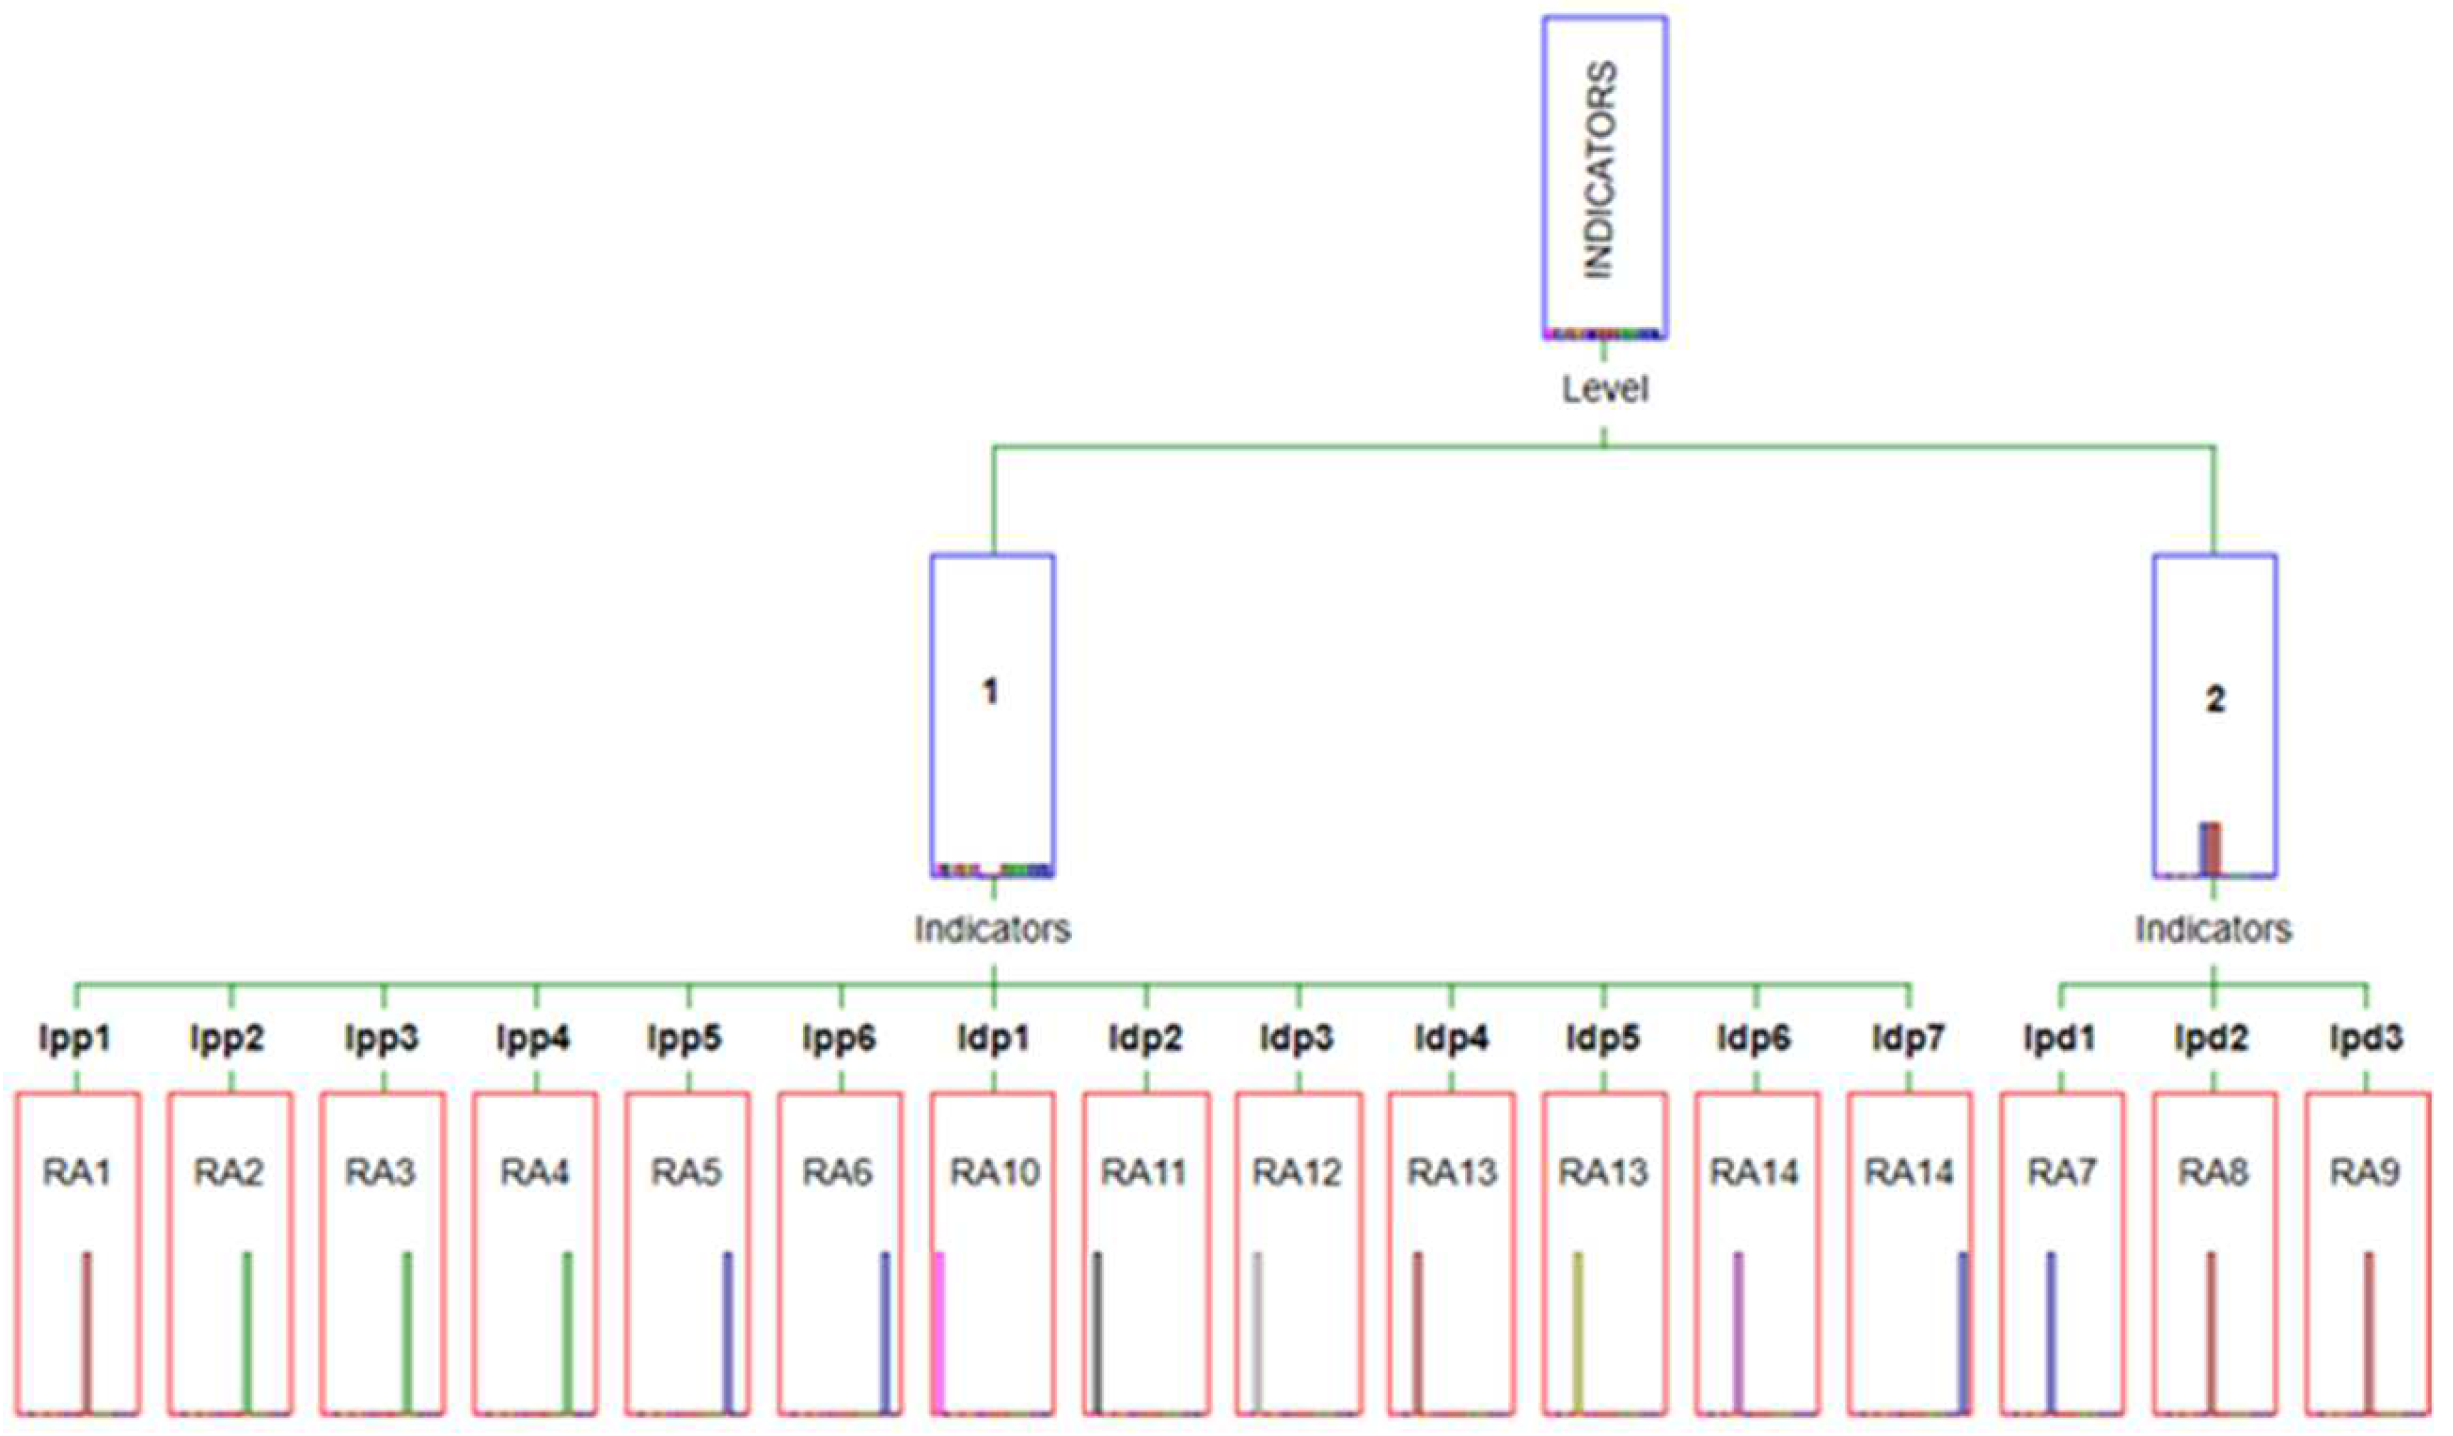
- Using a decision tree to build scenarios of possible actions to increase the level of SD
- Variable 1: SD Indicators (Table 1), where: Ipp = {Ipp1, Ipp2, …, Ipp6}, Idp = {Idp1, Idp2, Idp3}, Ipd = {Ipd1, Ipd2, …, Ipd7}.
- Variable 2: area, where: 1—Production processes, 2—Production durability, 3—Development product
- Variable 3: Level of management, where 1—Strategic, 2—Tactical, 3—Operational
- Variable 4: Indicators Type, where: 1—Cost, 2—Benefit, 3—Not applicable.
- Variable 5: Value, where the values are obtained from a company.
- Variable 6: Reference value
- Variable 7: Action, where: 1—Go to Recommended actions, 2—The indicators are at a good level. Continue activities and monitor progress.
- Variable 8: Recommended actions
- RA1-ECO: Optimisation of machinery and equipment; ENV: Implementation of design for recycling to increase the use of production waste; SOC: Customer service training
- RA2-ECO: Optimisation of machinery and equipment; ENV: Implementation of design for recycling to increase the use of production waste; SOC: Customer service training
- RA3-ECO: Robotisation of manual processes; System optimisation and development; SOC: Operation training
- RA4-ECO: Introduction of daily monitoring of the course of control and technological parameters; SOC: Constant contact with the client
- RA5-ECO: Quality controls: receipt of qualitative product during production, after the end of the production process, and also in circulation trademark; ENV: Removal of non-conformities/reclassification of the product; SOC: Quarterly operator training
- RA6-ECO: Sale of post-production waste; ENV: Analysis of work organisation and production schedule to stabilise the processes; SOC: Employee education
- RA7-ECO: Customer-oriented marketing strategy; ENV = Product quality control; SOC = Employee communication training, raising customer service competences, raising employee qualifications
- RA8-ECO: Discounts for regular customers; ENV = Electronic newsletter; e-invoices; SOC = Internal incentive system
- RA9-ECO: Systematic inspections of machines and devices, Systematic inspections of fire protection systems; SOC: Increase in the frequency of training in the field of occupational safety and fire hazards, Employee involvement in creating safe working conditions, Ergonomic organisation of workstations
- RA10-ECO: Customer-oriented marketing strategy; ENV = Product quality control; SOC = Employee communication training, raising customer service competences, raising employee qualifications
- RA11-ECO: Discounts for regular customers; ENV = Electronic newsletter; e-invoices; SOC = Internal incentive system
- RA12-ECO: Systematic inspections of machines and devices, Systematic inspections of fire protection systems; SOC: Increase in the frequency of training in the field of occupational safety and fire hazards, Employee involvement in creating safe working conditions, Ergonomic organisation of workstations
- RA13,14-ENV: Hazard Assessment of Hazardous Substances, Implementation of an Internal Chemical Control System; SOC: Hazardous Substances Training
- RA15,16-ECO: Energy efficiency; ENV: Environmental risk analysis, Assessment of climate risks and opportunities in the short, medium, and long term, Systematic reporting of climate change/environmental change issues, Waste reduction, Reduction of CO2 emissions; SOC: Promoting pro-ecological solutions.
- (5)
- Indicating recommended actions for continuous monitoring of progress towards reaching SD objectives
- implementation and continuous improvement of a management system in accordance with ISO 9001:2015 and ISO 14001:2015 standards,
- an analysis of customer needs and keeping up with growing customer requirements,
- a full engagement of the management and all employees in achieving the company’s SD objectives,
- ensuring appropriate resources and infrastructure to achieve compliance of the offered products and services with customer expectations and legal requirements,
- educating staff in the area of SD and occupational safety and improving their competences and qualifications.
3. Research Results
- O1: Ipp2 (RA2), Ipp4 (RA4), Ipp5 (RA5), Ipp6 (RA6),
- O2: Idp1 (RA7), Idp3 (RA9),
- O3: Ipd2 (RA11), Ipd4 (RA13), Ipd6 (RA14), Ipd7 (RA14).
4. Discussion
5. Conclusions
Author Contributions
Funding
Institutional Review Board Statement
Informed Consent Statement
Data Availability Statement
Conflicts of Interest
Appendix A
- If (Area = “Production processes”) and (Indicators = “Ipp1”) and (Level = “Strategic”) and (Type of indicators = “Cost”) and (“Value” < “Reference value”) and (Action = “Go to Recommended actions”) then (Recommended decision = “ECO: Optimisation of machinery and equipment; ENV: Implementation of design for recycling to increase the use of production waste; SOC: Customer service training”)
- If (Area = “Production processes”) and (Indicators = “Ipp1”) and (Level = “Strategic”) and (Type of indicators = “Cost”) and (Value = “Reference value”) then (Action = “The indicators are at a good level. Continue activities and monitor progress”)
- If (Area = “Production processes”) and (Indicators = “Ipp2”) and (Level = “Strategic”) and (Type of indicators = “Not applicable”) and (“Value” < “Reference value”) and (Action = “Go to Recommended actions”) then (Recommended decision = “ECO: Optimisation of machinery and equipment; ENV: Implementation of design for recycling to increase the use of production waste; SOC: Customer service training”)
- If (Area = “Production processes”) and (Indicators = “Ipp2”) and (Level = “Strategic”) and (Type of indicators = “Not applicable”) and (Value = “Reference value”) then (Action = “The indicators are at a good level. Continue activities and monitor progress”)
- If (Area = “Production processes”) and (Indicators = “Ipp3”) and (Level = “Strategic”) and (Type of indicators = “Not applicable “) and (“Value” < “Reference value”) and (Action = “Go to Recommended actions”) then (Recommended decision = “ECO: Robotisation of manual processes; System optimisation and development; SOC: Operation training”)
- If (Area = “Production processes”) and (Indicators = “Ipp3”) and (Level = “Strategic”) and (Type of indicators = “Not applicable”) and (Value = “Reference value”) then (Action = “The indicators are at a good level. Continue activities and monitor progress”)
- If (Area = “Production processes”) and (Indicators = “Ipp4”) and (Level = “Strategic”) and (Type of indicators = “Cost”) and (“Value” < “Reference value”) and (Action = “Go to Recommended actions”) then (Recommended decision = “ECO: Introduction of daily monitoring of the course of control and technological parameters; SOC: Constant contact with the client”)
- If (Area = “Production processes”) and (Indicators = “Ipp4”) and (Level = “Strategic”) and (Type of indicators = “Cost”) and (Value = “Reference value”) then (Action = “The indicators are at a good level. Continue activities and monitor progress”)
- If (Area = “Production processes”) and (Indicators = “Ipp5”) and (Level = “Strategic”) and (Type of indicators = “Cost”) and (“Value” < “Reference value”) and (Action = “Go to Recommended actions”) then (Recommended decision = “ECO: Quality controls: receipt qualitative product during production, after the end of the production process and also in circulation trademark; ENV: Removal of non-conformities/reclassification of the product; SOC: Quarterly operator training”)
- If (Area = “Production processes”) and (Indicators = “Ipp5”) and (Level = “Strategic”) and (Type of indicators = “Cost”) and (Value = “Reference value”) then (Action = “The indicators are at a good level. Continue activities and monitor progress”)
- If (Area = “Production processes”) and (Indicators = “Ipp6”) and (Level = “Strategic”) and (Type of indicators = “Benefit”) and (“Value” < “Reference value”) and (Action = “Go to Recommended actions”) then (Recommended decision = “ECO: Sale of post-production waste; ENV: Analysis of work organisation and production schedule to stabilise the processes; SOC: Employee education”)
- If (Area = “Production processes”) and (Indicators = “Ipp6”) and (Level = “Strategic”) and (Type of indicators = “Benefit”) and (Value = “Reference value”) then (Action = “The indicators are at a good level. Continue activities and monitor progress”)
- If (Area = “Production durability”) and (Indicators = “Ipd1”) and (Level = “Strategic”) and (Type of indicators = “Benefit”) and (“Value” < “Reference value”) and (Action = “Go to Recommended actions”) then (Recommended decision = “ECO: Implementation of activities in accordance with the PN EN ISO 9000: 2015 standard; ENV: Use of safe, high-quality materials; SOC: Building relationship relationships with customer”)
- If (Area = “Production durability”) and (Indicators = “Ipd1”) and (Level = “Tactical”) and (Type of indicators = “Benefit”) and (Value = “Reference value”) then (Action = “The indicators are at a good level. Continue activities and monitor progress”)
- If (Area = “Production durability”) and (Indicators = “Ipd2”) and (Level = “Tactical”) and (Type of indicators = “Not applicable”) and (“Value” < “Reference value”) and (Action = “Go to Recommended actions”) then (Recommended decision = “ECO: Implementation of activities in accordance with the PN EN ISO 9000: 2015 standard; ENV: Use of safe, high-quality materials; SOC: Building relationship relationships with customer”)
- If (Area = “Production durability”) and (Indicators = “Ipd2”) and (Level = “Tactical”) and (Type of indicators = “Not applicable”) and (Value = “Reference value”) then (Action = “The indicators are at a good level. Continue activities and monitor progress”)
- If (Area = “Production durability”) and (Indicators = “Ipd3”) and (Level = “Tactical”) and (Type of indicators = “Not applicable”) and (“Value” < “Reference value”) and (Action = “Go to Recommended actions”) then (Recommended decision = “ECO: After-sales service; ENV: Spare parts offer; SOC: Development of transparent website rules; availability of spare parts”)
- If (Area = “Production durability”) and (Indicators = “Ipd3”) and (Level = “Tactical”) and (Type of indicators = “Not applicable”) and (Value = “Reference value”) then (Action = “The indicators are at a good level. Continue activities and monitor progress”)
- If (Area = “Development product”) and (Indicators = “Idp1”) and (Level = “Strategic”) and (Type of indicators = “Benefit”) and (“Value” < “Reference value”) and (Action = “Go to Recommended actions”) then (Recommended decision = “ECO: Customer-oriented marketing strategy; ENV = Product quality control; SOC = Employee communication training, raising customer service competences, raising employee qualifications”)
- If (Area = “Development product”) and (Indicators = “Ipd1”) and (Level = “Strategic”) and (Type of indicators = “Benefit”) and (Value = “Reference value”) then (Action = “The indicators are at a good level. Continue activities and monitor progress”)
- If (Area = “Development product”) and (Indicators = “Idp2”) and (Level = “Strategic”) and (Type of indicators = “Benefit”) and (“Value” < “Reference value”) and (Action = “Go to Recommended actions”) then (Recommended decision = “ECO: Discounts for regular customers; ENV = Electronic newsletter; e-invoices; SOC = Internal incentive system”)
- If (Area = “Development product”) and (Indicators = “Ipd2”) and (Level = “Strategic”) and (Type of indicators = “Benefit”) and (Value = “Reference value”) then (Action = “The indicators are at a good level. Continue activities and monitor progress”)
- If (Area = “Development product”) and (Indicators = “Idp3”) and (Level = “Strategic”) and (Type of indicators = “Cost”) and (“Value” < “Reference value”) and (Action = “Go to Recommended actions”) then (Recommended decision = “ECO: Systematic inspections of machines and devices, Systematic inspections of fire protection systems; SOC: Increase in the frequency of training in the field of occupational safety and fire hazards, Employee involvement in creating safe working conditions, Ergonomic organisation of work stations”)
- If (Area = “Development product”) and (Indicators = “Ipd3”) and (Level = “Strategic”) and (Type of indicators = “Cost”) and (Value = “Reference value”) then (Action = “The indicators are at a good level. Continue activities and monitor progress”)
- If (Area = “Development product”) and (Indicators = “Ipd4” and/or “Ipd5”) and (Level = “Strategic”) and (Type of indicators = “Cost”) and (“Value” < “Reference value”) and (Action = “Go to Recommended actions”) then (Recommended decision = “ENV: Hazard Assessment of Hazardous Substances, Implementation of an Internal Chemical Control System; SOC: Hazardous Substances Training”)
- If (Area = “Development product”) and (Indicators = “Ipd4” and/or “Ipd5”) and (Level = “Strategic”) and (Type of indicators = “Cost”) and (Value = “Reference value”) then (Action = “The indicators are at a good level. Continue activities and monitor progress”)
- If (Area = “Development product”) and (Indicators = “Ipd6” and/or “Ipd7”) and (Level = “Strategic”) and (Type of indicators = “Not applicable”) and (“Value” < “Reference value”) and (Action = “Go to Recommended actions”) then (Recommended decision = “(ECO: Energy efficiency; ENV: Environmental risk analysis, Assessment of climate risks and opportunities in the short, medium, long term, Systematic reporting of climate change / environmental change issues, Waste reduction, Reduction of CO2 emissions; SOC: Promoting pro-ecological solutions”)
- If (Area = “Development product”) and (Indicators = “Ipd6” and/or “Ipd7”) and (Level = “Strategic”) and (Type of indicators = “Not applicable”) and (Value = “Reference value”) then (Action = “The indicators are at a good level. Continue activities and monitor progress”).
References
- Assad, F.; Konstantinov, S.; Rushforth, E.; Vera, D.; Harrison, R. Virtual engineering in the support of sustainable assembly systems. Procedia CIRP 2021, 97, 367–372. [Google Scholar]
- Jasiulewicz-Kaczmarek, M.; Żywica, P.; Gola, A. Fuzzy set theory driven maintenance sustainability performance model: A multiple criteria approach. J. Intell. Manuf. 2021, 32, 1497–1515. [Google Scholar] [CrossRef]
- Watson, N.; Porcu, L.; Bacon, D.; Rigley, M.; Gomes, R. Multiple target data-driven models to enable sustainable process manufacturing: An industrial bioprocess case study. J. Clean. Prod. 2021, 296, 126242. [Google Scholar]
- Wicher, P.; Zapletal, F.; Lenort, R. Sustainability performance assessment of industrial corporation Rusing Fuzzy Analytic Network Process. J. Clean. Prod. 2019, 241, 118132. [Google Scholar] [CrossRef]
- Shayganmehr, M.; Kumar, K.; Luthra, S.; Garza-Reyes, J. A framework for assessing sustainability in multi-tier supply chains using empirical evidence and fuzzy expert system. J. Clean. Prod. 2021, 317, 128302. [Google Scholar] [CrossRef]
- Amrani, S.; Hossain, N.; Karam, S.; Jaradat, R.; Nur, F.; Hamilton, M.; Ma, J. Modelling and assessing sustainability of a supply chain network leveraging multi Echelon Bayesian Network. J. Clean. Prod. 2021, 302, 126855. [Google Scholar] [CrossRef]
- Azapagic, A.; Stamford, L.; Youds, L.; Barteczko-Hibbert, C. Towards sustainable production and consumption: A novel DEcision-Support Framework IntegRating Economic, Environmental and Social Sustainability (DESIRES). Comput. Chem. Eng. 2016, 91, 93–103. [Google Scholar] [CrossRef]
- Memari, A.; Dargi, A.; Jokar, M.; Ahmad, R.; Rahim, A. Sustainable supplier selection: A multi-criteria intuitionistic fuzzy TOPSIS method. J. Manuf. Syst. 2019, 50, 9–24. [Google Scholar] [CrossRef]
- Kusi-Sarpond, D.; Mubarik, M.; Khan, S.A.; Brown, S.; Mubarak, M.F. Intellectual capital, blockchain-driven supply chain and sustainable production: Role of supply chain mapping. Technol. Forecast. Soc. Chang. 2022, 175, 121331. [Google Scholar] [CrossRef]
- Owida, A.; Galal, N.; Elrafie, A. Decision-making framework for a resilient sustainable production system during COVID-19: An evidence-based research. Comput. Ind. Eng. 2022, 164, 107905. [Google Scholar] [CrossRef]
- Pekel, E. Estimation of soil moisture using decision tree regression. Theor. Appl. Climatol. 2020, 139, 1111–1119. [Google Scholar] [CrossRef]
- Ferro, M.; Silva GD de Paula, F.; Vieira, V.; Schulze, B. Towards a sustainable artificial intelligence: A case study of energy efficiency in decision tree algorithms. Concurr. Computation. Pract. Exp. 2021; in press. [Google Scholar]
- Keyvanfar, A.; Ferwati, M.S.; Shafaghat, A.; Lamit, L. A Path Walkability Assessment Index Model for Evaluating and Facilitating Retail Walking Using Decision-Tree-Making (DTM) Method. Sustainability 2018, 10, 1035. [Google Scholar] [CrossRef] [Green Version]
- Jung, H.; Jeon, J.; Choi, D.; Park, Y.-W. Application of Machine Learning Techniques in Injection Molding Quality Prediction: Implications on Sustainable Manufacturing Industry. Sustainability 2021, 13, 4120. [Google Scholar] [CrossRef]
- Schulte, J.; Knuts, S. Sustainability impact and effects analysis—A risk management tool for sustainable product development. Sustain. Prod. Consum. 2022, 30, 737–751. [Google Scholar] [CrossRef]
- Pacheco, J.M.; de Castro Dantas, T.N.; Aramayo, J.L.; Santos, A. A new sustainability analysis technique for the design of oil production facilities. Clean. Eng. Technol. 2022, 6, 100370. [Google Scholar] [CrossRef]
- Barletta, I.; Despeisse, M.; Hoffenson, S.; Johansson, B. Organisational sustainability readiness: A model and assessment tool for manufacturing companies. J. Clean. Prod. 2021, 284, 125404. [Google Scholar] [CrossRef]
- Machado, C.; Despeisse, M.; Winroth, M.; Silvacd, E.H.D. Additive manufacturing from the sustainability perspective: Proposal for a self-assessment tool. Procedia CIRP 2019, 81, 482–487. [Google Scholar] [CrossRef]
- Patalas-Maliszewska, J.; Łosyk, H. An Approach to Assessing Sustainability in the Development of a Manufacturing Company. Sustainability 2020, 12, 8787. [Google Scholar] [CrossRef]
- Guggari, S.; Kadappa, V.; Umadevi, V. Non-sequential partitioning approaches to decision tree classifier. Future Comput. Inform. J. 2018, 3, 275–285. [Google Scholar] [CrossRef]
- Koulinas, G.; Paraschos, P.; Koulouriotis, D. A Decision Trees-based knowledge mining approach for controlling a complex production system. Procedia Manuf. 2020, 51, 1439–1445. [Google Scholar] [CrossRef]
- Panhalkar, A.; Doye, D. Optimization of decision trees using modified African buffalo algorithm. J. King Saud Univ.-Comput. Inf. Sci. 2021; in press. [Google Scholar] [CrossRef]
- Chang, A.; Cheng, Y. Analysis model of the sustainability development of manufacturing small and medium-sized enterprises in Taiwan. J. Clean. Prod. 2019, 207, 458–473. [Google Scholar] [CrossRef]
- Erol, I.; Sencer, S.; Sari, R. A new fuzzy multi-criteria framework for measuring sustainability performance of a supply chain. Ecol. Econ. 2011, 70, 1088–1100. [Google Scholar] [CrossRef]
- Ramasamy, G.; Ratnasingam, J.; Bakar, E.S.; Halis, R.; Muttiah, N. Assessment of environmental emissions from sawmilling activity in Malaysia. BioResources 2015, 10, 6643–6662. [Google Scholar] [CrossRef] [Green Version]
- Swarnakar, V.; Singh, A.; Antony, J.; Jayaraman, R.; Tiwari, A.; Rathi, R.; Cudney, E. Prioritizing Indicators for Sustainability Assessment in Manufacturing Process: An Integrated Approach. Sustainability 2022, 14, 3264. [Google Scholar] [CrossRef]
- Govindan, K.; Khodaverdi, R.; Jafarian, A. A fuzzy multi criteria approach for measuring sustainability performance of a supplier based on triple bottom line ap-proach. J. Clean. Prod. 2013, 47, 345–354. [Google Scholar] [CrossRef]
- Tseng, M.L. Modeling sustainable production indicators with linguistic preferences. J. Clean. Prod. 2013, 40, 46–56. [Google Scholar] [CrossRef]
- Savino, M.M.; Mazza, A. Toward environmental and quality sustainability: An integrated approach for continuous improvement. IEEE Trans. Eng. Manag. 2013, 61, 171–181. [Google Scholar] [CrossRef]
- Swarnakar, V.; Singh, A.R.; Tiwari, A. Evaluation of key performance indicators for sustainability assessment in automotive component manufacturing organization. Mater. Today: Proc. 2021, 47, 5755–5759. [Google Scholar] [CrossRef]
- Swarnakar, V.; Singh, A.R.; Antony, J.; Tiwari, A.; Cudney, E. Development of a conceptual method for sustainability assessment in manufacturing. Comput. Ind. Eng. 2021, 158, 107403. [Google Scholar] [CrossRef]
- Kumar, M.; Mani, M. Towards an interdisciplinary framework for effective sustainability assessment in manufacturing. Procedia CIRP 2021, 98, 79–84. [Google Scholar] [CrossRef]
- Mahmood, T.; Ullah, K.; Khan, Q.; Jan, N. An approach toward decision-making and medical diagnosis problems using the concept of spherical fuzzy sets. Neural Comput. Appl. 2019, 31, 7041–7053. [Google Scholar] [CrossRef]
- Stoycheva, S.; Marchese, D.; Paul, C.; Padoa, S.; Juhmani, A.; Linkov, I. Multi-criteria decision analysis framework for sustainable manufacturing in automotive industry. J. Clean. Prod. 2018, 187, 257–272. [Google Scholar] [CrossRef]
- Linkov, I.; Moberg, E.; Trump, B.; Yatsalo, B.; Keisler, J. Multi-Criteria Decision Analysis Case Studies in Engineering and the Environment; CRC Press: Boca Raton, FL, USA, 2020. [Google Scholar]


| Source | Application in SD | Decision Support Methods and Tools | Manufacturing | Limitations |
|---|---|---|---|---|
| [7] | Designing sustainable production plants. Strategies for SD. | Multicriteria decision analysis. | No, electricity supply. | A large number of decision-makers. |
| [8] | Supplier selection. | Fuzzy set theory (FST); Technique for Order of Preference by Similarity to Ideal Solution (TOPSIS) | No. | Lack of interdependencies among criteria and sub-criteria. |
| [9] | Supply chain and sustainable Production. | Blockchain-driven supply chain; Partial Least Square-Multi Group Analysis | Yes, different. | Lack of comparison of the groups based on the observed heterogeneity. |
| [10] | Increased supply chain resilience to negative activities related to COVID. | Key Performance Indicators (KPIs); Plan-Do-Check-Act (PDCA cycle) | Yes, food production sector | - |
| Our paper | Determination of key SD indicators. Supporting and monitoring the achievement of SD goals. | Analytic Hierarchy Process (AHP); Fuzzy rules Decision Tree | Yes, metal sector | The need of selecting key SD indicators for re-testing. |
| Area | SD Objective | SD Indicators |
|---|---|---|
| A1-Production processes | Reduced energy consumption (Opp1) | Ipp1—Energy consumption Ipp2—Renewable energy |
| Increasing innovation (Opp2) | Ipp3—Modernisation of the machinery park | |
| Improved quality of the process (Opp3) | Ipp4—Number of complaints Ipp5—Number of defective products | |
| Reduction in generating loss (Opp4) | Ipp6—Level of waste recycling (kg) | |
| A2-Production durability | High quality of the product compared to that of the competitors (Opd1) | Ipd1—Quality of product compared to that of the competitors |
| The possibility of reprocessing the product (Opd2) | Ipd2—Possibility of recycling products after use | |
| Service/repair (Opd3) | Ipd3—After-sales service | |
| A3-Development product | Customer satisfaction (Odp1) | Idp1—Customer satisfaction Idp2—Client retention |
| Safe working conditions (Odp2) | Idp3—Number of accidents at work per month | |
| Safe products and production processes (Odp3) | Idp4—Use of hazardous chemicals in the production process Idp5—Use of hazardous chemicals in the product | |
| Climate protection (Odp4) | Idp6—Develop a climate-related risk management strategy Idp7—Actions to reduce the risks associated with climate change |
| Cases | Variables | |||||||
| 1 | 2 | 3 | 4 | 5 | 6 | 7 | 8 | |
|---|---|---|---|---|---|---|---|---|
| Ipp1 | 1 | 1 | 1 | 60,800 | −10% | 1 | RA1 | |
| Ipp2 | 1 | 1 | 3 | No | Yes | 1 | RA2 | |
| Ipp3 | 1 | 1 | 3 | Yes | Yes | 2 | RA3 | |
| Ipp4 | 1 | 1 | 1 | 0 | 0 | 2 | RA4 | |
| Ipp5 | 1 | 1 | 1 | 1 | 0 | 1 | RA5 | |
| Ipp6 | 1 | 1 | 2 | 9300 | 9500 | 1 | RA6 | |
| Ipd1 | 2 | 2 | 2 | Very high | Very high | 2 | RA7 | |
| Ipd2 | 2 | 2 | 3 | No | Yes | 1 | RA8 | |
| Ipd3 | 2 | 2 | 3 | No | Yes | 1 | RA9 | |
| Idp1 | 13 | 1 | 2 | Over 90% | Over 90% | 2 | RA10 | |
| Idp2 | 3 | 1 | 2 | The customer comes back | The customer comes back | 2 | RA11 | |
| Idp3 | 3 | 1 | 1 | 0 | 0 | 2 | RA12 | |
| Idp4 | 3 | 1 | 1 | Yes | No | 1 | RA13 | |
| Idp5 | 3 | 1 | 1 | No | No | 1 | RA13 | |
| Idp6 | 3 | 1 | 3 | No | Yes | 2 | RA14 | |
| Idp7 | 3 | 1 | 3 | No | Yes | 2 | RA14 | |
| Methodology Aid in Assessing SD | Used Methods and Tools | Used in Manufacturing | Area of SD | Achieved Results of Assessment of SD | Ref. |
|---|---|---|---|---|---|
| Sustainability evaluation employing indicators | AHP; KPI | Yes | Environmental | Indication of the most important indicators the sustainability index for assessing the level of SD | [30] |
| Sustainability evaluation employing indicators | 3BL; survey questionnaire based on Best-Worst Scaling; MCDA | Yes | Economic, Environmental, Society | A basic set of indicators constituting a basis for determining the level of SD | [26] |
| An effectiveness SA framework | LCA; expert opinion | Yes | Environmental | A scoring matrix of performance of different indicators relative to their absolute limits | [32] |
| 3BL | open-ended questionnaire; VSM; experts opinons; KPI | Yes | Economic, Environmental, Society | [31] | |
| Decision-tree based methodology aid in assessing SD | AHP Fuzzy rules Decision tree | Yes | production processes, product durability, product development | Scenarios of possible actions to increase the level of SD, Indicating recommended actions for continuous monitoring of progress towards reaching SD objectives | Our paper |
Publisher’s Note: MDPI stays neutral with regard to jurisdictional claims in published maps and institutional affiliations. |
© 2022 by the authors. Licensee MDPI, Basel, Switzerland. This article is an open access article distributed under the terms and conditions of the Creative Commons Attribution (CC BY) license (https://creativecommons.org/licenses/by/4.0/).
Share and Cite
Patalas-Maliszewska, J.; Łosyk, H.; Rehm, M. Decision-Tree Based Methodology Aid in Assessing the Sustainable Development of a Manufacturing Company. Sustainability 2022, 14, 6362. https://doi.org/10.3390/su14106362
Patalas-Maliszewska J, Łosyk H, Rehm M. Decision-Tree Based Methodology Aid in Assessing the Sustainable Development of a Manufacturing Company. Sustainability. 2022; 14(10):6362. https://doi.org/10.3390/su14106362
Chicago/Turabian StylePatalas-Maliszewska, Justyna, Hanna Łosyk, and Matthias Rehm. 2022. "Decision-Tree Based Methodology Aid in Assessing the Sustainable Development of a Manufacturing Company" Sustainability 14, no. 10: 6362. https://doi.org/10.3390/su14106362