
Railway Signaling Safety Factors Quantitative Analysis Using an Improved 5M Model

 , ,
, ,
Abstract
:1. Introduction
2. Materials and Methods
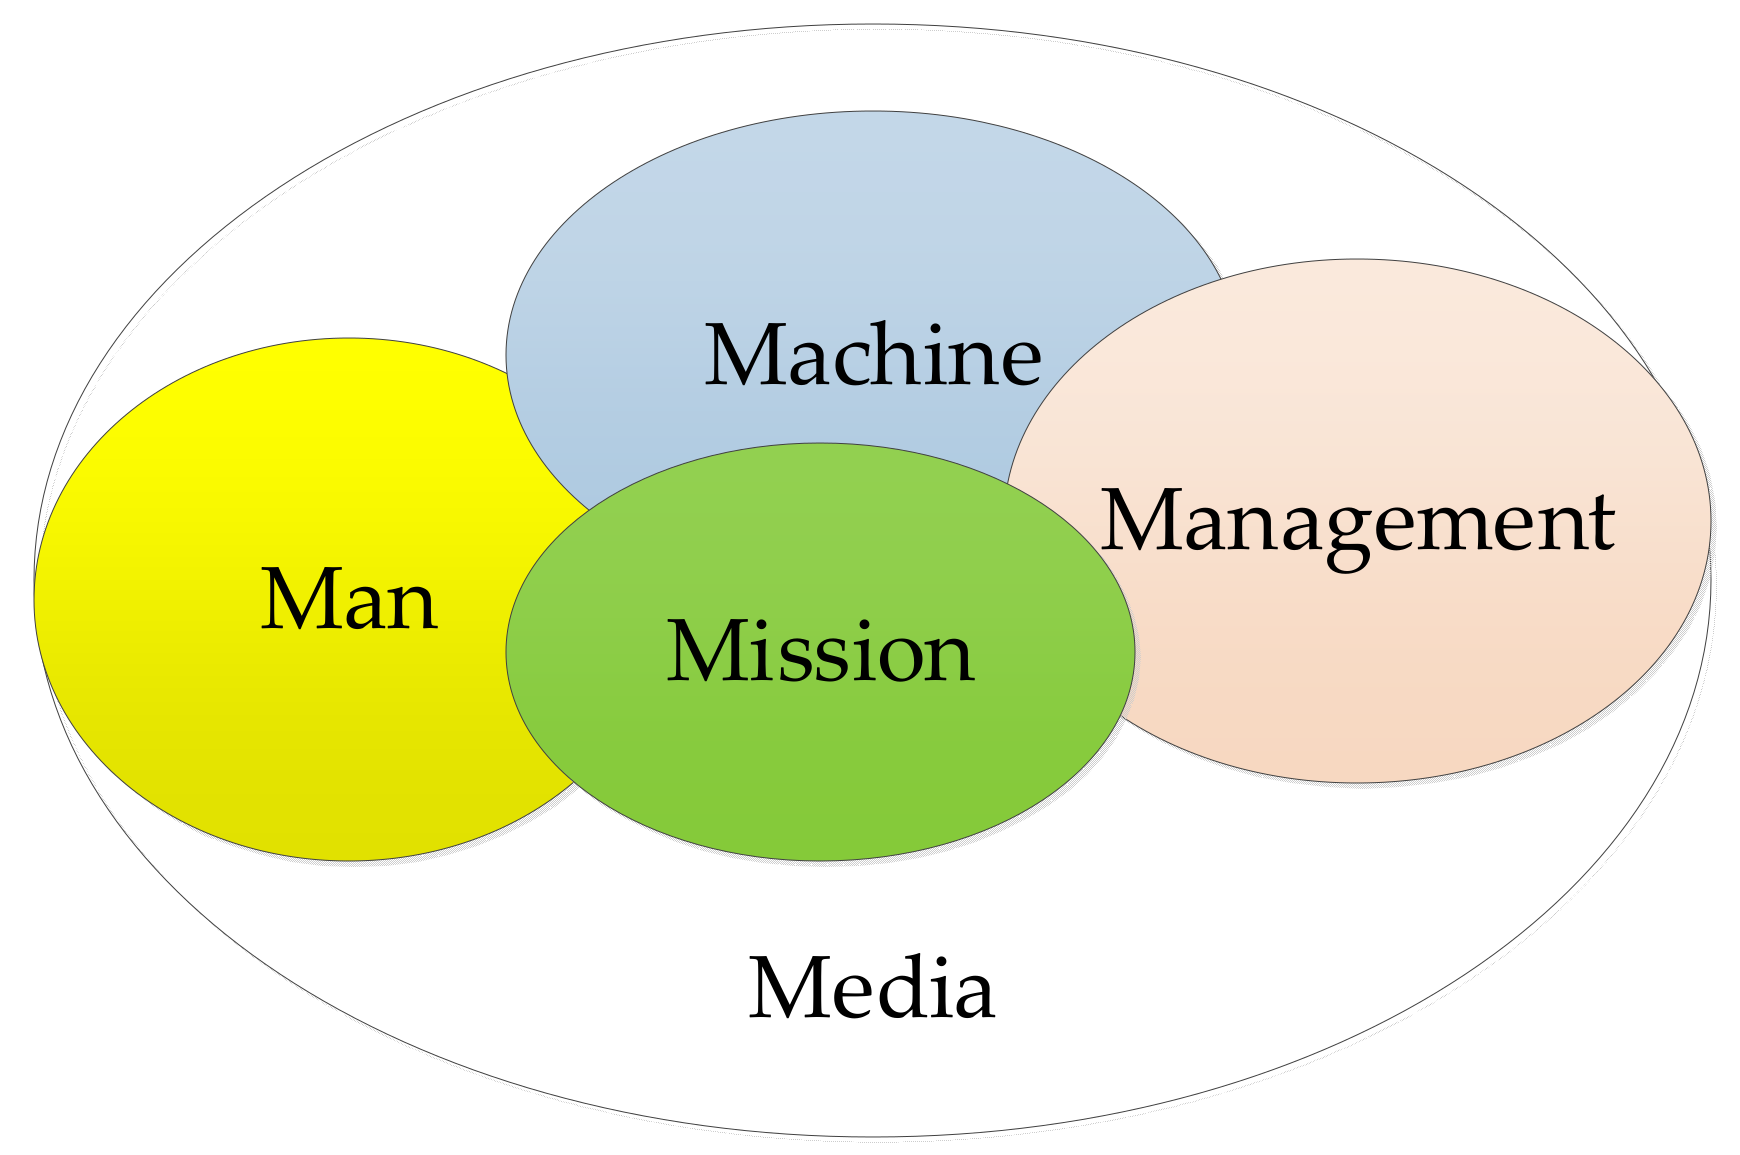
2.1. 5M Model and Improved 5M Model
2.1.1. Definition and Disadvantages of 5M Model
2.1.2. Definition and Advantages of Improved 5M Model
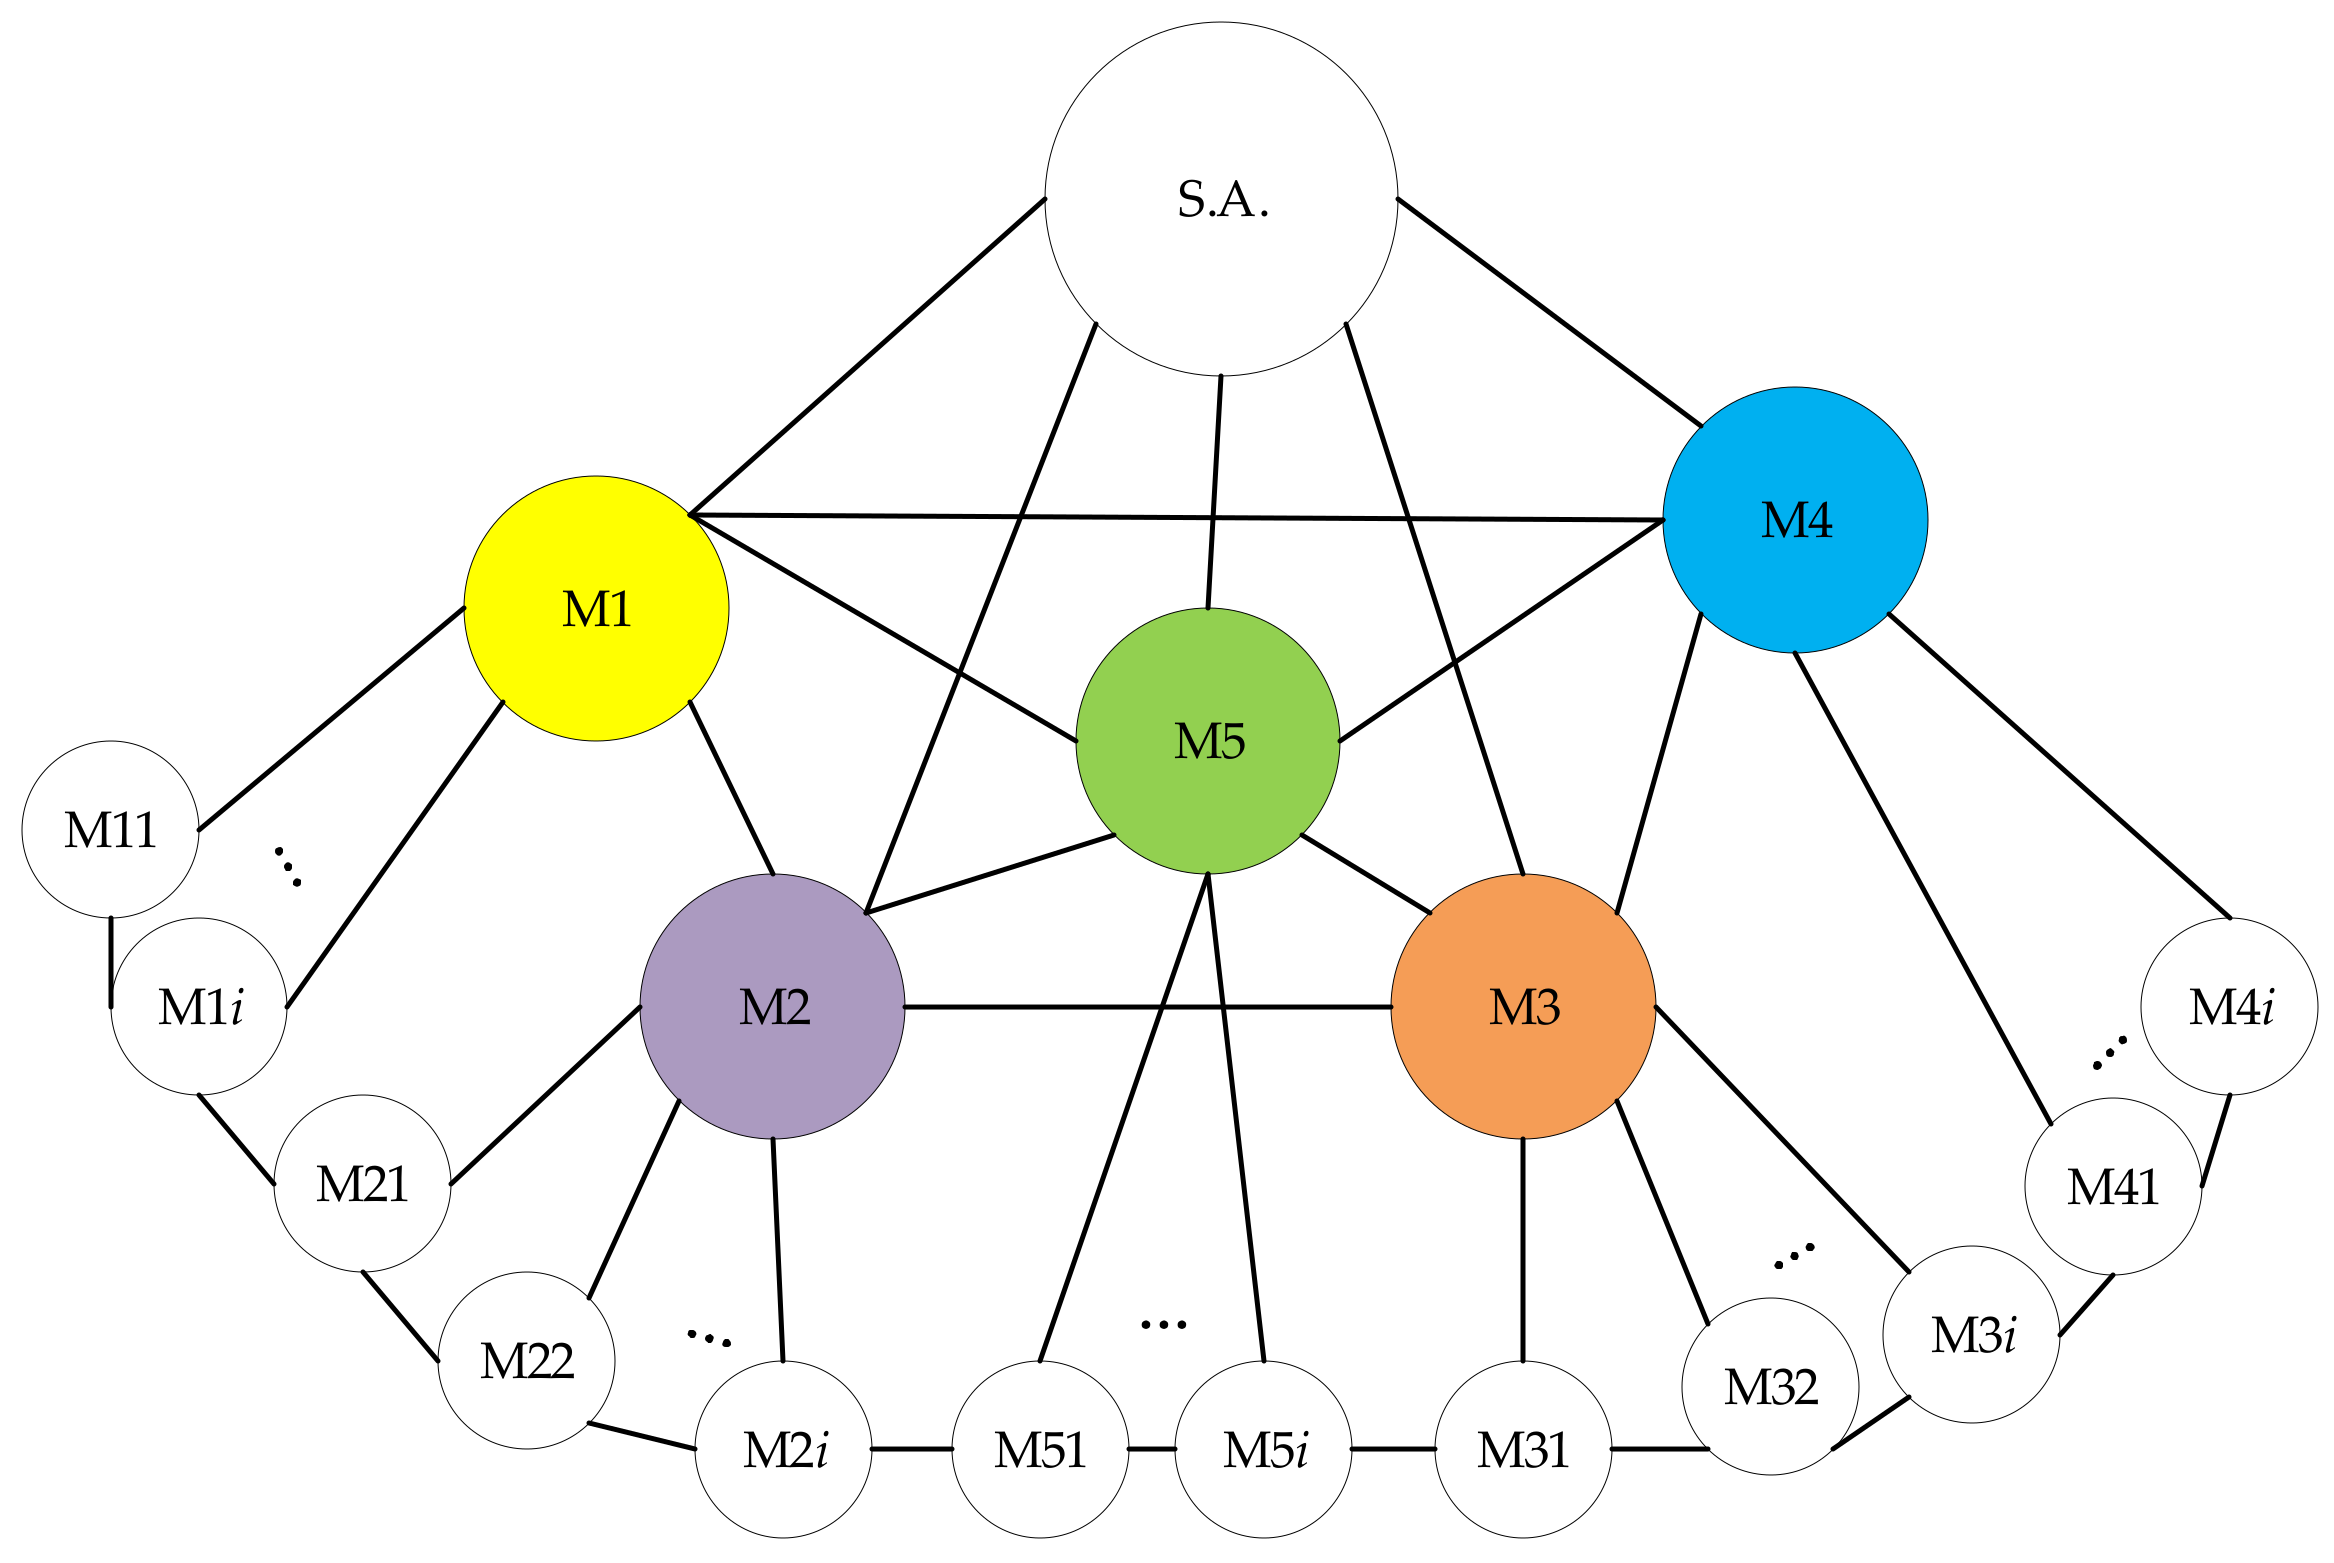
2.2. Association Rules Recognition among 5M Factors
2.3. Factors Analysis Method for 5M Subfactors
3. Results of Factors Quantitative Analysis Using the Improved 5M Model
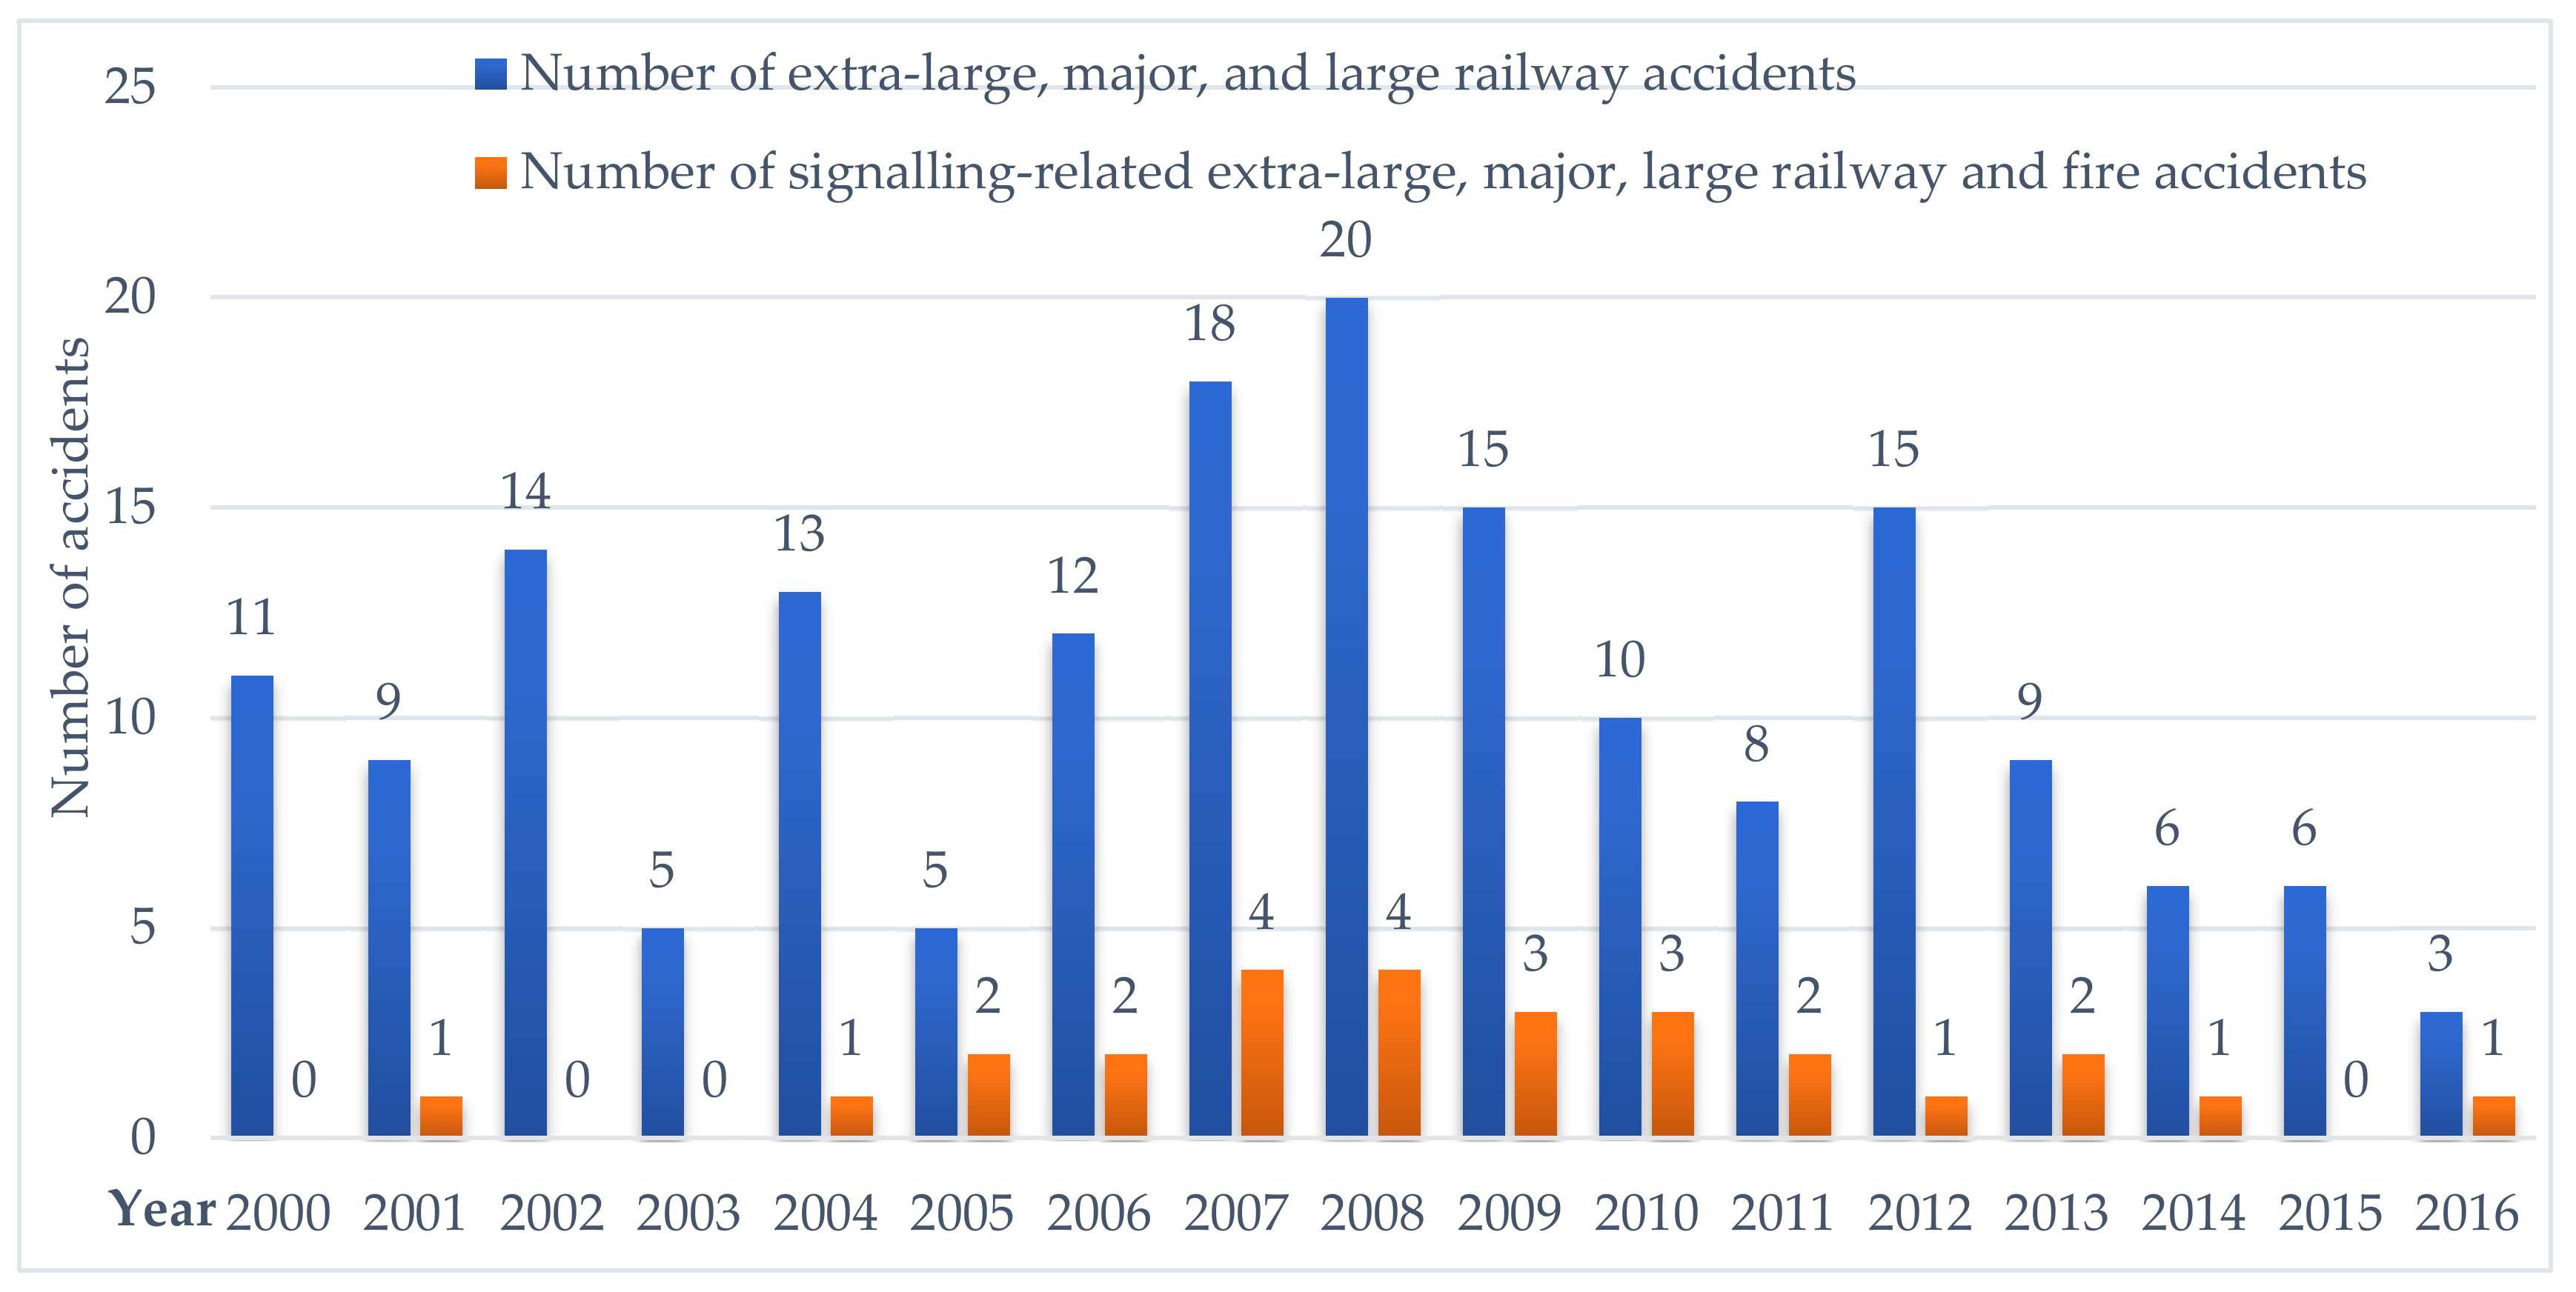
3.1. Data Source of Rail Signaling Accident
3.2. Association Rules Model Establishment for 5M Factors
3.3. Factors Analysis Method Application for 5M Factor and Subfactors
3.3.1. Weights Calculation of 5M Factors
3.3.2. Weights Calculation of 5M Subfactors
3.4. Establishment of Railway Signaling System Safety Evaluation System
4. Discussion
5. Conclusions
Author Contributions
Funding
Institutional Review Board Statement
Informed Consent Statement
Data Availability Statement
Conflicts of Interest
References
- National Railway Administration of the People’s Republic of China. Notice on Railway Safety in 2014. Available online: http://www.nra.gov.cn/search/?qt=National+Railway+Administration+of+the+People%E2%80%99s+Republic+of+China.+Notice+on+Railway+Safety+in+2014&siteCode=bm69000001 (accessed on 2 March 2022).
- Chang, J.; Li, F.L. Trend Analysis and Countermeasures of Railway Traffic Accidents under Different Economic Environments. China R. China Acad. Railw. Sci. 2010, 12, 3–31. [Google Scholar]
- National Railway Administration of the People’s Republic of China. Notice on Railway Safety in 2016. Available online: http://www.nra.gov.cn/search/?qt=National+Railway+Administration+of+the+People%E2%80%99s+Republic+of+China.+Notice+on+Railway+Safety+in+2016ional+Railway+Administration+of+the+People%E2%80%99s+Republic+of+China.+Notice+on+Railway+Safety+in+2014&siteCode=bm69000001 (accessed on 2 March 2022).
- Ruiz, A.; Sabetzadeh, M.; Panaroni, P. Challenges for an open and evolutionary approach to safety assurance and certification of safety-critical systems. In Proceedings of the 2011 First International Workshop on Software Certification, Hiroshima, Japan, 29 November–2 December 2011; IEEE: New York, NY, USA, 2011; pp. 1–6. [Google Scholar]
- Wang, Z.; Diao, P.D.; Jia, L.M. Analysis of Railway Accident Causes and Risk. China J. China Saf. Sci. 2012, 22, 79–85. [Google Scholar]
- China Railway. Railway Signaling System Safety Rules No. 26. S; China Railway Publication Press: Beijing, China, 2015.
- EN 50126-1; Railway Applications—The Specification and Demonstration of Reliability, Availability, Maintainability and Safety (RAMS) Part 1: Generic RAMS Process. CEN-CENELEC Management Centre: Brussels, Belgium, 2017.
- EN 50126-2; Railway Applications—The Specification and Demonstration of Reliability, Availability, Maintainability and Safety (RAMS) Part 2: Systems Approach to Safety. CEN-CENELEC Management Centre: Brussels, Belgium, 2017.
- Lin, H.X.; Zeng, X.Q.; Li, Y.Q.; Fang, Y.G. 5M Based Safety Pre-evaluation Method of Urban Rail Transit Signalling System. China J. Urban Mass Transit. 2018, 21, 116–120. [Google Scholar]
- Fang, Y.G. Research on Safety Mechanism and Assurance Theory of Train Control System Based on 5M Model; Tongji University: Shanghai, China, 2019. [Google Scholar]
- Zeng, X.Q.; Fang, Y.G.; Wang, Y.Z. Traffic Safety Analysis Method Based on 5M Model. China J. Urba. Roa. Bri. Flo. Con. 2021, 2, 156–158. [Google Scholar]
- Hsu, Y.L.; Liu, T.C. Structuring risk factors related to airline cabin safety. J. Air Transp. Manag. 2012, 20, 54–56. [Google Scholar] [CrossRef]
- Rodrigues, C.C.; Cusick, S.K.; Cusick, S. Commercial Aviation Safety, 6th ed.; McGraw-Hill Education: Washington, DC, USA, 2017. [Google Scholar]
- FAA Air Traffic Organization. Safety Management System Manual; FAA Air Traffic Organization: Washington, DC, USA, 2017.
- Zhou, J. Study on Accident Causation and Safety Risk Analysis in Railway Transportation; Beijing Jiaotong University: Beijing, China, 2018. [Google Scholar]
- Williams, R.B.J.S. The essentials of factor analysis. Contemp. Sociol. 1974, 3, 411. [Google Scholar] [CrossRef]
- Ministry of Railways of the People’s Republic of China. Railway Traffic Accident Investigation and Handling Rules; Order of Ministry of Railways of the People’s Republic of China, No.30; Ministry of Railways of the People’s Republic of China: Beijing, China, 2007; Volume 9, p. 1.
- Baidu Wenku. Recent Typical Accident Cases of National Railway. 2021. Available online: https://wenku.baidu.com/view/373f759633b765ce0508763231126edb6e1a764c.html (accessed on 2 March 2022).
- Shanghai Railway Bureau. Safety Supervision Letter [2009]9) Notice on the Issuance of Typical Case of Railway Traffic Accident; China R. Shanghai Railway Bureau: Shanghai, China, 2009; pp. 2–19.
- Beijing Railway Bureau. Typical Case Analysis and Warning of Railway Traffic Accident; China Railway Publishing House: Beijing, China, 2014; pp. 6–177.
- Lin, H.X. Rail Transit Signalling System Ontology Based Cause-Accident Mechanism; Tongji University: Shanghai, China, 2020. [Google Scholar]
- Swuste, P.; Gulijk, V.C.; Zwaard, W. Safety metaphors and theories, a review of the occupational safety literature of the US, UK and The Netherlands, till the first part of the 20th century. J. Saf. Sci. 2010, 8, 1000–1018. [Google Scholar] [CrossRef]
- Wang, Y.M.; Luo, Y.; Yu, H. Evaluation method of security risk on crowded metro station. China J. Traf. Transp. Engi. 2020, 20, 198–207. [Google Scholar]
- Guo, Z.; Shang, X.L.; Li, H. AHP based safety assessment model for rail transit system. China J. China Railw. Sci. 2011, 32, 123–125. [Google Scholar]
- Yang, L.B. Research of Railway Fault Accident Text Big Data Mining Key Technologies and Application; China Academy of Railway Sciences: Beijing, China, 2018. [Google Scholar]


| Element | Subfactors Identification |
|---|---|
| Man | Mainly includes signaling system internal staff, such as signaling the system constructor, tester, operator, and maintenance personnel; as well as signaling system external personnel, such as the construction man, locomotive servicer, dispatching man, and illegal entrant. |
| Machine | Mainly includes on-board equipment and wayside equipment of train control system and station signaling system, such as transponders, radio blocking center equipment, and interlocking system such as the signal, switch machine, track circuit and axle-counting equipment, and dispatching equipment, data communication machine, centralized signal monitoring system. |
| Media | Mainly includes the natural environment and the application environment of the signaling system. Natural environment, such as heavy rain, heavy snow, lightning, floods, landslides, etc. Application environment, such as power supply disturbance, construction interference, electrical interference, track line fat edge, derailment, wheel slip, as well as train-wayside communication interruption. |
| Management | Mainly includes the signaling equipment management, signaling operation management, signaling construction management, signaling equipment maintenance management, signaling personnel management. |
| Mission | Mainly indicates the rail signaling system mission cannot be completed due to the fault of hardware and software, which includes functional defects, design hazards, construction hazards, installation hazards, and equipment manufacturing defects. |
| Factors | Coding | Subfactors Coding |
|---|---|---|
| Man | M1 | M11: signaling the system constructor, M12: tester, M13: operator, M14: maintenance personnel, M15: construction man, M16: locomotive servicer, M17: dispatching man, M18: illegal entrant. |
| Machine | M2 | M21: transponders, M22: radio blocking center equipment, M23: signal, M24: switch machine, M25: track circuit, M26: axle-counting equipment, M27: dispatching equipment, M28: data communication machine, M29: centralized signaling system. |
| Media | M3 | M31: heavy rain, M32: heavy snow, M33: lightning, M34: floods, M35: landslides, M36: power supply disturbance, M37: construction interference, M38: electrical interference, M39: track line fat edge, M310: derailment, M311: wheel slip, M312: train-wayside communication interruption. |
| Management | M4 | M41: signaling equipment management, M42: signaling operation management, M43: signaling construction management, M44: signaling equipment maintenance management, M45: signaling personnel management. |
| Mission | M5 | M51: functional defects, M52: design hazards, M53: construction hazards, M54: installation hazards, M55: equipment manufacturing defects. |
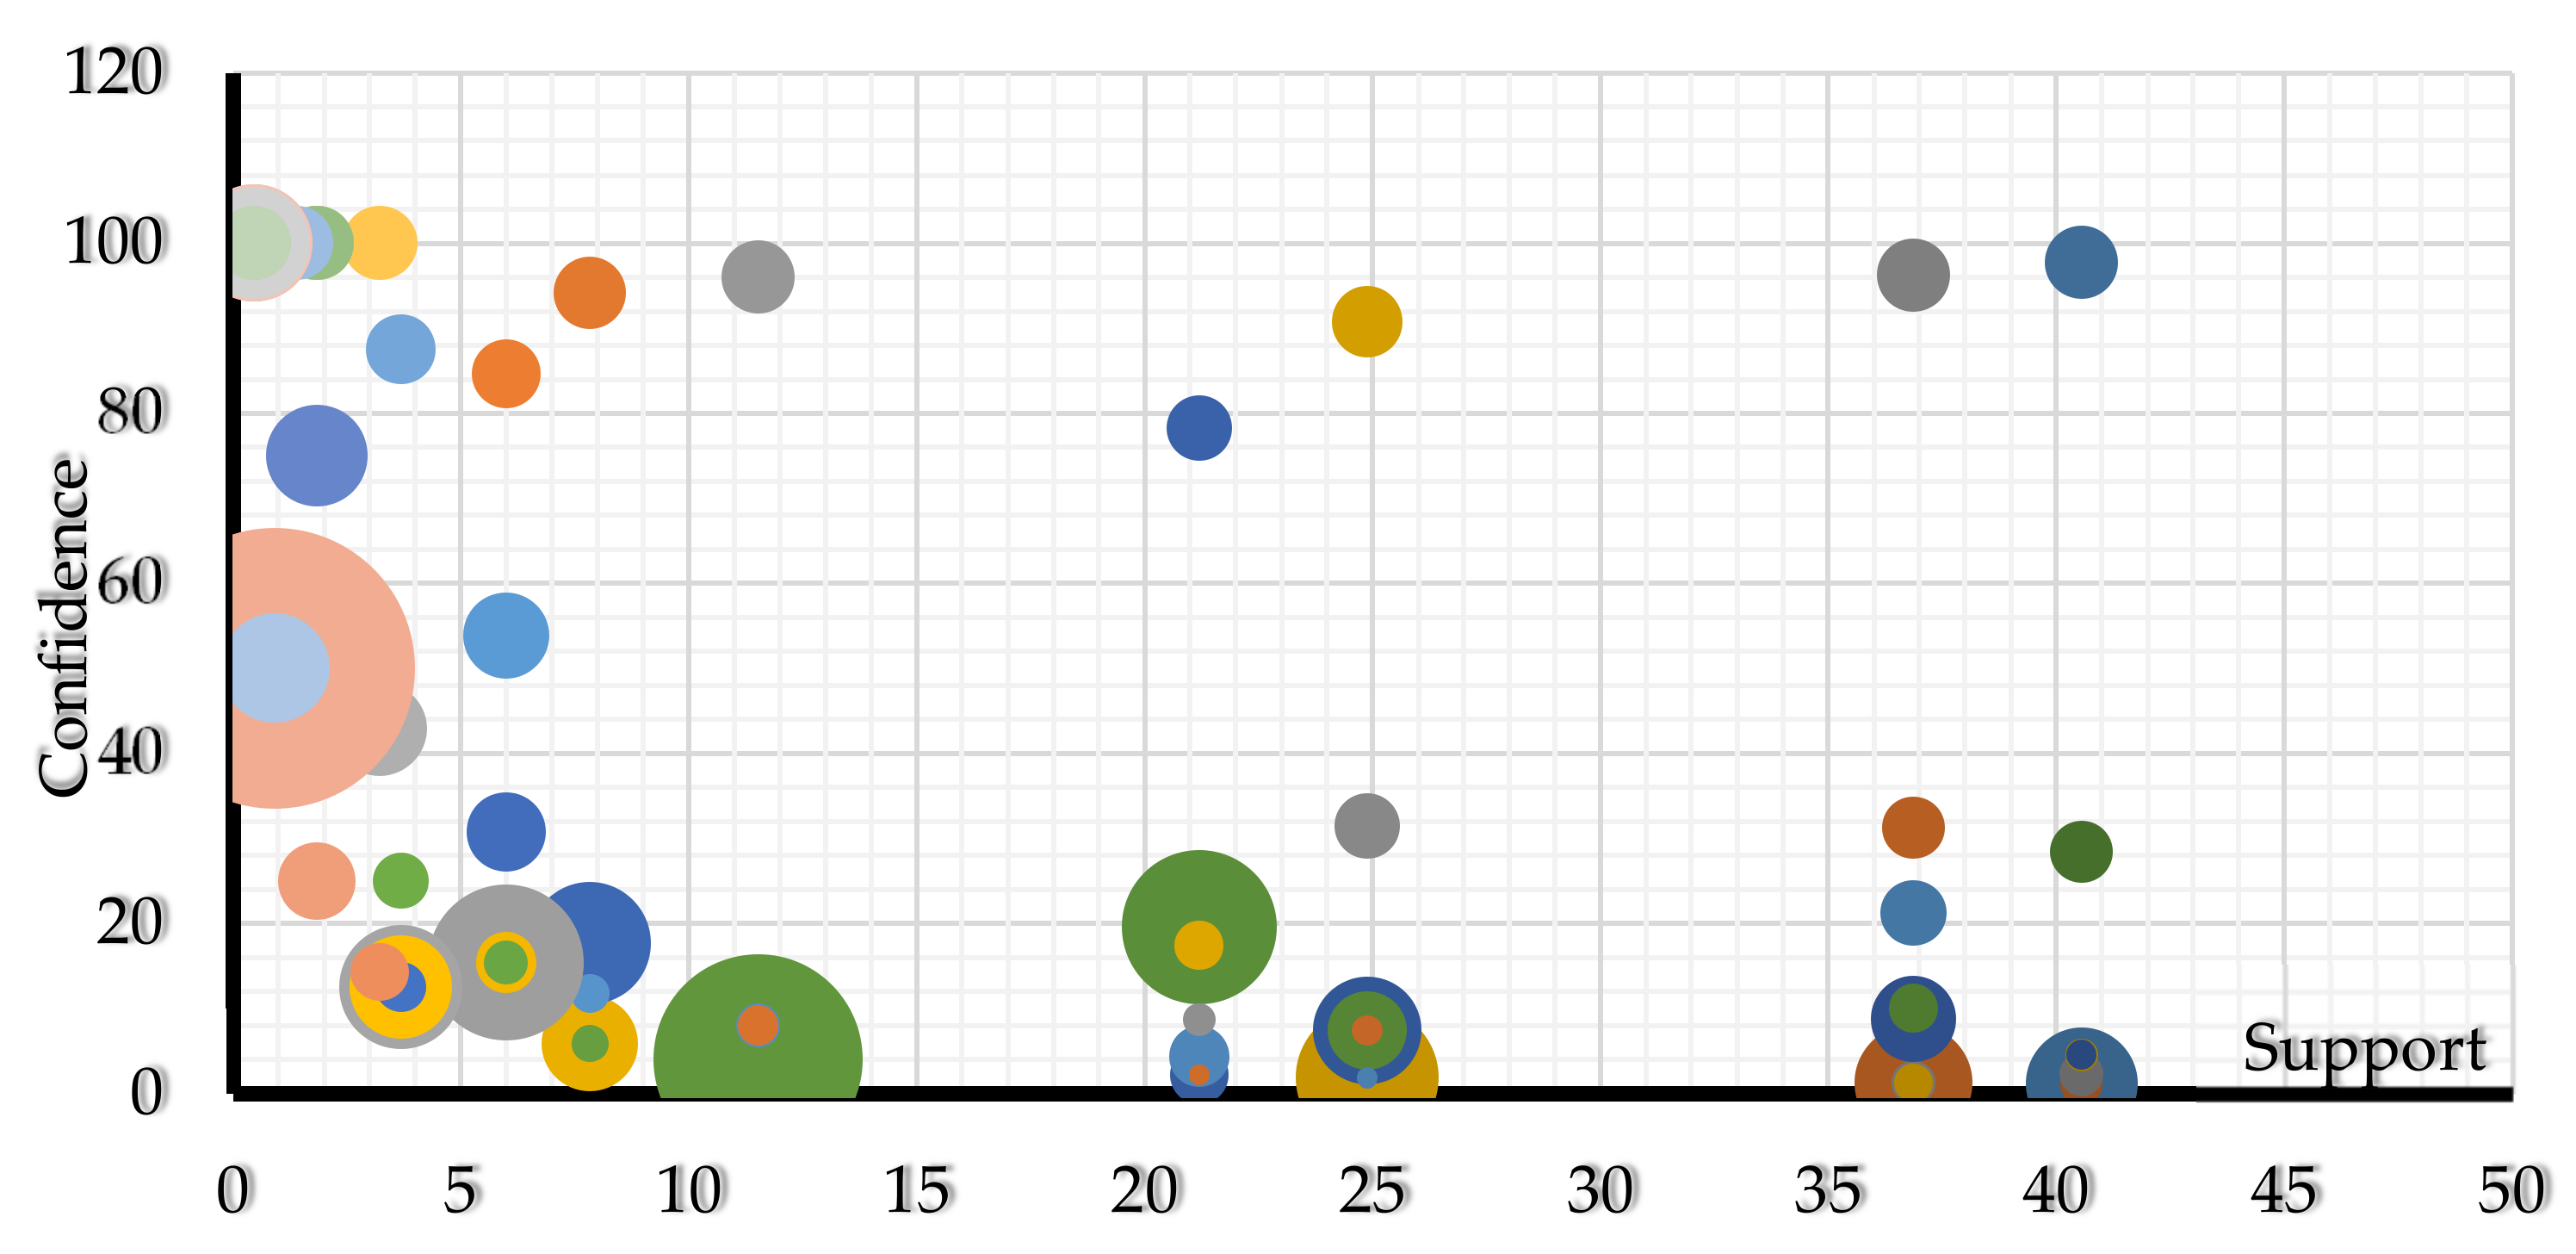
| No. | Latter Item | Former Term | Support | Confidence | Lift |
|---|---|---|---|---|---|
| 1 | Accident type = Large | Causal factor = Machine | 40.553 | 1.136 | 2.466 |
| 2 | Accident type = C | Causal factor = Machine | 40.553 | 1.136 | 0.352 |
| 3 | Causal factor = Mission | Causal factor = Machine | 40.553 | 2.273 | 0.379 |
| 4 | Causal factor = Management | Causal factor = Machine | 40.553 | 28.409 | 0.771 |
| 5 | Accident type = D | Causal factor = Machine | 40.553 | 97.727 | 1.071 |
| 6 | Accident type = Large | Causal factor = Management | 36.866 | 1.25 | 2.713 |
| 7 | Accident type = C | Causal factor = Management | 36.866 | 1.25 | 0.388 |
| 8 | Accident type = B | Causal factor = Management | 36.866 | 1.25 | 0.301 |
| 9 | Causal factor = Mission | Causal factor = Management | 36.866 | 8.75 | 1.461 |
| 10 | Causal factor = Man | Causal factor = Machine and Management | 11.521 | 8 | 0.377 |
| 11 | Causal factor = Media | Causal factor = Machine and Management | 11.521 | 8 | 0.321 |
| 12 | Accident type = D | Causal factor = Machine and Management | 11.521 | 96 | 1.052 |
| 13 | Accident type = C | Causal factor = Media and Management | 7.834 | 5.882 | 1.824 |
| 14 | Causal factor = Mission | Causal factor = Media and Management | 7.834 | 17.647 | 2.946 |
| 15 | Accident type = D | Causal factor = Media and Management | 7.834 | 94.118 | 1.031 |
| 16 | Accident Type = C | Causal Factor = Mission | 5.991 | 15.385 | 4.769 |
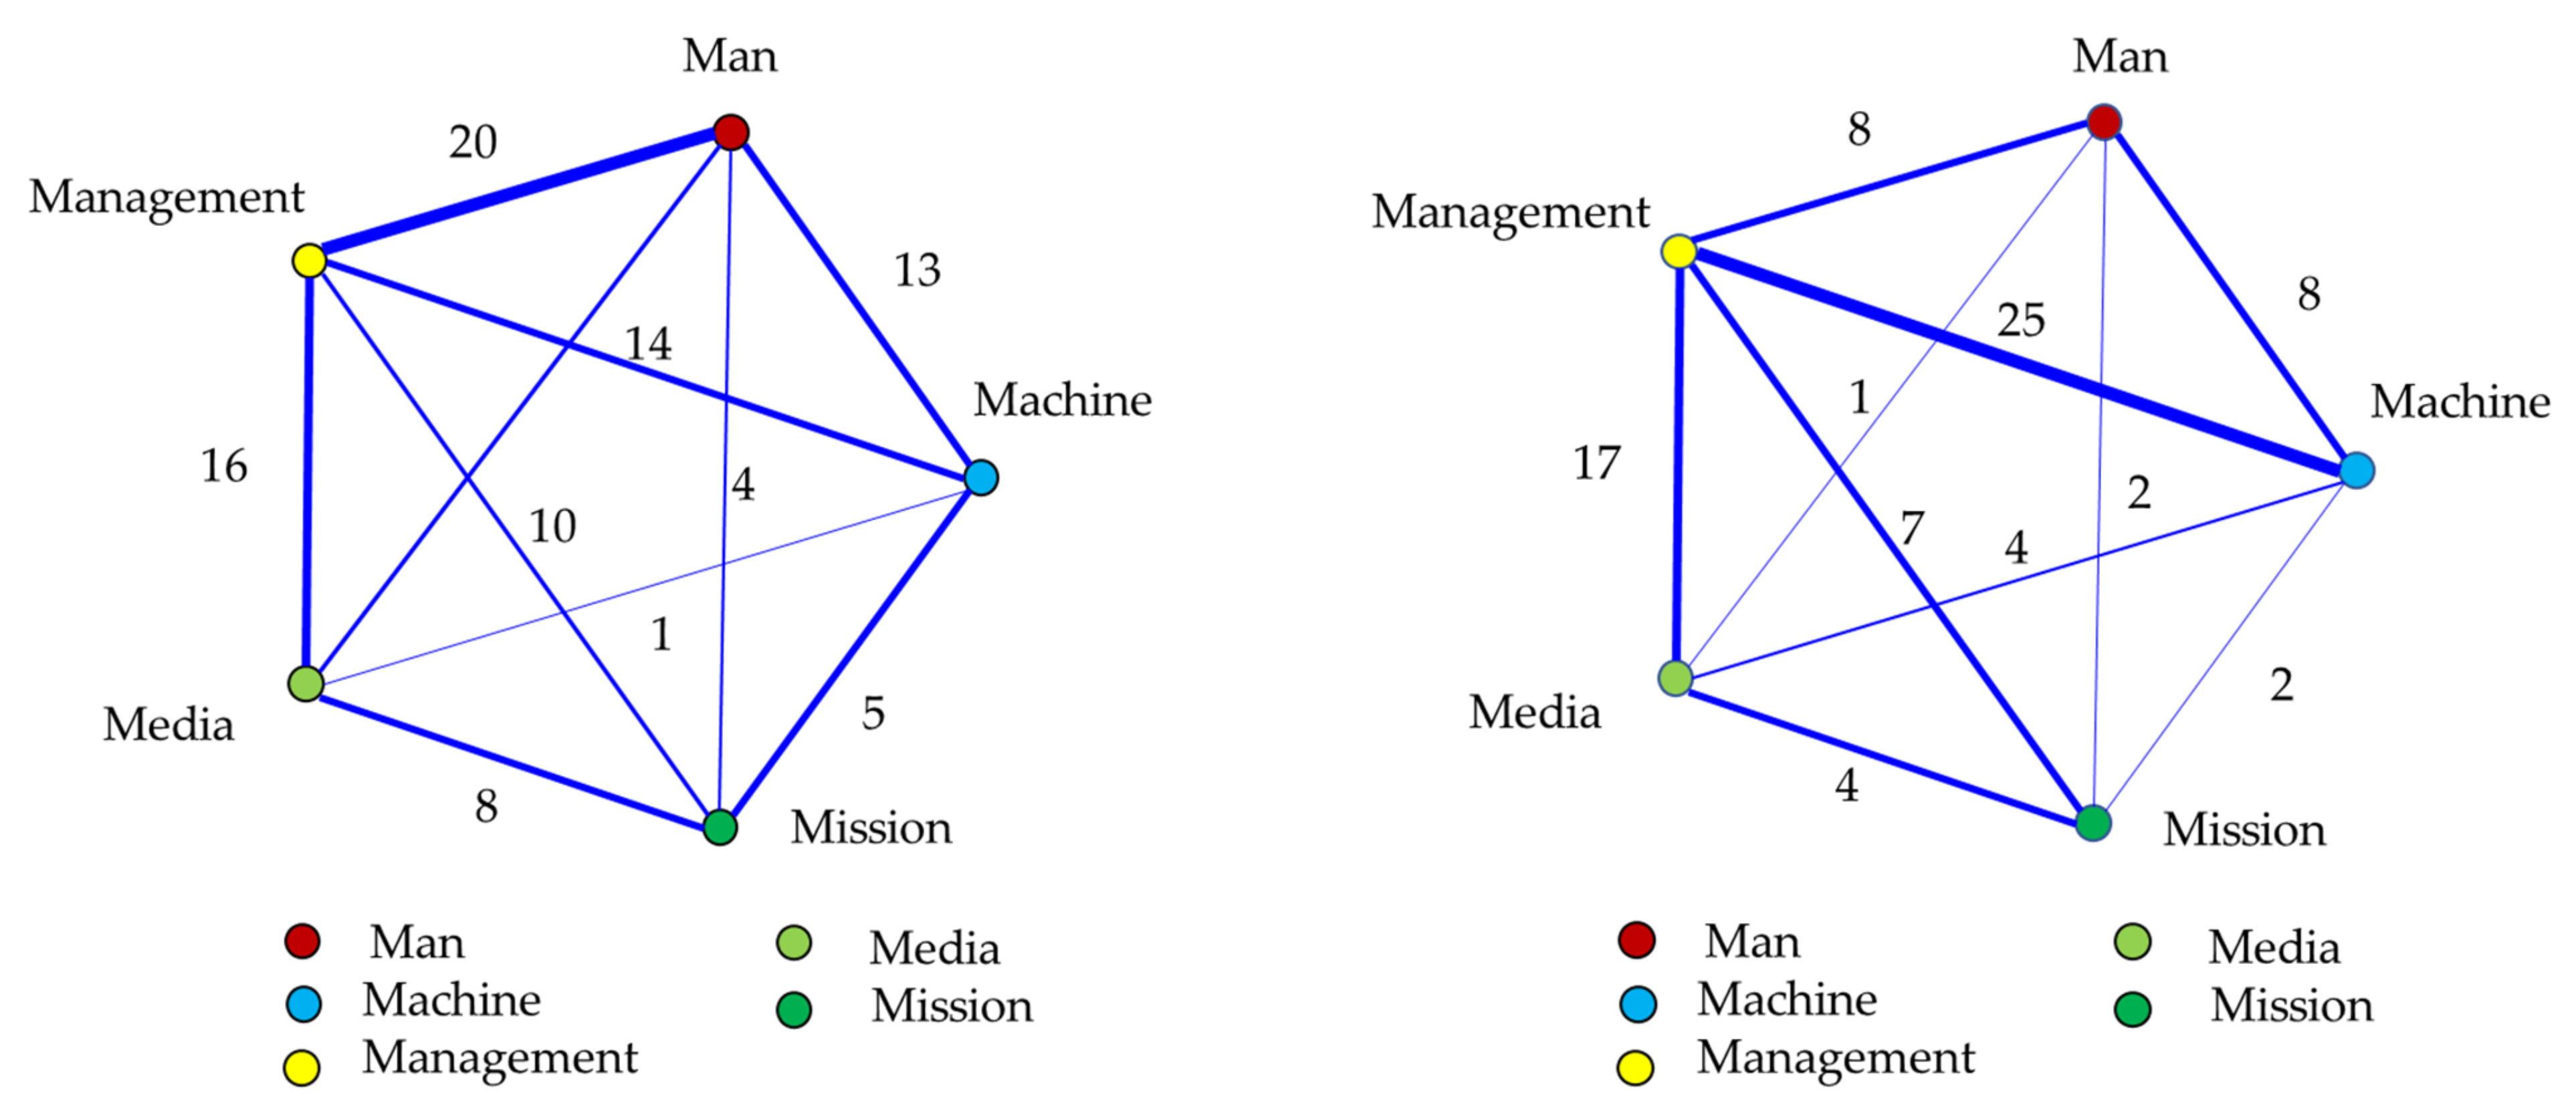
| M1 | M2 | M3 | M4 | M5 | |
|---|---|---|---|---|---|
| M1 | 1 | 13 | 9 | 20 | 4 |
| M2 | 13 | 1 | 1 | 14 | 5 |
| M3 | 9 | 1 | 1 | 16 | 8 |
| M4 | 20 | 14 | 16 | 1 | 10 |
| M5 | 4 | 5 | 8 | 10 | 1 |
| M1 | M2 | M3 | M4 | M5 | |
|---|---|---|---|---|---|
| M1 | 1 | 4 | 1 | 8 | 2 |
| M2 | 4 | 1 | 4 | 25 | 2 |
| M3 | 1 | 4 | 1 | 17 | 4 |
| M4 | 8 | 25 | 17 | 1 | 7 |
| M5 | 2 | 2 | 4 | 7 | 1 |
| No. | 5M Subfactors | Principal Component Standardization for Major Casualty Accidents | Principal Component Standardization for Minor Casualty Accidents | Weight |
|---|---|---|---|---|
| 1 | Material fault or fatigue of signaling equipment | 0.0431 | 0.0342 | 0.0386 |
| 2 | Poor construction management | 0.0378 | 0.034 | 0.0359 |
| 3 | External man construction affecting signaling system | 0.0315 | 0.0392 | 0.0354 |
| 4 | Signaling man operation with inadequate protection | 0.0367 | 0.0335 | 0.0351 |
| 5 | Other natural disasters | 0.0317 | 0.0367 | 0.0342 |
| 6 | Poor maintenance of personnel | 0.0313 | 0.0349 | 0.0331 |
| 7 | Vandalism and theft and burning of signaling equipment | 0.0332 | 0.0312 | 0.0322 |
| 8 | Signaling man construction | 0.0306 | 0.0334 | 0.032 |
| 9 | Signaling man illegal operation | 0.0303 | 0.0325 | 0.0314 |
| 10 | Construction safety with hidden dangers | 0.0306 | 0.0317 | 0.0311 |
| 11 | Degree of lightning damage | 0.0327 | 0.0292 | 0.031 |
| 12 | Unfamiliar signaling management causing processing delay | 0.0325 | 0.0292 | 0.0309 |
| 13 | Inadequate signaling maintenance management by missed inspections and lack of repairs | 0.0287 | 0.0331 | 0.0309 |
| 14 | Accidental hit the signaling equipment such as falling rocks | 0.0323 | 0.0294 | 0.0308 |
| 15 | Signaling cable breakage | 0.0323 | 0.0292 | 0.0307 |
| 16 | Off-railway construction interference | 0.0306 | 0.0308 | 0.0307 |
| 17 | Inadequate construction coordination management | 0.0306 | 0.0309 | 0.0307 |
| 18 | Equipment safety with defects | 0.0308 | 0.0302 | 0.0305 |
| 19 | Railway dispatcher influence on signaling system | 0.0303 | 0.0302 | 0.0303 |
| 20 | Power supply influence on signaling system | 0.0306 | 0.03 | 0.0303 |
| 21 | Railway operation influence on signaling system | 0.0303 | 0.03 | 0.0302 |
| 22 | Signaling man processing delay | 0.0308 | 0.0294 | 0.0301 |
| 23 | Inadequate construction protection management | 0.0306 | 0.0296 | 0.0301 |
| 24 | Overdue or fatigue failure of signaling equipment | 0.0308 | 0.0292 | 0.03 |
| 25 | Electrical interference | 0.0308 | 0.0292 | 0.03 |
| 26 | Signaling construction management with processing delay | 0.0308 | 0.0292 | 0.03 |
| 27 | Unexpected disasters such as fire | 0.0303 | 0.0294 | 0.0299 |
| 28 | Installation with hidden dangers | 0.0303 | 0.0294 | 0.0299 |
| 29 | Manufacture product application with responsibility | 0.0306 | 0.0289 | 0.0297 |
| 30 | Safety design with flaws | 0.0258 | 0.0319 | 0.0289 |
| 31 | Locomotive man influence on signaling system | 0.0252 | 0.0305 | 0.0278 |
| 32 | Rail line engineering disease influence on signaling equipment | 0.0257 | 0.0299 | 0.0278 |
| System Level | Factors Level | First Level Weights | Subfactors Level | Life Cycle Stage | Second Level Weights |
|---|---|---|---|---|---|
| Safety evaluation system of railway signaling system | MAN (M1) | 0.1722 | Signaling man operation with inadequate protection (M11) | Maintenance | 0.0351 |
| Poor maintenance of personnel (M12) | Maintenance | 0.0331 | |||
| Signaling man construction (M13) | Construction | 0.0320 | |||
| Signaling man processing delay (M14) | Maintenance | 0.0301 | |||
| Vandalism and theft and burning of signaling equipment (M15) | The whole cycle | 0.0322 | |||
| Locomotive man influences on signaling system(M16) | Operating | 0.0278 | |||
| Railway dispatcher influence on signaling system (M17) | Operating | 0.0303 | |||
| Signaling man illegal operation (M18) | Maintenance | 0.0314 | |||
| External man construction affecting signaling system (M19) | Operating | 0.0354 | |||
| Machine (M2) | 0.2218 | Material fault or fatigue of signaling equipment (M21) | The whole cycle | 0.0386 | |
| Overdue failure of signaling equipment (M22) | Operating | 0.0300 | |||
| Rail line engineering disease influence on signaling equipment (M23) | Operating | 0.0278 | |||
| Manufacture responsibility in application (M24) | The whole cycle | 0.0297 | |||
| Signaling cable age (M25) | The whole cycle | 0.0307 | |||
| Media (M3) | 0.1883 | Degree of lightning damage (M31) | The whole cycle | 0.0310 | |
| Other natural disasters M32 | The whole cycle | 0.0342 | |||
| Electrical interference (M33) | The whole cycle | 0.0300 | |||
| Power supply influence on signaling system (M34) | Operating | 0.0303 | |||
| Off-railway construction interference (M35) | The whole cycle | 0.0307 | |||
| Unexpected disasters such as fire (M36) | The whole cycle | 0.0299 | |||
| Accidental hit a loss to signaling equipment such as falling rocks (M37) | Operating | 0.0308 | |||
| Railway operation influence on signaling system (M38) | Operating | 0.0302 | |||
| Management (M4) | 0.2951 | Inadequate construction coordination management (M41) | Construction | 0.0307 | |
| Unfamiliar signaling management causing processing delay (M42) | Maintenance | 0.0309 | |||
| Signaling construction delay (M43) | Construction | 0.0300 | |||
| Inadequate construction protection management (M44) | Construction | 0.0301 | |||
| Inadequate signaling maintenance management by missed inspections and lack of repairs (M45) | Maintenance | 0.0309 | |||
| Poor construction management (M46) | Construction | 0.0359 | |||
| Mission (M5) | 0.1226 | Safety design with flaws (M51) | The whole cycle | 0.0289 | |
| Equipment safety with defects (M52) | The whole cycle | 0.0305 | |||
| Construction safety with hidden dangers (M53) | Construction | 0.0311 | |||
| Installation safety with hidden dangers (M54) | Construction | 0.0299 |
| Construction Method of Evaluation System in the Field of Rail Transit | Number of First Level Factors | Number of Second Level Subfactors |
|---|---|---|
| Methods of literature [23] | 3 | 14 |
| Methods of literature [24] | 4 | 16 |
| Quantitative analysis method based on improved 5M model | 5 | 32 |
| Methods | Type of Data | K Value | I% (Influence Rate) |
|---|---|---|---|
| 5M model | The major casualty accidents | 32 | 39.43% |
| The minor casualty accidents | 32 | 28.52% | |
| The improved 5M model | The major casualty accidents | 32 | 78.15% |
| The minor casualty accidents | 32 | 52.66% |
Publisher’s Note: MDPI stays neutral with regard to jurisdictional claims in published maps and institutional affiliations. |
© 2022 by the authors. Licensee MDPI, Basel, Switzerland. This article is an open access article distributed under the terms and conditions of the Creative Commons Attribution (CC BY) license (https://creativecommons.org/licenses/by/4.0/).
Share and Cite
Lin, H.; Yuan, T.; Bai, W.; Zhao, Z.; Lu, R.; Li, X.; Lin, Q. Railway Signaling Safety Factors Quantitative Analysis Using an Improved 5M Model. Sustainability 2022, 14, 6247. https://doi.org/10.3390/su14106247
Lin H, Yuan T, Bai W, Zhao Z, Lu R, Li X, Lin Q. Railway Signaling Safety Factors Quantitative Analysis Using an Improved 5M Model. Sustainability. 2022; 14(10):6247. https://doi.org/10.3390/su14106247
Chicago/Turabian StyleLin, Haixiang, Tengfei Yuan, Wansheng Bai, Zhengxiang Zhao, Ran Lu, Xinqin Li, and Qi Lin. 2022. "Railway Signaling Safety Factors Quantitative Analysis Using an Improved 5M Model" Sustainability 14, no. 10: 6247. https://doi.org/10.3390/su14106247