Article

The Interactive Influence of Institutional Quality and Resource Dependence on Regional Economic Growth: Evidence from China’s Resource-Based Provinces

1
Department of Business Administration, Shandong College of Economics and Business, Weifang 261011, China
2
Graduate School of Management of Technology, Pukyong National University, 365 Sinseon-Ro, Nam-Gu, Busan 48547, Korea
3
Korea Maritime Shipping Research Division, Korea Maritime Institute, 26 Haeyang-Ro 301Beon-Gil, Yeongdo-Gu, Busan 49111, Korea
*
Author to whom correspondence should be addressed.
Sustainability 2022, 14(10), 6173; https://doi.org/10.3390/su14106173
Submission received: 4 May 2022 / Revised: 13 May 2022 / Accepted: 14 May 2022 / Published: 19 May 2022
(This article belongs to the Section Economic and Business Aspects of Sustainability)

Abstract

:
In China, after experiencing high resource dependence (RD) and extensive development, some regions that once had abundant resource reserves have fallen into a state of long-term economic stagnation. Therefore, an in-depth analysis of the relationship, the influencing mechanisms, and the key influencing factors between natural resources and regional economic development will help to clarify the change in and the development of China’s resource-based regions. This study takes 19 resource-based provinces in China as the research object, and it builds an analysis model that includes the regional economic growth, the RD, the institutional quality (IQ), the technological innovation (TI), and other variables, on the basis of panel data from 2000 to 2019. China’s actual research conclusions. First, there is a substantial negative correlation between RD and economic development; that is, at the current stage of economic development in the sample provinces, the resource-curse (RC) phenomenon exists, and RD has become an obstacle to economic growth. Moreover, through further research, we find that institutional relationships between quality and economic growth are not apparent, but there is a significant positive correlation between the interaction term of the IQ and RD and economic growth. Finally, TI plays an important intermediary function in the relation between RD and economic growth; high-quality TI can significantly reduce the adverse impact of RD on economic growth. The conclusions of this study help enrich the connotation of the “resource curse” theory in terms of emerging economies, and the policy implications have guiding significance for China’s ongoing “regional economic transformation and sustainable development.”

1. Introduction

Are natural resources a “blessing” or a “curse” for economic growth? Countries or regions with higher resource endowments have greater development potential. However, since the 1980s, numerous resource-rich countries have experienced stagnant economic growth. The global per capita GNP from 1965 to 1998 has stagnated in resource-rich countries. The countries in the Organization of the Petroleum Exporting Countries (OPEC) declined at an average annual rate of 1.3%. In contrast, in some East Asian countries with scarce resources (Singapore, South Korea, etc.), and in Central Africa, Venezuela, and other countries, natural resources account for more than 25% of the national wealth, which is far higher than the world average, but their economies show negative growth.
Researchers have adopted different research methods and have obtained different conclusions in the research on this issue. Some explanations have originated in the field of political science. For example, some researchers have explored the political-transmission mechanism of the “resource curse,” arguing that countries with abundant resources are more inclined to rent-seeking behavior than countries with poor resources because the government is more inclined to absorb the advantages of natural-resource endowments [1,2,3]. Economists have more diverse explanations for the “resource curse.” However, in general, the “resource curse” occurs because the plentiful natural resources “crowd out” other productive organizations or economic movements through some mechanism. This includes the division of the economy into two sectors: agriculture and manufacturing. If a country’s manufacturing industry is crowded out by more primary industries that reflect resource advantages, the country’s economic growth will decline [4,5]. An essential feature of modern economic growth is that resource-rich countries grow slower than resource-poor ones [6,7,8]. However, not all researchers agree with the inference of the “resource curse,” and some researchers emphasize that the abundant natural resources of the United States help explain why it was able to catch up with the United Kingdom in the 19th century [9]. When examining whether the economic variables that are commonly used in the economic-growth literature have a notable impact on economic development, researchers found that the proportion of primary products in the total exports has a significant damaging impact on economic growth, while the proportion of extractive industries in the GDP has a positive impact [10,11]. The selection of different indicators of the natural-resource abundance often leads to inconsistent conclusions [12].
The 19 resource-based provinces that were officially announced by China in 2013 will be the central bodies of China’s resource and energy supply and the main agglomeration areas of primary industries. The promotion of these regions to eliminate the old development path that relies heavily on natural resources, and the realization of the transformation and growth of the regional economy, play strategic roles in overall sustainable economic development. To further examine the natural-resource-dependence (RD) dilemma that is faced by resource-based regions in the Chinese context, 19 resource-based provinces were taken as the research objects, and panel data from 2000 to 2019, after China’s entry into the WTO, were collected. The empirical-analysis method combines the fixed-effect model and the GMM (the generalized method of moments), which complement each other comprehensively and which systematically expound on the relation between RD, institutional quality (IQ), and regional economic development. In statistics, the GMM is a generic approach for estimating parameters in econometric models. Usually, it is used in the context of semiparametric models, whereas the data’s distribution function may not be known, and, therefore, maximum likelihood estimation is not applicable. In theory, it enriches the theory of resource-based regional transformation and the development of emerging economies, and it provides more practical implications for policymakers.
The remainder of the paper is composed of the following: Section 2 handles the literature review on the relation between RD, IQ, and regional economic development, and it proposes issues that need to be emphasized in the Chinese context; Section 3 proposes the research hypotheses, which are based on relevant theories; Section 4 reports the results, and the multilevel empirical analysis is carried out by using the static-panel model and the dynamic-panel model; Section 5 puts forward the recommendations and the research prospects of the next stage.

2. Literature Review

2.1. Overview of the Relation between Resource Dependence and Economic Growth

Since Auty proposed the “resource curse” proposition in 1994, the impact of RD on economic development has received increasing attention [3]. The research on the relation between RD and economic development focuses on three aspects:
(1)
Impact of the Economic Structure: Abundant natural resources make the economy dependent on a single industry, which quickly leads to a single economic structure. When resources are exhausted, the economy is troubled. When a country is too dependent on a specific resource, it usually obtains economic growth through the export trade of a single primary product, which produces a “crowding out effect” on other industries. This concentrates resources such as labor, capital, and technology in resource-based industries, which results in the weakening of sectors such as agriculture and manufacturing, which creates difficulties for future economic restructuring. Suppose that a country’s economic industry is focused on a few resource fields, such as oil and minerals. In this case, point-source economies are more prone to nonproductive activities, such as rent-seeking, and a resource curse (RC) is more likely to occur [13,14];
(2)
Impact on Political and Economic Stability: RD is prone to rent-seeking and corrupt behaviors, which thus affect the long-term driving factors of economic development, and escalate the unstable factors of the country’s political economy, which will hinder the stability of the country’s economy, which results in an RC [15,16];
(3)
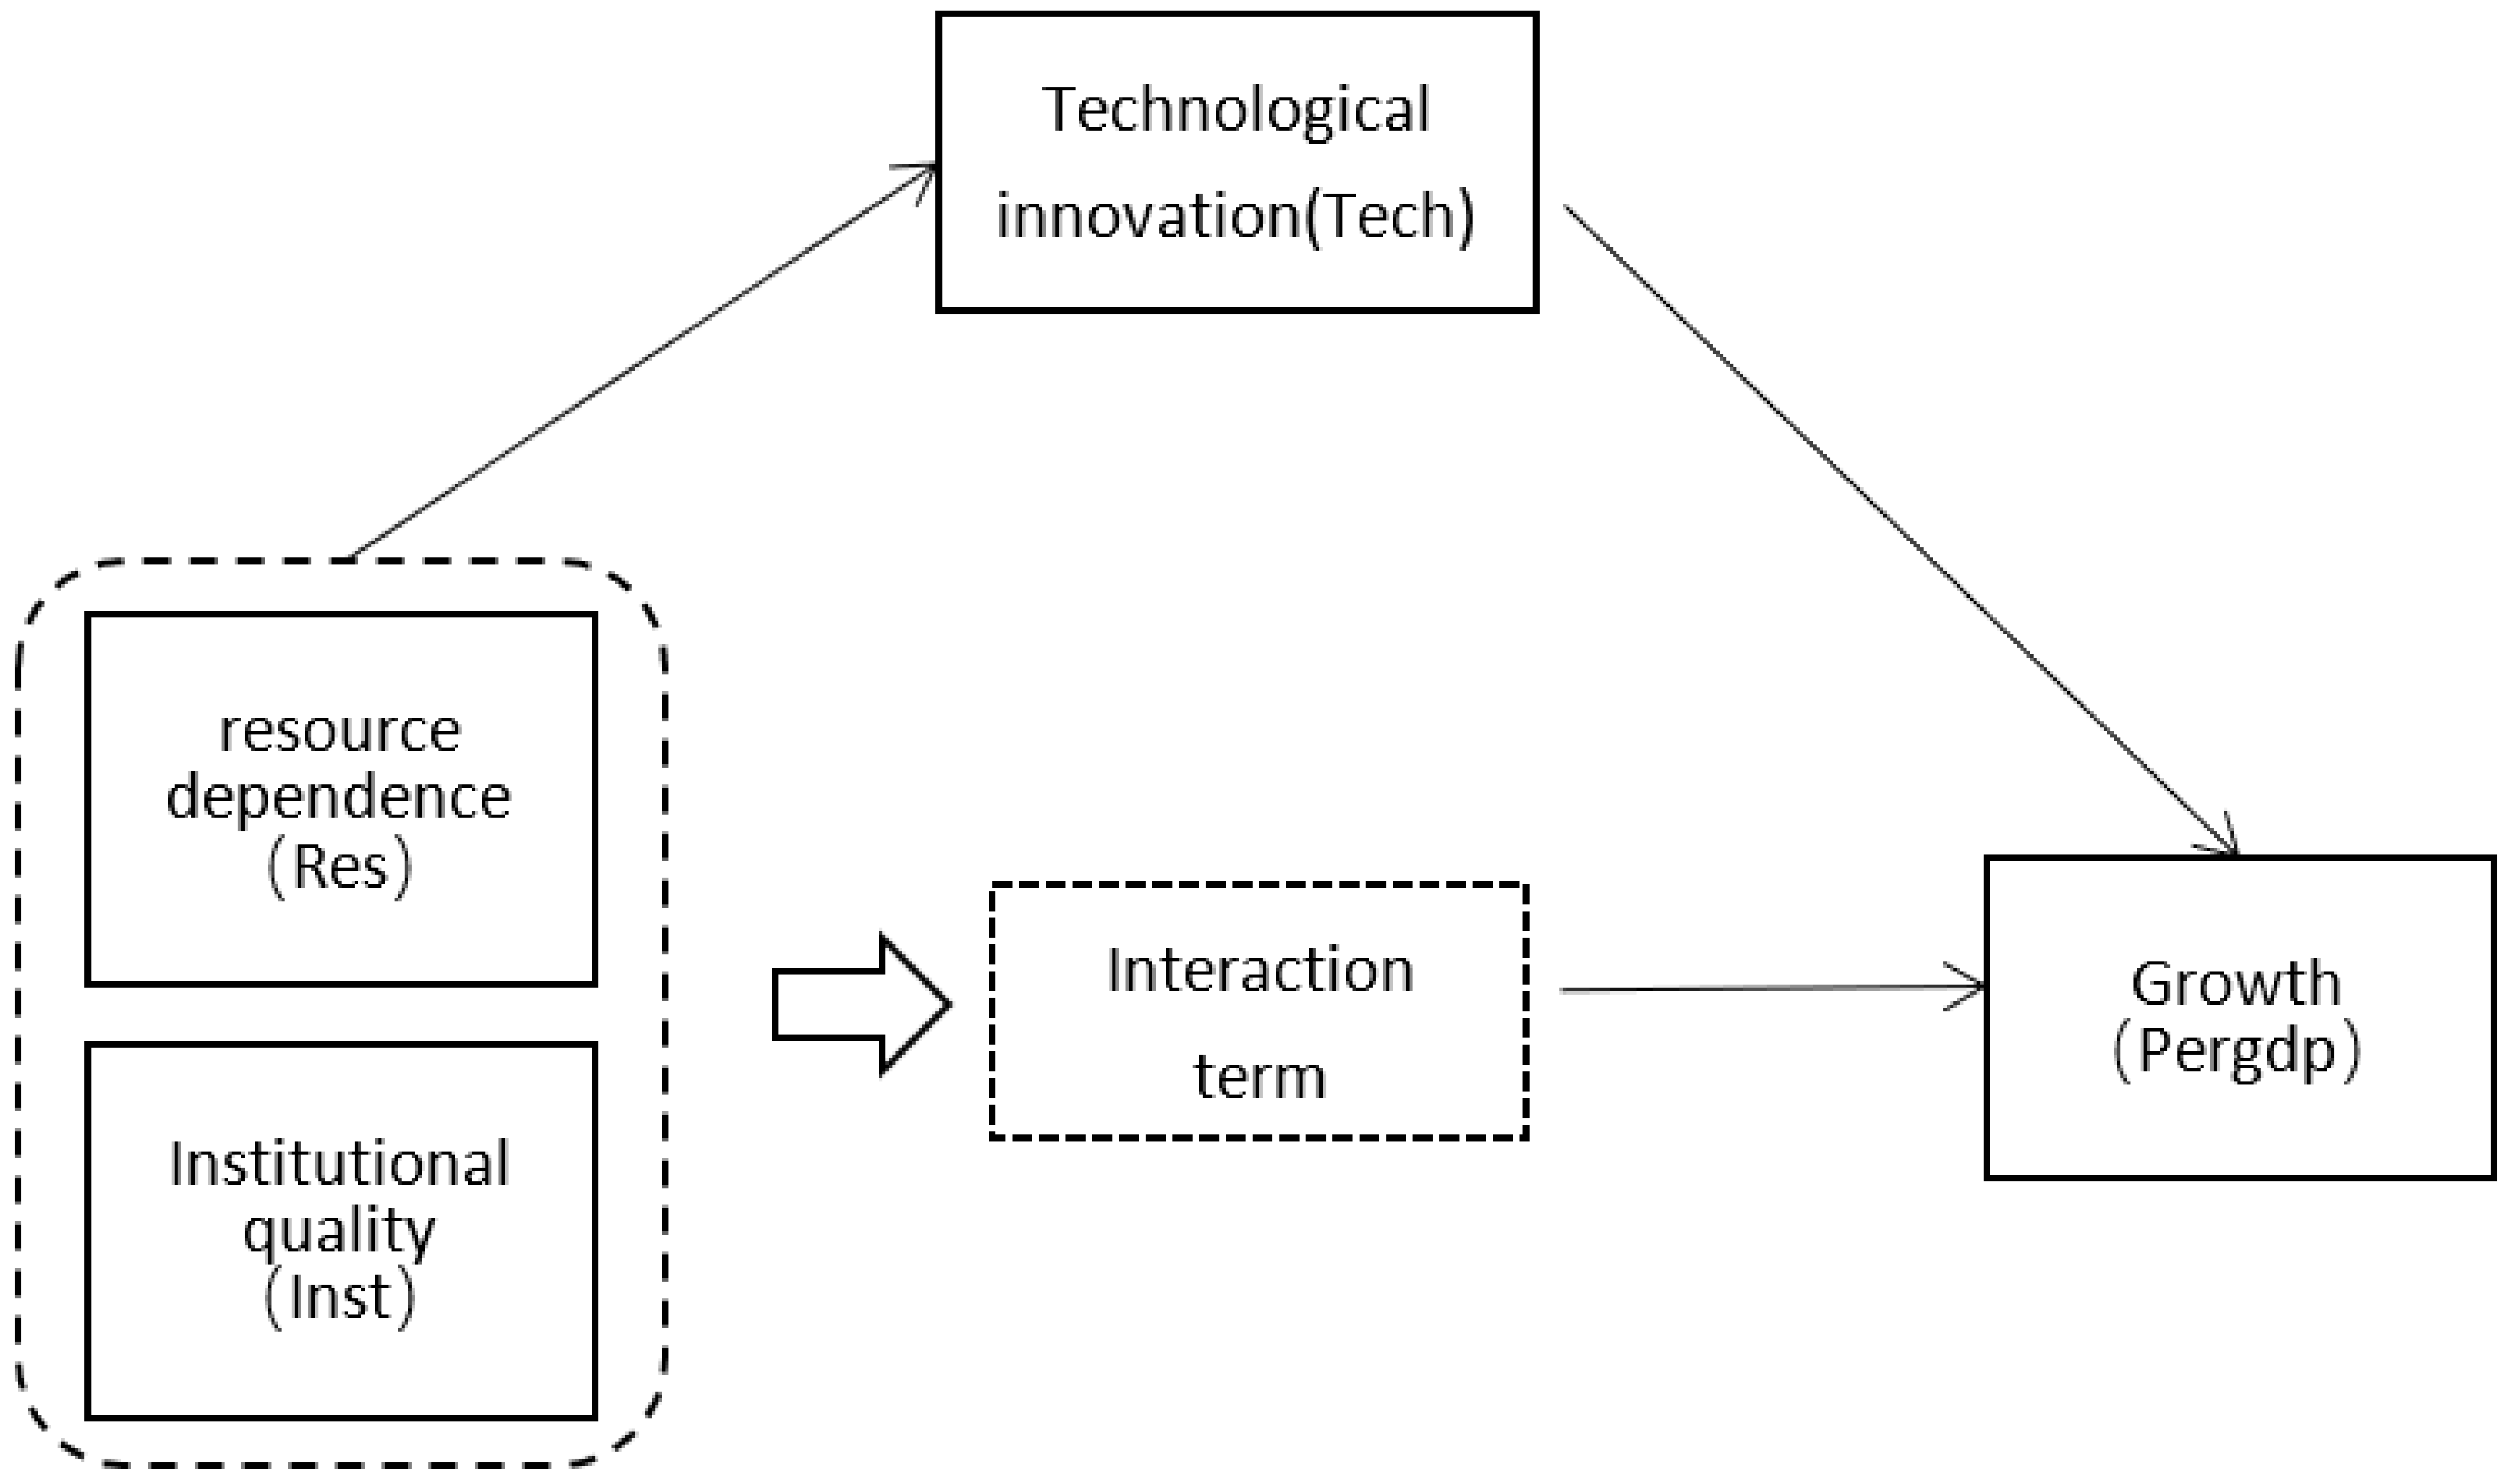
Impact on Regional Sustainable Development: The excessive reliance on natural resources will inevitably damage the ecological environment as the development and utilization of resources increases. Former resource-based cities, such as Pittsburgh in the United States and the Ruhr Industrial Zone in Germany, encounter ecological and environmental problems; Pittsburgh’s transformation was successful, but the Ruhr Industrial Zone was in trouble. The realization of industrial transformation through technological innovation (TI) is very important to the transformation of the economic-growth modes of resource-based regions. Therefore, this paper adds TI as an intermediary variable to test the economic-promotion effect of RD [17].

2.2. Overview of the Relation between Institutional Quality and Economic Growth

Institutional quality (IQ) refers to the general terms of the quality and the degree of a system. The measurement of the IQ includes the competitiveness of countries, the income gap, the government governance level, entrepreneurial activities, and many other aspects. Studies have shown that 60% of the income gap between Latin American and developed countries is due to the IQ [18]. The existing literature on the relation between the IQ and economic growth focuses on the following three aspects:
(1)
IQ affects labor-income distribution and economic development. Roderick et al. assessed the effects of IQ, trade, and geographic conditions on the global income inequality by using three datasets for empirical evidence, and they conclude that the IQ is the most critical factor that affects the income inequality between countries. Both economic and political systems significantly affect economic development. The economic system formulates an incentive mechanism for economic participants, and the political system can have an impact on the quality of the economic system, which thereby affects economic growth. Rent-seeking behavior that is caused by the IQ has become an important reason for the backwardness of regions. The flow of talent to the rent-seeking sector is considered the reason for the stagnation of economic development in Latin America, and for the slow economic growth in Europe. Eastern countries, such as India, are developing historically, and some elites regard rent-seeking as the primary form of economic activity [18];
(2)
IQ affects national political stability and economic growth. Ndaba studied the impact of national political power and the rule of law on economic growth, and they point out that a sound democratic political system can curb government corruption, improve the efficiency of public management, and improve a country’s competitiveness [19]. An empirical study of 71 countries found a significant positive correlation between “political instability” and the social income gap, and a significant negative correlation between the lack of property-rights protection and investment, and that economic growth is a national risk indicator for social stability [20];
(3)
IQ affects the business performances of entrepreneurs and, ultimately, economic growth. A good system is conducive to entrepreneurial knowledge accumulation, information collection, and opportunity selection. In terms of distinguishing the types of entrepreneurial activities from the IQ, good institutions promote more productive entrepreneurial activities. Productive entrepreneurial activity is the key to economic growth, and the direction of the entrepreneurial talent allocation depends on the relative rewards that social institutions pay to productive or nonproductive fields [19,21,22].

3. Theoretical Analysis and Theoretical Hypothesis

Institutions play a crucial role in regional economic growth, and, in some economies, the resource-abundance and institutional-performance indicators have a significantly negative impact on economic development [23]. Natural resources cannot hinder economic growth, and their abundance will naturally produce a “weakening system” effect. Abundant natural resources positively impact regional economic development mainly through government rent-seeking [7]. Still, excessive dependence on resources has a damaging impact on regional economic development, and the abundance of natural resources has a greater effect on economic growth. Many places are hindered rather than facilitated [24,25]. Therefore, the following assumptions were made.
Hypothesis 1 (H1).
There is a negative correlation between natural-resource dependence and regional economic development.
Empirical research shows that the IQ has a higher impact on the economy than other factors, and once institutions are controlled for, trade is almost irrelevant. A good system can provide a channel for market participants to communicate market conditions and information, which thus facilitates cooperation among market actors, which ultimately reduces transaction costs and improves efficiency [26,27]. Outliers do not drive this effect; for example, Africa is poorer than other countries, and not purely by geographic or cultural factors. High IQ helps ensure that public power is not abused, and that the protection of property rights is strong, and it promotes the efficient allocation of economic resources. Since state-owned enterprises mostly conduct resource development, investment tends to be in state-owned enterprises in areas with poor IQ, which will have a crowding-out effect on nonpublic economies, such as private enterprises [28]. Generally, researchers tend to believe that institutions play a crucial role in regional economic development. In some groups of economies, the natural-resource-abundance and institutional-performance indicators have a substantial negative impact on economic development, which determines the existence of an RC [29,30,31]. Therefore, we formulated the following hypothesis:
Hypothesis 2 (H2).
There is a significant correlation between institutional quality and regional economic growth.
A region continues to over-rely on the resource industry, and limited production factors are allocated to the resource sector, which weakens the development of economic sectors such as manufacturing and forms an unreasonable industrial structure. Good IQ is considered a critical factor that can alleviate the effect of the RC. Restricting TI, reducing the IQ, and falling into the trap of resource advantage, a good institutional environment is generally considered to be a critical factor in improving the resource-utilization efficiency and alleviating the RC [15,32]. However, the improvement in the IQ and the technological-input level can effectively improve the negative impact of RD on economic growth [16,21,33]. The same production factors are invested in regions with higher IQ, which will achieve better economic-growth performances [30,34]. On the basis of the overhead discussion, the succeeding hypothesis is suggested.
Hypothesis 3 (H3).
There is a mutual influence between institutional quality and resource dependence, and this weakens the negative impact of resource dependence on economic growth.
The development of knowledge and technology, including R&D investment and human-capital expenditure, can provide pathways for sustainable growth in regions that face RCs [35]. A sound property-rights-protection system ensures that enterprises can obtain sufficient returns in the process of R&D activities, encourages entrepreneurs to invest more material capital and R&D expenses, and promotes more technological innovations (TIs), which thereby result in higher economic-growth rates. TIs have brought about major changes in regional economic growth. Institutions such as property-rights protection affect R&D innovations, which, one by one, have an important impact on economic growth [36]. By examining the impact of a series of institutional indicators on R&D, it was found that, in OECD countries, more reasonable institutions can promote more R&D innovation, and technology-spillover countries benefit more from the process of technology spillover. In a study of 204 businesses in Ghana, it was found that high-level TI affects the SME performance, and the enforceability of the institutional environment enhances the complementary effect of the TI on the firm performance [37]. By drawing inspiration from the existing literature, we consider that TI plays a key part in the economies of resource-based regions, and that IQ is an indispensable condition for the promotion of innovation activities and for the protection of innovation achievements (TI) in any resource-based region, both of which have costs, and especially for developing economies, and legal systems, such as the specificity and enforceability of property rights to protect the new inventions of enterprises, which can have a significant impact on their innovation efficiencies [23,24]. Chinese researchers constructed social-capital indicators that are based on the quality of government agencies and information communication and sharing, and they used national interprovincial panel data from 1998 to 2013 to verify the impact of social capital on TI and economic growth, and the “cross-effect” between social capital and TI. The inflection point of the inverted U relation between resources and the economy is gradually pushed back. Social capital stimulates TI, which weakens the “crowding-out effect” of the resource development on TI [18]. Consequently, the following assumptions were made.
Hypothesis 4 (H4).
Technological innovation plays an intermediary function in the relation between resource dependence, institutional quality, and economic development.
In short, this study aims to empirically analyze how various factors affect economic growth through a case analysis in China. To this end, this study established four hypotheses: The first hypothesis (H1) addresses whether RD affects economic growth. The second hypothesis (H2) addresses whether IQ affects economic growth. The third hypothesis (H3) addresses whether IQ can reduce the negative effect of RD on economic growth. The fourth hypothesis (H4) addresses whether TI strongly affects economic growth. This study attempted to explore the “genuine” factors that significantly affect economic growth through these four hypotheses. For example, it is intuitively thought that abundant resources will have a positive (+) effect on economic growth; however, this study suggests that abundant resources have a negative (−) effect, and a “genuine” factor that has a significantly positive (+) effect on economic growth, such as IQ, TI, etc. The analysis framework of this study is shown in Figure 1 below.

4. Research Design

This study referred to several previous studies, and it selected a dependent variable, explanatory variables, a control variable, and mediating variables. In short, this study performed an empirical analysis by using factors and empirical models that have already been verified in several previous studies, and it attempted to improve the reliability of the research methodology.

4.1. Variable Definition and Data Source

4.1.1. Dependent Variable

The dependent variable selected is regional economic growth, following the selection of researchers such as Acemoglu et al. [38] and Alexeev and Contrad [39]. We also selected the logarithm of the GDP per capita as a proxy variable for regional economic development.

4.1.2. Explanatory Variables

The core explanatory variables of this study are the regional RD index and the regional IQ index. For the selection of the proxy variables of the RD index, some researchers use government efficiency to measure the system, arguing that government effectiveness includes the degree of recognition of the quality of public services, the quality of government officials, competition between civil servants, and the independence of civic services from political pressure—the extent and credibility of government policy commitments to individual groups [40]. In a report on the different progresses of marketization in diverse regions of China that was compiled by Gang et al. [41], the “marketization index” was used as the measurement basis for institutional variables. They believe that one part represents technological progress in the total factor productivity, while the other is caused by the optimization and institutional progress [42]. There is also an institutional-index-evaluation system that is constructed by using the entropy method, which subdivides the institutional indicators into five aspects: the marketization degree, the industrial structure, the openness, the urbanization level, and the education level [16]. The relationship between institutions and economic development is complex and nonlinear due to the substitution and complementarity of various institutions. Some researchers believe that it is difficult to accurately measure regional economic growth by using a single instrumental variable, and they find that there is an endogeneity problem when selecting instrumental variables for research [6,37,43]. By reading literature and by synthesizing the research of relevant researchers, this study also considers the availability of data, and it selects the extent of the market allocation of resources and the structure of property rights as proxy variables to measure the IQ.
(1)
The degree of resource allocation by market, borrowing the method of Gang et al. [41], is estimated by the ratio of the fiscal expense in each region to the GDP of the region. Economic support [13,44];
(2)
Diversification of property rights: He and Jiang [45] uses the percentage of the number of workers in urban state-owned units to the number of urban employed to measure the diversification of property rights. The “property protection system index” in this paper measures the degree of the property-rights protection in various regions and proposes that the institutional-competitiveness index includes five subitems: a property-rights-protection system, individual economic-decisionmaking freedom, market development, government approval, and the management index and legal-system integrity. By referring to He and Jiang [45]’s practice, this study uses the percentage of the number of workers in urban state-owned units to the number of urban ones. The higher the proportion, the higher the extent of nationalization.

4.1.3. Control Variable

As mentioned in the theoretical analysis above, this study selects the following five variables as control variables: (1) the level of the industrial system, to control the impact of the regional industrial development and structure; (2) the level of human capital, to control the amount and quality of regional human capital; (3) the level of foreign investment, to control the impact of regional openness; (4) the level of scientific-research investment, to control the impact of the regional technology-management capabilities; and (5) the level of urbanization, to control the impact of the urban–rural structure and the regional urbanization level.

4.1.4. Mediating Variables

The intermediary variable selected in this study was the regional TI level. This proxy variable can be measured by the growth ratio of the new product sales revenues of valuable enterprises [31,46], or by the number of patents that are applied for to measure [33,36,46]. This study follows the research method of Shahbaz et al. [46], and it selects the sum of the numbers of inventions, utility models, and appearance patents applied for each province annually to measure the TI standard of the region. Table 1 lists the symbols and definitions for each variable.

4.2. Empirical Model

To further verify the above assumptions proposed in this paper, this study builds the subsequent empirical-analysis model on the basis of the extension of the C–D-production-function model, as shown in Equation (1):
l n _ p e r g d p i t = δ 0 + γ R e s i t + β I n s i t + α 1 I d u i t + α 2 H u m i t + α 3 I n v i t + α 4 R & D i t + α 5 U r b i t + u i + ε i t
where Pergdp is the explained variable that indicates the economic-development-level index. The RD index and the IQ index are explanatory variables. The control variables include human capital, foreign investment, scientific-research investment, and the urbanization level, where i and t connote the province code and year, respectively.
The data employed in this thesis were selected from China’s authoritative statistical yearbooks from 2000 to 2019, which include the “China Statistical Yearbook” and the “China Labor Statistics Yearbook.”

5. Results and Discussion

5.1. Summary Analysis

The variables of the nonproportional class in Table 1 were logarithmized to enhance the stationarity of the data. The results of the explanatory statistics are explained in Table 2.
As is shown in Table 2, each variable showed significant regional heterogeneity. The maximum value of the economic-growth level is about 1.5 times the minimum one, the maximum value of the RD index is almost 7.3 times the minimum one, and the maximum value of the IQ index is almost 10 times the minimum one. The control variables show strong regional differences. The maximum values of the industrial structure, human capital, foreign investment, scientific-research investment, and urbanization level are 2, 13, 17, 5.8, and 3.1 times the minimum value, respectively. It can be seen that the regional differences in human capital and foreign investment are the most significant, which shows that the regional heterogeneity in human resources, education, and the attraction of foreign investment is pronounced.

5.2. Basic Regression

The Hausman test was conducted in this study to judge whether to use a fixed-effects or random-effects model in the benchmark regression. We substitute five control variables and perform a basic regression based on fixed effects. The Hausman value of the test result was −1288.80, and the p-value was 0.000, which represent that the null hypothesis was rejected and that the fixed-effects model should be utilized. Table 3 presents the findings.
As can be shown from Table 3, because not all control variables are substituted in the models (1)–(4), there may be omitted variables, which makes the regression coefficients very different and inconsistent in direction. By referring to the existing theoretical and empirical research, it can be judged that the regression results that are obtained when all five control variables are included are the most credible. After the five control variables are included, the correlation coefficients between RD and economic development are −1.3535 and −0.0002, which are adversely correlated with economic development, which shows that the higher the degree of RD, the larger the negative impact on economic development. Five control variables, including the industrial structure, human capital, foreign investment, scientific-research investment, and the urbanization level, were introduced into the basic regression to verify the relation between the RD, institutional variables, and economic growth under different combinations of control variables. The results are as above, which show that, when only the industrial structure is introduced, there is a positive correlation between RD and economic growth, but the result is not significant, which points out that there may be omissions of characteristic variables; when adding control variables such as human capital, foreign investment, and scientific-research investment, the regression results show that there is a significant positive correlation between RD and economic development. A possible reason is that human capital, foreign investment, and scientific-research investment have considerably changed the economic-promotion effect of the RD, which optimized the resource allocation and the utilization efficiency. The agglomeration effect of the production factors has been further revealed, which proves that the above three control variables have a critical effect on the economic-promotion effect of the RD. After the fifth control variable is included, which is the urbanization level, the relationship between the RD and economic development is positive. It becomes significantly negative at the 1% level, which indicates that there is a negative relationship between RD and economic growth after considering all the characteristic variables. IQ and economic development also show a significant correlation. Thus, Hypotheses 1 and 2 are verified.

5.3. Interactive-Term Test

Theoretical and empirical analyses of the existing literature show that RD and IQ affect each other, and that the results of the mutual influence impact economic growth. Therefore, this study follows previous research methods, constructs the interaction term of the RD and IQ [24,47], and brings it into the regression models. A new variable (X3) is generated to represent the interaction term between the RD and IQ, which is X3 = X1 × X2, and the regression model shown in Equation (2) is constructed:
l n _ p e r g d p i t = δ 0 + γ R E S i t + β I n s i t + μ R E S i t × I n s i t + α 1 I d u i t + α 2 H u m i t + α 3 I n v i t + α 4 R & D i t + α 5 U r b i t + u i + ε i t
Equation (2) represents the interaction term of the IQ and RD, and i and t indicate the province code and year, respectively, and take their logarithms. The rest of the variables are consistent with those in Equation (1), and the test results are described in Column 3 of Table 4.
The results imply that, before the interaction term is introduced, the correlation coefficients of the RD, IQ, and TI are −1.576, −0.0003, and 0.1709, and that, after the interaction term of the RD and IQ is introduced, the coefficients of the three variables are −1.6166, −0.0008, 0.1701, and the coefficient of the interaction term between the RD and IQ is 0.1720. The above results are all significant at the 1% level. This suggests that the interaction term between the RD and IQ positively impacts economic growth. The negative effect of the RD is more apparent, and the impact of the IQ is weak. Furthermore, this result shows that the RD and IQ have obvious complementary and mutually influential relationships in the promotion of economic growth; that is, the higher the level of the IQ, the smaller the negative impact of the RD on economic growth, and the lower the quality level, the greater the negative impact of the RD on economic development. Because of the significant “inverted U-shaped” relations between RD and economic development, this pair of interaction-term tests also reveals the relation between the RD and IQ. In summary, the RD is the direct driving force of regional economic growth, but the IQ affects the direction and efficiency of this dynamic to a considerable extent. Thus, H3 was tested.

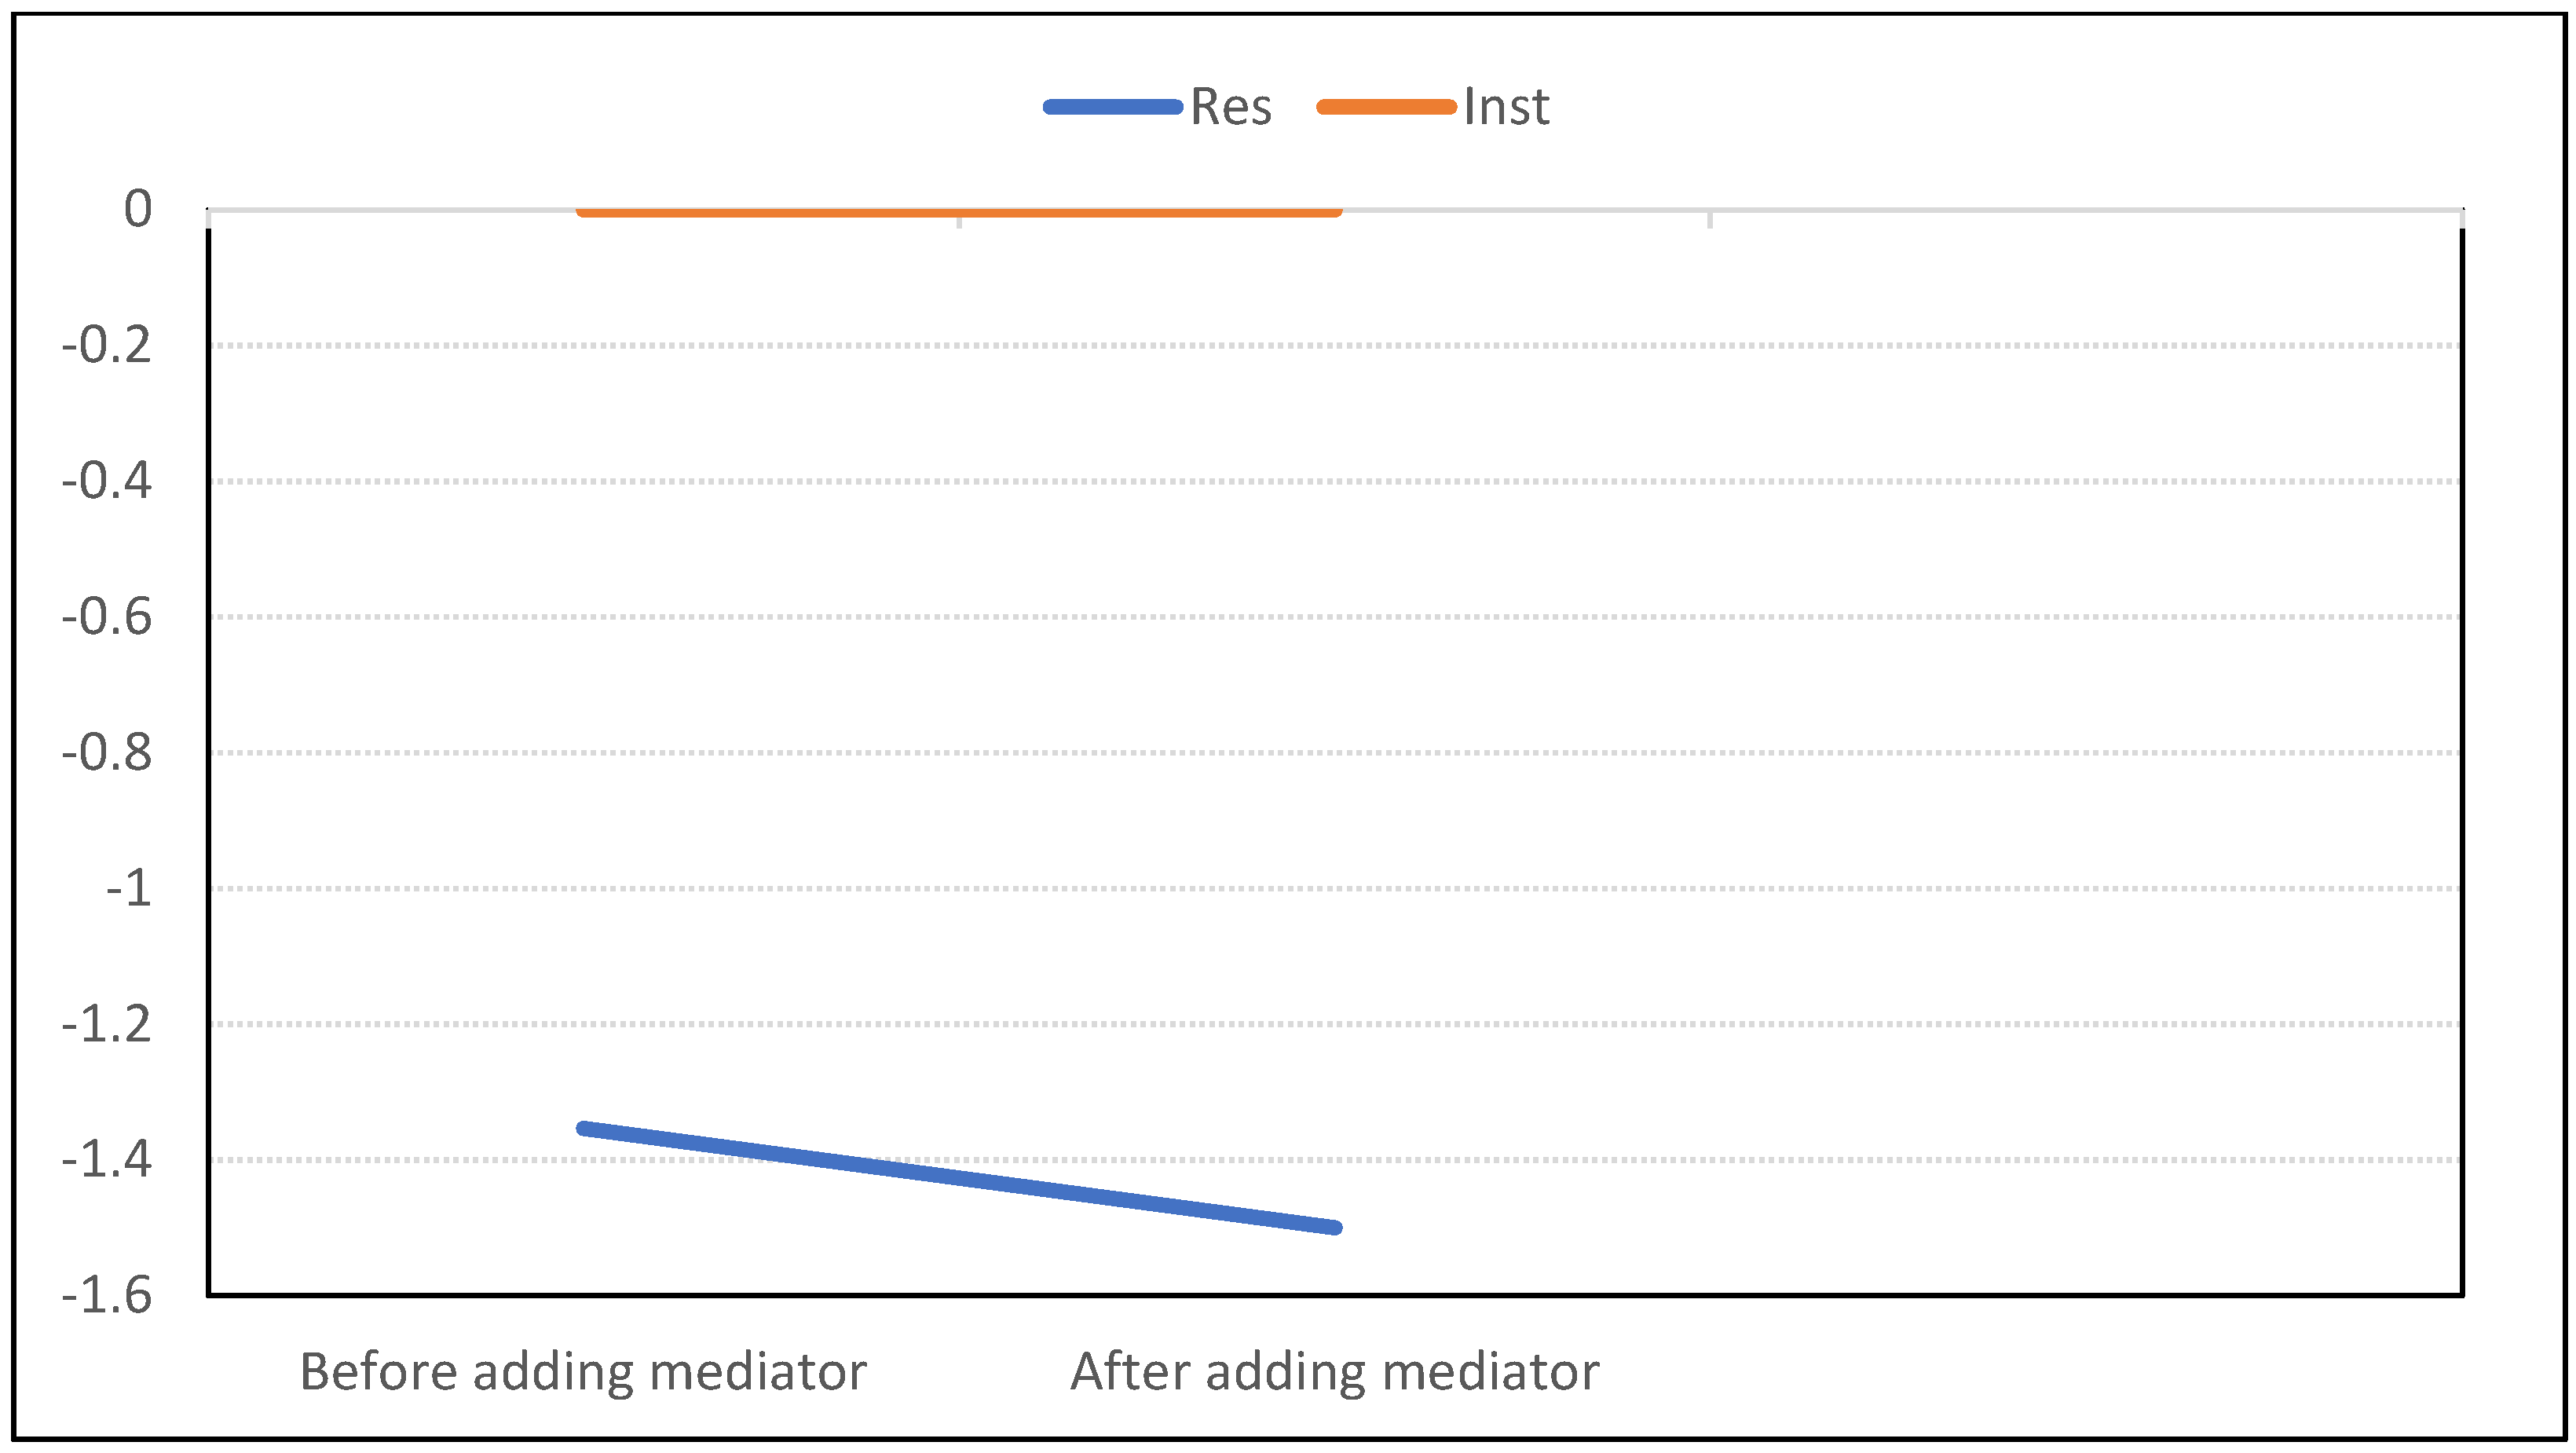
5.4. Mediating-Effect Test

This study draws on the test method of the mediation effect. By calculating the two types of regressions, including mediator variables and those without mediator ones, it is judged whether the coefficients of the dependent variable and the mediator one in the results are significant to identify whether there is a mediation effect. Technological innovation is added to the basic regression model (1), as is shown in Formula (3), to verify that TI plays a mediating role in the RD, the IQ, and the economic development.
l n _ p e r g d p i t = δ 0 + γ R E S i t + β I n s i t + δ l n _ T e c i t + α 1 I d u i t + α 2 H u m i t + α 3 I n v i t + α 4 R & D i t + α 5 U r b i t + u i + ε i t
Equation (3) represents the mediating variable of TI. The remaining variables and their representative meanings are consistent with Equation (1). The test results are presented in Column 1 and Column 2 of Table 4.
Before and after adding the mediating variable, the correlation coefficients of the two explanatory variables and the mediating variable were significant, which indicates a mediating effect. This is because TI has greatly changed the method and efficiency of the resource utilization of various economic entities, promoted the optimization of the industrial structure, improved the labor productivity of the whole society, and affected the relation between the RD and economic development. TI is used to improve the efficiency of resource mining and utilization, and to find new industries or industrial clusters that are related to old industries, which is a way for the sustainable growth of resource-dependent provinces. Thus, Hypothesis 4 passes the test.
Through further analysis, it was found that, before and after introducing the intermediary variable, there are changes in the institutional variables and the RD, which are shown in Figure 2.
The degree of influence of the TI on the IQ is not very obvious. In other words, it is difficult to impact the IQ directly, and it is possible to indirectly affect the IQ through the economic growth and organizational changes that are brought about by technological progress.
This analysis indicates that TI affects the regional economy by directly affecting resource development. TI slightly increases the negative effect of RD on economic growth, which is consistent with the actual situation, because TI requires long-term effects to achieve good results. The increase in various TI investments in the short term will result in a slight decrease in economic promotion.

5.5. Robustness Test

This study adopted the GMM estimation method, which is based on the dynamic-panel model, to conduct a robustness test to verify the robustness of the model. The constructed dynamic-regression model is shown in Equation (4).
l n _ p e r g d p i t = δ 0 + σ l n _ p e r g d p i t 2 + γ R E S i t + β I n s i t + α 1 I d u i t + α 2 H u m i t + α 3 I n v i t + α 4 R & D i t + α 5 U r b i t + u i + ε i t
In Equation (4), the second-order lag-dependent variable is used as an instrumental variable, and the remaining variables are consistent with Equation (1). Table 5 presents the regression results.
As can be seen from the above table, even after changing the estimation method, the conclusions of this study still hold, which shows strong robustness.

6. Conclusions

This study constructs a multilevel and multitype analysis framework by building different regression models, changing estimation models, and analyzing the relationship between the economic development of resource-based regions and key elements, such as the RD, IQ, and TI, in the context of China. A more detailed characterization led to the following conclusions:
(1)
There is a negative correlation between the RD and regional economic development:
Owing to the typical characteristics of the unbalanced regional development of the Chinese economy, the total amount, the quality, and the critical driving factors of economic development in various provinces are significantly heterogeneous. Overall, the contribution of fixed investments to the economic development of multiple provinces is very high. However, different economic and geographical features change the proportion of the various driving factors. Some provinces with low RD, such as Guangdong and Jiangsu in the southeastern coastal areas, already have prominent TI-driven characteristics; however, at the same time, the development model of provinces with high extents of RD is still overly dependent on factor-driven development. Human capital, technological-innovation capabilities, and resource abundance have all declined. These provinces face considerable challenges in transforming economic-growth patterns; provinces such as the northeast have fallen into the nightmare of the RC;
(2)
IQ, TI, etc., can weaken the negative impact of the RD on economic growth:
Owing to the continuous decline in natural-resource reserves and the continuous increase in mining costs, this is a natural law that does not depend on human will. Therefore, it is important to increase the efficiency level of the exploitation and utilization of natural resources through IQ, TI, etc., and to explore new supporting points for economic growth. This research further reveals that resource-dependent provinces should not simply continue fixed-capital investment in the field of natural resources, but should also continuously improve the business environment, increase the innovation capabilities, and ultimately enhance the commercialization performance of the TI in the alternation and continuation of new and old industries;
(3)
TI is crucial for resource-dependent regions to achieve high-quality economic development:
This study shows that TI can significantly reduce the excessive dependence on natural resources in the promotion of economic development, and it can enhance the optimization and improvement of the industrial structure through the commercialization of new technologies and the generation, flow, and spillover of new knowledge, and can ultimately realize the optimization of the industrial structure. Still, this effect can only be achieved when the performance of the TI is greater than the negative effect of the resource attenuation. In other words, when the performances of regional TIs fail to reach a certain threshold, the transformation of the growth models of resource-based regions is slow, which also means that these regions will be disadvantaged by the internal competition of the same market in China.
There are still some limitations to this study, and similar studies may show different results when using samples from other countries and regions. Limited by the data availability, the provincial level on which this study focuses is still a relatively large region. Its internal-development imbalance is far greater than that of other advanced economies. Therefore, in the next stage, more data-acquisition methods will be used to conduct empirical research at the city level, or in smaller administrative regions, to obtain more scientific and realistic conclusions. Meanwhile, the following two conclusions of this study are consistent with the analysis results that were derived from previous studies. In short, the analysis results of this study that target China are similar to the ones that were derived from previous studies. First, RD has become an obstacle to economic growth. Second, TI plays a crucial intermediary function in the relation between RD and economic development; high-quality TI can significantly reduce the adverse impact of RD on economic growth. Therefore, through data analyses from various countries other than China, in the follow-up study, we will attempt to look for cases where resource dependence is abundant, where there is accelerating economic growth, or where technical innovation is not a critical factor in economic development. New factors that significantly affect economic growth that have not been presented in previous studies could be found.

Author Contributions

Conceptualization, J.M. and M.-K.L.; methodology, J.M.; software, J.M.; validation, J.M. and M.-K.L.; formal analysis, J.M. and Y.-G.A.; investigation, J.M.; resources, J.M.; data curation, J.M. and M.-K.L.; writing—original draft preparation, J.M.; writing—review and editing, Y.-G.A. and M.-K.L.; supervision, M.-K.L.; project administration, M.-K.L.; funding acquisition, M.-K.L. All authors have read and agreed to the published version of the manuscript.

Funding

This research was supported by the Developing and Supporting Program for Science and Technology Policy Human Resource funded by the Ministry of Science and ICT.

Institutional Review Board Statement

Not applicable.

Informed Consent Statement

Not applicable.

Data Availability Statement

Not applicable.

Conflicts of Interest

The authors declare no conflict of interest.

References

  1. Auty, R.M. The political economy of resource-driven growth. Eur. Econ. Rev. 2001, 45, 839–846. [Google Scholar] [CrossRef]
  2. Hall, R.E.; Joones, C.I. Why do some countries produce so much more output per worker than others? Q. J. Econ. 1999, 114, 83–116. [Google Scholar] [CrossRef]
  3. Perkins, E. Book review: Sustaining development in mineral economies: The resource curse thesis, by Richard M. Auty. London and New York: Routledge, 1993. Crit. Sociol. 1995, 21, 158–160. [Google Scholar] [CrossRef]
  4. Yang, H.; Gao, Q. A study of the relationship between resource dependence, resource abundance and economic growth in Shaanxi province. J. Xi’an Shiyou Univ. Nat. Sci. Ed. 2019, 28, 1–7. [Google Scholar]
  5. Sun, H.P.; Sun, W.F.; Geng, Y.; Yang, X.; Edziah, B.K. How does natural resource dependence affect public education spending? Environ. Sci. Pollut. Res. Int. 2019, 26, 3666–3674. [Google Scholar] [CrossRef] [PubMed]
  6. Lederman, D.; Maloney, W. Open Questions about the Link between Natural Resources and Economic Growth: Sachs and Warner Revisited; Banco Central de Chile: Santiago, Chile, 2002; Volume 141. [Google Scholar]
  7. Pfeffer, J.; Davis-Blake, A. Understanding organizational wage structures: A resource dependence approach. Acad. Manag. J. 2017, 30, 437–455. [Google Scholar]
  8. Davis, G.A. Replicating Sachs and Warner’s working papers on the resource curse. J. Dev. Stud. 2013, 49, 1615–1630. [Google Scholar] [CrossRef]
  9. Namazi, M.; Mohammadi, E. Natural resource dependence and economic growth: A TOPSIS/DEA analysis of innovation efficiency. Resour. Policy 2018, 59, 544–552. [Google Scholar] [CrossRef]
  10. James, A. The resource curse: A statistical mirage? J. Dev. Econ. 2015, 114, 55–63. [Google Scholar] [CrossRef] [Green Version]
  11. Alexander, J.A.; Morrisey, M.A. A resource-dependence model of hospital contract management. Health Serv. Res. 1989, 24, 259–284. [Google Scholar] [PubMed]
  12. Gylfason, T. Natural resources and economic growth: From dependence to diversification. In Economic Liberalization and Integration Policy; Broadman, H.G., Paas, T., Welfens, P.J.J., Eds.; Springer: Berlin/Heidelberg, Germany, 2006; pp. 201–231. [Google Scholar]
  13. Gylfason, T.; Zoega, G. Natural resources and economic growth: The role of investment. World Econ. 2006, 29, 1091–1115. [Google Scholar] [CrossRef]
  14. Ohmura, H. Termination and recurrence of civil war: Which outcomes lead to durable peace after civil war? Jpn. J. Political Sci. 2011, 12, 375–398. [Google Scholar] [CrossRef]
  15. Chang, W.Y. Democracy, natural resources, and infectious diseases: The case of Malaria, 1990–2016. Stud. Comp. Int. Dev. 2010, 55, 354–380. [Google Scholar] [CrossRef]
  16. Wang, T.; Wu, J.; Gu, J.; Hu, L. Impact of open innovation on organizational performance in different conflict management styles: Based on resource dependence theory. Int. J. Confl. Manag. 2020, 32, 199–222. [Google Scholar] [CrossRef]
  17. Frankel, J.A. The Natural Resource Curse: A Survey; NBER Working Paper No. 15836; National Bureau of Economic Research: Cambridge, MA, USA, 2010; pp. 1–35. [Google Scholar]
  18. Song, M.; Liu, B.; Zhang, J.; Li, K. Mineral Economic Regionalization in the Context of Resource Crisis and Sustained Economic Growth. IOP Conf. Ser. Earth Environ. Sci. 2021, 781, 32012–32061. [Google Scholar] [CrossRef]
  19. Ndaba, S. The Impact of Foreign Direct Investment on Economic Growth in Zambia: A Study in the Context of a Natural Resource Dependent Economy. Master’s Thesis, International Institute of Social Studies, Hague, The Netherlands, 2015. [Google Scholar]
  20. Alesina, A.; Rosenthal, H. Partisan Politics, Divided Government, and the Economy; Cambridge University Press: Cambridge, UK, 1995. [Google Scholar]
  21. Magnus, J.R.; Ji, K.; Wang, W. Resource Abundance and Resource Dependence in China; Discussion Paper Series No. 2010-109; Center for Economic Research, Tilburg University: Tilburg, The Netherlands, 2010. [Google Scholar]
  22. Thomas, W.; Janpeter, S. On demand, development and dependence: A review of current and future implications of socioeconomic changes for integrated water resource management in the Okavango catchment of Southern Africa. Land 2013, 2, 60–80. [Google Scholar]
  23. Narain, U.; Gupta, S.; Veld, K.V. Poverty and resource dependence in rural India. Ecol. Econ. 2018, 66, 161–176. [Google Scholar] [CrossRef]
  24. Klauer, K.C.; Teige-Mocigemba, S. Controllability and resource dependence in automatic evaluation. J. Exp. Soc. Psychol. 2007, 43, 648–655. [Google Scholar] [CrossRef]
  25. Casciaro, T.; Piskorski, M.J. Power imbalance, mutual dependence, and constraint absorption: A closer look at resource dependence theory. Adm. Sci. Q. 2005, 50, 167–199. [Google Scholar] [CrossRef]
  26. Hillman, A.J.; Withers, M.C.; Collins, B.J. Resource dependence theory: A review. J. Manag. 2009, 35, 1404–1427. [Google Scholar] [CrossRef] [Green Version]
  27. Chin, J.; Rumble, R.B.; Kollmeier, M.; Heath, E.; Efstathiou, J.; Dorff, T.; Berman, B.; Feifer, A.; Jacques, A.; Loblaw, D.A. Brachytherapy for patients with prostate cancer: American society of clinical oncology/cancer care Ontario joint guideline update. J. Clin. Oncol. 2017, 35, 1737–1743. [Google Scholar] [CrossRef] [Green Version]
  28. Liu, B.; Wang, J.; Jing, Z.; Tang, Q. Measurement of sustainable transformation capability of resource-based cities based on fuzzy membership function: A case study of Shanxi Province, China. Resour. Policy 2020, 68, 101739. [Google Scholar] [CrossRef]
  29. Vaskovskyi, A. Natural resources and quality of life: International evidence. Singap. Econ. Rev. 2020. [Google Scholar] [CrossRef]
  30. Yu, H.; Hu, C.; Xu, B. Re-examining the existence of a “resource curse”: A spatial heterogeneity perspective. J. Bus. Res. 2022, 139, 1004–1011. [Google Scholar] [CrossRef]
  31. Oliveira, F.; Kakabadse, N.; Khan, N. Board engagement with digital technologies: A resource dependence framework. J. Bus. Res. 2022, 139, 804–818. [Google Scholar] [CrossRef]
  32. Tok, E. The incentives and efforts for innovation and entrepreneurship in a resource-based economy: A survey on perspective of Qatari residents. Sustainability 2020, 12, 626. [Google Scholar] [CrossRef] [Green Version]
  33. Mohr, A.; Wang, C.; Fastoso, F. The contingent effect of state participation on the dissolution of international joint ventures: A resource dependence approach. J. Int. Bus. Stud. 2016, 47, 408–426. [Google Scholar] [CrossRef] [Green Version]
  34. Caillier, J.G. Does the rank of the perpetrator and reporter affect how agencies handle workplace aggression? A test of resource dependence theory. Rev. Public Pers. Adm. 2020, 41, 520–545. [Google Scholar] [CrossRef]
  35. Sepehrdoust, H.; Shabkhaneh, S.Z. Impact of compensatory payments on labor productivity of industrial cooperatives. Econ. Res. 2016, 16, 193–211. [Google Scholar]
  36. Campling, J.T.; Michelson, G. A strategic choice-resource dependence analysis of union mergers in the British and Australian broadcasting and film industries. J. Manag. Stud. 1998, 35, 579–600. [Google Scholar] [CrossRef]
  37. Donbesuur, F.; Boso, N.; Hultman, M. The effect of entrepreneurial orientation on new venture performance: Contingency roles of entrepreneurial actions. J. Bus. Res. 2020, 118, 150–161. [Google Scholar] [CrossRef]
  38. Acemoglu, D.; Johnson, S.; Robinson, J.A. The colonial origins of comparative development: An empirical investigation: Reply. Am. Econ. Rev. 2012, 102, 3077–3110. [Google Scholar] [CrossRef]
  39. Alexeev, M.; Conrad, R. The elusive curse of oil. Rev. Econ. Stat. 2009, 91, 586–598. [Google Scholar] [CrossRef]
  40. Rodrik, D.; Subramanian, A.; Trebbi, F. Institutions Rule: The Primacy of Institutions Over Geography and Integration in Economic Development. J. Econ. Growth 2004, 9, 131–165. [Google Scholar] [CrossRef]
  41. Gang, F.; Xiaolu, W.; Liwen, W.; Hengpeng, Z. Report on the relative process of marketization in various regions of China. Econ. Res. 2003, 3, 9–18. [Google Scholar]
  42. Xia, J.; Li, S. The divestiture of acquired subunits: A resource dependence approach. Strateg. Manag. J. 2013, 34, 131–148. [Google Scholar] [CrossRef]
  43. Angrist, J.D.; Kugler, A.D. Rural Windfall or a New Resource Curse? Coca, Income, and Civil Conflict in Colombia. Rev. Econ. Stat. 2008, 90, 191–215. [Google Scholar] [CrossRef]
  44. Ruan, Z.; Liu, W.; Na, S.G.; Tan, X.; Xue, T. Regional marketization, OFDI, and sustainable employment: Empirical analysis in China. Sustainability 2019, 11, 4101. [Google Scholar] [CrossRef] [Green Version]
  45. He, X.; Jiang, Z. Natural resource endowment, institutional quality and economic growth—A theoretical analysis framework and econometric empirical test. J. Southwest Univ. Natl. Humanit. Soc. Sci. 2017, 38, 11. [Google Scholar]
  46. Shahbaz, M.; Destek, M.A.; Okumus, I.; Sinha, A. An empirical note on comparison between resource abundance and resource dependence in resource abundant countries. Resour. Policy 2019, 60, 47–55. [Google Scholar] [CrossRef]
  47. Fowles, J. Funding and focus: Resource dependence in public higher education. Res. High Educ. 2014, 55, 272–287. [Google Scholar] [CrossRef]
Figure 1. Analysis framework.
Sustainability 14 06173 g001
Figure 2. The impact of technological innovation on institutional quality and resource dependence.
Sustainability 14 06173 g002
Table 1. Related variable definitions.
TypesNamesSymbolsDefinition
Explained VariableRegional economic growthPergdpAnnual real GDP per capita and taken as a logarithm
Explanatory VariablesNatural-resource dependenceResExtractive industry employment/Total urban employment
Institutional quality (degree of market-resource allocation, degree of nationalization)Inst(1) Regional fiscal expenditure/Regional GDP;
(2) The number of employees
in state-owned units/
Total number of employees
Mediating VariableTechnological innovationTechTotal number of annual
patent applications
Control VariablesIndustrial structureInduOutput of the tertiary industry/GDP
Human capitalHumNumber of students in colleges/
Total population
Foreign investmentInvForeign investment/Regional GDP
R&D investmentR&DProportion of R&D expenditure
in local financial expenditure
Urbanization levelUrbUrban population/
Total population
Table 2. Descriptive statistics.
VariablesNMeanMinMax
code38010119
year380201020002019
ln_Res3800.01200.008270.0608
ln_Inst3807.7490.0638641.1
ln_Indu3800.3980.2860.571
ln_Hum3800.01450.002240.0292
ln_Inv3800.1530.03480.605
ln_R&D3800.06720.04920.287
ln_Urb3800.4600.2320.706
ln_Y3809.9747.88711.72
ln_Tech3809.4385.83213.31
Table 3. Basic-regression-results table.
(1)(2)(3)(4)(5)
ln_Res12.7385 **4.2574 *4.6624 **4.9055 **−1.3535
(−2.06)(−1.85)(−2.04)(−2.16)(−0.71)
ln_Inst−0.0020 ***−0.0002 −0.0003 −0.0002 −0.0002
(−3.89)(−1.23)(−1.54)(−0.85)(−1.39)
ln_Indu8.6935 ***1.3590 ***1.6701 ***1.5195 ***0.2173
(−15.8)(−5.3)(−6.06)(−5.41)(−0.87)
ln_Hum 130.1340 ***127.5213 ***127.2041 ***73.7887 ***
(−47.34)(−44.5)(−44.64)(−16.02)
ln_Inv −0.5597 ***−0.6385 ***−0.9908 ***
(−2.90)(−3.28)(−6.17)
ln_R&D 1.1376 **−0.2492
(−2.41)(−0.63)
ln_Urb 4.6868 ***
(−13.43)
Constant6.3736 ***7.4998 ***7.4951 ***7.4914 ***6.8494 ***
(−25.93)(−79.53)(−80.29)(−80.78)(−76.58)
Obs380380380380380
Number of code1919191919
R-squared0.4310.9220.9240.9250.950
F90.41052.38861.1728.2965.3
Notes: The numbers in parentheses mean the t-values, *** p < 0.01, ** p < 0.05, * p < 0.1
Table 4. Mediating-effect-test table.
(1)(2)(3)
ln_Res−1.3535 −1.576 −1.6166
(−0.71)(−0.87)(−0.89)
ln_Inst−0.0002 −0.0003 *−0.0008
(−1.39)(−1.88)(−0.89)
ln_Tech 0.1709 ***0.1701 ***
(−6.43)(−6.38)
ln_ResInst 0.1293
(−0.56)
ln_Indu0.2173 −0.1009 −0.1049
(−0.87)(−0.42)(−0.44)
ln_Hum73.7887 ***57.8155 ***58.0052 ***
(−16.02)(−11.52)(−11.52)
ln_Inv−0.9908 ***−0.9989 ***−0.9957 ***
(−6.17)(−6.56)(−6.53)
ln_R&D−0.2492 −0.419 −0.4133
(−0.63)(−1.11)(−1.09)
ln_Urb4.6868 ***3.4164 ***3.4216 ***
(−13.43)(−8.87)(−8.87)
Constant6.8494 ***6.1943 ***6.1983 ***
(−76.58)(−46.77)(−46.68)
Obs380380380
Number of code191919
Notes: The numbers in parentheses mean the t-values, *** p < 0.01, * p < 0.1
Table 5. Robustness-check table.
(1)(2)(3)
Variablesln_Yln_Yln_Y
L.ln_Y1.1165 ***1.1220 ***1.0686 ***
(−22.84)(−22.19)(−16.38)
L2.ln_Y−0.1948 ***−0.1894 ***−0.1899 ***
(−7.72)(−7.16)(−7.19)
ln_Indu−0.4853 ***−0.4857 ***−0.7256 ***
(−4.18)(−4.08)(−3.15)
ln_Hum5.6708 **6.3640 *14.3711 *
(−2.22)(−1.67)(−1.90)
ln_Inv−0.091 −0.0868 −0.0678
(−1.52)(−1.20)(−0.92)
ln_R&D0.051 0.1203 0.1636 *
(−0.67)(−1.57)(−1.93)
ln_Urb0.2484 0.2354 0.734
(−0.56)(−0.46)(−1.13)
ln_Res−1.9201 −1.7827 −0.9568
(−0.31)(−0.36)(−0.88)
ln_Inst0.00224 0.00217 −0.0025
(−0.33)(−0.24)(−0.95)
ln_Tech −0.0098 −0.0216
(−0.61)(−1.15)
ln_ResInst 0.8492
(−0.97)
Constant0.8887 ***0.8669 ***1.2675 ***
(−3.75)(−3.51)(−3.13)
Observations380380380
Number of code191919
Notes: The numbers in parentheses mean the t-values, *** p < 0.01, ** p < 0.05, * p < 0.1
Publisher’s Note: MDPI stays neutral with regard to jurisdictional claims in published maps and institutional affiliations.

