1. Introduction
The process and chemical industry is strongly influenced by the competitive context and by the global orientations pointing towards an ecological transition. This also imposes many constraints that have as their objective the safety and protection of the environment, particularly for industries with major accident hazards. Industry 4.0 technologies provide useful support for achieving maximum efficiency and production through the minimum use of resources [
1,
2] or an effective use of resources in order to obtain maximum production both in the manufacturing sector and in the chemical and process industry. In addition, these technologies have significant potential for creating sustainable value across the economic, environmental, and social dimensions of sustainability by improving resource efficiency [
3,
4]. IoT, CPS, augmented and virtual reality, blockchain technology, machine learning (ML), artificial intelligence (AI), big data analytics, and digital twin can all be considered key enabling technologies [
5].
Focusing on major accident hazard establishments, where processes involve dangerous substances, their management is crucial, especially in preventing the release of hazardous substances, which are always the initiating cause of accidental sequences. Industry 4.0 systems can monitor processes and create a so-called “digital twin” [
1] that helps to establish real-time communication, intelligent decision making, and human–machine interaction in manufacturing organisations. The Seveso legislation controls major accident hazards and [
6] also requires the establishment operators to verify the ageing status of critical equipment. This does not mean carrying out a simple check on the equipment age; instead, it is necessary to monitor its real conditions and how these evolve over the years due to deterioration mechanisms (corrosion, erosion, fatigue, etc.), as well as how they are managed [
7,
8]. Some authors [
9] defined numerous factors affecting the ageing state of critical equipment, which can accelerate or slow down the deterioration; the longevity of the equipment can be ensured by paying attention to these factors since they can affect the frequency of failure and, consequently, the residual useful lifetime. The final aim is to prevent losses of containment and the consequent scenarios (fires, explosions, dispersion of hazardous substances). The use of sensors during a “safety walk” allows controlling the actual conditions of the equipment. A safety walk, in this context, is a tour in the establishment to inspect critical systems, including storage tanks and pipelines, and to obtain information about their integrity and functionality.
Ageing control must be carried out starting from the individual critical equipment and, subsequently, going up hierarchically to the entire logical units or to the entire establishment to also acquire information about the safety management system. The inspector needs to know the history of the equipment (i.e., information from past inspections) to be aware of any critical issues encountered and keep them in mind during the safety walk; then, they will be able to verify the evolution of the situation and take note of these changes for a more effective and safer management of the system. One of the main problems encountered by inspectors during a safety walk is the lack of a complete view of the information about the ageing state of equipment that cannot be captured through a simple visual examination.
For several years, research has been focusing on the creation of technological support solutions in the sector described above. As an example, a system was developed by Milazzo et al. [
10] consisting of smart labels for the recognition of equipment, an equipment log (i.e., management software that keeps track of all events concerning the equipment and which may have an impact on the ageing), and a few models for the evaluation of some ageing-related metrics, managed by cloud computing. The tool proposed in this work is a system called “Virtual Sensor” which represents a much more advanced version of the system described in [
10]. On the one hand, thanks to the aid of Augmented Reality (AR), it provides the inspector with an overview of the ageing state of the critical equipment during the safety walk, while, on the other hand, by integrating an advanced model for forecasting the state of deterioration, it also provides estimates of the progress of the corrosion through iso-level corrosion maps, as well as the values of corrosion rates, probability of the critical pit, and
RUL at certain times.
The article is structured as follows:
Section 2 describes the Virtual Sensor of ageing with its components;
Section 3 introduces the case study used to show how the Virtual Sensor works;
Section 4 illustrates the results obtained from the demonstration of system; the last section presents some conclusions and future perspectives.
2. The Virtual Sensor of Ageing
The Virtual Sensor of ageing is a support tool for inspectors that, during a safety walk in major hazard establishments, need to understand the actual ageing level of equipment, visualise information that cannot be captured with a visual inspection and that is stored in documents, and finally elaborate the metrics evaluating the adequacy of ageing management. Hence, the tool was designed to collect various information relating to the phenomenon, process the acquired data, produce prognostic estimates regarding the corrosion rate, the probability of the critical pit, the evolution of the corrosion on the surface of the equipment, and the residual lifetime, and finally visualise the results by means of AR.
Figure 1 shows a synthetic diagram of the components of the Virtual Sensor. It consists of four main elements. The first item is the dataset (input of data) of the system that is fed through the collection of information about the equipment to be analysed; the second is the set of the models implemented inside the Virtual Sensor; the third is the software developed for the management of data and the elaboration of ageing-related parameters; the fourth concerns the tool for the visualisation of the results in AR by the user during the safety walk. Each item is described in the subsections below.
2.1. Dataset
The use of the Virtual Sensor is possible when the input data are collected. The information to be collected are related to the state of deterioration of critical equipment and its management, which can be summarised in the following sets:
Thickness measurements carried out by means of ultrasonic thickness measurement (UTM) or magnetic flux leakage (MFL) techniques.
Real-time data (e.g., acoustic emissions) coming from the diagnosis of anomalies.
Complete information regarding the management of the ageing state according to the
ageing fishbone model, which was recently adopted by the Italian Competent Authorities to satisfy the requirements of the Seveso Directive [
6] regarding the control and management of the ageing of critical equipment.
The information must be properly organised and formatted to feed the Virtual Sensor.
2.2. Models
Three models are implemented in the Virtual Sensor to be used to produce estimates of ageing-relates parameters, as listed below.
Ageing fishbone model for the assessment of the overall adequacy index (or simply ageing index).
Failure frequency model for the assessment of the frequency of failure due to the equipment ageing (frequency of release).
Probability distribution of pits model based on the extreme value theory for the assessment of the probability of the critical pit and the combination with the Bayesian inference for the assessment of the corrosion rate and the residual useful lifetime (RUL).
Finally, a sophisticated spatial interpolation technique of the thickness data is used to obtain a simplified visualisation of the localised corrosion for the investigated equipment surface.
2.2.1. Ageing Fishbone Model
The overall adequacy index (
Ioverall) is assessed after a score is assigned to the 12 factors, identified to be relevant for equipment ageing, in the sense that they can accelerate or slow down the phenomenon [
9]. The index is the sum of the average score of accelerating factors (with a negative sign) and the average score of decelerating factors (with a positive sign).
where
M is number of factors (i.e., 12 [
9]),
Sk is the score for the
k-th factor,
wk is the weight of the
k-th factor (−1/
M for accelerating factors and +1/
M for decelerating factors).
2.2.2. Failure Frequency Model
The model for the assessment of the frequency of failure is based on the equation proposed by various scholars [
11,
12], which discussed in the detail how to weight and judge the effects of the safety management, i.e., the different measures adopted by the company to prevent failures. The frequency of failure is modified according to following equation:
where
fmod is the modified frequency of failure,
fgeneric is the generic frequency of failure from the literature,
ai is the weight of factor affecting ageing, and
xi is the score assigned to the factor according to [
9] after normalisation to the range between −1 and 1.
2.2.3. Probability Distribution of Pits Model and Combination with the Bayesian Inference
The Extreme Value Theory (EVT) is an approach widely used to study the phenomenon of localised corrosion, particularly the distribution of the maximum depth of the pits. There are three types of distributions that can be used: type I or Gumbel distribution, type II or Cauchy distribution, and the type III or Weibull distribution [
13]. Type I is usually the best fitting for localised corrosion [
14].
where
F(
x) is the cumulative probability function,
x is the maximum corrosion depth, and
α and
β are respectively the scale and the location parameters of the distribution.
A reduced variate (
y) is used to achieve the linearisation of the distribution function to derive the
α and
β parameters by means of the slope and the intercept of the line.
F(y) is calculated using the measured thickness dataset.
The knowledge of the distribution of the scale and position parameters (which define the pit depth probability distribution) over the time (a priori probability distributions) can be exploited to make a forecast of both parameters by means of the Bayesian inference. The Bayesian inference allows determining the posterior probability distribution of α and
β after a certain time using the following equations [
15]:
where
χ′(
α) and
λ′(
β) are a priori probability distributions of
α and
β,
χ″(
α|
xmax) and
λ″(
β|
xmax) are a posteriori probability distributions of
α and
β after a certain time,
f(
α|
xmax) and
f(
β|
xmax) are likelihood functions, and
xmax is the maximum corrosion value detected during the inspection.
The estimated parameters for a given time
t in the future allow making predictions of the probability of critical pit, the corrosion rate, and the
RUL [
15].
2.2.4. Interpolation Model
The interpolation model, implemented in the Virtual Sensor, is the kriging. It is used for the creation of iso-level thickness maps starting from a finite number of points sampled (the thickness values measured during the inspection). The kriging is a geostatistical method for data interpolation [
16,
17], which is based on a statistical correlation along with spatial variables of the same type. The kriging considers the value of the variable (the corrosion depth of the plate in this study) in the other locations and a weight coefficient based not only on the distance between the measured points but also on the overall spatial arrangement of the measured points. The correlation is expressed as
where
λi is the weight assigned to each measured value at the
i-th location.
2.3. Software
The Virtual Sensor is made up of two software programs. The first one is called “App Desktop” that acquires and processes inputs (the equipment information) producing a set of output files, which are subsequently migrated to the second called “App Mobile”, which allows the AR visualisation of all available information associated with the equipment (acquired and processed data).
2.3.1. App Desktop
The application for desktop acquires generic information of the equipment (i.e., commissioning year, handled substance, etc.) and inspection data (i.e., UTM measures or factors to be used in the ageing fishbone model). Then, it runs the deployed mathematical models (see
Section 2.2) to compute the desired actual parameter and make predictions. This software was entirely created using the Python programming language [
18] and its various support libraries such as Matplotlib [
19] for the creation of graphs, Numpy [
20] and Pandas [
21] for data processing, and PyKrige [
22] for data interpolation.
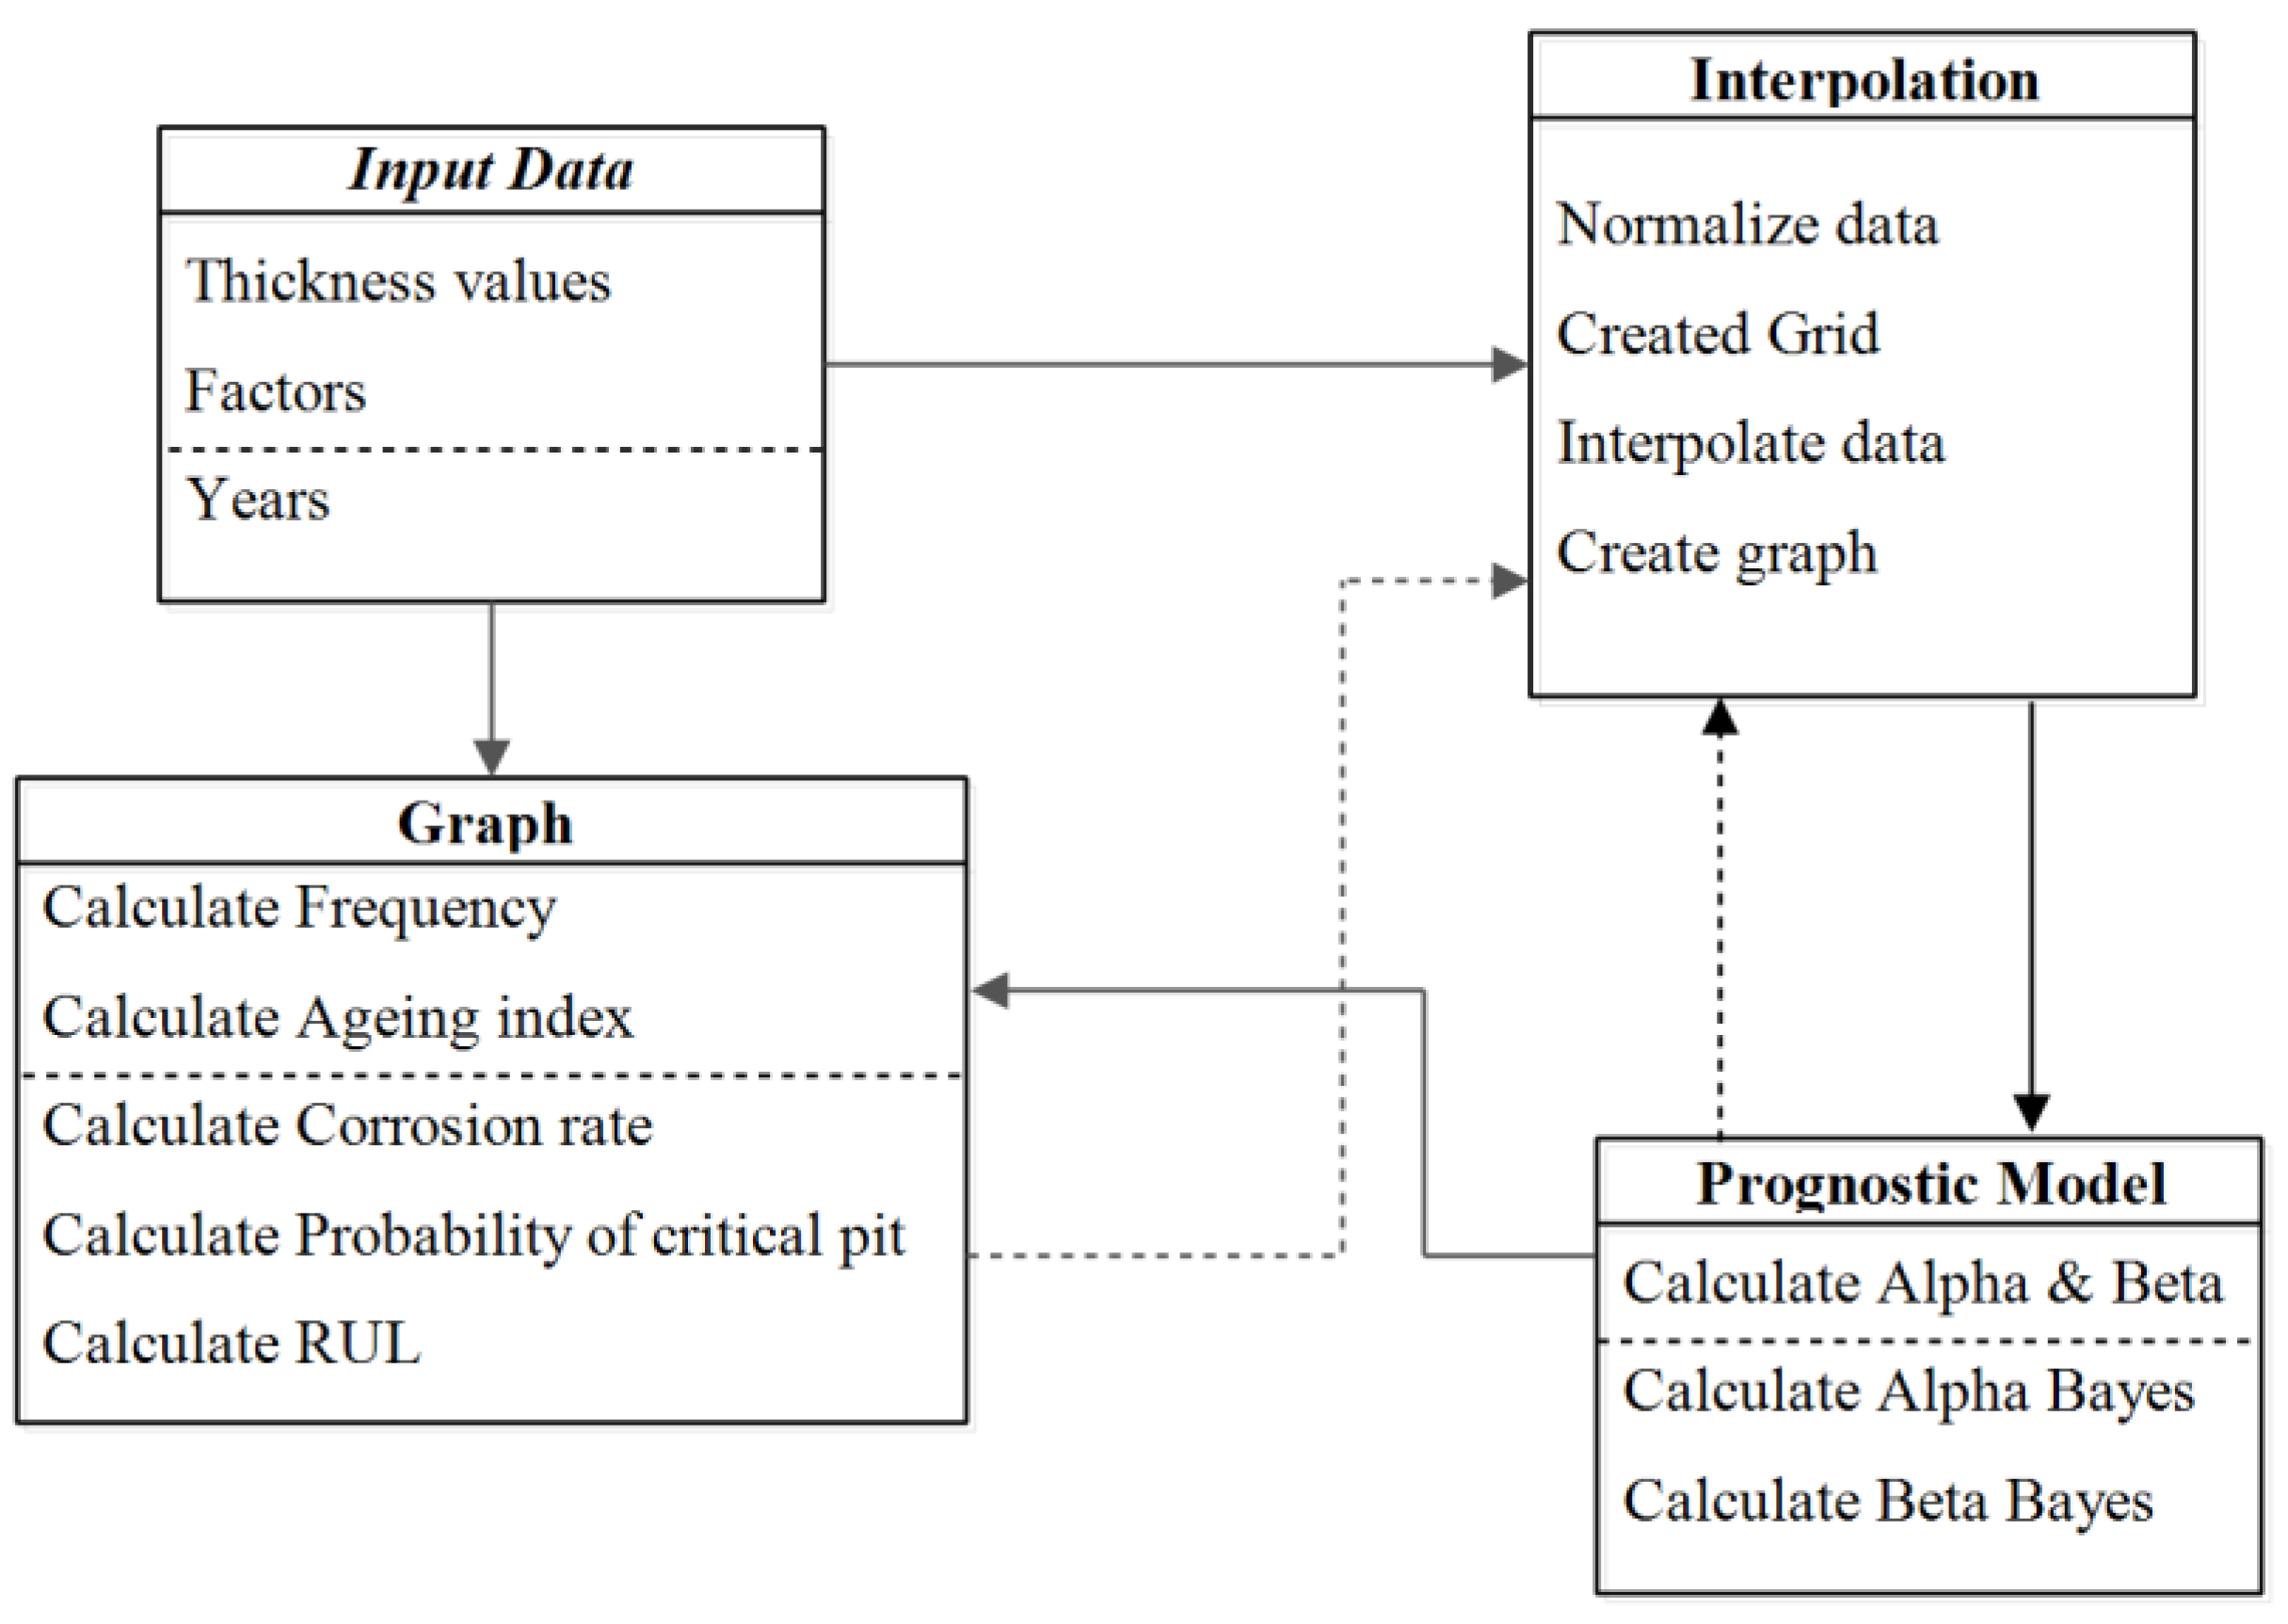
Figure 2 shows the main flow of the algorithm; it is represented by four blocks (or modules). Each block provides the set of functions used or specifically made for the Virtual Sensor. The box called “input data” shows the input data to execute the algorithm. These data flow in two directions: (1) towards the “graphs” module, where the plots for the ageing index and the failure frequency are created; (2) towards the “interpolation” module, where the thickness values of plates begin to be processed. In the same box, there is an optional input “future years” that is used to make predictions at the time the user would like to have this information. In the “interpolation” module, the first performed step is the normalisation of the coordinates (
x,
y) of the sample points in order to create a grid (second step) which always belongs to the same range of values [0, 1]. Once the grid is created, the values of
z (thickness values) are interpolated and allocated on the grid to generate the iso-levels map of thickness. Then, the
z-coordinates are sent to the block “prognostic model” to calculate the alpha and beta values of the Gumbel distribution. The estimates of such parameters for the future years are made only if the user, in the initial phase of the application, inserts the value(s) of the future year(s). If this happens, these values are computed, and their results are sent to the next block.
Finally, all the other parameters of the “graphs” module are calculated (probability of the critical pit, RUL, and corrosion rate). A graph is generated and recorded into the application for each parameter. If the “future years” field is also provided as input data, the value of corrosion rate is sent to the block “interpolation”. This operation permits calculating the iso-levels maps of thickness related to the future years. Indeed, using this variable, it is possible to estimate a new value of the corrosion related to each point of the plates for the abovementioned years by subtracting from the previous values of thickness the corrosion rate multiplied by the years between the last real inspection and the future one.
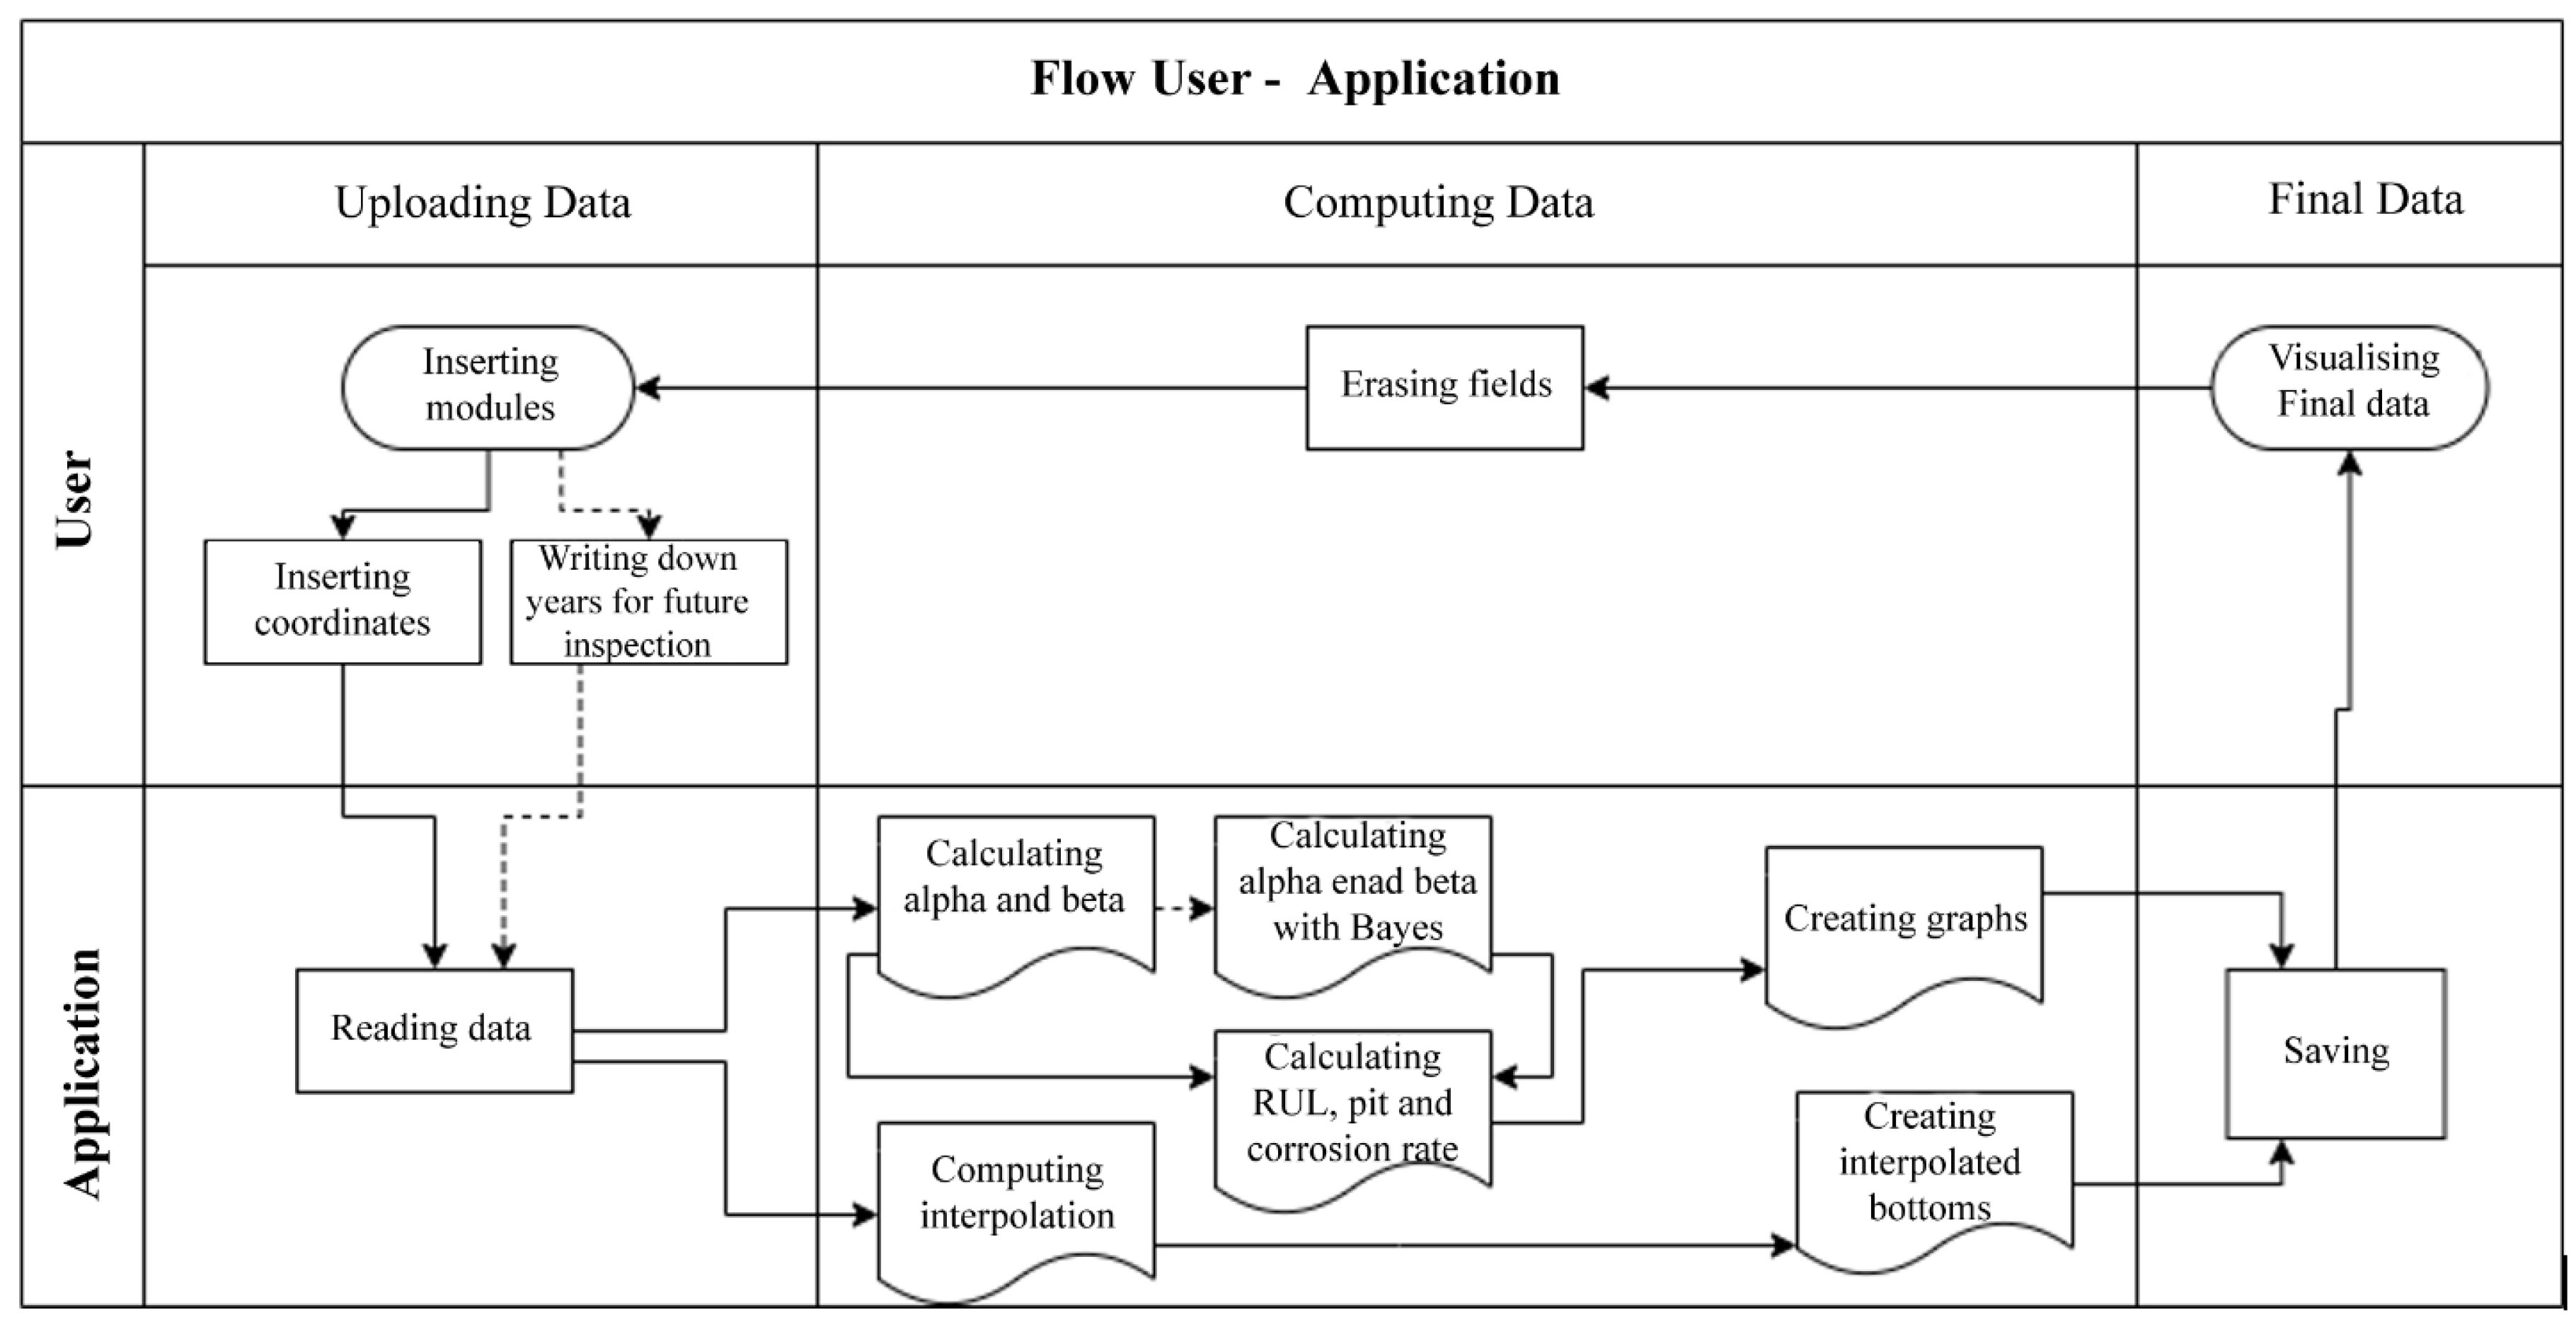
Figure 3 gives a cyclic flow diagram of the interaction between the user and the application. The dotted line indicates a path that can be omitted, representing when the user does not want to elaborate future estimates but only wants to visualise the corroded surface and the parameters related to the current and past inspections.
Initially, the user must load the factors for the elaboration of the ageing index and the frequency of failure, as well as the text files collecting the thickness values for each inspection with their spatial coordinates.
2.3.2. App Mobile
Unlike the desktop application, the mobile app was realised to visualise some elaborated data in AR as a service during the safety walk. Several technologies were used: Unity 2021.1.13.f1 [
23] graphics engine; C# programming language; Blender 2.93 [
24] software for modelling.
Unity is a multiplatform graphic engine, mainly used for developing videogames, which also allows creating interactive content and live 3D visualisation. C# is a programming language used within Unity to make content dynamic and allow the user to interact with it. Blender is a modelling software chosen to reproduce the equipment to study and upload the 3D model on Unity.
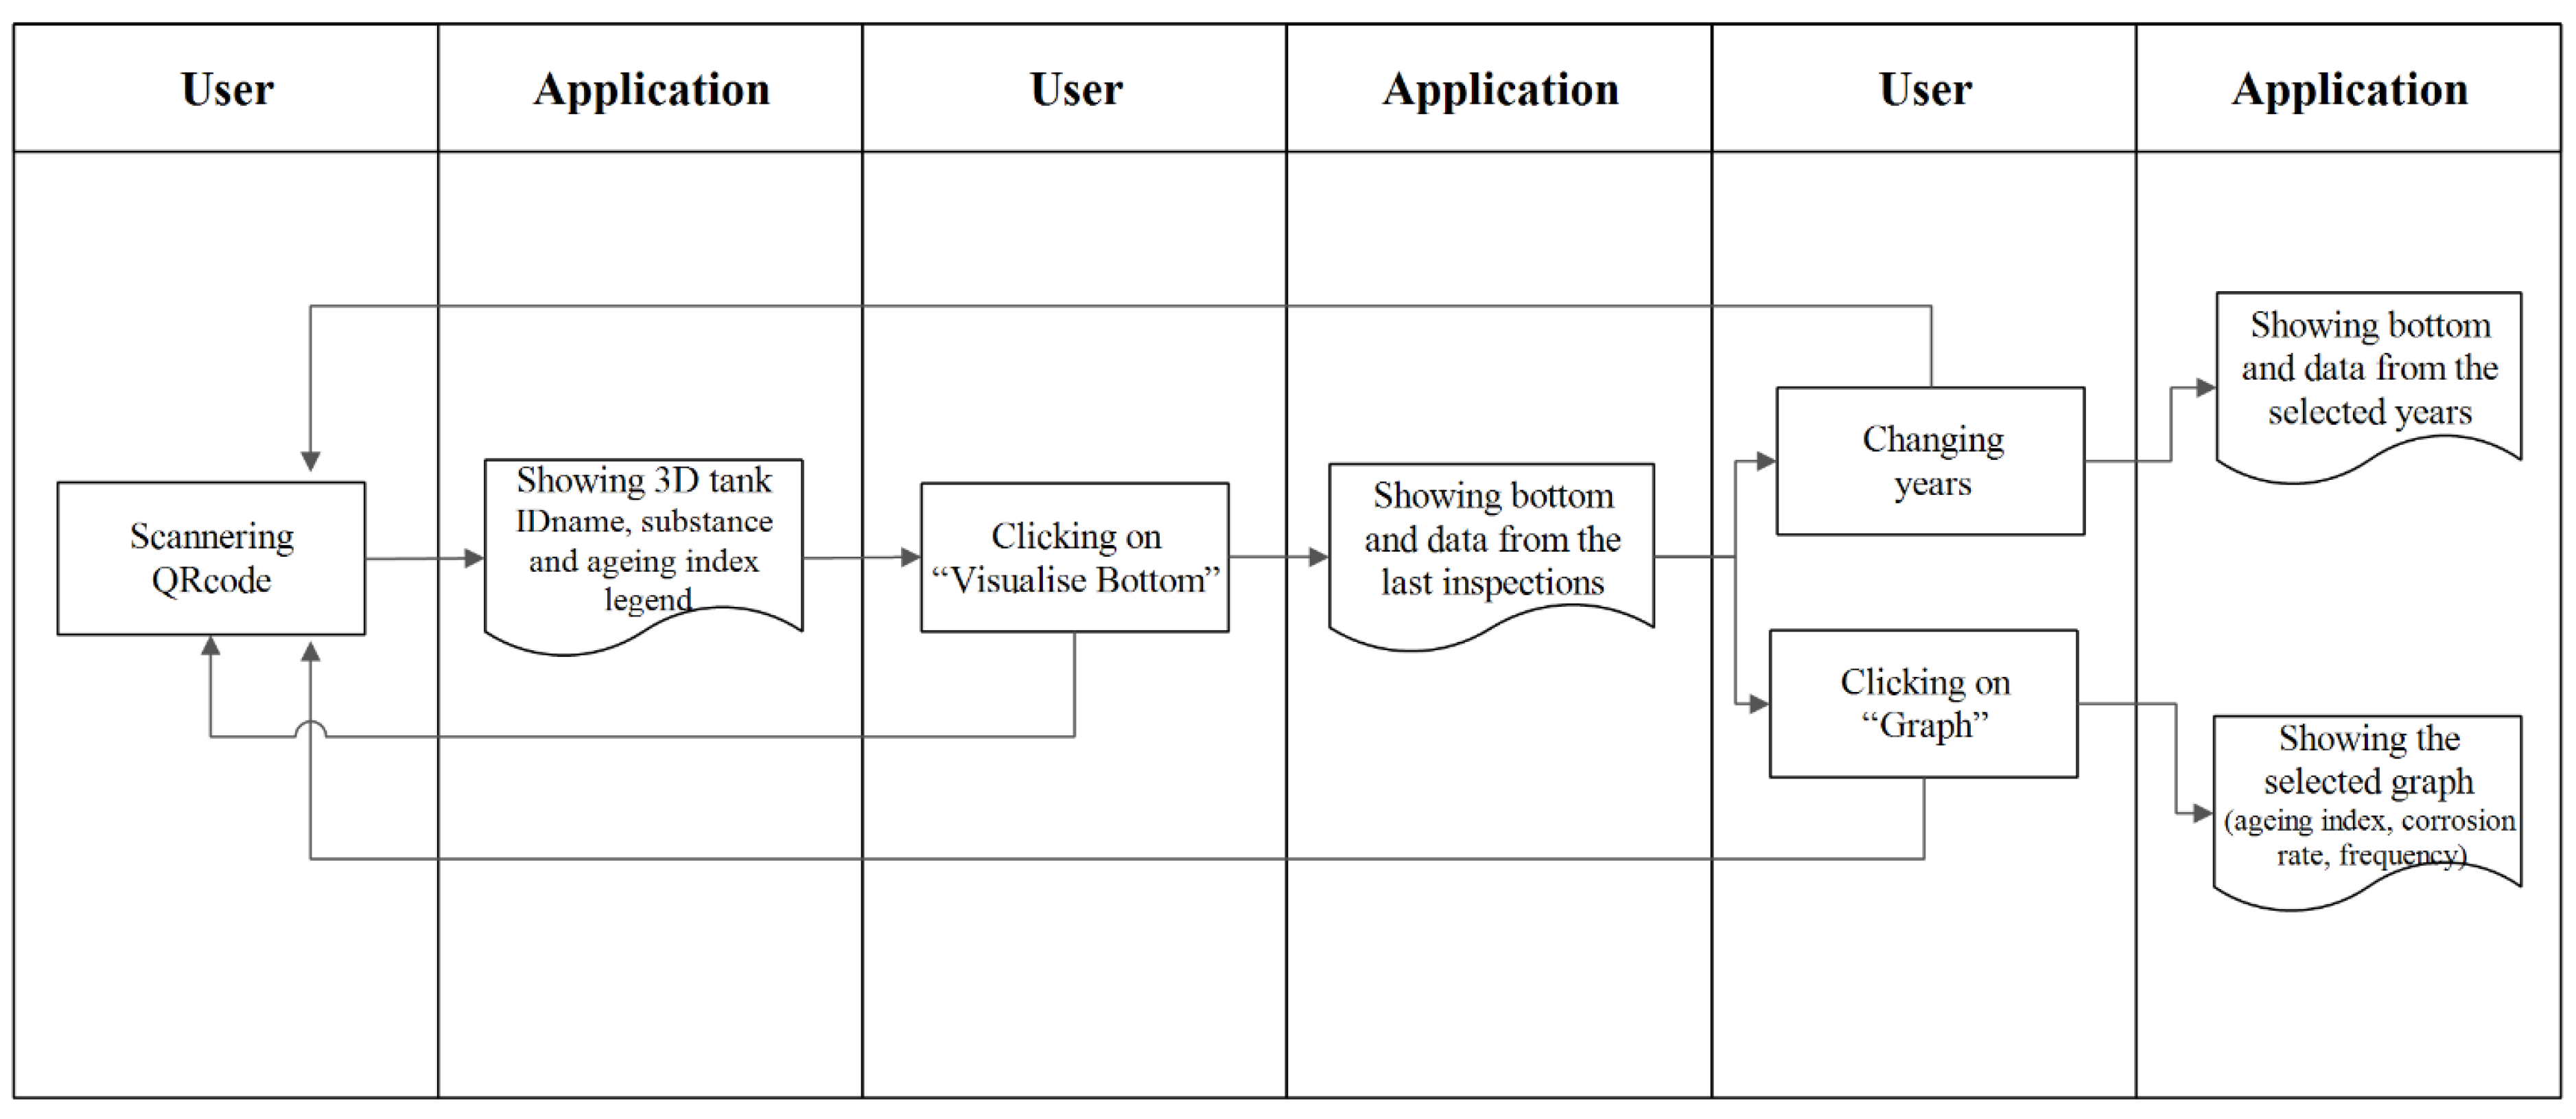
Figure 4 shows a general workflow of the interaction between the App Mobile and the user.
2.4. AR Visualisation Tool
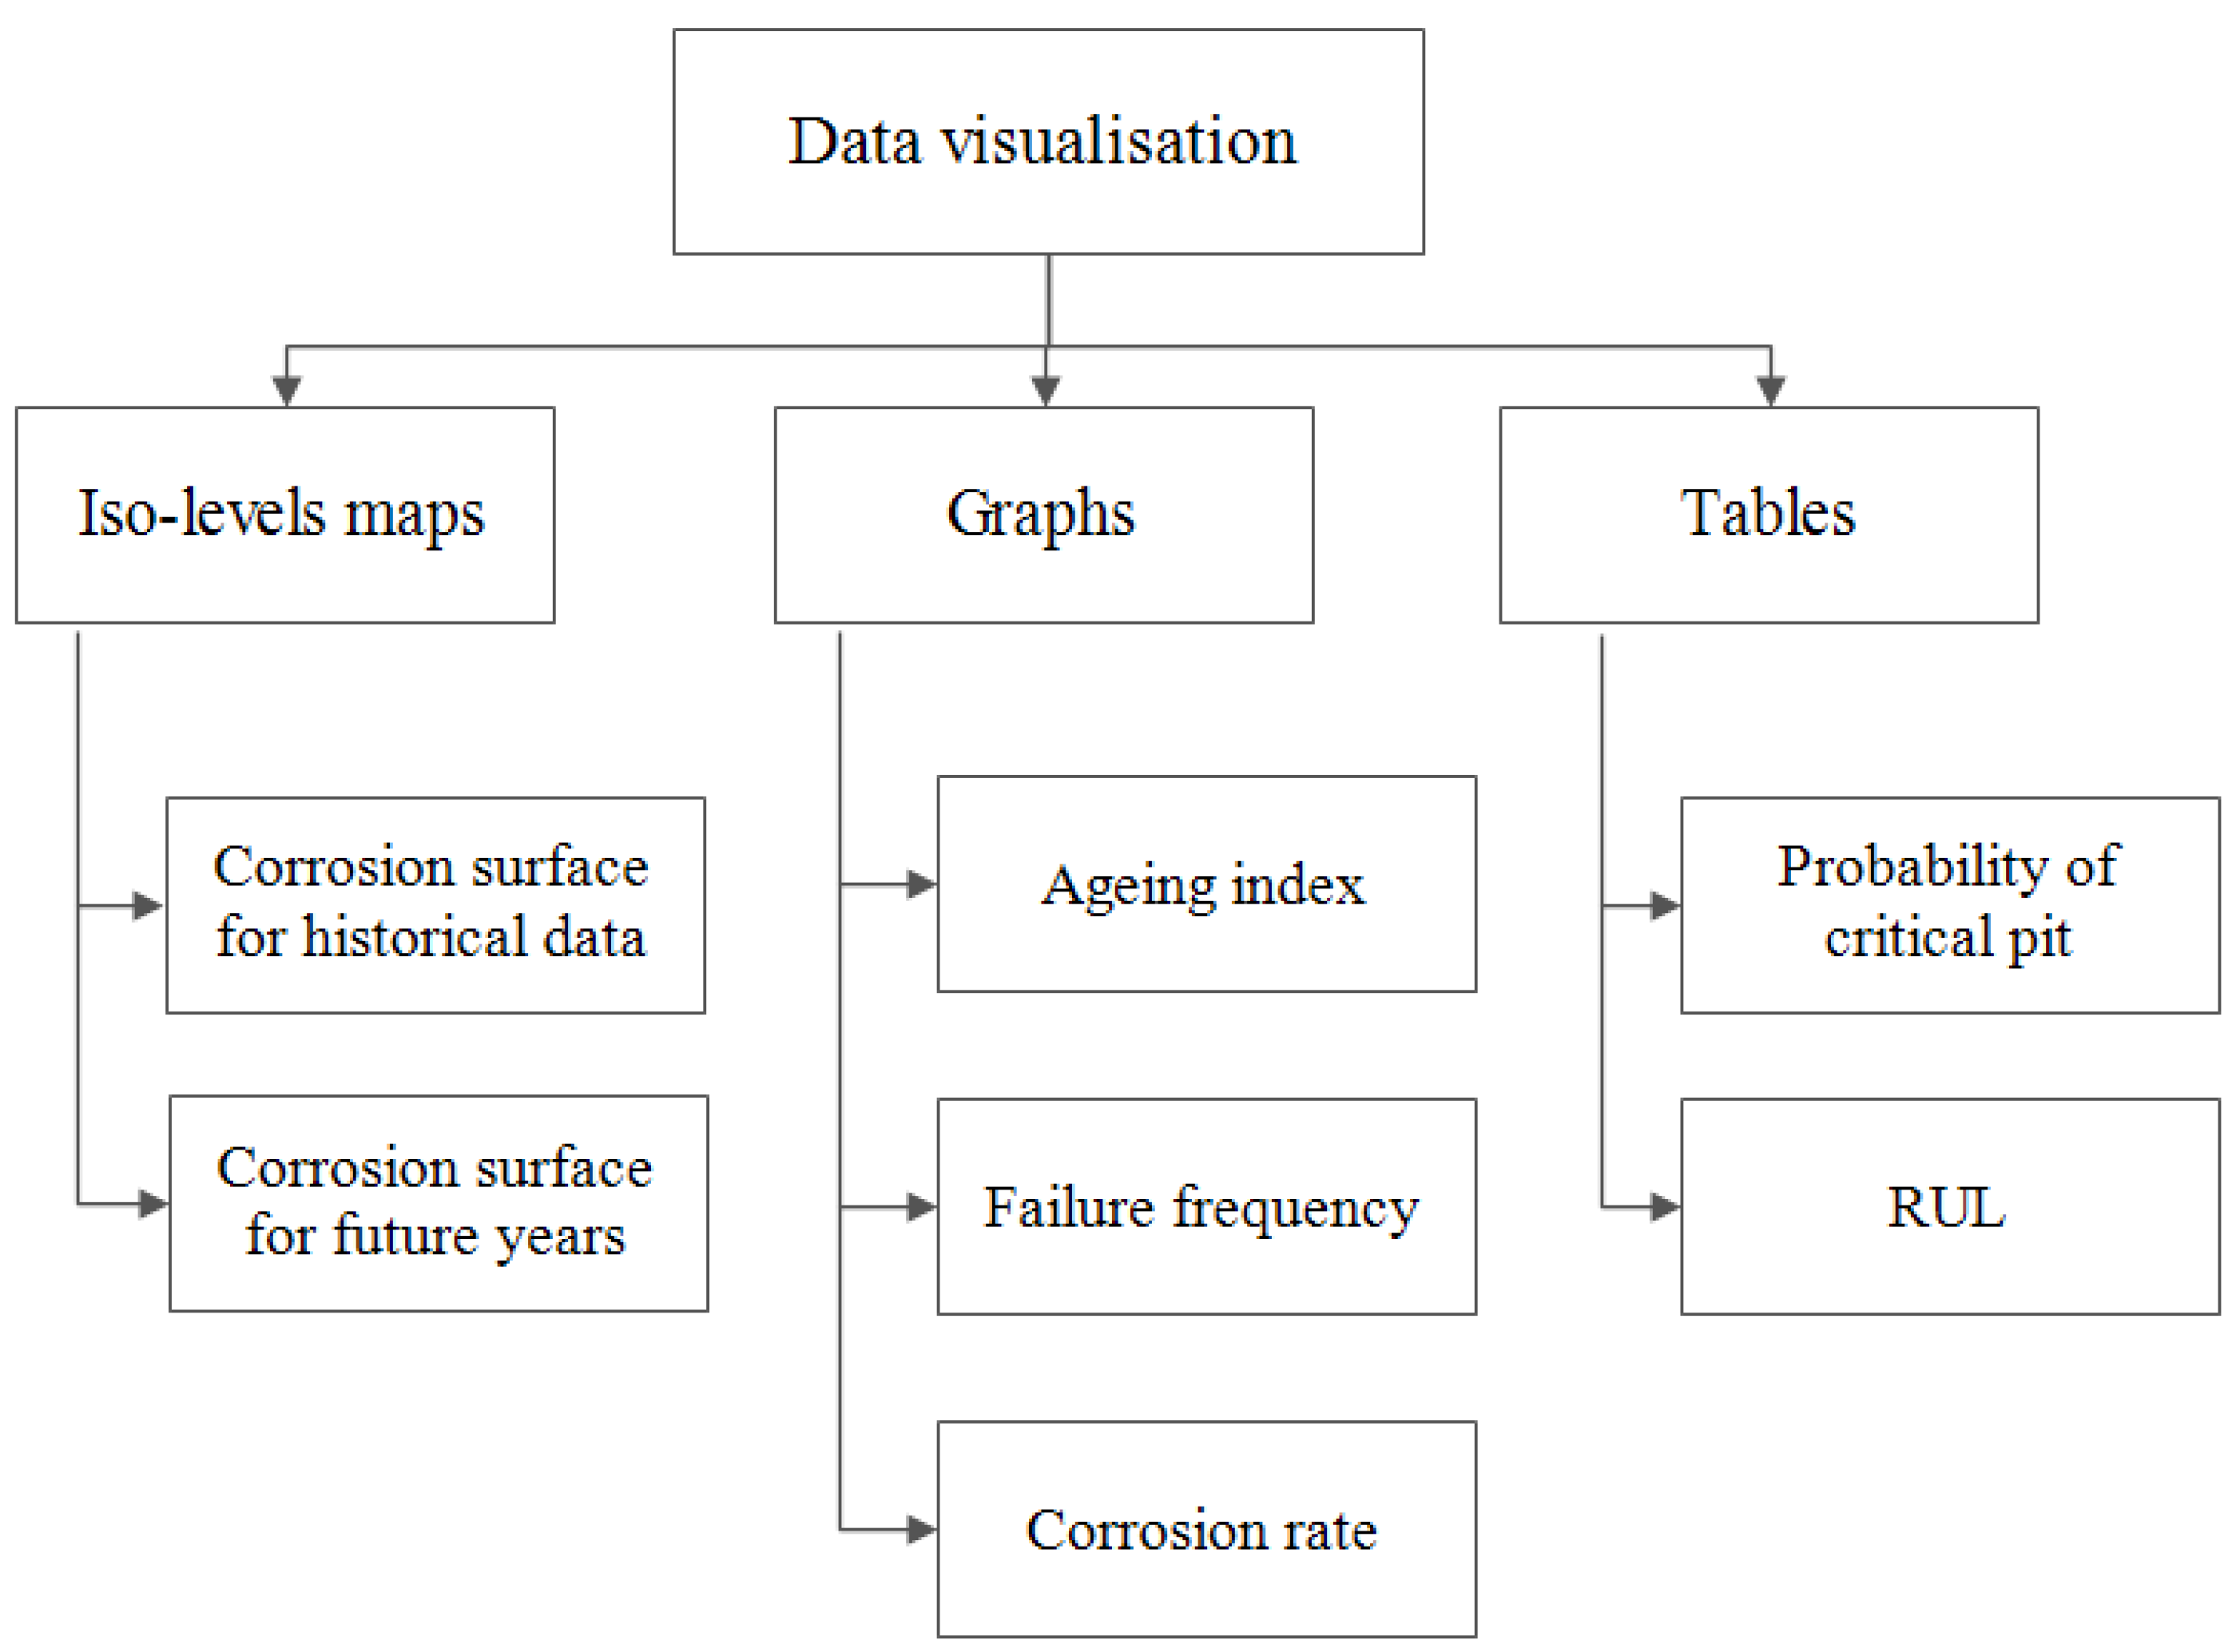
Figure 5 provides a scheme of the set of outputs produced by the desktop application and that can be seen in AR through the mobile device.
3. Case Study
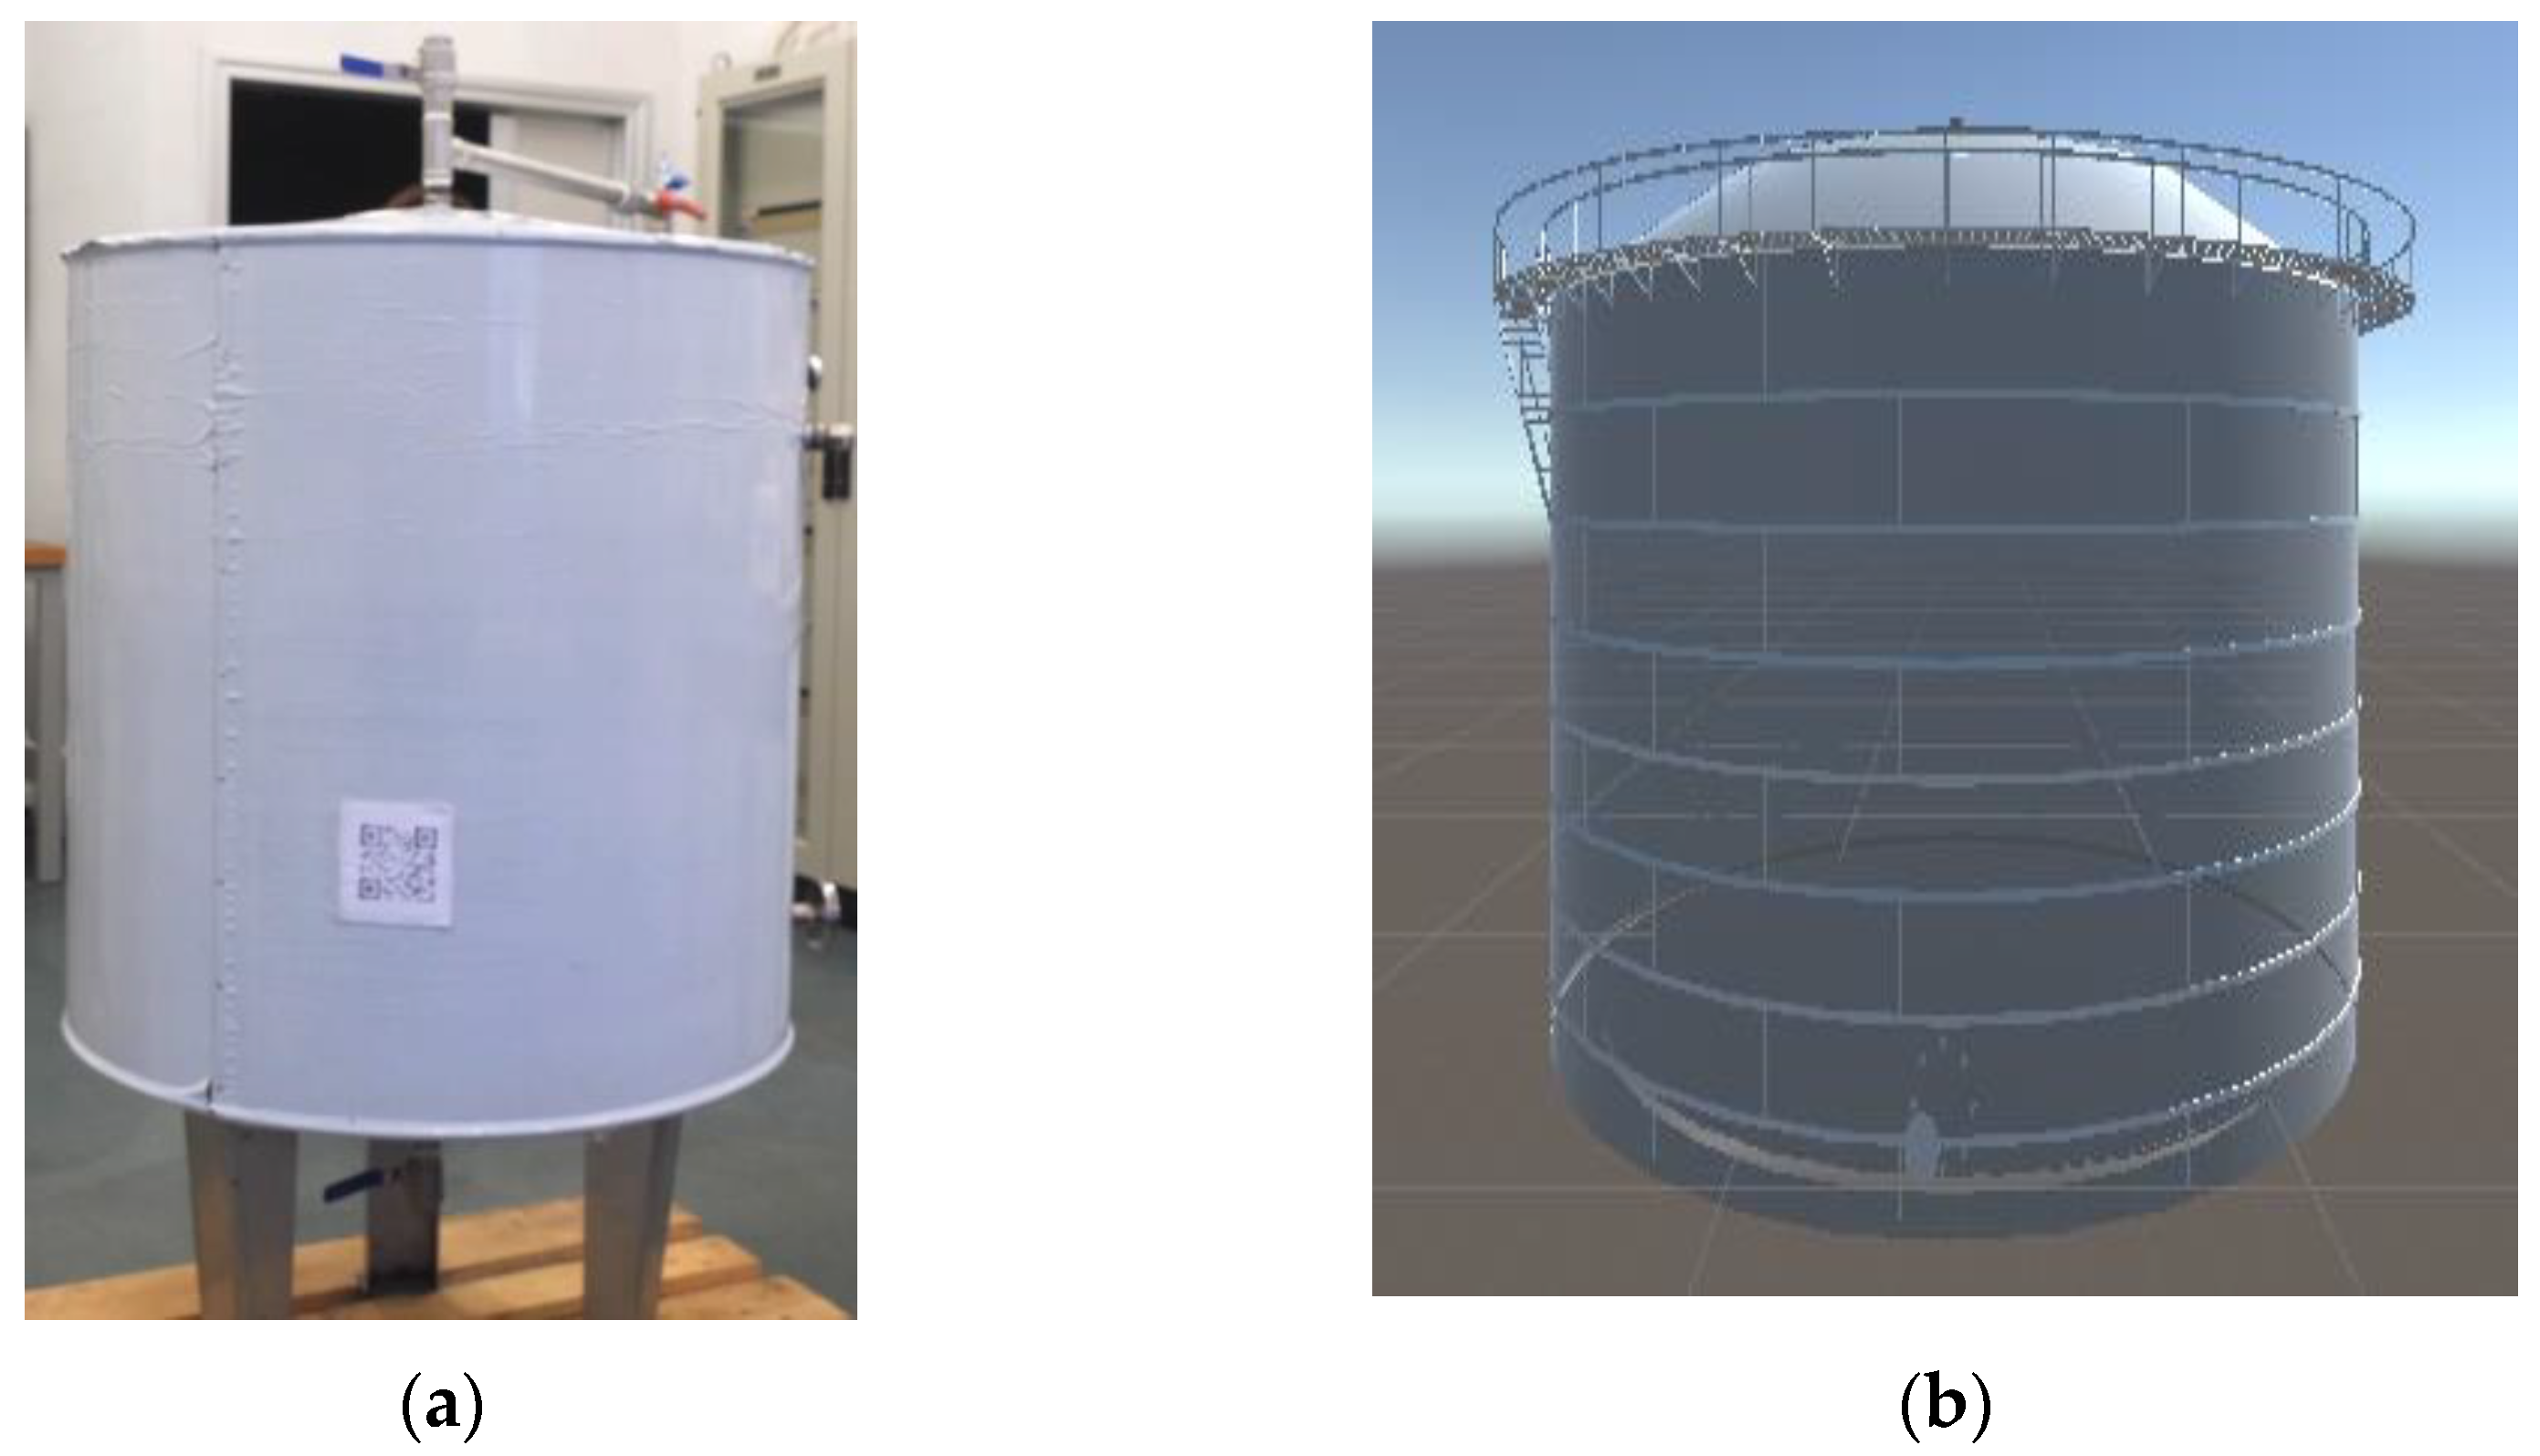
The case study was an atmospheric storage tank containing diesel oil, commissioned in 1965, which is currently still in service. It is made of carbon steel. The corrosive process is due to the potential presence of impurities (water and inorganic salts) that accidentally enter into the tank for various reasons; therefore, the deterioration does not depend on the type of hydrocarbon. The substance is a mixture of hydrocarbons (diesel oil) having nine carbon atoms, with density = 0.880 kg/L at 15 °C and initial boiling point = 168 °C. The diesel oil is stored in the tank at ambient temperature and pressure. A miniature model was reproduced in the laboratory at the Department of Engineering of the University of Messina (Italy), which was used for the simulation with the AR.
Figure 6 shows a picture of the tank and its 3D image. The diameter of the real tank is 48.6 m, and its nominal thickness is 8 mm. The bottom is composed of 203 plates. The dimensional ratio of the miniature (scaling) model was 1:50 compared to the real tank.
The measures of thickness on the real tank were performed using ultrasonic (first inspection) and magnetic flux leakage (second inspection) techniques. Both measurements were executed after a visual inspection. The use of the ultrasonic technique provided five thickness measures per plates, whereas the magnetic flux leakage gave almost 100% measurement coverage. The inspections were performed by the company during mandatory monitoring; the time interval between two inspections are usually 10 years according to popular standard [
25,
26], but the data available in this work (provided by the company) are not related to two consecutive evaluations. To obtain these statistics, the minimum thickness was collected for each plate, and the maximum, minimum and average values were calculated for the set of data.
Table 1 gives a summary of the statistical information about data collected during both inspections.
4. Results
A 3D model of the atmospheric storage tank was realised. Through the Virtual Sensor, the data of past inspections were acquired (i.e., three text files containing the factors for the ageing fishbone model, two sets of thickness data, and other general information). The App Desktop manages and elaborates these data and migrates the produced outputs to the App Mobile.
To demonstrate how the AR visualisation tool works, a safety walk was simulated in the laboratory of the Engineering Department of the University of Messina by using the miniature model of the storage tank. The App Mobile appears user-friendly through the support of Epson Moverio BT40 smartglasses for AR visualisation. When the application is being used, authorisation for the camera of the device is required (only for the first use); then, the QR code of the equipment is scanned. The tank is immediately identified, and the outputs about prognostic are uploaded and made available for their use. At this point, the 3D model tank is overlaid to the real one.
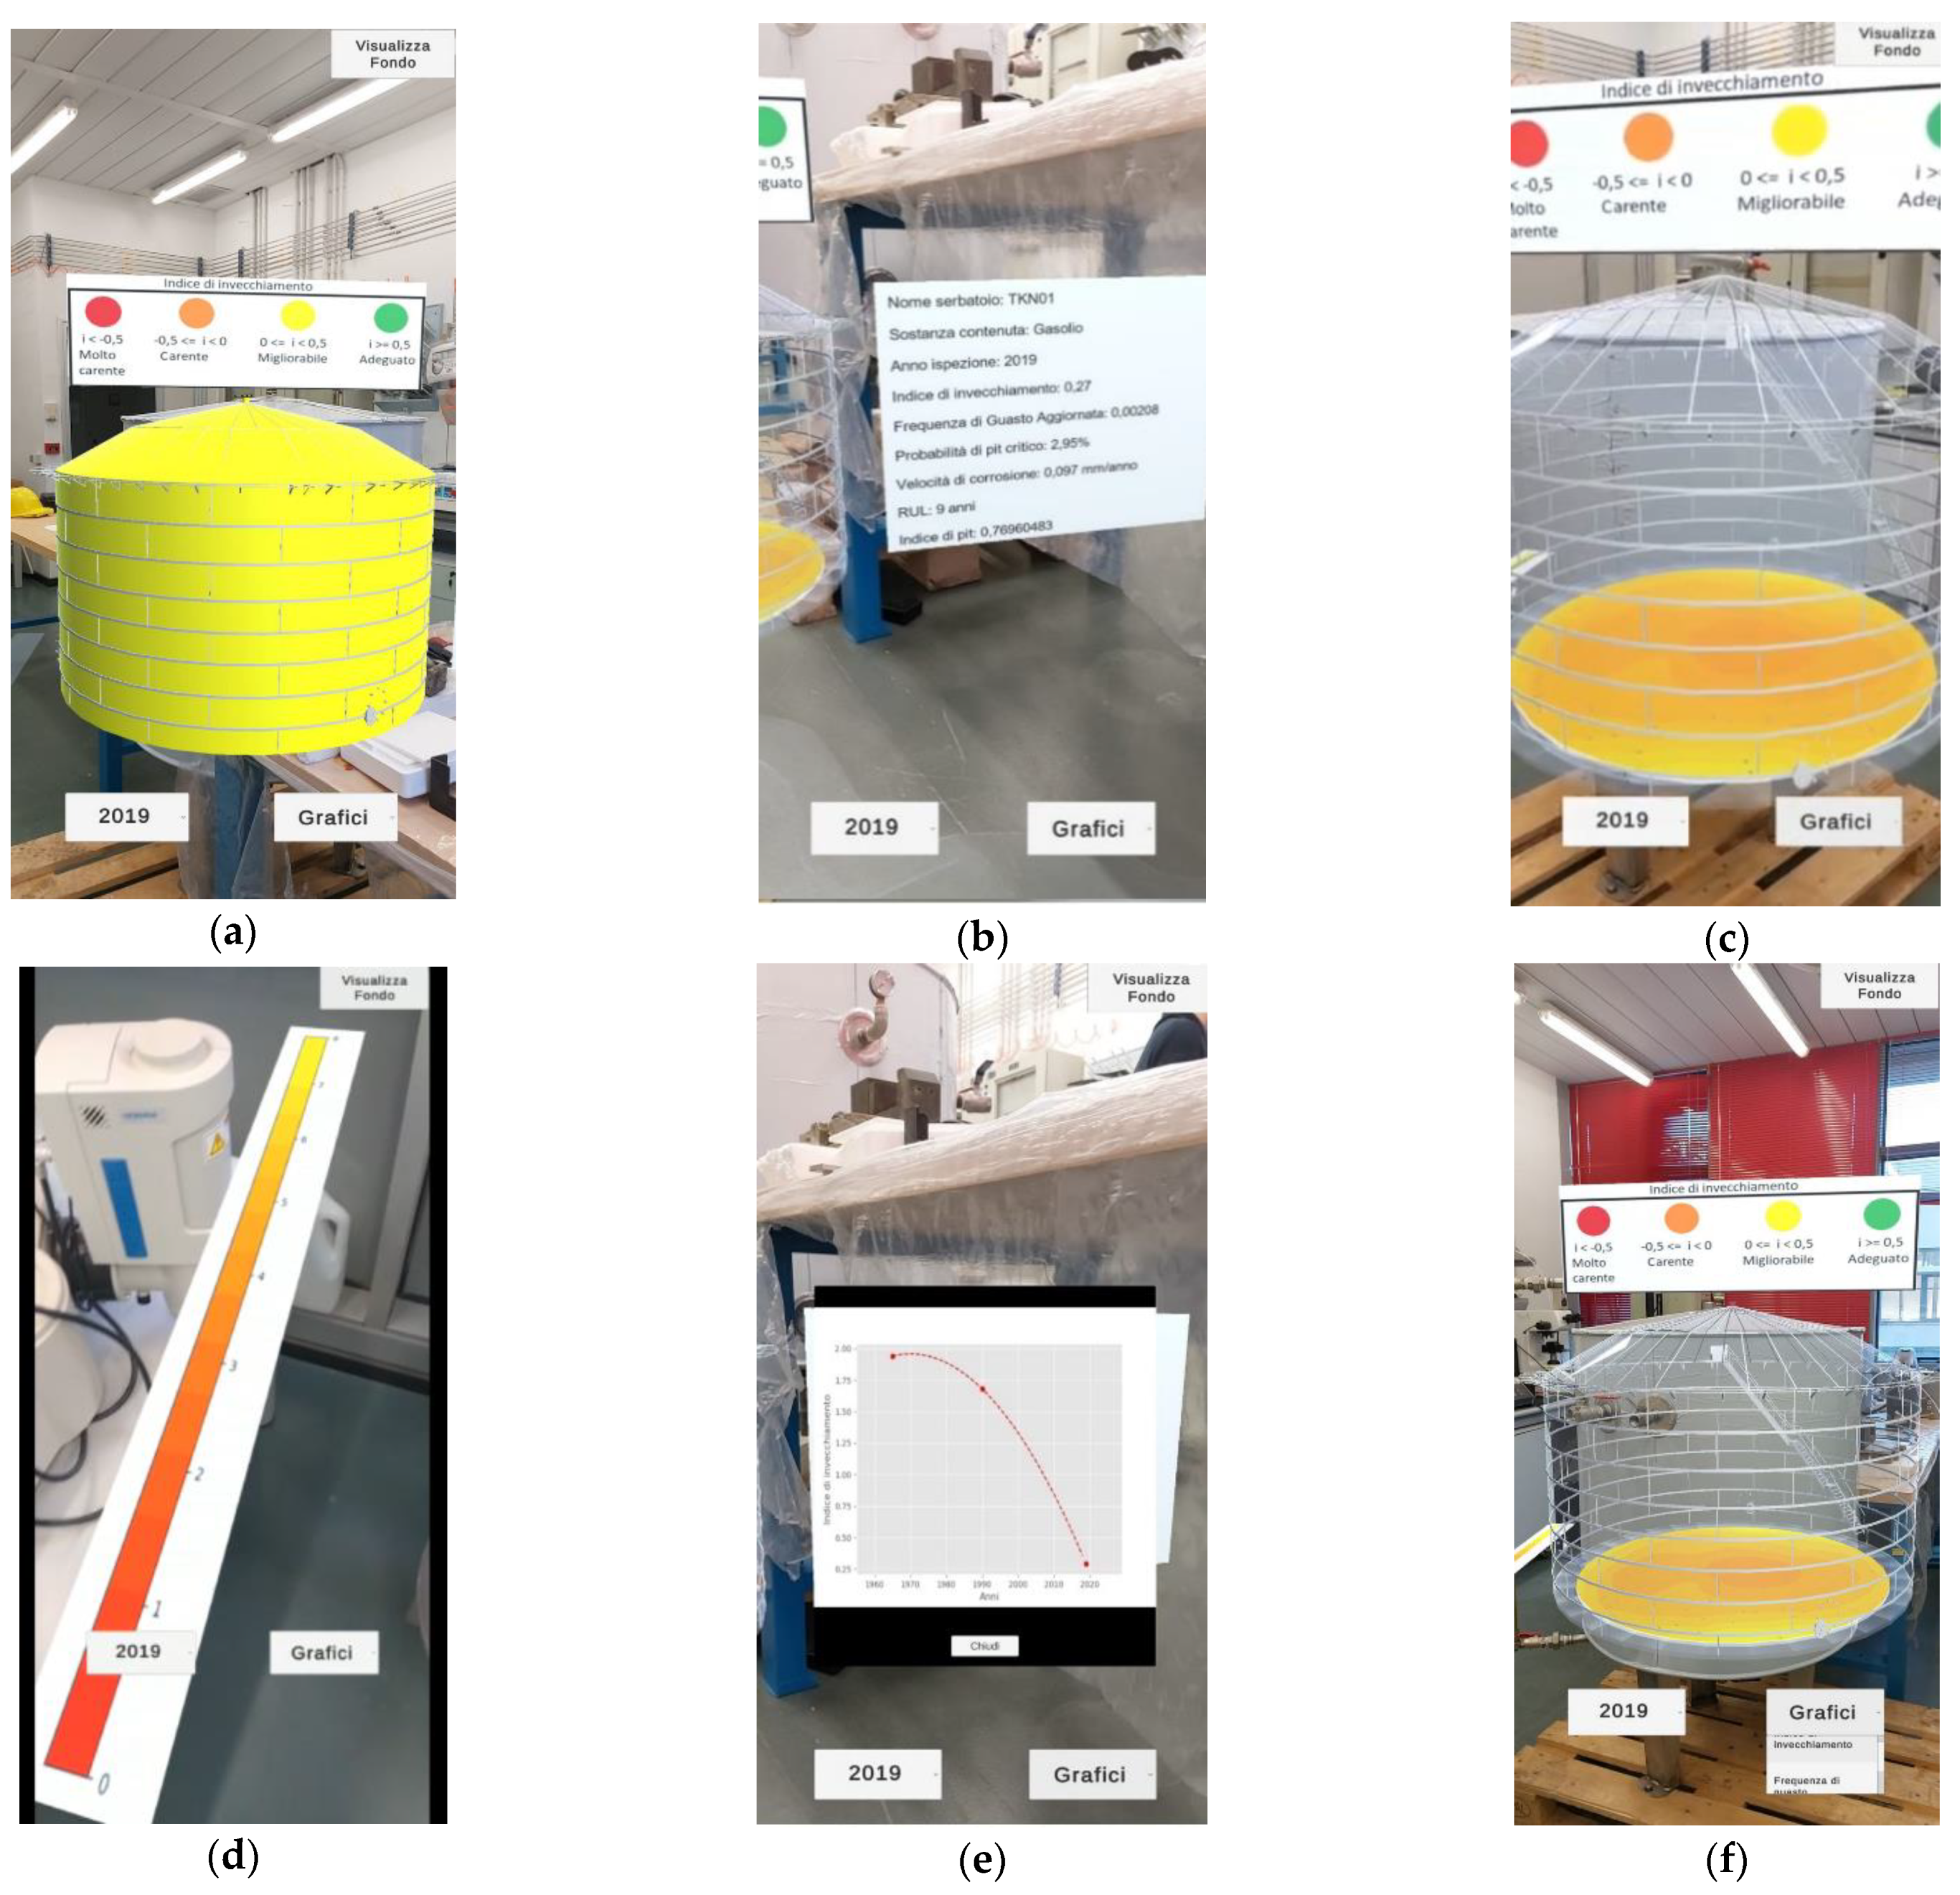
Initially, the virtual model obtains the colour of the corresponding current ageing index, associated with the last inspection (
Figure 7a), according to a given legend shown at the top of the screen. By moving the camera to the right, a table box overlapped with the scene can be observed showing the corrosion rate, the pit density, the
RUL, and the probability of the critical pit. In addition to the ageing index and the updated failure rate, other information such as the name of the tank and the stored substance is also given (
Figure 7b). By clicking on the button “Visualizza Fondo (i.e., Bottom Visualisation)” in the upper right corner of the view, it is possible to make the 3D model transparent, except for its bottom, whereby an iso-level map of thickness is displayed (
Figure 7c). Again, a colour legend is given on the left of device (
Figure 7d).
At the bottom of all images in
Figure 7, two buttons can be seen; the left one shows the years for which information in AR is visualised (in this case, the reference year for the last inspection was 2019), whereas the right button “Grafici (i.e., Graphs)” allows visualising the trend of the parameters over the time. Both buttons represent a pop-up menu having multiple options listed below.
Figure 7e shows the visualisation of a graph, whereas
Figure 7f was captured while scrolling through the pop graph menu.
From the pop-up menu button on the left, a list of the years for which the maps of thickness is available (in this case the year 1990, the year 2019, and the future years (+1 year, +2 years, +5 years, +10 years)). The pop-up menu on the right lists the graphs of the ageing index, the failure frequency, and the corrosion rate.
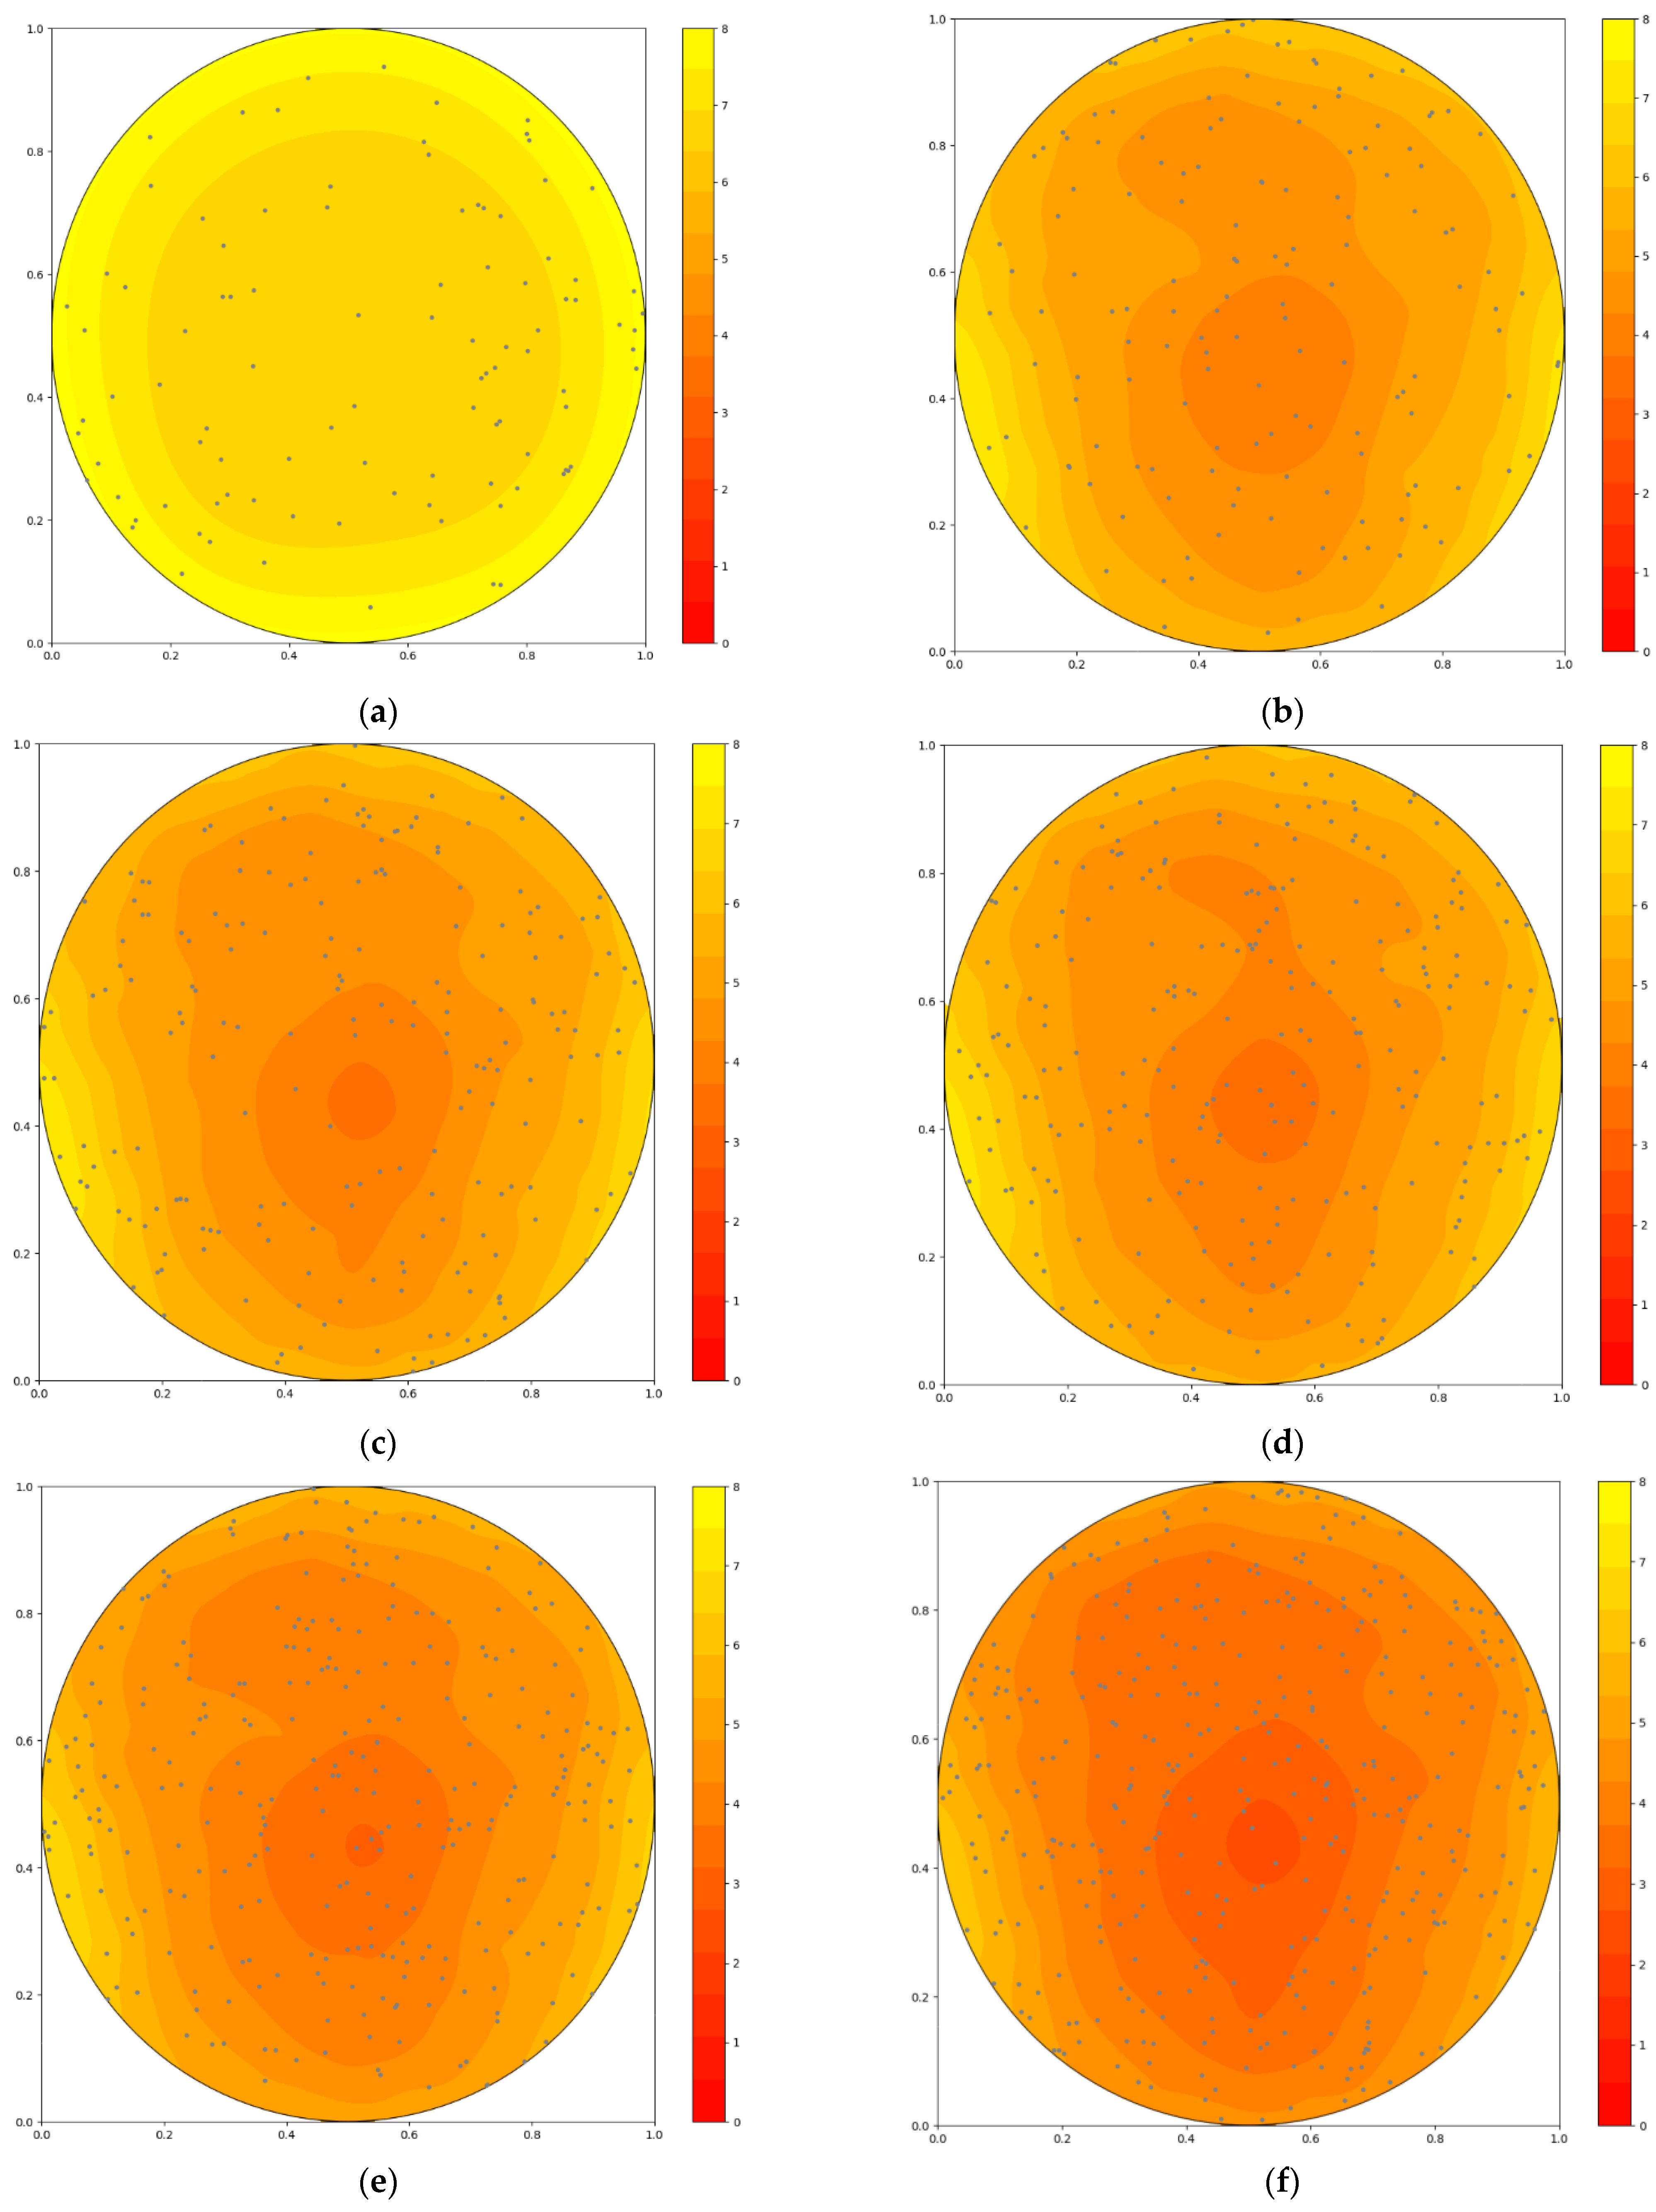
Figure 8 gives the iso-curves for the bottom corrosion; a certain number of points appears, which increases over time. This means that, once the corrosive phenomenon proceeds, the number of pits increases. The number is correlated to the value of the scale parameter of the Gumbel distribution. Indeed, the
α parameter gives a measure of the width of the curve, i.e., the number of pits. The correlation between the number of points (index correlated to the pit density) and the scale parameter was created whereby an increase of 50 points indicates a rise of
α equal to 0.1. Given that it is not possible to know where the next pits appear, the distribution of these points was randomly drawn over the whole bottom tank. The increase in their number represents the growth of the pit density. From
Figure 8, the following can be observed:
Figure 8a shows a good condition of the bottom tank, which was aggravated at the time of the second inspection (after 29 years); the forecasts indicate an increase in thickness reduction rate, which would also cause a decrease in the lifetime of the equipment.
5. Discussion
As shown in the previous section, the results of the demonstration using the Virtual Sensor prove that the AR is already consolidated [
27,
28,
29,
30,
31] and certainly offers many opportunities in the field of safety of major hazard industries. In this case, the inspector/operator can more effectively perform their tasks. During the inspections, the user can visualise a large amount of information about equipment health. The actual equipment integrity can be easily assessed by exploiting additional data that could come from online sensors and prognostic models, and it gives a real picture about the inside conditions and any other hidden locations. The fast development of innovative technology in this field also enables the further implementation of the system.
The advantage of the visualisation given in
Figure 7 is that the inspector gains time, as the conditions of the equipment can be quickly captured by merging different types of information, which are elaborated for this purpose. The ageing index provides information about the management of the corrosion phenomena that indicate the equipment deterioration. The frequency of the release and the corrosion rate are useful measures of the actual progress of the damage mechanism and, on the basis of the current inspection, it possible to understand the expected trend after a certain time interval. Lastly, the visualisation of the corrosion maps (
Figure 8) avoids the entrance of the inspection inside the tank and allows gaining time and saving resources due to periodical shutdowns. The residual useful lifetime supports planning the next inspection and, if possible, extending the time interval between inspections.
Currently, the inspector/operator can take advantage from the use of the AR by wearing smartglasses; therefore, the user can observe the thinning of the bottom plates of the tank by simply moving their head and observing the iso-corrosion level map with respect to a specific past inspection or to a future trend expected a given time.
6. Conclusions
The Virtual Sensor, developed in this paper, allows the inspector (or the establishment operator) to access information that is not usually available during the inspection; accordingly, they can keep in mind any critical issues inherent the equipment to be monitored from the ageing point of view. It is possible to store and manage data for all the equipment included in the logic unit or the entire establishment.
The system also benefits from the support of AR and gives the inspector/operator the conditions of parts of the equipment that cannot be captured during a visual inspection, which are hidden during operation. At the same time, the inspector can check the progress of the corrosion by means of the estimation of some metrics and through the iso-level corrosion maps at certain times, beyond the prognostics based on implemented advanced models for the forecasting of deterioration mechanism.
Future developments of the system relate to the exploitation of additional data that could come from online sensors and prognostic models, giving a real picture of the inside conditions and any other hidden locations.
Author Contributions
Conceptualisation, G.A., R.S., G.F., P.B. and M.F.M.; methodology, G.A., R.S. and M.F.M.; software, R.S.; validation, M.F.M., G.F. and P.B.; formal analysis, G.A. and R.S.; investigation, G.A. and R.S.; resources, M.F.M.; data curation, G.A. and R.S.; writing—original draft preparation, G.A.; writing—review and editing, M.F.M.; visualisation, R.S. and G.A.; supervision, G.F., P.B. and M.F.M.; project administration, M.F.M.; funding acquisition, M.F.M. All authors have read and agreed to the published version of the manuscript.
Funding
This work was funded by INAIL within the BRIC/2018 ID = 11 project MAC4PRO.
Institutional Review Board Statement
Not applicable.
Informed Consent Statement
Not applicable.
Data Availability Statement
Not applicable.
Conflicts of Interest
The authors declare no conflict of interest.
References
- Oztemel, E.; Gursev, S. Literature Review of Industry 4.0 and Related Technologies. J. Intell. Manuf. 2020, 31, 127–182. [Google Scholar] [CrossRef]
- Stock, T.; Seliger, G. Opportunities of Sustainable Manufacturing in Industry 4.0. In Procedia CIRP, Proceedings of the 13th Global Conference on Sustainable Manufacturing—Decoupling Growth from Resource Use, Binh Duong, Vietnam, 16–18 September 2016; Seliger, G., Malon, J., Kohl, H., Eds.; Elsevier, B.V.: Amsterdam, The Netherlands, 2016; Volume 40, pp. 536–541. [Google Scholar]
- De Sousa Jabbour, A.B.L.; Jabbour, C.J.C.; Foropon, C.; Filho, M.G. When Titans Meet Can Industry 4.0 Revolutionise the Environmentally-Sustainable Manufacturing Wave? The Role of Critical Success Factors. Technol. Forecast. Soc. Change 2018, 132, 18–25. [Google Scholar] [CrossRef]
- Gajek, A.; Fabiano, B.; Laurent, A.; Jensen, N. Process safety education of future employee 4.0 in Industry 4.0. J. Loss Prevent. Proc. 2022, 75, 104691. [Google Scholar] [CrossRef]
- Sharma, R.; Jabbour, C.J.C.; Lopes de Sousa Jabbour, A.B. Sustainable Manufacturing and Industry 4.0: What We Know and What We Don’t. J. Enterp. Inf. Manag. 2020, 34, 230–266. [Google Scholar] [CrossRef]
- EU Council. Directive 2012/18/EU on the control of major-accident hazards involving dangerous substances. Off. J. European Union 2012, L197, 1–37. [Google Scholar]
- Horrocks, P.; Mansfield, D.; Thomson, J.; Parkerv, K.; Winter, P. Plant Ageing Study Phase 1 Report. In Health and Safety Executive Report No. RR823. 2010. Available online: https://www.hse.gov.uk/research/rrhtm/rr823.htm (accessed on 20 January 2022).
- Wintle, J.; Moore, P.; Henry, N.; Smalley, S.; Amphlett, G. Plant Ageing. Management of Equipment Containing Hazardous Fluids or Pressure. In Health and Safety Executive Report No. RR509. 2006. Available online: https://www.hse.gov.uk/research/rrhtm/rr509.htm (accessed on 20 January 2022).
- Milazzo, M.F.; Bragatto, P. A framework addressing a safe ageing management in complex industrial sites: The Italian experience in «Seveso» establishments. J. Loss Prevent. Proc. 2019, 58, 70–81. [Google Scholar] [CrossRef]
- Milazzo, M.F.; Bragatto, P.A.; Scionti, G.; Gnoni, M.G. A safety-walk for ageing control at major-hazard establishments. Chem. Engineer. Trans. 2019, 77, 949–954. [Google Scholar]
- Papazoglou, I.A.; Aneziris, O. On the quantification of the effects of organizational and management factors in chemical. Reliab. Eng. Syst. Safe. 1999, 15, 545–554. [Google Scholar] [CrossRef]
- Milazzo, M.F.; Maschio, G.; Uguccioni, G. The Influence of Risk Prevention Measures on the Frequency of Failure of Piping. Int. J. Perform. Engineer. 2010, 6, 19–33. [Google Scholar]
- Gumbel, E.J. Statistical Theory of Extreme Values and Some Practical Applications. US Department of Commerce, National Bureau of Standards. Appl. Math. Ser. 1954, 33, 1–51. [Google Scholar]
- Shibata, T. Corrosion probability and statistical evaluation of corrosion data. In Uhlig’s Corrosion Handbook, 2nd ed.; Winston Revie, R., Ed.; John Wiley & Sons Inc.: New York, NY, USA, 2000; pp. 367–392. ISBN 0-471-15777-5. [Google Scholar]
- Milazzo, M.F.; Ancione, G.; Bragatto, P.; Proverbio, E. A probabilistic approach for the estimation of the Residual Useful Lifetime of atmospheric storage tanks in oil industry. J. Loss Prevent. Proc. 2022, 77, 104781. [Google Scholar] [CrossRef]
- Bailey, T.C.; Gatrell, A.C. Interactive Spatial Data Analysis; Longman Scientific & Technical: Essex, UK, 1995; p. 413. [Google Scholar]
- Hengl, T.; Heuvelink, G.; Stein, A. A generic framework for spatial prediction of soil variables based on regression-kriging. Geoderma 2004, 120, 75–93. [Google Scholar] [CrossRef] [Green Version]
- Python Software Foundation, Copyright ©2001–2022. Available online: https://www.python.org/ (accessed on 20 January 2022).
- Hunter, J.D. Matplotlib: A 2D Graphics Environment. Comput Sci Eng 2007, 9, 90–95. [Google Scholar] [CrossRef]
- Harris, C.M. Array programming with NumPy. Nature 2020, 585, 357–362. [Google Scholar] [CrossRef] [PubMed]
- McKinney, W. Data structures for statistical computing in python. In Proceedings of the 9th Python in Science Conference, Austin, TX, USA, 28 June–3 July 2010; Volume 445, pp. 9951–9956. [Google Scholar]
- Murphy, B.; Müller, S.; Yurchak, R. GeoStat-Framework/PyKrige: v1.6.1. Eur. Organ. Nucl. Res. CERN 2021. [Google Scholar] [CrossRef]
- Haas, J.K. A History of the Unity Game Engine; Worcester Polytechnic Institute: Worcester, MA, USA, 2014. [Google Scholar]
- Community, B.O. Blender—A 3D Modelling and Rendering Package, Stichting Blender Foundation, Amsterdam. 2018. Available online: http://www.blender.org (accessed on 1 February 2022).
- American Petroleum Institute (API). RP 580, Risk-Based Inspection. In API Recommended Practice, 3rd ed.; American Petroleum Institute: New York, NY, USA, 2016. [Google Scholar]
- The Engineering Equipment and Materials Users Association (EEMUA). Users’ Guide to the Inspection, Maintenance and Repair of above Ground Vertical Cylindrical Steel Storage Tanks. In Standard EEMUA No. 159, 4th ed.; The Engineering Equipment and Materials Users Association: London, UK, 2014. [Google Scholar]
- Liu, X.; Sohn, Y.; Park, D. Application development with augmented reality technique using Unity 3D and Vuforia. Int. J. Appl. Eng. Res. 2018, 13, 15068–15071. [Google Scholar]
- Linowes, J.; Babilinski, K. Augmented Reality for Developers: Build Practical Augmented Reality Applications with Unity, ARCore, ARKit, and Vuforia; Packt Publishing Ltd.: Birmingham, UK, 2017. [Google Scholar]
- Harborth, D.; Kümpers, K. Intelligence augmentation: Rethinking the future of work by leveraging human performance and abilities. Virtual Real. 2021, 1–22. [Google Scholar] [CrossRef]
- Carruth, D.W. Virtual reality for education and workforce training. In Proceedings of the 15th International Conference on Emerging eLearning Technologies and Applications (ICETA), Starý Smokovec, Slovakia, 26–27 October 2017; pp. 1–6. [Google Scholar] [CrossRef]
- Guo, Y.; Agrawal, S.; Peeta, S.; Benedyk, I. Safety and health perceptions of location-based augmented reality gaming app and their implications. Accid. Anal. Prev. 2021, 161, 106354. [Google Scholar] [CrossRef] [PubMed]
| Publisher’s Note: MDPI stays neutral with regard to jurisdictional claims in published maps and institutional affiliations. |
© 2022 by the authors. Licensee MDPI, Basel, Switzerland. This article is an open access article distributed under the terms and conditions of the Creative Commons Attribution (CC BY) license (https://creativecommons.org/licenses/by/4.0/).


 ,
, 


