Article

Sensor Data Fusion as an Alternative for Monitoring Chlorate in Electrochlorination Applications

1
Wetsus, European Centre of Excellence for Sustainable Water Technology, Oostergoweg 9, 8911 MA Leeuwarden, The Netherlands
2
Mathematical and Statistical Methods-Biometris, Wageningen University and Research, 6700 AA Wageningen, The Netherlands
3
EasyMeasure B.V., Breestraat 22, 3811 BJ Amersfoort, The Netherlands
4
Grundfos Holding A/S, Poul Due Jensens Vej 7, 8850 Bjerringbro, Denmark
*
Author to whom correspondence should be addressed.
Sustainability 2022, 14(10), 6119; https://doi.org/10.3390/su14106119
Submission received: 19 April 2022 / Revised: 12 May 2022 / Accepted: 13 May 2022 / Published: 18 May 2022
(This article belongs to the Special Issue Intelligent Sensing for Sustainable Production Industries)

Abstract

:
As chlorate concentrations have been found to be harmful to human and animal health, governments are increasingly demanding strict control of the chlorate concentration in drinking water. Since there are no chlorate sensors available, the current solution is sampling and laboratory analysis. This is costly and time consuming. The aim of this work was to investigate Sensor Data Fusion (SDF) as an alternative approach, with a focus on chlorate formation in the electrochlorination process, and design an observer for the real-time estimation of chlorate. The pH, temperature and UV-a absorption were measured in real time. A reduced-order nonlinear model was derived, and it was found to be detectable. An Extended Kalman Filter (EKF), based on this model, was then used to estimate the chlorate formation. The EKF algorithm was verified experimentally and was found to be capable of accurately estimating chlorate concentrations in real time. Electrochlorination is an emerging and efficient method of disinfecting drinking water. Soft sensing of chlorate concentrations, as proposed in this paper, may help to better control and manage the process of electrochlorination.

1. Introduction

Electrochlorination is a widely used means of disinfecting water, including water that is used for drinking. In this process, a brine is electrolyzed to form hypochlorite and hypochlorous acid, which is then dosed to the water stream that is to be disinfected [1,2,3]. A critical aspect of this process is that only sodium chloride, water and electricity are needed. This is a significant improvement in safety over traditional chlorine-based disinfection methods, which involves the transportation and storage of liquid chlorine canisters or drums containing a concentrated free chlorine solution [4,5,6,7].
In recent years, some of the by-products that stem from chlorine-based disinfection production processes, specifically heavier oxychloride ions such as chlorate and perchlorate, have come under increased scrutiny after research has indicated that these pose a risk to human and animal health [5,8]. In animal-based studies, chlorite and chlorate affect erythrocytes, and chlorate and perchlorate affect the thyroid gland, potentially leading to thyroidal cancer. For humans, the effects on the thyroid gland have mainly led to concerns regarding developmental neurotoxicity [9,10]. In the environment, chlorate and perchlorate are known to affect aquatic ecology, even at low concentrations [11,12,13]. Unfortunately, these oxychloride ions are difficult to remove from water once formed, and they must therefore be monitored carefully [14,15].
The World Health Organization has been advocating stringent restrictions on permissible oxychloride ion levels for some time [8], and the European Union recently introduced regulations specifically restricting chlorite and chlorate levels [16]. In addition, the European Commission has adopted a recommendation to monitor perchlorate in drinking water and food [17].
As various governing bodies are implementing such regulations, it is important to know what is feasible in terms of monitoring frequency and accuracy [18]. This may impact the demanded standards for monitoring, and it demonstrates the various means of proving adherence to such demands to the industry.
There are three means of handling the more stringent regulations [18]. First, the electrochlorination product can be sampled regularly and sent to a laboratory for analysis. This has a high associated cost and relatively low sample frequency. In addition, the results are known only after some days, meaning that in situations with little or no product buffer capacity, it is impossible to swiftly respond to a high by-product concentration.
Second, a dedicated sensor could be implemented, which is able to provide readings in real time. For chlorate sensors, research has focused on developing selective electrodes for electrochemical measurement methods [19,20,21,22,23]. Early examples suffered from a narrow pH range and short working life time [20,24]. These aspects have been improved in recent years, and the complexity of production has been brought down, although the working lifetime is still limited in certain cases [19,20]. To the authors’ knowledge, these results have not been translated into a commercial product so far.
As alternative approach to real-time chlorate measurement through electrochemical techniques and sensor systems based on Raman radiation have been developed [25]. It is mainly developed for detecting explosive residue in the environment, although use for tap water has been noted as one of the possible applications of this technology.
For chlorite and perchlorate, commercially available sensors already exist [26,27], each based on electrochemical sensing techniques. Currently, especially perchlorate sensor technology is being further developed [28,29,30]. As with the development of chlorate sensor technology, the focus remains on electrochemical sensing techniques and with effort spent on developing techniques based on Raman radiation as well [31].
As a third option, a soft sensing approach can be taken [32]. In this case, a number of sensors are used in conjunction with a model of the production process to estimate the by-product formation or to increase the accuracy or robustness of such an estimate [18]. If the model combines multiple sensors, the technique is also called Sensor Data Fusion (SDF) [33,34]. In contrast to dedicated oxychloride ion sensors, little research has been done concerning this approach. The closest is the aforementioned research in Raman spectroscopy, as an algorithm is required to estimate the oxychloride ion concentrations from the readings.
A related but more developed application of SDF is the estimation of by-products stemming from the application of chloride-based disinfectants. Though in most works, samples still need to be analyzed to provide the necessary data [35,36,37], effort is done to progress toward a soft sensor based only on sensor probes that can provide data in real time [38]. Due to the complex nature of the problem, the SDF algorithms are based on advanced regression methods, such as neural networks or support vector machines [36].
The soft sensing approach is promising. It is expected that by incorporating knowledge of the process in which the by-product is formed, a more robust and cost-efficient sensor set may suffice to obtain a sufficiently accurate estimation of the by-product concentration [18]. A downside is that the initial implementation takes more effort and needs to be tailored to the production process.
The present work aims to provide a start to closing the research gap that exists regarding a lack of knowledge related to by-product monitoring through Sensor Data Fusion, specifically for the monitoring of chlorate concentrations formed in the electrochlorination process. If successful, it can provide a solution to the chlorate monitoring need that is more robust and cost-effective than the solutions that are provided thus far. The relevant processes will be identified, and a state-space model will be presented based on these processes. The model will be analyzed for its observability, and to fuse the sensor data, an observer algorithm will be applied. The resulting SDF algorithm will then be verified experimentally.

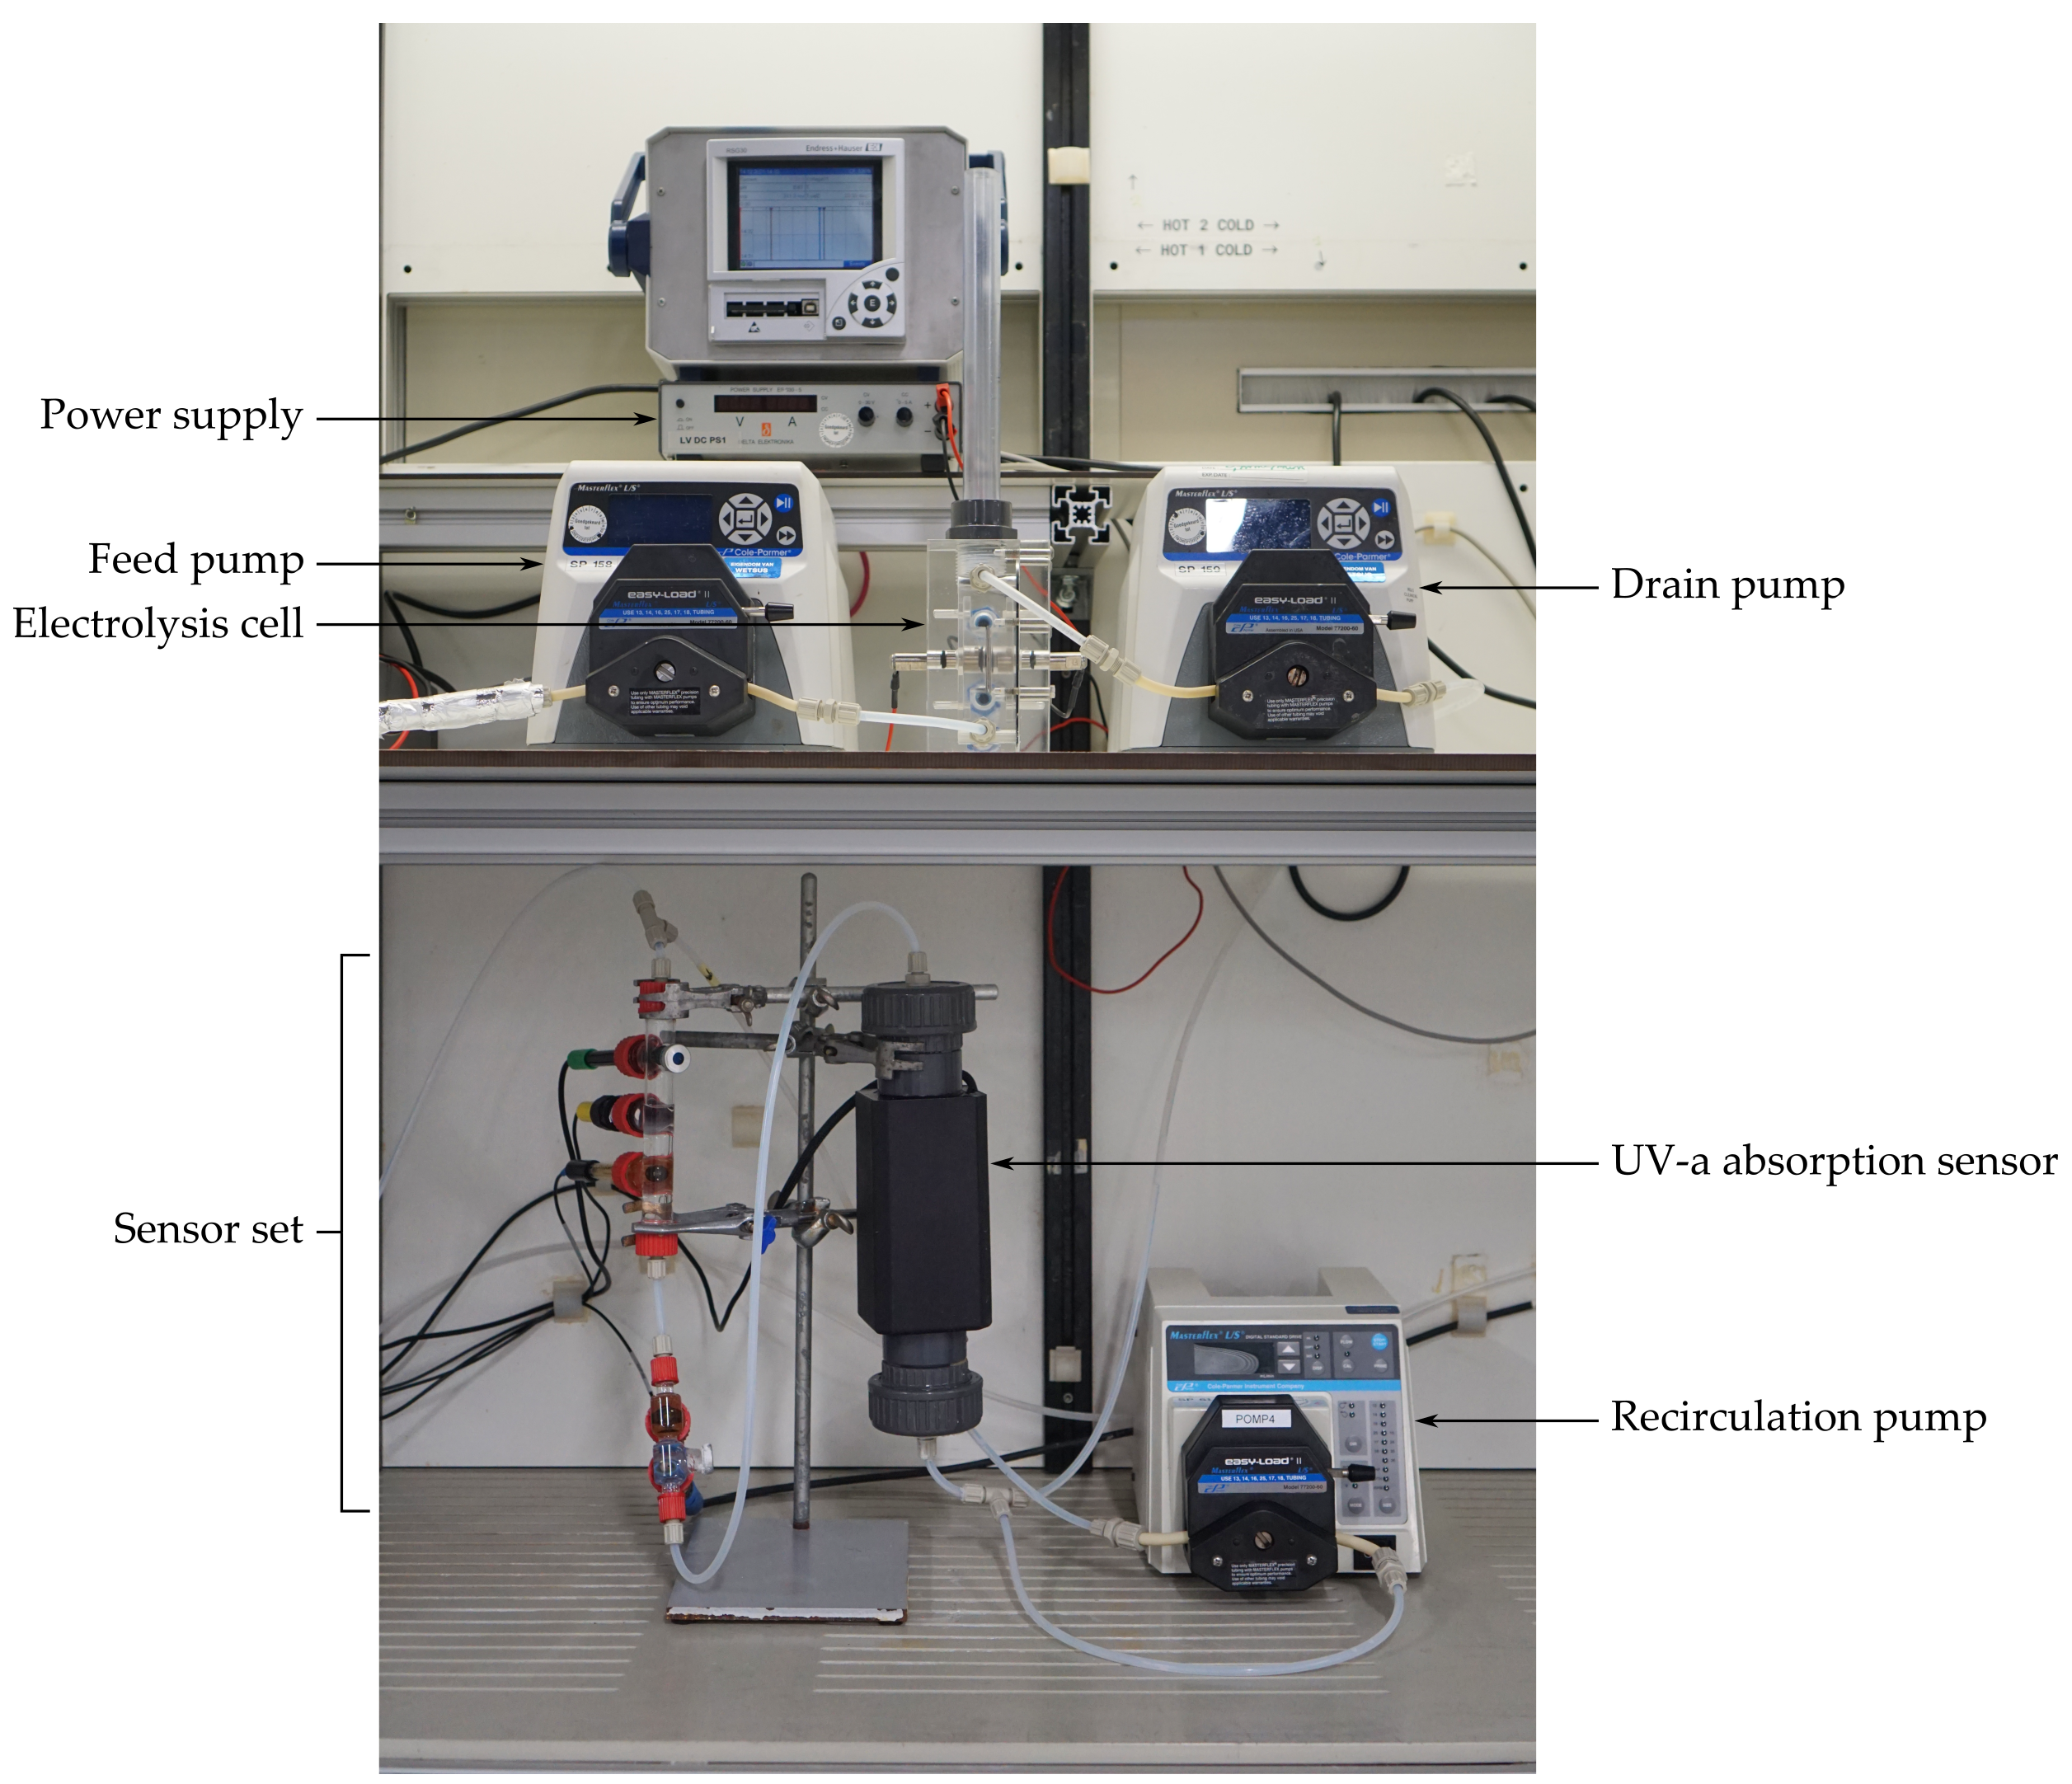
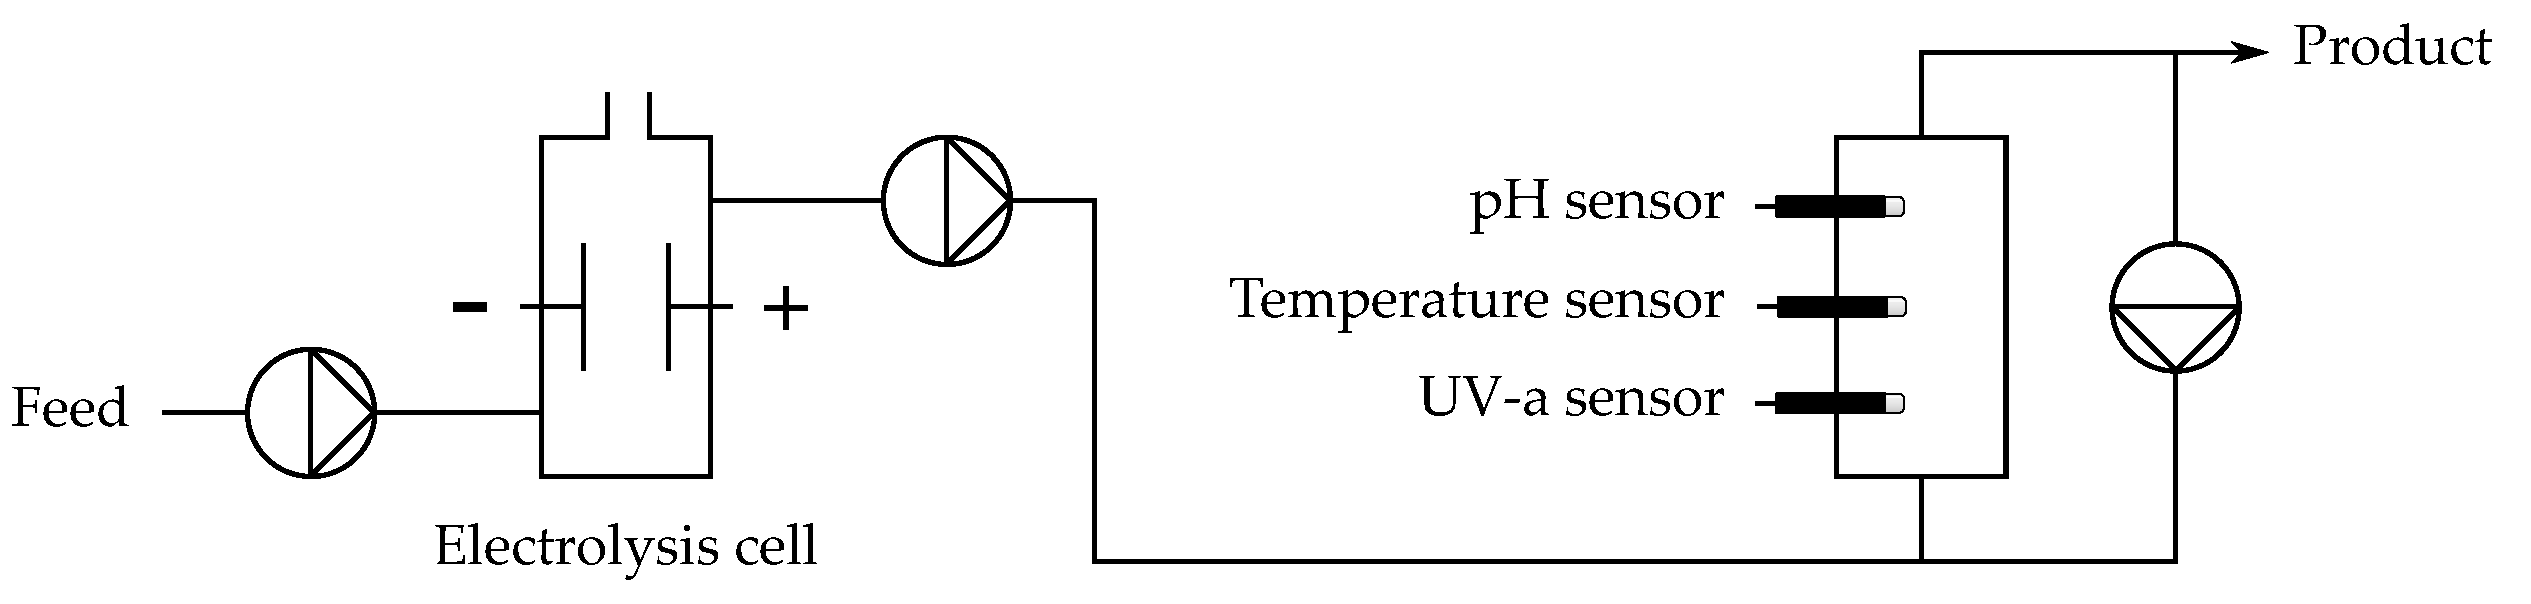
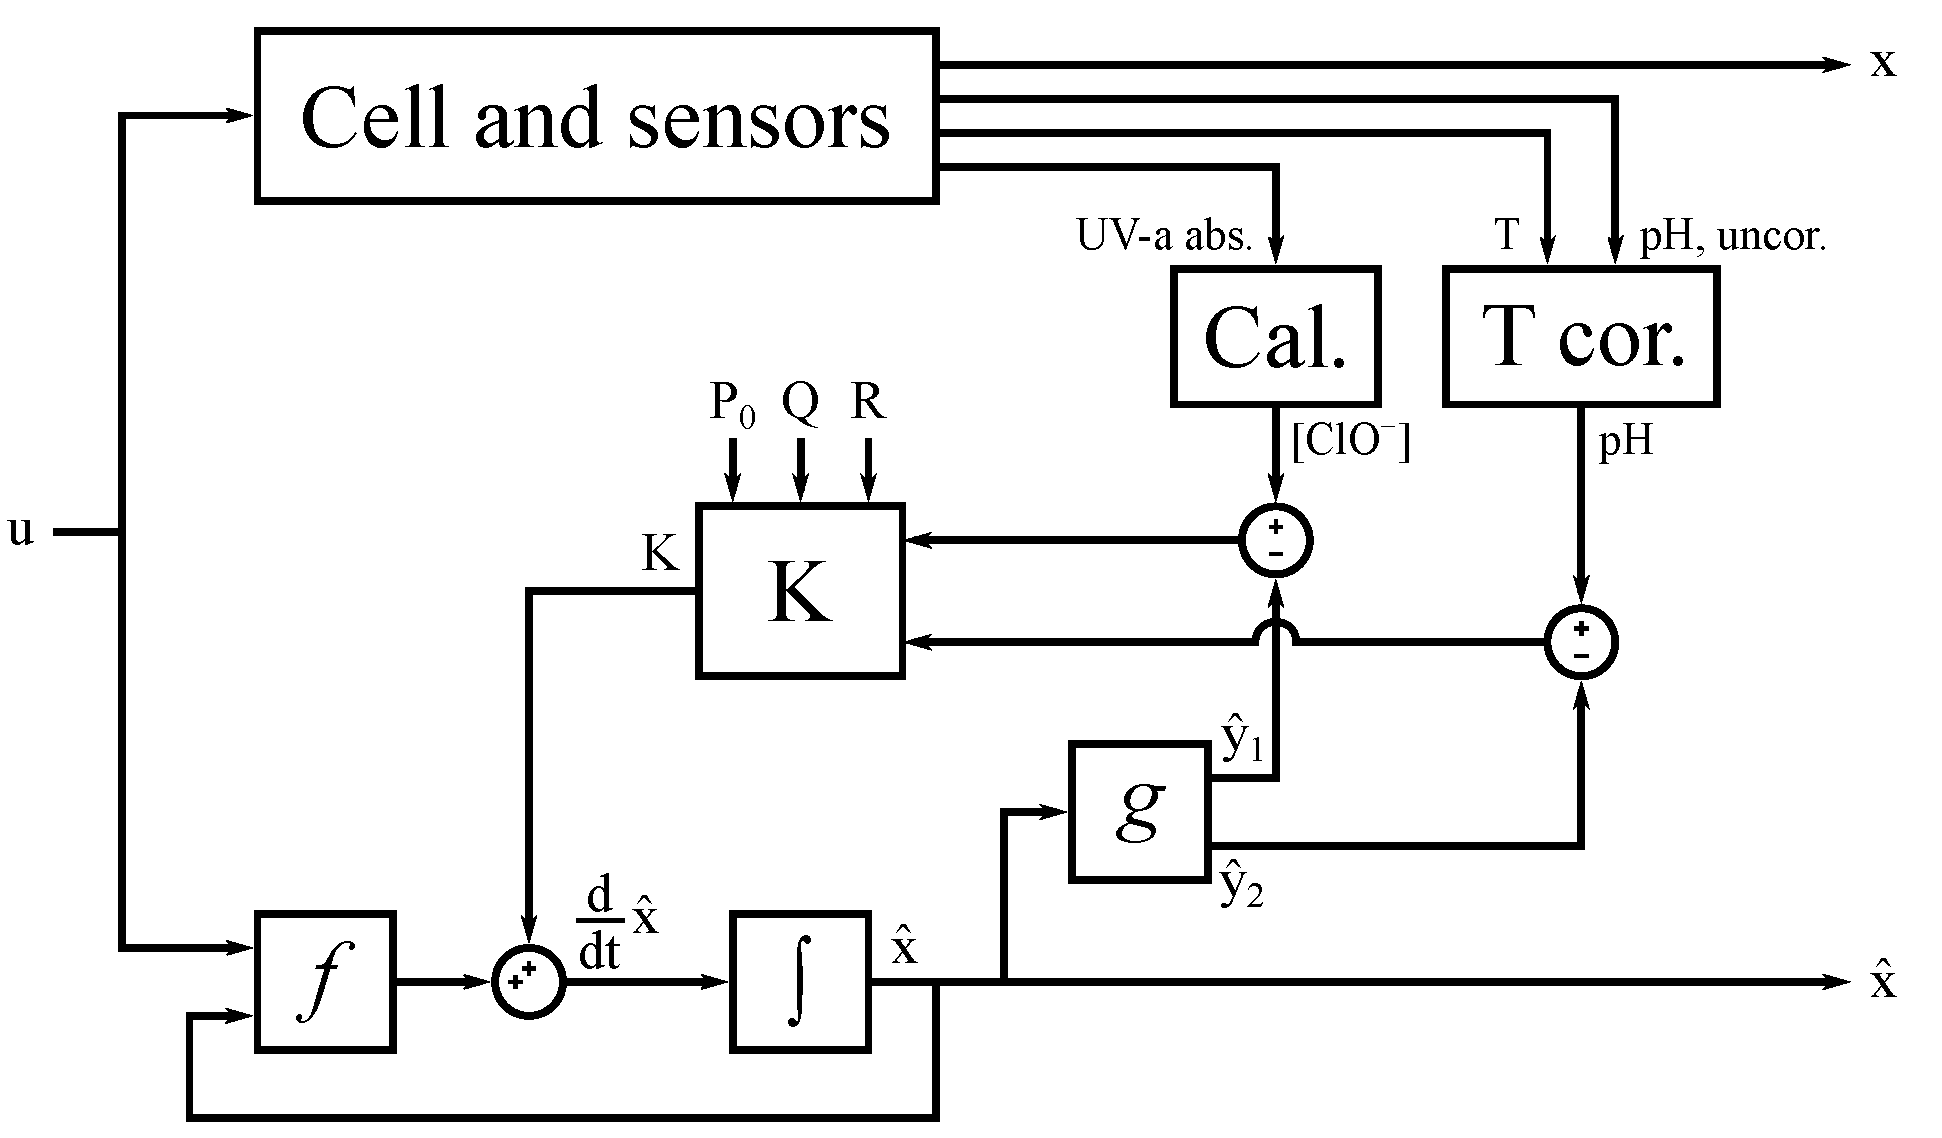
2. Materials and Methods
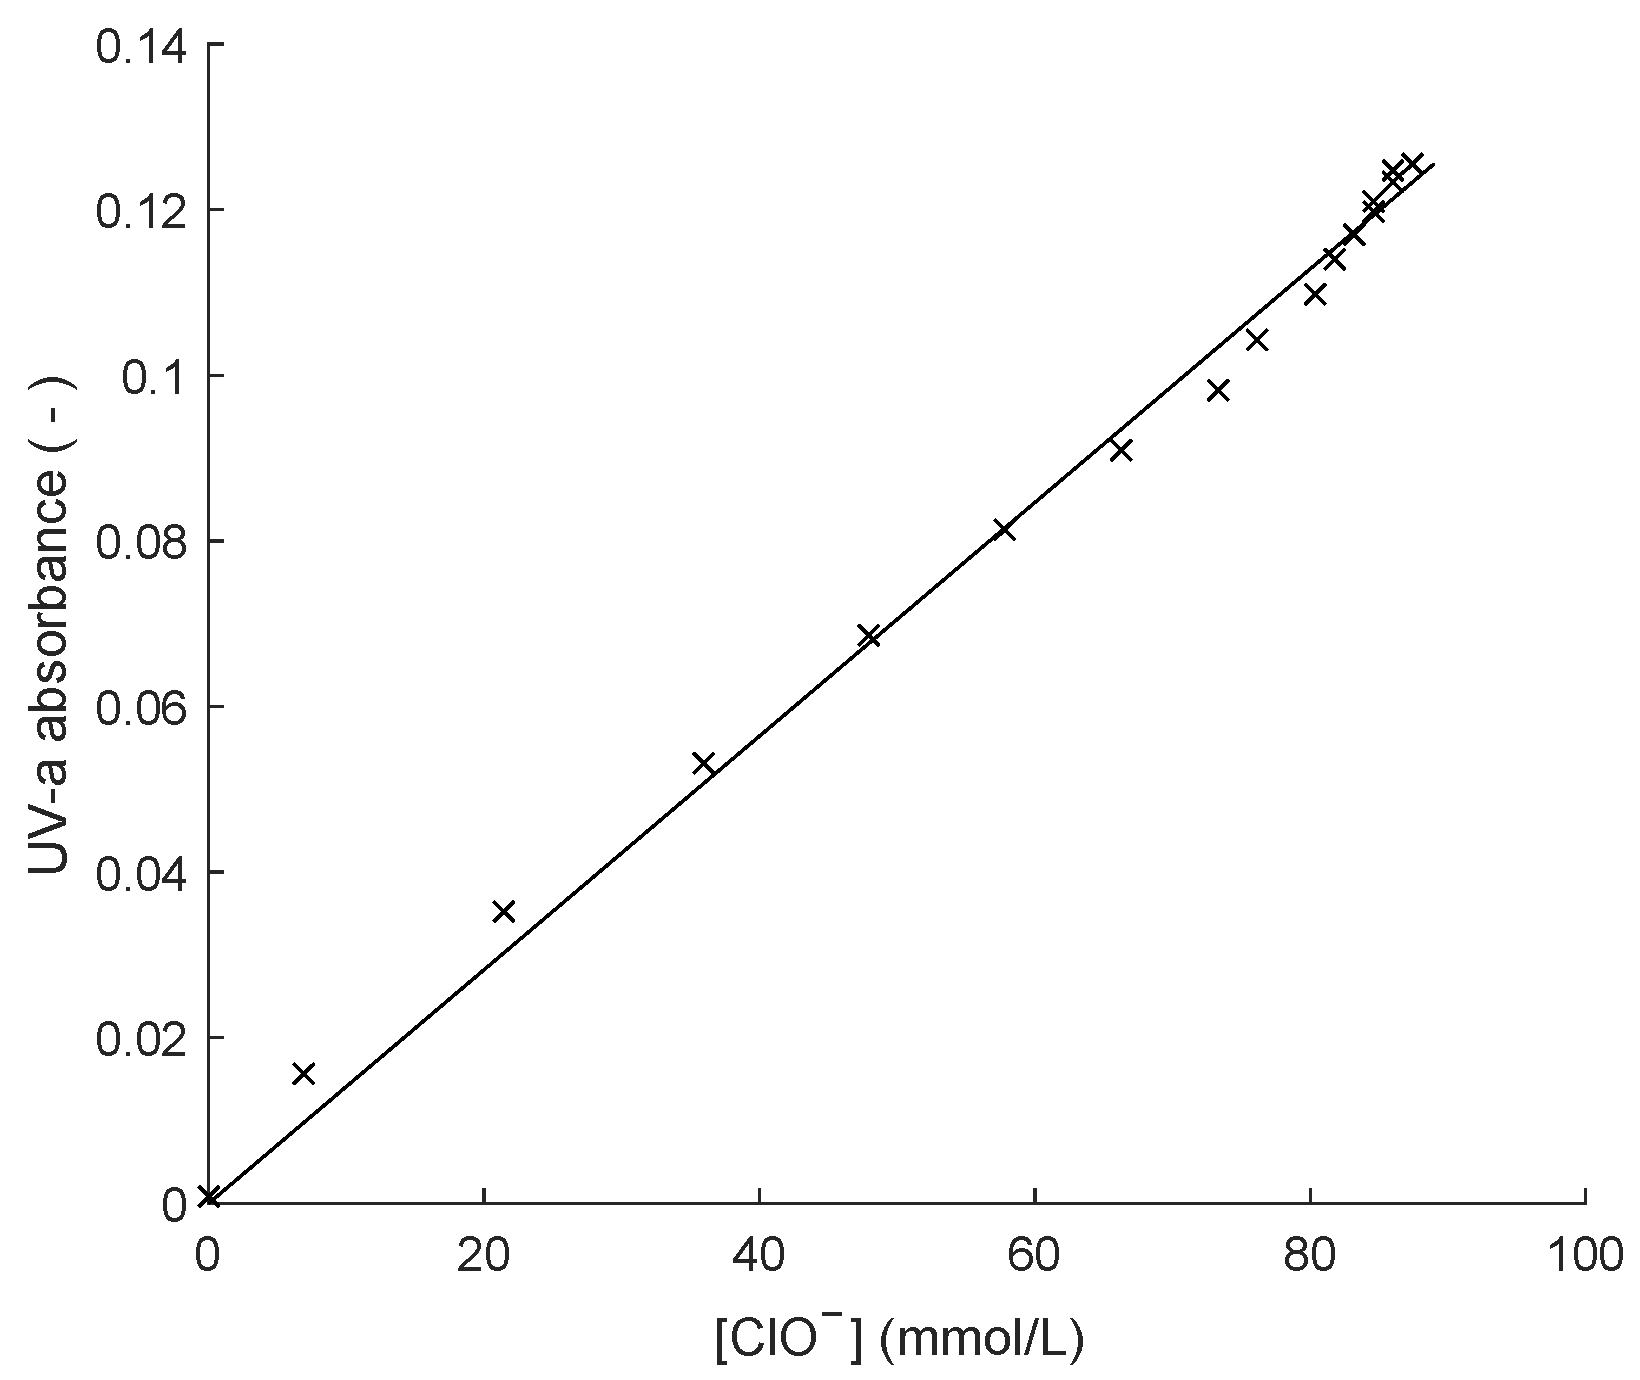
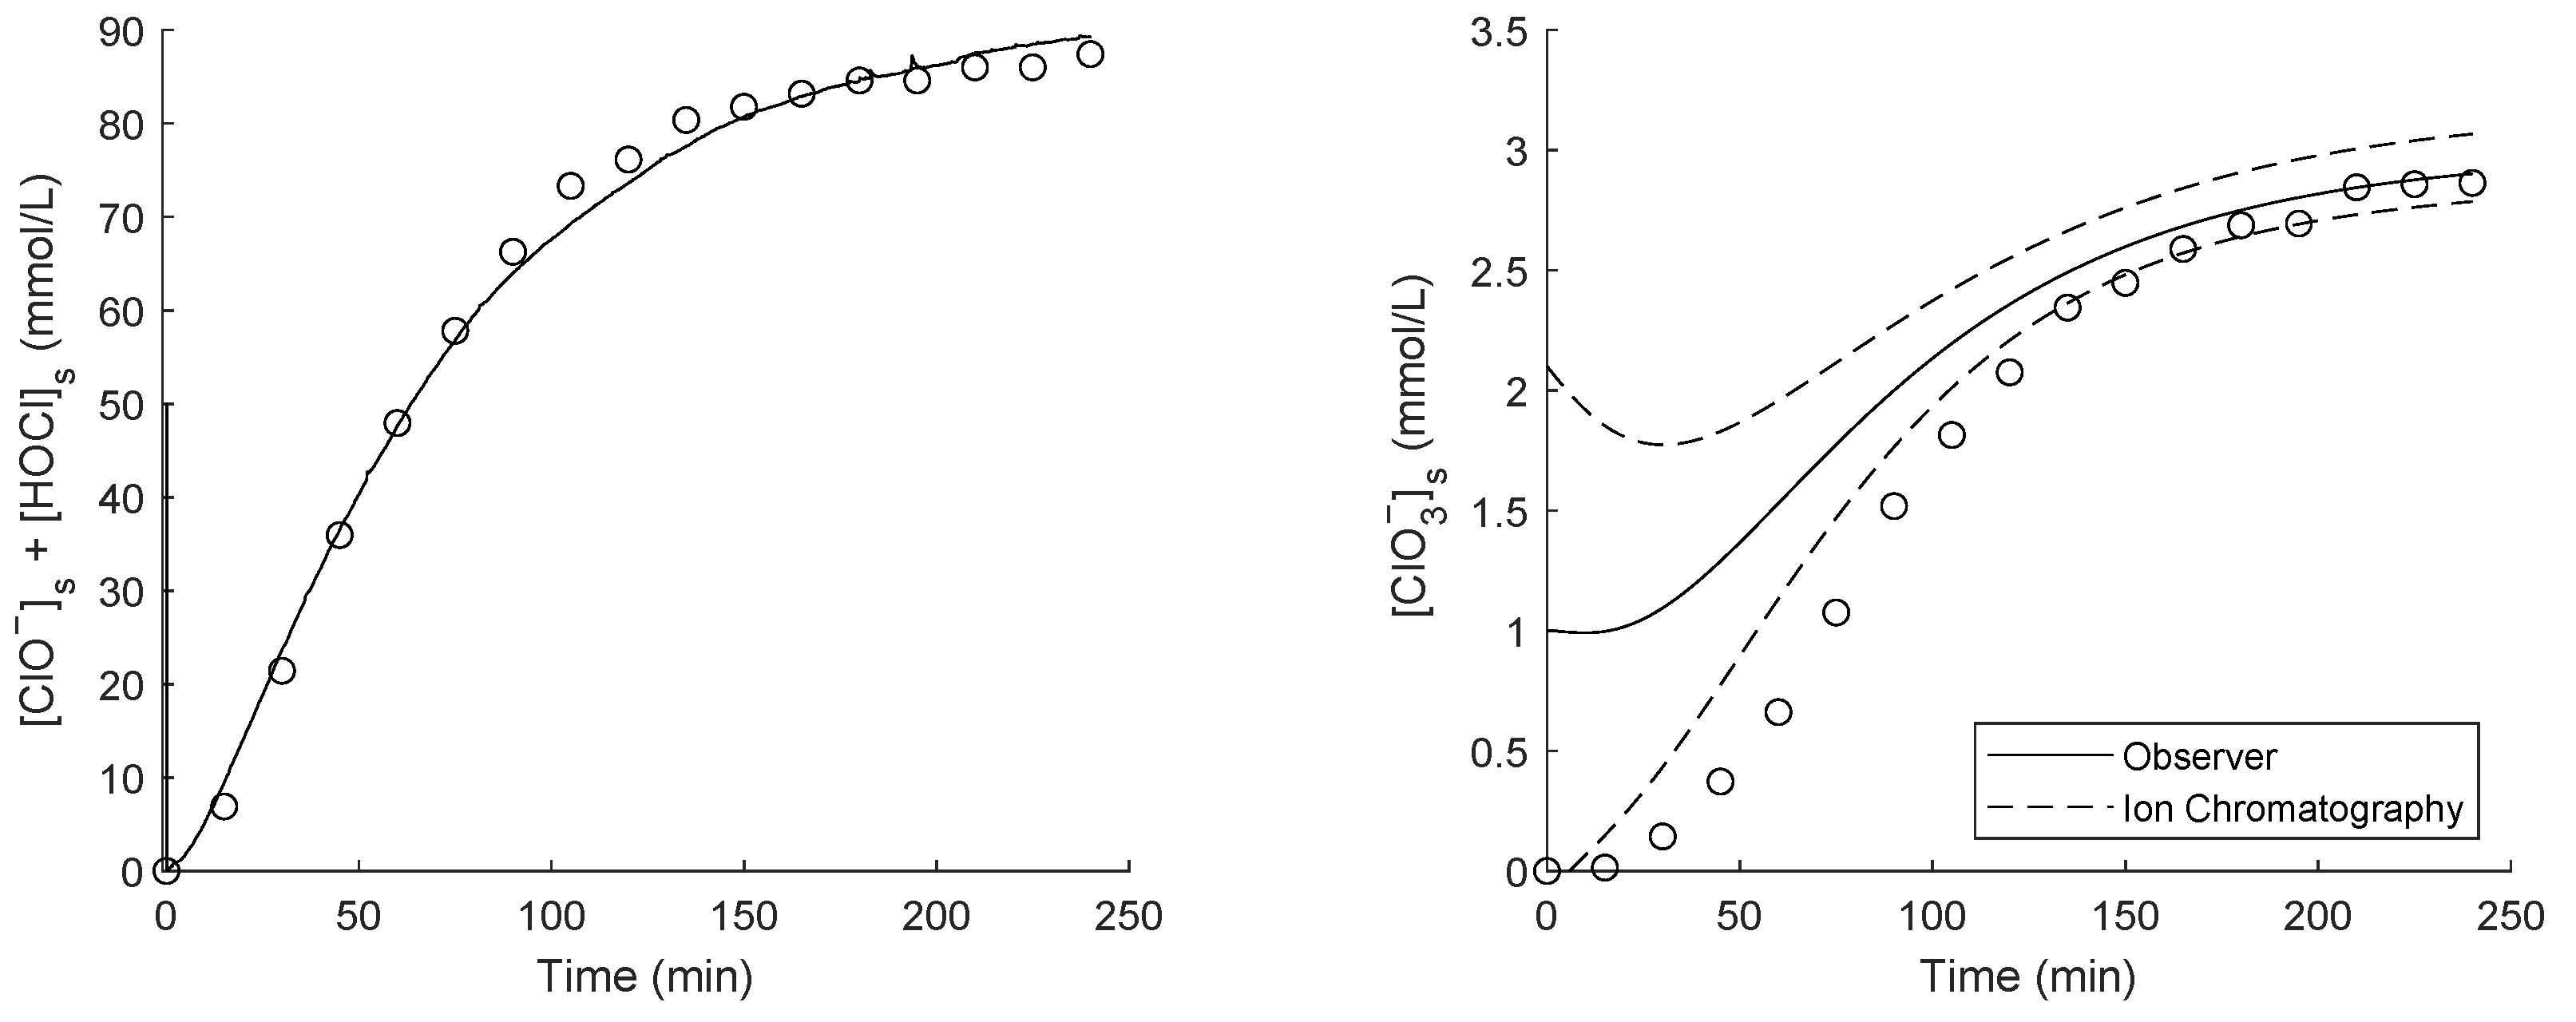
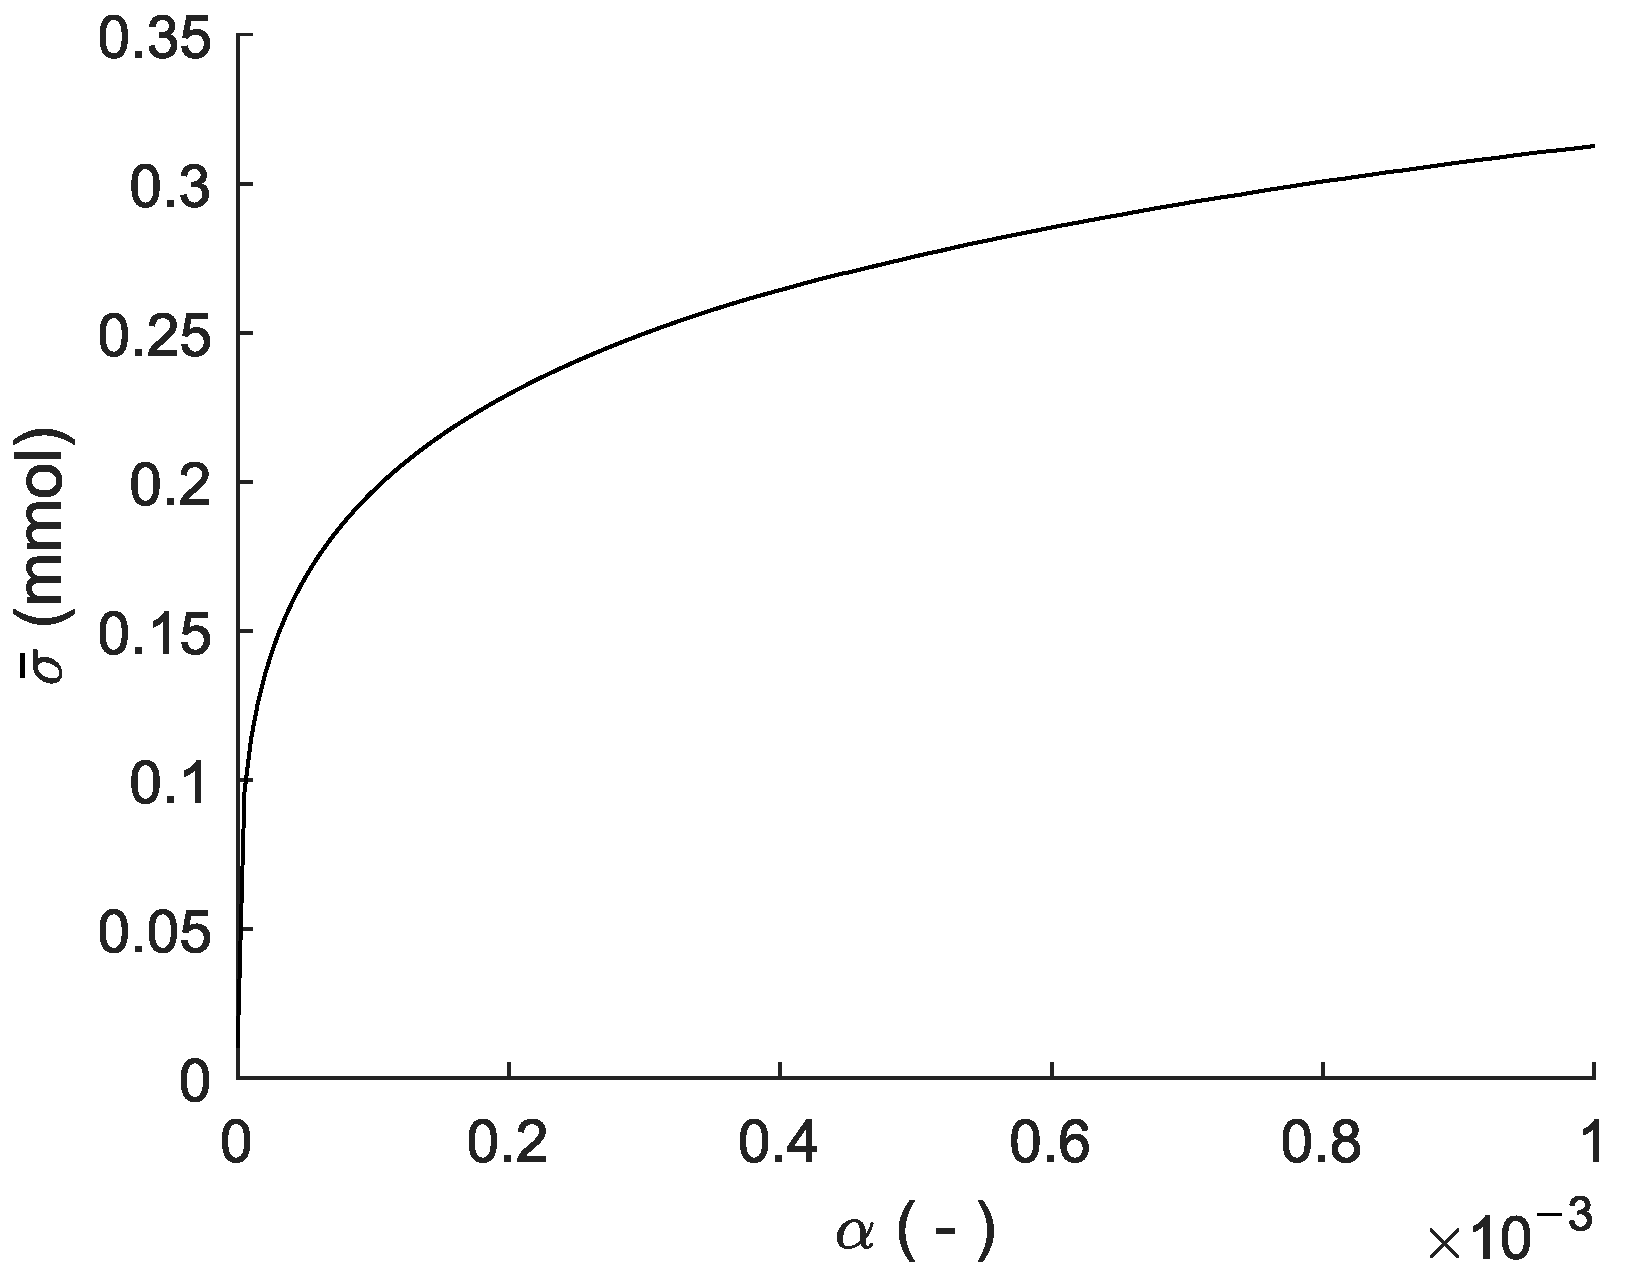
As a first step in developing a chlorate monitoring algorithm, we will introduce a basic, reduced-order model of the electrochlorination process and sensor system and use this for an SDF algorithm based on observer theory. The model will be developed for a laboratory setup, which in turn represents a commercial system but at a much smaller scale. The laboratory setup is shown in Figure 1.
The setup constitutes a small electrolysis cell and a sensor volume, with UV-a absorbance, pH and temperature sensors. The outflow of the sensor volume is rapidly pumped back into the same volume in order to achieve proper mixing while maintaining a rather low flow speed through the cell. A graphical description of the setup is shown in Figure 2.
When a current is applied over the electrodes, the brine feed is electrolyzed mainly into dissolved chlorine gas and hydrogen gas, as follows [3,39,40]:
2 C l C l 2 + 2 e
2 H 2 O + 2 e 2 O H + H 2
The chlorine gas rapidly reacts with hydroxide to form hypochlorite.
C l 2 + 2 O H C l + C l O + H 2 O
The hypochlorite may be protonated, depending on the pH. The equilibrium constant is 2.9 × 10⁻⁸ mol/L at 25 °C [41].
C l O + H + H O C l
The main parasitic reactions are the so-called Foerster reactions, both of which are similar in nature and compete with the chlorine formation in Reaction (1) [42]. Through these reactions, the chlorate is formed as follows:
6 C l O + 3 H 2 O 2 C l O 3 + 4 C l + 6 H + + 3 / 2 O 2 + 6 e
6 H C l O + 3 H 2 O 2 C l O 3 + 4 C l + 12 H + + 3 / 2 O 2 + 6 e
Reactions (1), (2), (5) and (6) each demand energy to occur. A final anodic parasitic reaction, also demanding energy, is that of oxygen evolution [42]:
2 H 2 O O 2 + 4 H + + 4 e
The chlorine production, Foerster reactions and oxygen reactions together have been found to account for the full current over the anode [42].
Reactions (5) and (6) indicate that to estimate the chlorate formation, the hypochlorite and hypochlorous acid concentration in the cell must be known. The hypochlorite in the cell volume can be deduced from the free chlorine and pH in the sensor volume, and a model containing the chemical balances and mixing dynamics in the two volumes. Once the chlorate formation in the cell is estimated from the hypochlorite concentration, the chlorate concentration in the outflow can be determined, which is assumed to be equal to the concentration in the sensor volume.
We therefore aim to determine the free chlorine concentration in the sensor volume. The UV-a absorption sensor was chosen to determine the hypochlorite concentration directly, as hypochlorite strongly absorbs light in the UV range [43]. A certain fraction of the free chlorine can be present in the form of hypochlorous acid, depending on the pH of the solution. Therefore, a pH probe was included as well. Finally, especially the pH readings are affected by temperature [44], which necessitates a temperature sensor.
To make a suitable model, careful consideration has to be given to the timescales involved, as they vary widely between the different processes. Extremely fast reactions take place at the electrodes and in restoring the hydroxide–hydronium and hypochlorite–hypochlorous acid balances [45]. Including the dynamics of these processes would yield a so-called “stiff” system that would require long computing times with little to no benefit in accuracy [46,47]. Instead, we will implement quasi-steady state simplifications; that is, we will assume that steady state is immediately reached for the fastest processes.
To handle the hydroxide–hydronium balance, it is convenient to ignore self-ionization and simply base the pH on the hydroxide produced at the electrode. The latter significantly outweighs the hydrogen ions available in the feed to react with hydroxide, with the pH quickly rising above 9 in our experiments. The chlorine gas is assumed to instantly react with hydroxide, as shown in Reaction (3). The hypochlorite–hypochlorous acid balance has been made instantaneous in the model by including the equilibrium reaction explicitly and using that to reduce the model order.
In the medium time scale, which would be in the minute-range, mixing and temperature effects dominate. Mixing is included explicitly, whereas temperature readings are used to directly correct the sensor data of the other two sensors prior to being used by the observer.
In the long term, being weeks or months, hypochlorate will decompose into chlorite, chlorate and finally perchlorate [45,48]. On the time scales of the experiments and monitoring process, this effect is insignificant and is therefore ignored.
The model thus regards the following effects: hypochlorite and chlorate formation at the electrodes, the hypochlorite–hypochlorous acid balance, and mixing in the cell and sensor volumes. Only the pH and UV-a sensors are explicitly included in the observer, but their readings are temperature-corrected using the temperature sensor. It is assumed that the chlorate formation rate is linearly dependent on the hypochlorite concentration, and it consumes hypochlorite and hypochlorous acid at three times the rate at which chlorate is formed. This corresponds to the experimental results found by Czarnetzki and Janssen [42].
As the goal of this study is to investigate, design and apply a classical observer, the above is implemented as a nonlinear state-space model, as shown in Equations (8) and (9).
d x d t = f ( t , x , u , θ )
y = g ( t , x , θ )
Here, the vector x contains the states, vector u contains the inputs, vector y contains the outputs, and vector θ contains the parameters. Although the function g may also be a function of u, this is not the case here.
We first define the states: x 1 and x 4 are the hypochlorite concentration plus the hypochlorous acid concentration (that is, in this model, the free chlorine) in the cell and sensor set, respectively, x 2 and x 5 are the hydroxide concentration minus the hypochlorous acid concentration in the cell and sensor set, respectively and x 3 and x 6 are the chlorate concentration in the cell and sensor set, respectively. Some of these are combinations of concentrations; this is due to the quasi-steady-state approximation of the hypochlorite–hypochlorous acid reactions. We then implement the following differential state equations:
d x 1 d t = Q V c x 1 + I η C l O F V c e C l O ν I η C l O 3 F V c e C l O 3 [ C l O ] c
d x 2 d t = Q V c [ O H ] i n Q V c x 2
d x 3 d t = Q V c x 3 + I η C l O 3 F V c e C l O 3 [ C l O ] c
d x 4 d t = Q V s x 1 Q V s x 4
d x 5 d t = Q V s x 2 Q V s x 5
d x 6 d t = Q V s x 3 Q V s x 6
with:
x 1 : = [ C l O ] c + [ H C l O ] c
x 2 : = [ O H ] c [ H C l O ] c
x 3 : = [ C l O 3 ] c
x 4 : = [ C l O ] s + [ H C l O ] s
x 5 : = [ O H ] s [ H C l O ] s
x 6 : = [ C l O 3 ] s
The hypochlorite concentration in Equations (10) and (12) can be determined as follows:
[ C l O ] c = k e q + 2 x 1 + x 2 k e q 2 + 4 k e q x 1 + 2 k e q x 2 + x 2 2 2
The derivation has been included in Appendix A. The c and s subscripts denote that the variable in question pertains to the cell or sensor volume, respectively. The static inputs u and parameters θ used are listed in Table 1 and Table 2, respectively, along with the value used in both the experiment and the model. The volumes have been measured, and the current efficiencies are based on colorimetry and ion chromatography analysis for the hypochlorite and chlorate, respectively.
Using derivations similar to Appendix A as well as Equations (19) and (20), we find the following expressions for the outputs y:
y 1 = [ C l O ] s = k e q + 2 x 4 + x 5 k e q 2 + 4 k e q x 4 + 2 k e q x 5 + x 5 2 2
y 2 = [ O H ] s = k e q + x 5 + k e q 2 + 4 k e q x 4 + 2 k e q x 5 + x 5 2 2
These outputs are compared with the sensor data from the UV-a, pH and temperature sensors. The UV-a sensor provides luminosity data. To find the hypochlorite concentration, the absorbance was calculated from the luminosity data and a linear calibration curve was applied. The pH data have been temperature corrected [44]. The hydroxide concentration was then calculated from the corrected pH.
Observability analysis yields that when linearized, this system is not observable [49,50]. However, it is detectable due to the stability of the system. In practical terms, this means that the convergence rate of the observer will typically be limited for the non-observable states [51]. The time it takes for the algorithm to approach an accurate estimate will be dictated by the dynamics of the model [50].
The Extended Kalman Filter (EKF) is used to finally fuse the available, temperature-corrected sensor readings of UV-a absorbance and pH with the above model, as is shown in Figure 3 [52,53,54]. The EKF can only be applied to a set of states which is observable, which is the combination of x 1 , x 2 , x 4 and x 5 for this model. For the non-observable states, which regard the chlorate concentrations in the cell and sensor volumes, the Kalman gain is set to zero. The filter’s measurement noise covariance matrix R is a diagonal matrix with its diagonal elements set to 0.1 mmol 2 and 100 µmol 2 , representing the covariance for measurement of for y 1 and y 2 , respectively. The process noise covariance matrix Q has only been given non-zero values on its diagonal, specifically the simulated steady-state values of the corresponding states multiplied with a scaling parameter α , which was given a value of 10−4.
To estimate the chlorate concentration’s standard deviation σ C l O 3 , a Monte Carlo analysis has been performed. The observable states are assumed to have a Gaussian distribution, and the EKF’s covariance matrix P is assumed to be representative for the variances and covariances of the estimates of these states. The assumed probability distributions for the initial conditions of the non-observable states ( x 3 , t = 0 and x 6 , t = 0 ) and the parameters are given in Table 3, with μ indicating the mean, σ indicating the standard deviation and k and θ being the gamma distribution shape and scale parameters, respectively. The gamma distribution was used because the chlorate concentration states cannot be negative, and they are assumed to have a distribution that is asymmetric at the start of the experiment with lower concentrations being more likely. For x 3 , t = 0 and x 6 , t = 0 , a large initial variance was assumed, as the chlorate concentrations are initially unknown. The volumes V c and V s are assumed to be known with a low degree of uncertainty. With the given distribution parameters, there is a 95% chance that the actual value is within ±1% of the nominal value. The efficiencies and equilibrium constant are assumed to be less accurate, with a 95% confidence interval spanning ±10% of the nominal value. The sample size was 100, and a latin hypercube was used for sampling.
We verified the SDF algorithm by running an electrochlorination process for four hours. Prior to the start, the system was filled with feed water, and both pumps were already running. The feed water was a 28 g/L solution of VWR Sodium Chloride 99.0 % ACS in demineralized water. At t = 0 min, a current-controlled potential was applied to the cell, which caused free chlorine and by-products to be produced.
The pH sensor was an Atlas Scientific ENV-40-pH probe, and for temperature measurement, an Endress + Hauser Ceragel CPS71D was used. The UV-a absorption sensor was an EasyMeasure prototype, operating at a fixed peak wavelength of 401 nm. The calibration curve for this sensor is shown in Figure 4. All the sensor data were logged every 4.3 s and fed to the SDF algorithm.
To verify the algorithm’s estimates, every 15 min, a sample was taken from the outlet. This was analyzed for chlorate and perchlorate via ion chromatography (IC) using a ThermoFischer Dionex IonPac AS22 column. The time samples were also analyzed for free chlorine using colorimetry based on the N,N-diethyl-p-phenylenediamine reagent, as described in Hach document number DOC316.53.01449 [55]. Free chlorine analysis was done directly after the sample was taken. The samples for the IC analysis were stored overnight at 5 ° C and were analyzed the following day.
The results of these analyses were then compared with the estimates from the SDF algorithm. For the sake of demonstration, the initial state values of the algorithm were given a large error.

3. Results

Figure 5 shows the results for the hypochlorite plus hypochlorous acid concentration and chlorate concentration. Both the results from the SDF algorithm and the sample analysis are shown. The results regard the concentrations in the sensor volume.
In both cases, the initial error vanishes, and the estimate becomes accurate. The free chlorine estimate converges very rapidly, requiring only 11 s to eliminate the initial error of 50 mmol/L. The chlorate estimate requires a relatively long time to converge, approximately two hours.
It was found that the uncertainty for the free chlorine was very low. Due to the high pH of the process, C l O constitutes the majority of the free chlorine, and the concentration thereof was measured directly at a high rate and low variance using the UV-a absorption sensor. The calculated uncertainty does depend on the scaling parameter α used for defining the system noise covariance matrix Q. The relation between α and the average standard deviation of free chlorine in the sensor volume σ ¯ is shown in Figure 6. Over the given range, σ ¯ is low regardless of α , as it does not exceed 0.5% of the average free chlorine concentration.

4. Discussion

The SDF algorithm provides an estimation of the chlorate concentration that becomes accurate over time. Compared to a hypothetical chlorate sensor based on selective electrodes, the present solution is expected to provide a more affordable solution, employing a robust sensor set that should have a longer time between maintenance [18,20]. A downside is that it takes some time for the estimates to converge and the uncertainty to become low, as shown in Figure 5. Based on the Monte Carlo analysis, with large initial error of 1 mmol/L with corresponding uncertainty, the relative uncertainly toward the end of the experiment is higher than that of prototype selective electrodes, with a standard deviation of 5.7% of the estimated value, compared to 3 to 4% for the most recent selective electrodes [19,20].
Compared to laboratory analysis, a major difference is that the SDF algorithm provides data in real time. This enables a quick response to high chlorate levels. In addition, the SDF implementation may reduce the number of samples taken, depending on whether this soft sensor is accepted as proof of adherence to the new regulations.
Even if the presented method is accepted as a means of proving compliance to regulations, this does not fully eliminate the necessity of sampling. Sampling is still required to determine the current efficiencies η C l O and η C l O 3 , which are parameters in the model. This relates to a fundamental difficulty in the estimation of by-products through SDF. Namely, that in order to reconstruct a by-product concentration, that concentration must cause a certain measurable change to the system. However, a by-product concentration is typically too low to have such a measurable impact, or it may be difficult to measure in the presence of the much more highly concentrated main product. For example, in the case of electrochlorination, the sodium, chloride and hypochlorite ions overshadow any change in conductivity, so a change in chlorate concentration is difficult to detect using an electrical conductivity probe. Similarly, the hypochlorite and hypochlorous acid redox potential dwarf that of chlorate. The lack of impact of a chlorate concentration on any of the modeled processes is why the system as presented is not fully observable. Essentially, the algorithm includes a final, uncorrected prediction step, from the system’s observable states to the chlorate concentration. The challenge is to make that step as small and robust as possible.
The current efficiencies are known to correlate nonlinearly to variables such as flow speed, sodium chloride concentration and temperature [1,40,56,57]. Such relations can be integrated into the algorithm. This would mean that the model can remain accurate over a broader set of conditions, which would reduce the need for sample-based calibration. However, in that case, additional sensors are necessary. For example, a conductivity sensor may be used to estimate the N a C l concentration, and a temperature probe may be used to estimate the electrode temperature.
The current robustness of the presented SDF algorithm cannot be determined completely from a single electrochlorination test. Additional verification should be done in order to understand under what conditions the model is sufficiently accurate. These additional tests ought to span the complete set of expected conditions seen in practice. Similarly, a single test cannot determine how often samples should be taken for calibration.
The slow dynamics of the chlorate estimation error implies that sudden changes in chlorate concentration cannot be tracked instantaneously. For monitoring purposes, this is acceptable; after all, the error dynamics are similar to and in fact determined by the system’s dynamics [50,51]. The system itself, due to its flow and volume properties, does not allow a quicker transient than can be estimated. This means that once the initial error in the chlorate state is corrected, the estimates should remain accurate in spite of the slow dynamics and are suitable for monitoring for regulatory compliance. In fact, if the initial guess is correct, the estimation of the chlorate concentration at the sensor volume should be accurate throughout. However, since quick changes in the chlorate concentration at the electrodes cannot be estimated using this algorithm, it is not suitable for control at a short time scale. On a longer time scale, the proposed solution could help to achieve process optimization targets, for instance minimizing the production of chlorate or to minimize energy consumption whilst adhering to the regulations regarding chlorate concentrations.
Although the free chlorine dynamics correspond well with the dynamics of the experimental setup, the chlorate dynamics as determined by the ion chromatography are somewhat slower than the model suggests. A possible explanation is that the chlorate production rate depends on the electrode temperature [1,56]. The conducted experiment was done starting with electrodes at room temperature. During the experiment, the temperature of the fluid in the cell increased by 9.7 ° C. For the purposes of this algorithm, this means that the electrochlorination system should be at steady state when taking samples to determine the current efficiencies.
In practice, the UV-a absorption, pH and temperature sensors would preferably be integrated in the electrochlorination machine, as the current over the electrodes and the flow through the flow cell need to be known. In addition, placing the sensors close to the outflow of the flow cells would minimize the sensor system’s dynamics.
Another practical consideration is that the UV-a absorption sensor will be affected by any turbidity of the inflow. In the algorithm, this will lead to a higher assumed hypochlorite concentration. This may be corrected for by using a differential measurement, that is, measuring the UV-a absorbance of the feed water and using the difference to the UV-a absorbance of the outflow to estimate the hypochlorite concentration. This method does assume that the electrochlorination process does not affect the turbidity. An alternative might be to use light absorbance sensors of different wavelengths to estimate the level of turbidity in the outflow and using that data to correct the UV-a absorbance reading.
A difference from practice is that in industrial implementations, the electrodes are placed in a bath rather than in a forced-flow cell. This implies two differences: in practice, the flow is caused by bubble formation, rather than forced flow, and a portion of the electrolyzed fluid may recirculate back to the electrodes. Since the model already regards the cell as a single, well-mixed volume and the residence time is determined by the flow rate, the model is generally appropriate for this situation. However, the verification step differs from practice, since in the experiments conducted for this work, the fluid passed the electrodes only once, by force. It is possible that additional parasitic reactions occur in practice that were not seen in our experiments due to these differences. For instance, chlorite may be formed from the electrolysis of hypochlorite in significant quantities [45,58]. If that proves to be the case, the model may need to be expanded.
Although no perchlorate was found in our experiments, the chlorate estimation method may still be useful for perchlorate monitoring. In practice, the product is stored in a buffer tank for some time, where chlorate slowly reacts with hypochlorite to produce perchlorate [45,48]. To get an accurate estimate of the perchlorate concentration, it is useful to know how much chlorate is entering the buffer tank. This can be calculated on the basis of the SDF algorithm described here.
In a laboratory setting, with a known chemical matrix and parameters, the SDF algorithm accomplished its aim of accurately estimating the chlorate concentration, using a pH, temperature and UV-a absorption sensor. This indicates that should the outlined challenges be overcome, the soft sensing approach is viable and a promising alternative.

5. Conclusions

Due to recent regulatory demands regarding chlorate in drinking water, there is a need to monitor chlorate formed in electrochlorinators. The results of this study demonstrate that Sensor Data Fusion is a viable approach to solving this problem.
For this method, a UV-a absorption sensor, pH probe and temperature probe were used. These are robust sensors based on well-known technologies. To fuse the sensor data, a reduced-order nonlinear state-space model was developed that, under linear analysis, was detectable. An observer based on this model can reduce the error of the unobserved states to zero. In this work, an Extended Kalman Filter was used.
The resulting SDF algorithm was verified through a laboratory experiment. Even with a large initial estimation error, the estimates of the chlorate concentration became accurate over time. A Monte Carlo analysis showed that the standard deviation is comparable to that of selective electrodes.
Future work should focus on estimating the current efficiencies in real time. This is expected to reduce the required calibration frequency.

Supplementary Materials

The following are available at https://www.mdpi.com/article/10.3390/su14106119/s1, Sample_data.csv and Sensor_data.csv.

Author Contributions

Conceptualization, K.K., M.M., E.R., H.S. and M.W.; methodology, K.K. and E.R.; software, M.M. and E.R.; validation, Y.L., M.M., E.R. and M.W.; formal analysis, K.K., E.R. and H.S.; investigation, K.K., Y.L., E.R. and H.S.; resources, B.H., K.K., M.M., H.S. and M.W.; data curation, Y.L. and E.R.; writing—original draft preparation, E.R.; writing—review and editing, B.H., K.K., M.M., E.R., H.S. and M.W.; visualization, E.R.; supervision, K.K., M.M., H.S. and M.W.; project administration, M.W.; funding acquisition, M.W. All authors have read and agreed to the published version of the manuscript.

Funding

Wetsus is co-funded by the Dutch Ministry of Economic Affairs and Climate Policy, the Northern Netherlands Provinces and the Province of Fryslân, with additional support from the participants of the research theme “Sensoring” and Wageningen University and Research.

Institutional Review Board Statement

Not applicable.

Informed Consent Statement

Not applicable.

Data Availability Statement

The data presented in Supplementary Materials for this article.

Acknowledgments

This work was performed in the cooperation framework of Wetsus, European Centre of Excellence for Sustainable Water Technology (https://www.wetsus.eu (accessed on 16 May 2022)). Wetsus is co-funded by the Dutch Ministry of Economic Affairs and Climate Policy, the Northern Netherlands Provinces and the Province of Fryslân. The authors would like to thank the participants of the research theme “Sensoring” for the fruitful discussions and financial support.

Conflicts of Interest

Grundfos A/S and EasyMeasure B.V. were participants of the Wetsus network and were actively involved in the discussions.

Abbreviations

The following abbreviations are used in this manuscript:
EKFExtended Kalman Filter
ICIon Chromatography
MDPIMultidisciplinary Digital Publishing Institute
SDFSensor Data Fusion

Appendix A. Derivation of the Hypochlorite Concentration

The model described in this article requires the hypochlorite concentration [ClO-] to be known, both in the cell volume and in the sensor volume. This concentration will be derived here for the cell volume based on the states x 1 and x 2 . In a similar fashion, the hypochlorite concentration in the sensor volume can be found as well based on the states x 4 and x 5 .
The hypochlorite and hypochlorous acid concentrations are, under the quasi-steady-state approximation, related as follows:
[ H O C l ] c = k e q [ C l O ] c [ O H ] c
The states x 1 and x 2 have been defined as follows:
x 1 : = [ C l O ] c + [ H C l O ] c
x 2 : = [ O H ] c [ H C l O ] c
When inserting Equations (A1) and (A3) in Equation (A2), the following equation can be obtained:
[ C l O ] c = x 1 k e q [ C l O ] c x 1 + x 2 [ C l O ] c
This equation can be rewritten in quadratic form, as follows.
[ C l O ] c 2 ( k e q + 2 x 1 + x 2 ) [ C l O ] c + x 1 2 + x 1 x 2 = 0
This can then be solved for [ClO- ] c .
[ C l O ] c = k e q + 2 x 1 + x 2 ± k e q 2 + 4 k e q x 1 + 2 k e q x 2 + x 2 2 2
Now, we only need to determine whether the plus–minus sign should be a plus or a minus. Since the hypochlorous acid concentration [HOCl ] c cannot be negative, x 1 must be greater than or equal to [ClO- ] c . Therefore, the following inequality must hold:
x 1 k e q + 2 x 1 + x 2 ± k e q 2 + 4 k e q x 1 + 2 k e q x 2 + x 2 2 2
This can be simplified as follows:
k e q + x 2 ± k e q 2 + 4 k e q x 1 + 2 k e q x 2 + x 2 2 0
In case the plus–minus sign is a plus, and knowing x 1 and k e q must be non-negative, only trivial solutions hold. In case it is a minus, Inequality (A8) holds for all non-negative k e q , all non-negative x 1 , and all x 2 . Therefore, in order for Inequality Equation (A8) to hold, the plus–minus sign must be a minus. This yields the following equation for [ClO- ] c :
[ C l O ] c = k e q + 2 x 1 + x 2 k e q 2 + 4 k e q x 1 + 2 k e q x 2 + x 2 2 2

References

  1. Czarnetzki, L. Aspects of Electrochemical Production of Hypochlorite and Chlorate. Ph.D. Thesis, Technische Universiteit Eindhoven, Eindhoven, The Netherlands, 1989. [Google Scholar]
  2. Li, X.Y.; Diao, H.F.; Fan, F.X.J.; Gu, J.D.; Ding, F.; Tong, A.S.F. Electrochemical wastewater disinfection: Identification of its principal germicidal actions. J. Environ. Eng. 2004, 130, 1217–1221. [Google Scholar] [CrossRef]
  3. Mostafa, E.; Reinsberg, P.; Garcia-Segura, S.; Baltruschat, H. Chlorine species evolution during electrochlorination on boron-doped diamond anodes: In-situ electrogeneration of Cl2, Cl2O and ClO2. Electrochim. Acta 2018, 281, 831–840. [Google Scholar] [CrossRef]
  4. Jackson, P.; Dillon, G.; Irving, T.; Stanfield, G. Manual on Treatment for Small Water Supply Systems; Technical Report DETR/DWI 4936/1; Department of the Environment, Transport and the Regions: Buckinghamshire, UK, 2001.
  5. Brillas, E.; Martínez-Huitle, C.A. Decontamination of wastewaters containing synthetic organic dyes by electrochemical methods. An updated review. Appl. Catal. Environ. 2015, 166–167, 603–643. [Google Scholar] [CrossRef]
  6. Saha, J.; Gupta, S. A novel electro-chlorinator using low cost graphite electrode for drinking water disinfection. Ionics 2017, 23, 1903–1913. [Google Scholar] [CrossRef]
  7. Black & Veatch Corporation. White’s Handbook of Chlorination and Alternative Disinfectants, 5th ed.; John Wiley and Sons, Inc.: Hoboken, NJ, USA, 2009. [Google Scholar]
  8. World Health Organization. Guidelines for Drinking-Water Quality: Fourth Edition Incorporating First Addendum, 4th ed.; WHO: Geneva, Switzerland, 2017. [Google Scholar]
  9. Snyder, S. Perchlorate in Drinking-Water. In Background Document WHO/FWC/WSH/16.46; World Health Organization: Geneva, Switzerland, 2016. [Google Scholar]
  10. Cotruvo, J.; Fawell, J.K. Chlorine Dioxide, Chlorite and Chlorate in Drinking-water. In Background Document WHO/FWC/WSH/16.49; World Health Organization: Geneva, Switzerland, 2016. [Google Scholar]
  11. Rosemarin, A.; Lehtinen, K.J.; Notini, M.; Mattson, J. Effects of pulp mill chlorate on baltic sea algae. Environ. Pollut. 1994, 85, 3–13. [Google Scholar] [CrossRef]
  12. van Wijk, D.J.; Hutchinson, T.H. The ecotoxicity of chlorate to aquatic organisms: A critical review. Ecotoxicol. Environ. Saf. 1995, 32, 244–253. [Google Scholar] [CrossRef] [PubMed]
  13. Salice, C.J.; Arenal, C.A.; Tsao, C.L.; Sample, B.E.; McFarland, C.A.; Johnson, M.S. Wildlife Toxicity Assessment for Perchlorate; Report 87-MA02T6-05D; U.S. Army Center for Health Promotion and Preventive Medicine: Aberdeen, MD, USA, 2007. [Google Scholar]
  14. Amy, G.; Bull, R.; Craun, G.F.; Siddiqui, M. Disinfectants and Disinfectant By-Products. In Technical Report Environmental Health Criteria 216; World Health Organization: Geneva, Switzerland, 2000. [Google Scholar]
  15. Atwood, J.; van Sprang, C.; Hamilton, M.; Thompson, K.C. Disinfectants and Disinfectant By-Products; Report; Agriculture and Horticulture Development Board: Kenilworth, UK, 2016.
  16. The European Parliament and the Council of the European Union. Directive (EU) 2020/2184 of the European Parliament and of the Council of 16 December 2020 on the Quality of Water Intended for Human Consumption (Recast); The European Parliament and the Council of the European Union: Strasbourg, France, 2020. [Google Scholar]
  17. The European Commission. Commission Recommendation (EU) 2015/682 of 29 April 2015 on the Monitoring of the Presence of Perchlorate in Food; The European Commission: Strasbourg, France, 2015. [Google Scholar]
  18. Fortuna, L.; Graziani, S.; Rizzo, A.; Xibilia, M. Soft Sensors for Monitoring and Control of Industrial Processes, 1st ed.; Advances in Industrial Control; Springer: London, UK, 2007. [Google Scholar]
  19. Hosseini, S.G.; Safshekan, S. Electrochemical detection of chlorate on a novel nano-Au/TiO2NT electrode. Mater. Res. Bull. 2017, 93, 290–295. [Google Scholar] [CrossRef]
  20. Topcu, C. Highly selective direct determination of chlorate ions by using a newly developed potentiometric electrode based on modified smectite. Talanta 2016, 161, 623–631. [Google Scholar] [CrossRef] [PubMed]
  21. Topcu, C.; Caglar, S.; Caglar, B.; Coldur, F.; Cubuk, O.; Sarp, G.; Gedik, K.; Bozkurt Cirak, B.; Tabak, A. Characterization of a hybrid-smectite nanomaterial formed by immobilizing of N-pyridin-2-ylmethylsuccinamic acid onto (3-aminopropyl)triethoxysilane modified smectite and its potentiometric sensor application. Adv. Nat. Sci. Nanosci. Nanotechnol. 2016, 7, 035012. [Google Scholar] [CrossRef] [Green Version]
  22. Salimi, A.; Mamkhezri, H.; Hallaj, R.; Zandi, S. Modification of glassy carbon electrode with multi-walled carbon nanotubes and iron(III)-porphyrin film: Application to chlorate, bromate and iodate detection. Electrochim. Acta 2007, 52, 6097–6105. [Google Scholar] [CrossRef]
  23. Salimi, A.; Nasiri, S.; Hadadzadeh, H.; Mohebi, S. Renewable Surface Sol-Gel Derived Carbon Ceramic Electrode Modified with [Ru(NH3)5Cl](PF6)2 Complex: Application to Amperometric Detection of Chlorate. Electroanalysis 2005, 17, 2273–2280. [Google Scholar] [CrossRef]
  24. Hiiro, K.; Moody, G.; Thomas, J. A chlorate ion-selective electrode based on a poly(vinyl chloride)—Matrix membrane. Talanta 1975, 22, 918–919. [Google Scholar] [CrossRef]
  25. Sharma, S.K.; Howe, B.M.; Misra, A.K.; Rognstad, M.R.; Porter, J.N.; Acosta-Maeda, T.E.; Egan, M.J. Underwater Time-Gated Standoff Raman Sensor for In Situ Chemical Sensing. Appl. Spectrosc. 2021, 75, 739–746. [Google Scholar] [CrossRef] [PubMed]
  26. Lenntech. Dulcotest® Sensors for Chlorite. 2019. Available online: https://www.lenntech.com/Data-sheets/Prominent-sensors-chlorite-en-L.pdf (accessed on 16 May 2022).
  27. NT Sensors, S.L. Perchlorate Ion Electrode (ClO4−). Available online: https://www.ntsensors.com/wp-content/uploads/2021/05/M99_perchlorate.pdf (accessed on 16 May 2022).
  28. Messaoud, N.B.; Baraket, A.; Dridi, C.; Nooredeen, N.M.; Abbas, M.N.; Bausells, J.; Streklas, A.; Elaissari, A.; Errachid, A. Development of a Perchlorate Chemical Sensor Based on Magnetic Nanoparticles and Silicon Nitride Capacitive Transducer. Electroanalysis 2018, 30, 901–909. [Google Scholar] [CrossRef]
  29. Braik, M.; Dridi, C.; Ben Ali, M.; Ali, A.; Abbas, M.; Errachid, A. Investigation of structural, optical and electrical properties of a new cobalt phthalocyanine thin films with potential applications in perchlorate sensor. Synth. Met. 2015, 209, 135–142. [Google Scholar] [CrossRef]
  30. Gupta, V.K.; Singh, A.K.; Singh, P.; Upadhyay, A. Electrochemical determination of perchlorate ion by polymeric membrane and coated graphite electrodes based on zinc complexes of macrocyclic ligands. Sens. Actuators B Chem. 2014, 199, 201–209. [Google Scholar] [CrossRef]
  31. Gu, B.; Ruan, C.; Wang, W. Perchlorate Detection at Nanomolar Concentrations by Surface-Enhanced Raman Scattering. Appl. Spectrosc. 2009, 63, 98–102. [Google Scholar] [CrossRef]
  32. Chairez, I.; Poznyak, A.; Poznyak, T. Reconstruction of dynamics of aqueous phenols and their products formation in ozonation using differential neural network observers. Ind. Eng. Chem. Res. 2007, 46, 5855–5866. [Google Scholar] [CrossRef]
  33. Hall, D.L.; Llinas, J. An introduction to multisensor data fusion. Proc. IEEE 1997, 85, 6–23. [Google Scholar] [CrossRef] [Green Version]
  34. Mohd Ali, J.; Ha Hoang, N.; Hussain, M.A.; Dochain, D. Review and classification of recent observers applied in chemical process systems. Comput. Chem. Eng. 2015, 76, 27–41. [Google Scholar] [CrossRef] [Green Version]
  35. Kulkarni, P.; Chellam, S. Disinfection by-product formation following chlorination of drinking water: Artificial neural network models and changes in speciation with treatment. Sci. Total Environ. 2010, 408, 4202–4210. [Google Scholar] [CrossRef] [PubMed]
  36. Singh, K.P.; Gupta, S. Artificial intelligence based modeling for predicting the disinfection by-products in water. Chemom. Intell. Lab. Syst. 2012, 114, 122–131. [Google Scholar] [CrossRef]
  37. Lin, H.; Dai, Q.; Zheng, L.; Hong, H.; Deng, W.; Wu, F. Radial basis function artificial neural network able to accurately predict disinfection by-product levels in tap water: Taking haloacetic acids as a case study. Chemosphere 2020, 248, 125999. [Google Scholar] [CrossRef] [PubMed]
  38. Xu, Z.; Shen, J.; Qu, Y.; Chen, H.; Zhou, X.; Hong, H.; Sun, H.; Lin, H.; Deng, W.; Wu, F. Using simple and easy water quality parameters to predict trihalomethane occurrence in tap water. Chemosphere 2022, 286, 131586. [Google Scholar] [CrossRef] [PubMed]
  39. Hammar, L.; Wranglén, G. Cathodic and anodic efficiency losses in chlorate electrolysis. Electrochim. Acta 1964, 9, 1–16. [Google Scholar] [CrossRef]
  40. Jung, Y.J.; Baek, K.W.; Oh, B.S.; Kang, J.W. An investigation of the formation of chlorate and perchlorate during electrolysis using Pt/Ti electrodes: The effects of pH and reactive oxygen species and the results of kinetic studies. Water Res. 2010, 44, 5345–5355. [Google Scholar] [CrossRef]
  41. Agency for Toxic Substances and Disease Registry (ATSDR). Toxicological Profile for Chlorine; Technical Report; U.S. Department of Health and Human Services: Washington, DC, USA, 2010.
  42. Czarnetzki, L.R.; Janssen, L.J.J. Formation of hypochlorite, chlorate and oxygen during NaCl electrolysis from alkaline solutions at an RuO2/TiO2 anode. J. Appl. Electrochem. 1992, 22, 315–324. [Google Scholar] [CrossRef] [Green Version]
  43. Nakagawara, S.; Goto, T.; Nara, M.; Ozawa, Y.; Hotta, K.; Arata, Y. Spectroscopic Characterization and the pH Dependence of Bactericidal Activity of the Aqueous Chlorine Solution. Anal. Sci. 1998, 14, 691–698. [Google Scholar] [CrossRef] [Green Version]
  44. Hach Company/Hach Lange GmbH. Temperature Compensation with pH Measurement; Technical Report LIT2007; Hach Company/Hach Lange GmbH: Ames, IO, USA, 2013. [Google Scholar]
  45. Atwood, J. Chlorine and Its Oxides: Chlorate and Perchlorate Review; Report; Agriculture and Horticulture Development Board: Kenilworth, UK, 2016.
  46. Solodov, A.; Ochkov, V. Differential Models, 1st ed.; Springer: Berlin/Heidelberg, Germany, 2005. [Google Scholar]
  47. Ylén, J. Measuring, Modelling and Controlling the pH Value and the Dynamic Chemical State. Ph.D. Thesis, Helsinki University of Technology, Helsinki, Finland, 2001. [Google Scholar]
  48. Stanford, B.D.; Pisarenko, A.N.; Snyder, S.A.; Gordon, G. Perchlorate, bromate, and chlorate in hypochlorite solutions: Guidelines for utilities. J.-Am. Water Work. Assoc. 2011, 103, 71–83. [Google Scholar] [CrossRef]
  49. Kalman, R. On the general theory of control systems. IFAC Proc. Vol. 1960, 1, 491–502. [Google Scholar] [CrossRef]
  50. Kwakernaak, H.; Sivan, R. Linear Optimal Control Systems; John Wiley and Sons: New York, NY, USA, 1972. [Google Scholar]
  51. Zhang, D.; Couto, L.D.; Moura, S.J. Electrode-Level State Estimation in Lithium-Ion Batteries via Kalman Decomposition. IEEE Control. Syst. Lett. 2021, 5, 1657–1662. [Google Scholar] [CrossRef]
  52. Kopp, R.E.; Orford, R.J. Linear regression applied to system identification for adaptive control systems. AIAA J. 1963, 1, 2300–2306. [Google Scholar] [CrossRef]
  53. Jazwinski, A.H. Stochastic Processes and Filtering Theory; Academic Press: Cambridge, MA, USA, 1970. [Google Scholar]
  54. Gelb, A. Applied Optimal Estimation; MIT Press: Cambridge, MA, USA, 1974. [Google Scholar]
  55. Hach Company/Hach Lange GmbH. Chlorine, Free and Total, High Range, 6th ed.; Technical Report DOC316.53.01449; Hach Company/Hach Lange GmbH: Ames, IO, USA, 2018. [Google Scholar]
  56. Khelifa, A.; Moulay, S.; Hannane, F.; Benslimene, S.; Hecini, M. Application of an experimental design method to study the performance of electrochlorination cells. Desalination 2004, 160, 91–98. [Google Scholar] [CrossRef]
  57. Vacca, A.; Mascia, M.; Palmas, S.; Mais, L.; Rizzardini, S. On the formation of bromate and chlorate ions during electrolysis with boron doped diamond anode for seawater treatment. J. Chem. Technol. Biotechnol. 2013, 88, 2244–2251. [Google Scholar] [CrossRef]
  58. Adam, L.C.; Gordon, G. Hypochlorite Ion Decomposition: Effects of Temperature, Ionic Strength, and Chloride Ion. Inorg. Chem. 1999, 38, 1299–1304. [Google Scholar] [CrossRef] [PubMed]
Figure 1. The laboratory electrochlorination setup.
Sustainability 14 06119 g001
Figure 2. Scheme depicting the laboratory electrochlorination setup.
Sustainability 14 06119 g002
Figure 3. Scheme depicting the algorithm and its interaction with the electrochlorination setup. The ‘Cal.’ block maps the UV-a absorbance data to hypochlorite concentration, the ‘T cor.’ block corrects the pH readings for temperature and the ‘K’ block calculates the Kalman gain.
Sustainability 14 06119 g003
Figure 4. Calibration curve of the UV-a absorption sensor.
Sustainability 14 06119 g004
Figure 5. (Left) Hypochlorite plus hypochlorous acid concentration in the sensor volume. The circular markers (∘) are colorimetric measurements. The solid line is the estimate of the SDF algorithm, which is given an initial concentration of 50 mmol/L. (Right) Chlorate concentration in the sensor volume. The circular markers (∘) are ion chromatography measurements. The solid line is the estimate of the SDF algorithm, which is given an initial concentration of 1 mmol/L. The dashed lines denote the 1 σ confidence interval.
Sustainability 14 06119 g005
Figure 6. The relation between the process variance scaling parameter α and the average standard deviation of the free chlorine estimate σ ¯ .
Sustainability 14 06119 g006
Table 1. Model inputs and the (static) quantities used for the simulation and experiment.
SymbolDescriptionQuantityUnit
QFlow9.0 × 10−5L/s
ICurrent2.3C/s
[OH- ] i n Hydroxide inflow1.3 × 10−9mol/L
Table 2. Model parameters.
SymbolDescriptionQuantityUnit
FFaraday constant96,485C/mol
V c Cell volume0.105L
V s Sensor volume0.288L
η C l O C l O current efficiency0.74-
η C l O 3 C l O 3 current efficiency per C l O concentration0.38L/mol
e C l O Electrons transferred per C l O ion produced2 [39,40]-
e C l O 3 Electrons transferred per C l O 3 ion produced3 [42]-
k e q Equilibrium constant C l O - H C l O balance2.9 × 10−8 [41]mol/L
ν C l O or H C l O to C l O 3 ratio in Reactions (5) and (6)3 [42]-
Table 3. Probability distributions used for the Monte Carlo analysis of the chlorate estimation.
Model ParameterDistributionDistribution Parameters
x 3 , t = 0 Gamma k = 1 , θ = 2.67 × 10 2 L/mol
x 6 , t = 0 Gamma k = 1 , θ = 2.67 × 10 2 L/mol
V c Normal μ = 0.105 L, σ = 5.25 × 10 5 L
V s Normal μ = 0.288 L, σ = 1.44 × 10 4 L
η C l O Normal μ = 0.74 , σ = 8.82 × 10 2
η C l O 3 Normal μ = 0.38 L/mol, σ = 6.06 × 10 2 L/mol
k e q Normal μ = 2.9 × 10 8 mol/L, σ = 1.45 × 10 9 mol/L
Publisher’s Note: MDPI stays neutral with regard to jurisdictional claims in published maps and institutional affiliations.

