Article

Comparison of Thermal Energy Saving Potential and Overheating Risk of Four Adaptive Façade Technologies in Office Buildings

1
Sustainable Building Design Lab, Department of Urban and Environmental Engineering, Applied Sciences, Université de Liège, 4000 Liège, Belgium
2
EPF Graduate School of Engineering, 94230 Cachan, France
3
School of Built Environment, Engineering and Computing, Leeds Beckett University, Leeds LS2 8AG, UK
4
School of Architecture and Built Environment, Geelong Waterfront Campus, Deakin University, Geelong 3220, Australia
*
Author to whom correspondence should be addressed.
Sustainability 2022, 14(10), 6106; https://doi.org/10.3390/su14106106
Submission received: 29 April 2022 / Revised: 10 May 2022 / Accepted: 14 May 2022 / Published: 17 May 2022
(This article belongs to the Collection Structural Sensing and Sustainable Infrastructure Maintenance)

Abstract

:
Adaptive façades are gaining greater importance in highly efficient buildings under a warming climate. There is an increasing demand for adaptive façades designed to regulate solar and thermal gains/losses, as well as avoid discomfort and glare issues. Occupants and developers of office buildings ask for a healthy and energy-neutral working environment. Adaptive façades are appropriate dynamic solutions controlled automatically or through occupant interaction. However, relatively few studies compared their energy and overheating risk performance, and there is still a vast knowledge gap on occupant behavior in operation. Therefore, we chose to study four dynamic envelopes representing four different façade families: dynamic shading, electrochromic glazing, double-skin, and active ventilative façades. Three control strategies were chosen to study the dynamic aspect of solar control, operative temperature, and glare control. Simulations were realized with EnergyPlus on the BESTEST case 600 from the ASHRAE standard 140/2020 for the temperate climate of Brussels. A sensitivity analysis was conducted to study the most influential parameters. The study findings indicate that dynamic shading devices and electrochromic glazing have a remarkable influence on the annual thermal energy demand, decreasing the total annual loads that can reach 30%. On the other hand, BIPV double-skin façades and active ventilative façades (cavity façades) could be more appropriate for cold climates. The study ranks the four façade technologies and provides novel insights for façade designers and building owners regarding the annual energy performance and overheating risk.

1. Introduction

The building sector in the EU aims to reduce its footprint for new and existing constructions. Innovative building envelopes could become one of the key solutions to reduce environmental impacts and increase the performance of buildings [1]. More specifically, adaptive façade systems are promising technologies that will continue to gain a substantial share of the 2050 building stock [2]. For the few last decades, dynamic building envelopes, also called adaptive façades, have been of great interest to researchers [3]. The dynamic building envelope technologies include roller blinds, shutters, venetian blinds, and chromogenic façades—including electrochromic and thermochromic glazing-building integrated photovoltaic, Double-skin Façades (DSF), Closed Cavity Façades (CCF) [4], and phase change materials. Adaptive façades technologies are abundant and can respond to or benefit from the changing outside boundary conditions [5]. Their main advantage is their possibility to control solar heat gain and daylight while preventing overheating and glare.
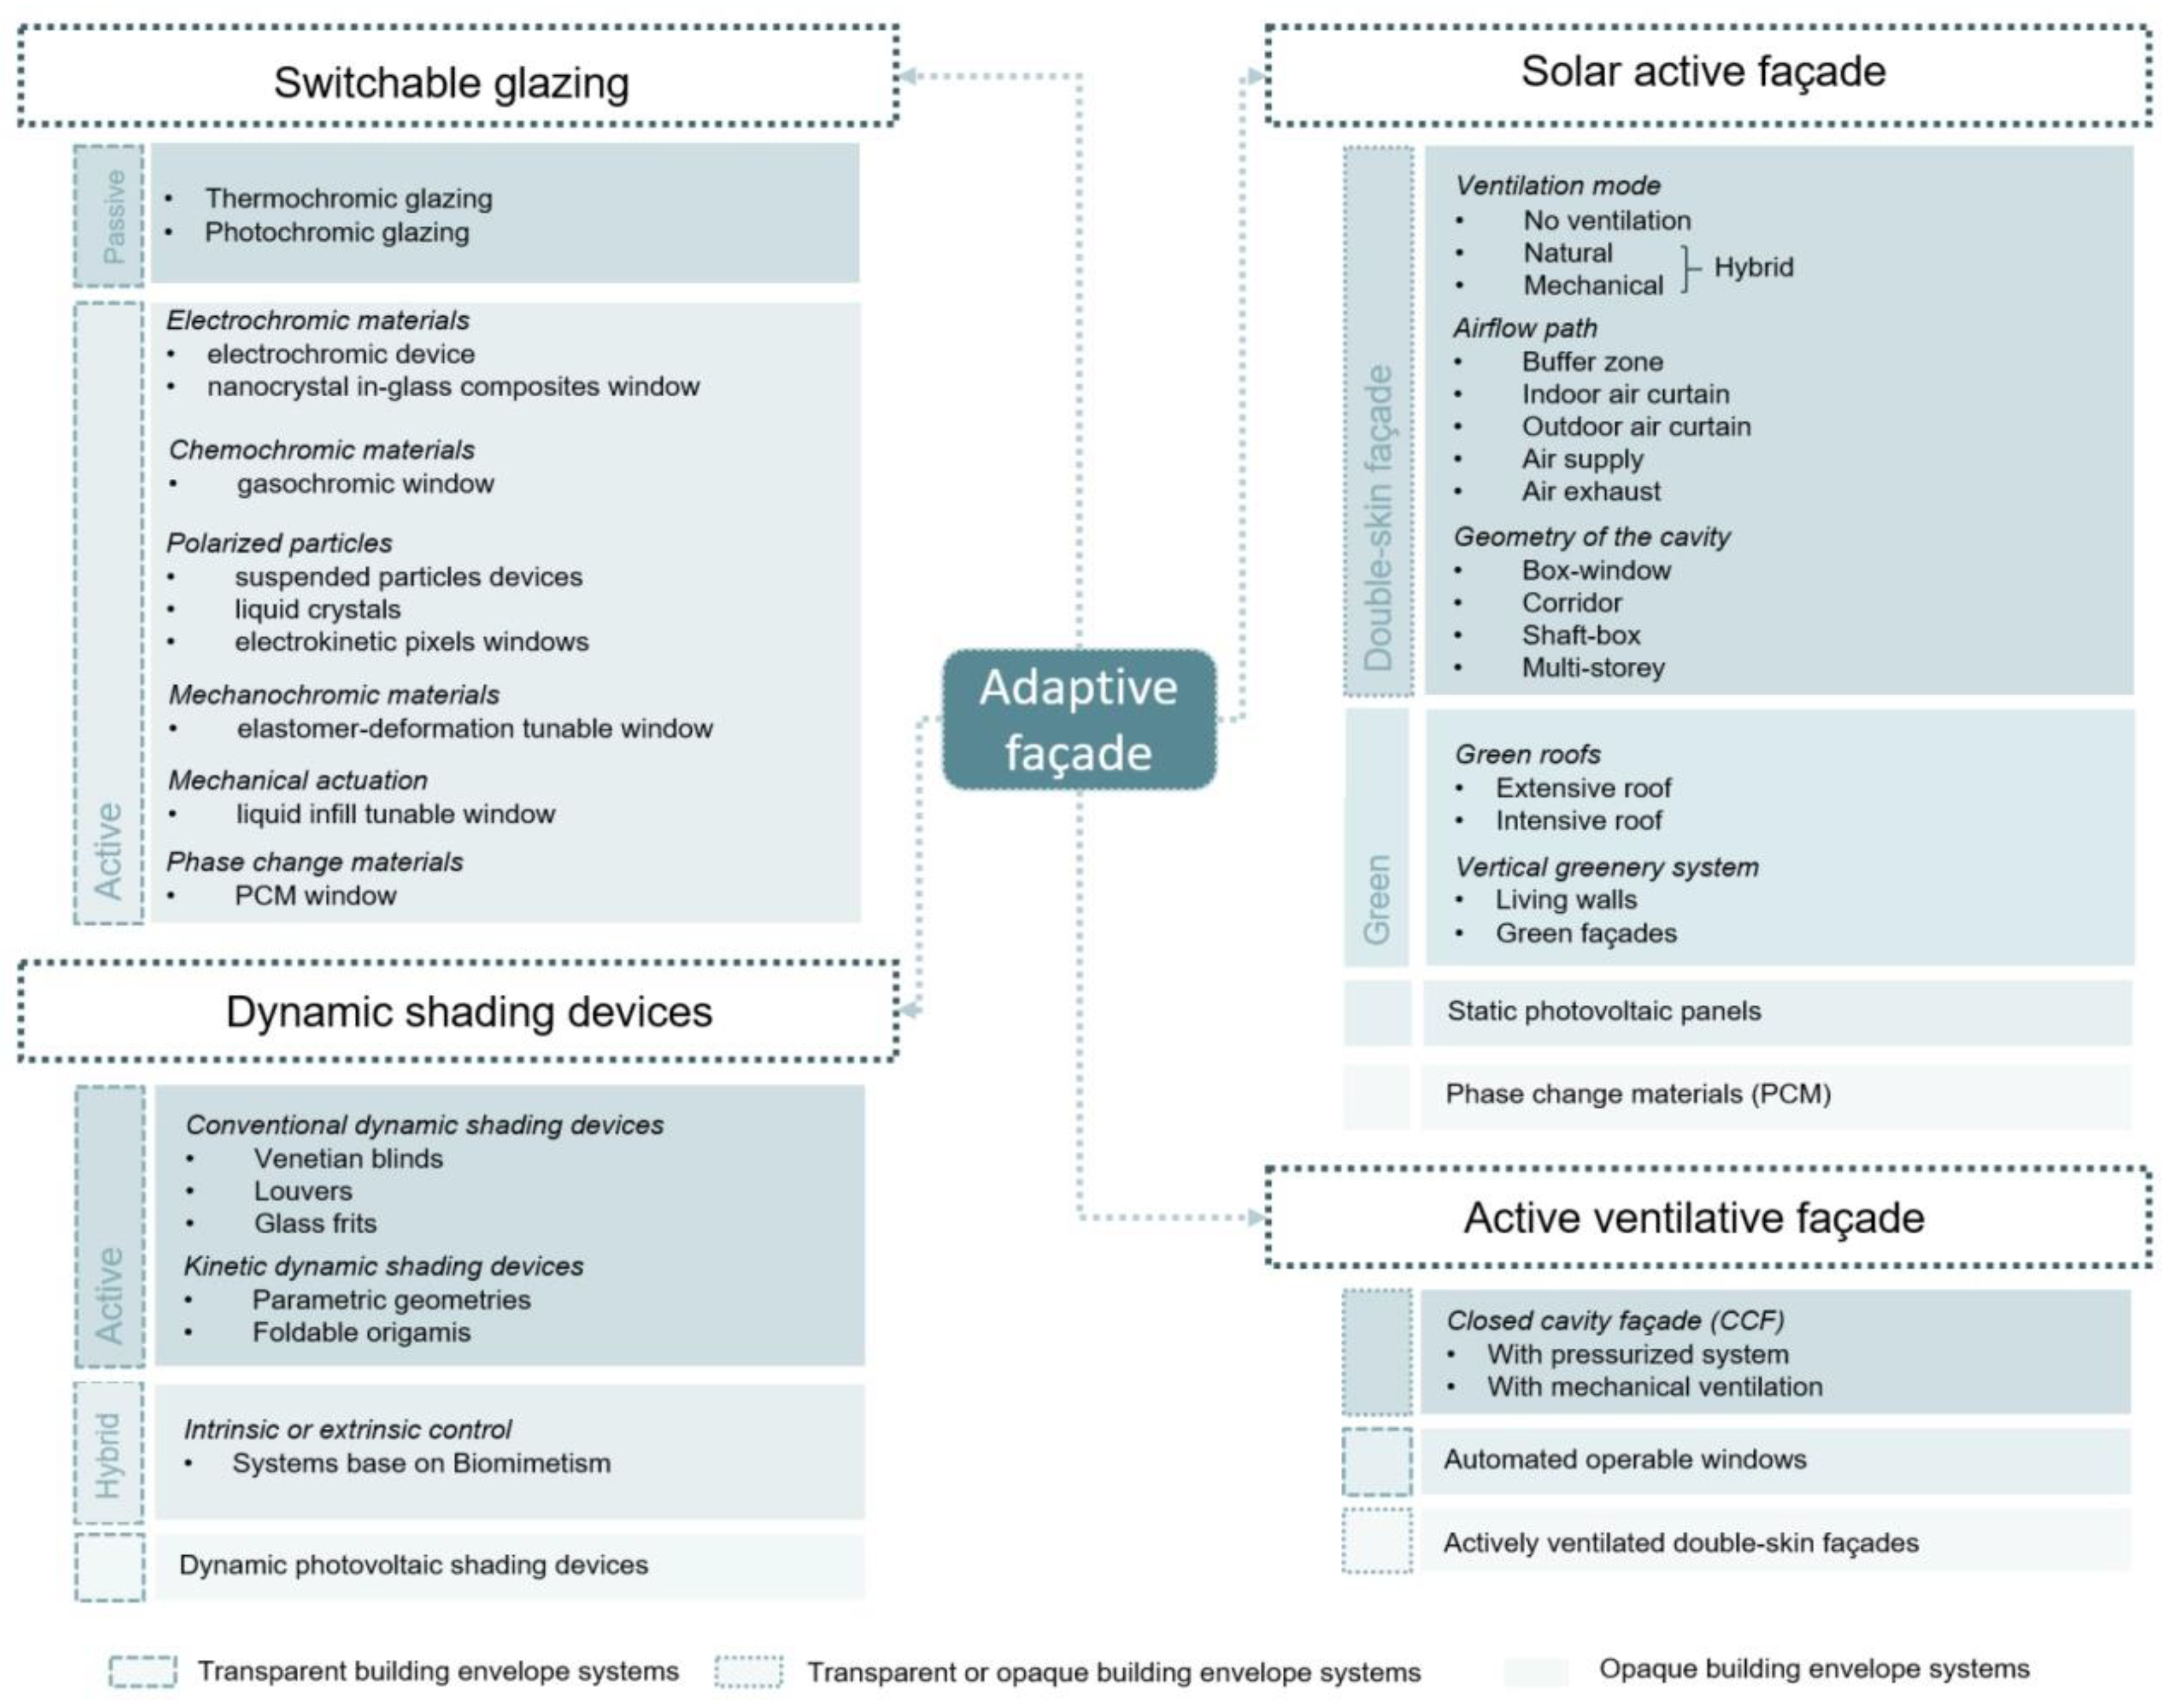
Many studies investigated the impacts of adaptive façades. The study of Attia et al. is one of the earliest studies that aimed to classify and group the most promising adaptive façade technologies [2]. Their study proposed four categories or families of adaptive façades, namely dynamic shading (family 1), chromogenic façades (family 2), solar active façades (family 3), and active ventilative façades (family 4). Other studies focused on evaluating and benchmarking single adaptive façade technologies. For example, Vraa Nielsen, Svendsen, and Bjerregaard Jensen (2011) also studied dynamic shading impact on the energy demand and thermal and visual comfort by simulating a single room in Denmark with the help of iDbuild and LightCalc [6]. A comparison of windows with and without static shading devices was made and demonstrated a significant reduction of the cooling and heating energy loads and the amount of daylight. Tällberg et al. (2019) evaluated the influence of thermochromic, photochromic, and electrochromic on energy use, investigating the impact of three control strategies: solar control, operative temperature control, and daylight control [7]. It was demonstrated that electrochromic glazing has better energy performance than two other smart windows. It was also shown that operative temperature control is the most efficient strategy. Finally, they concluded that overheating risk is not sensible to this smart technology. For Closed Cavity Façades (CCF), Alberto, Ramos, and Almeida (2017) concluded that it helps to reduce the energy demand [8] significantly. Based on their study, cavity depth, ventilation mode, and airflow path could strongly influence the results.
However, none of the mentioned studies compared adaptive façades from different families. Most of the available studies in the literature limit their scope to a single façade family or technology such as dynamic shading devices [8,9,10], switchable chromogenic windows [11,12], double-skin façade [13,14], or switchable conductivity value [15]. In addition, dynamic control strategies are important, but few studies evaluate their impacts to consistently benchmark the performance of adaptive façades.
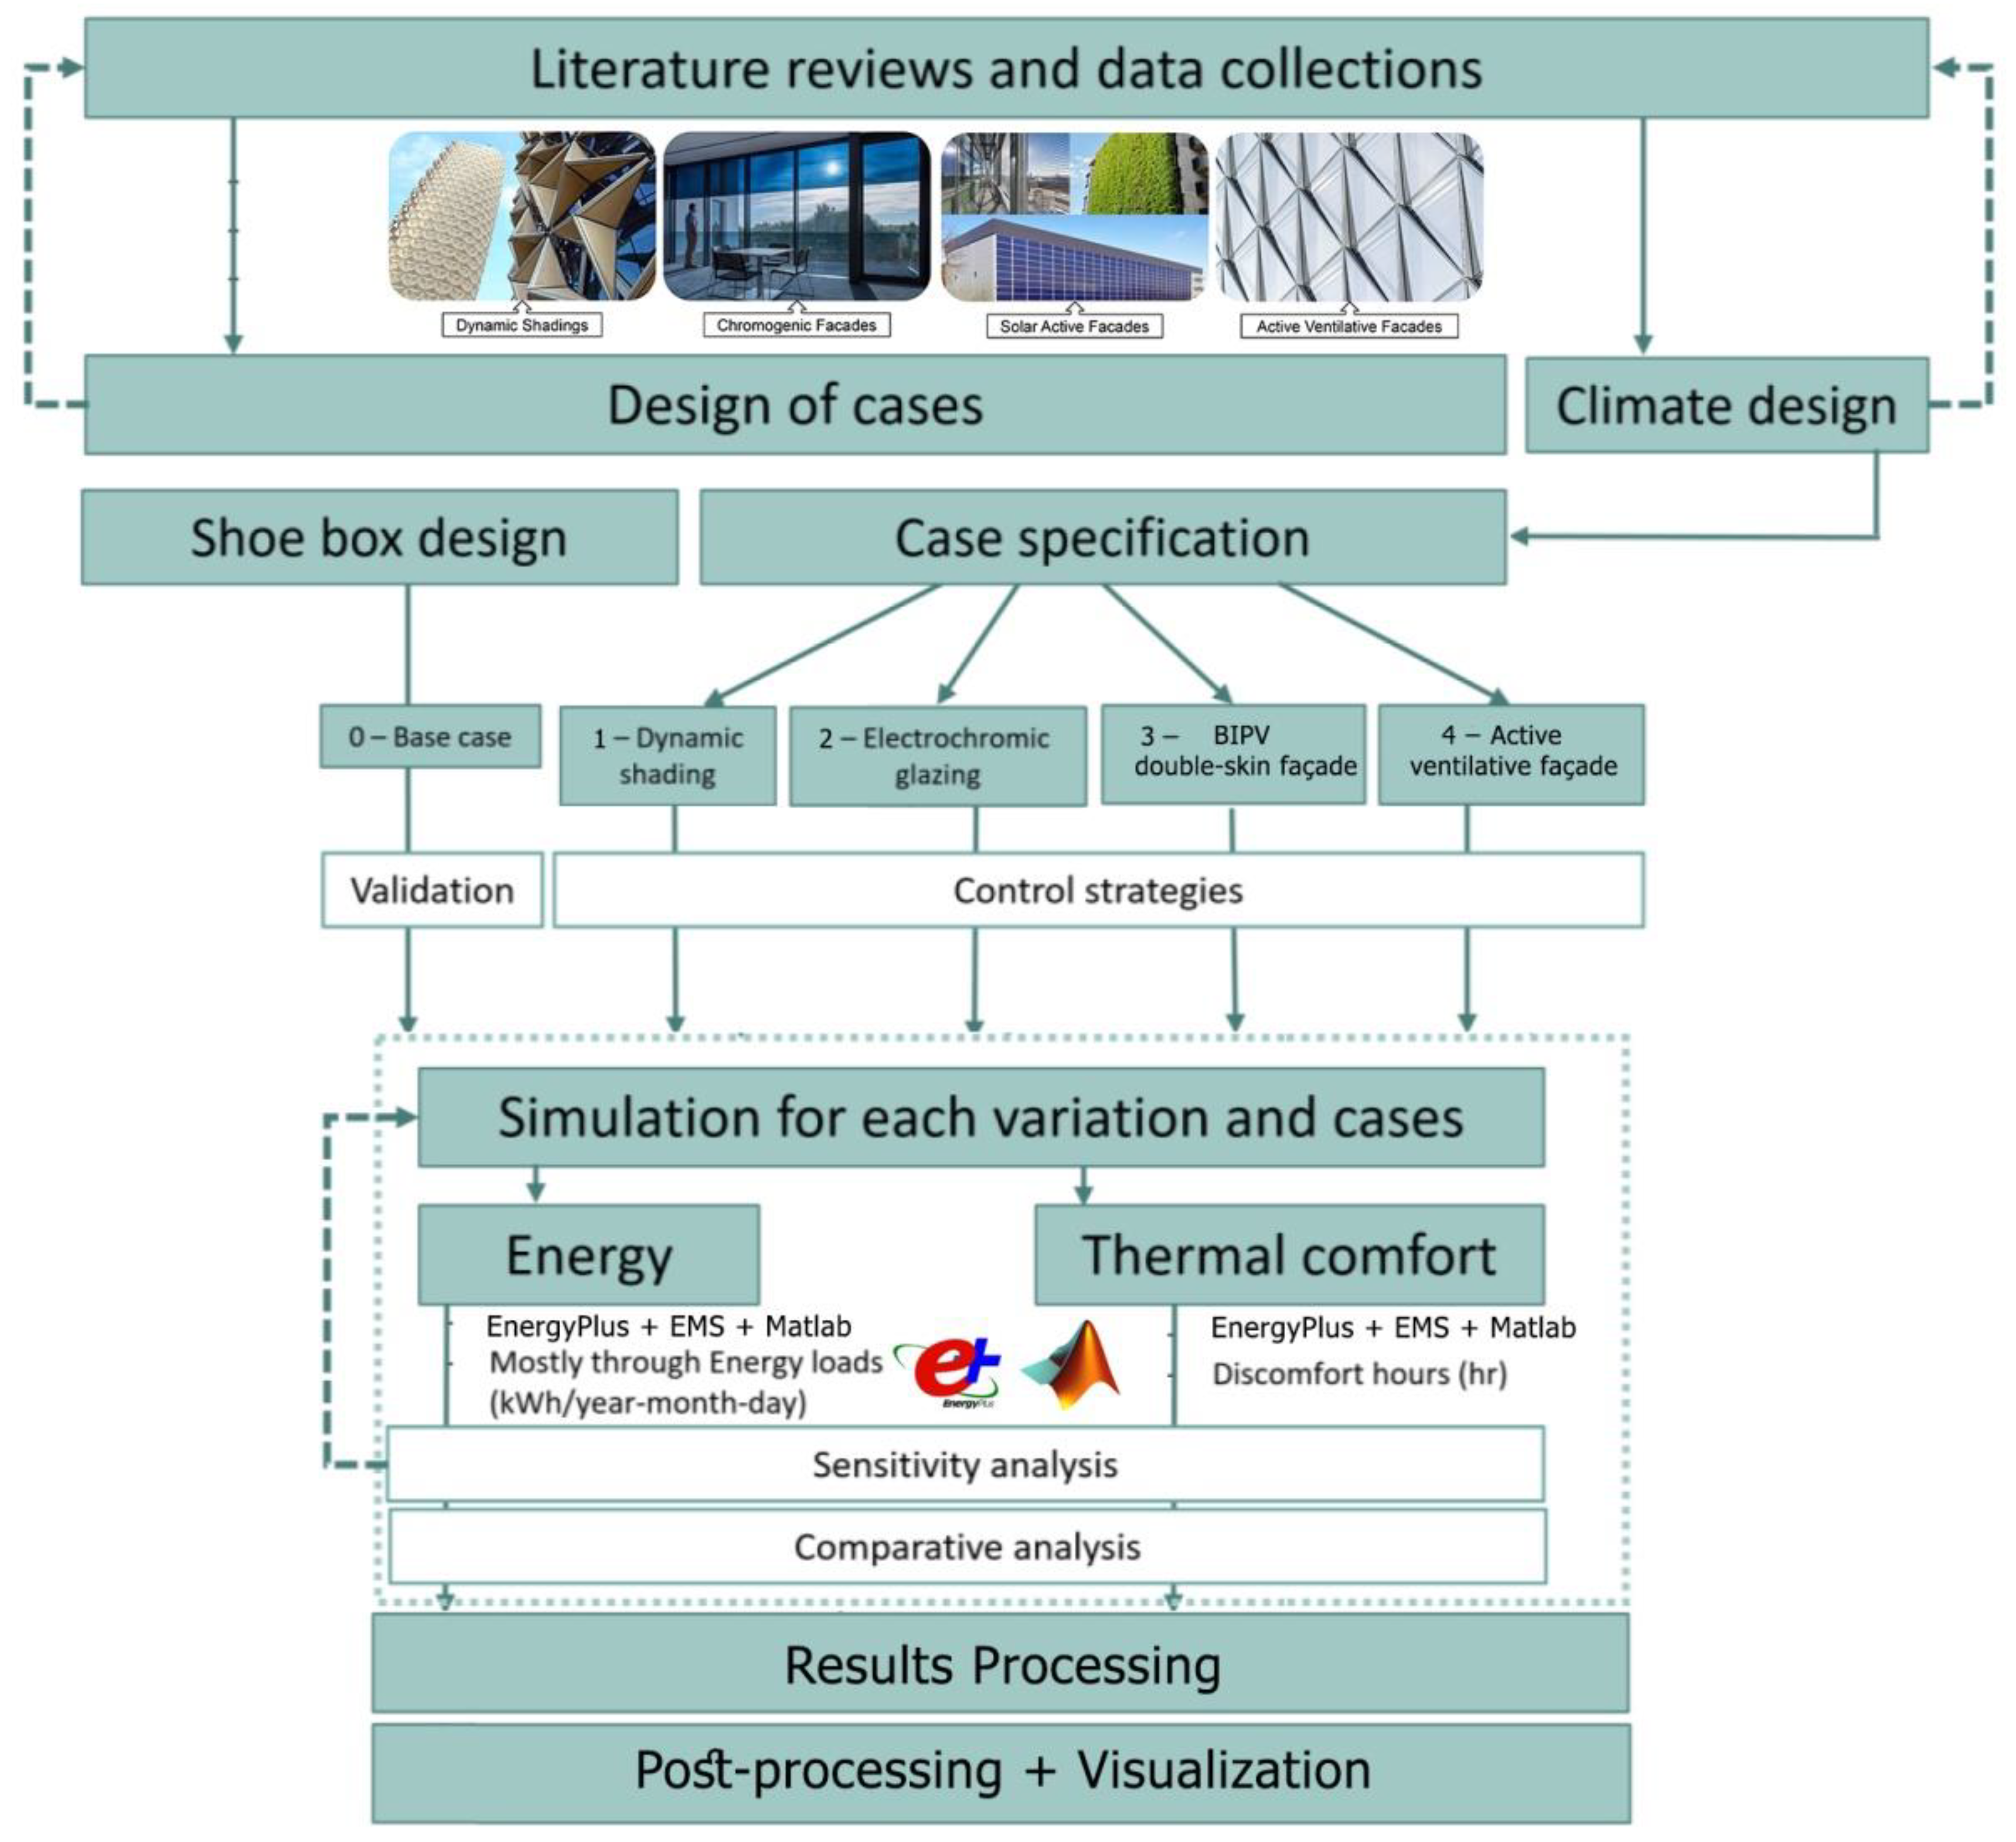
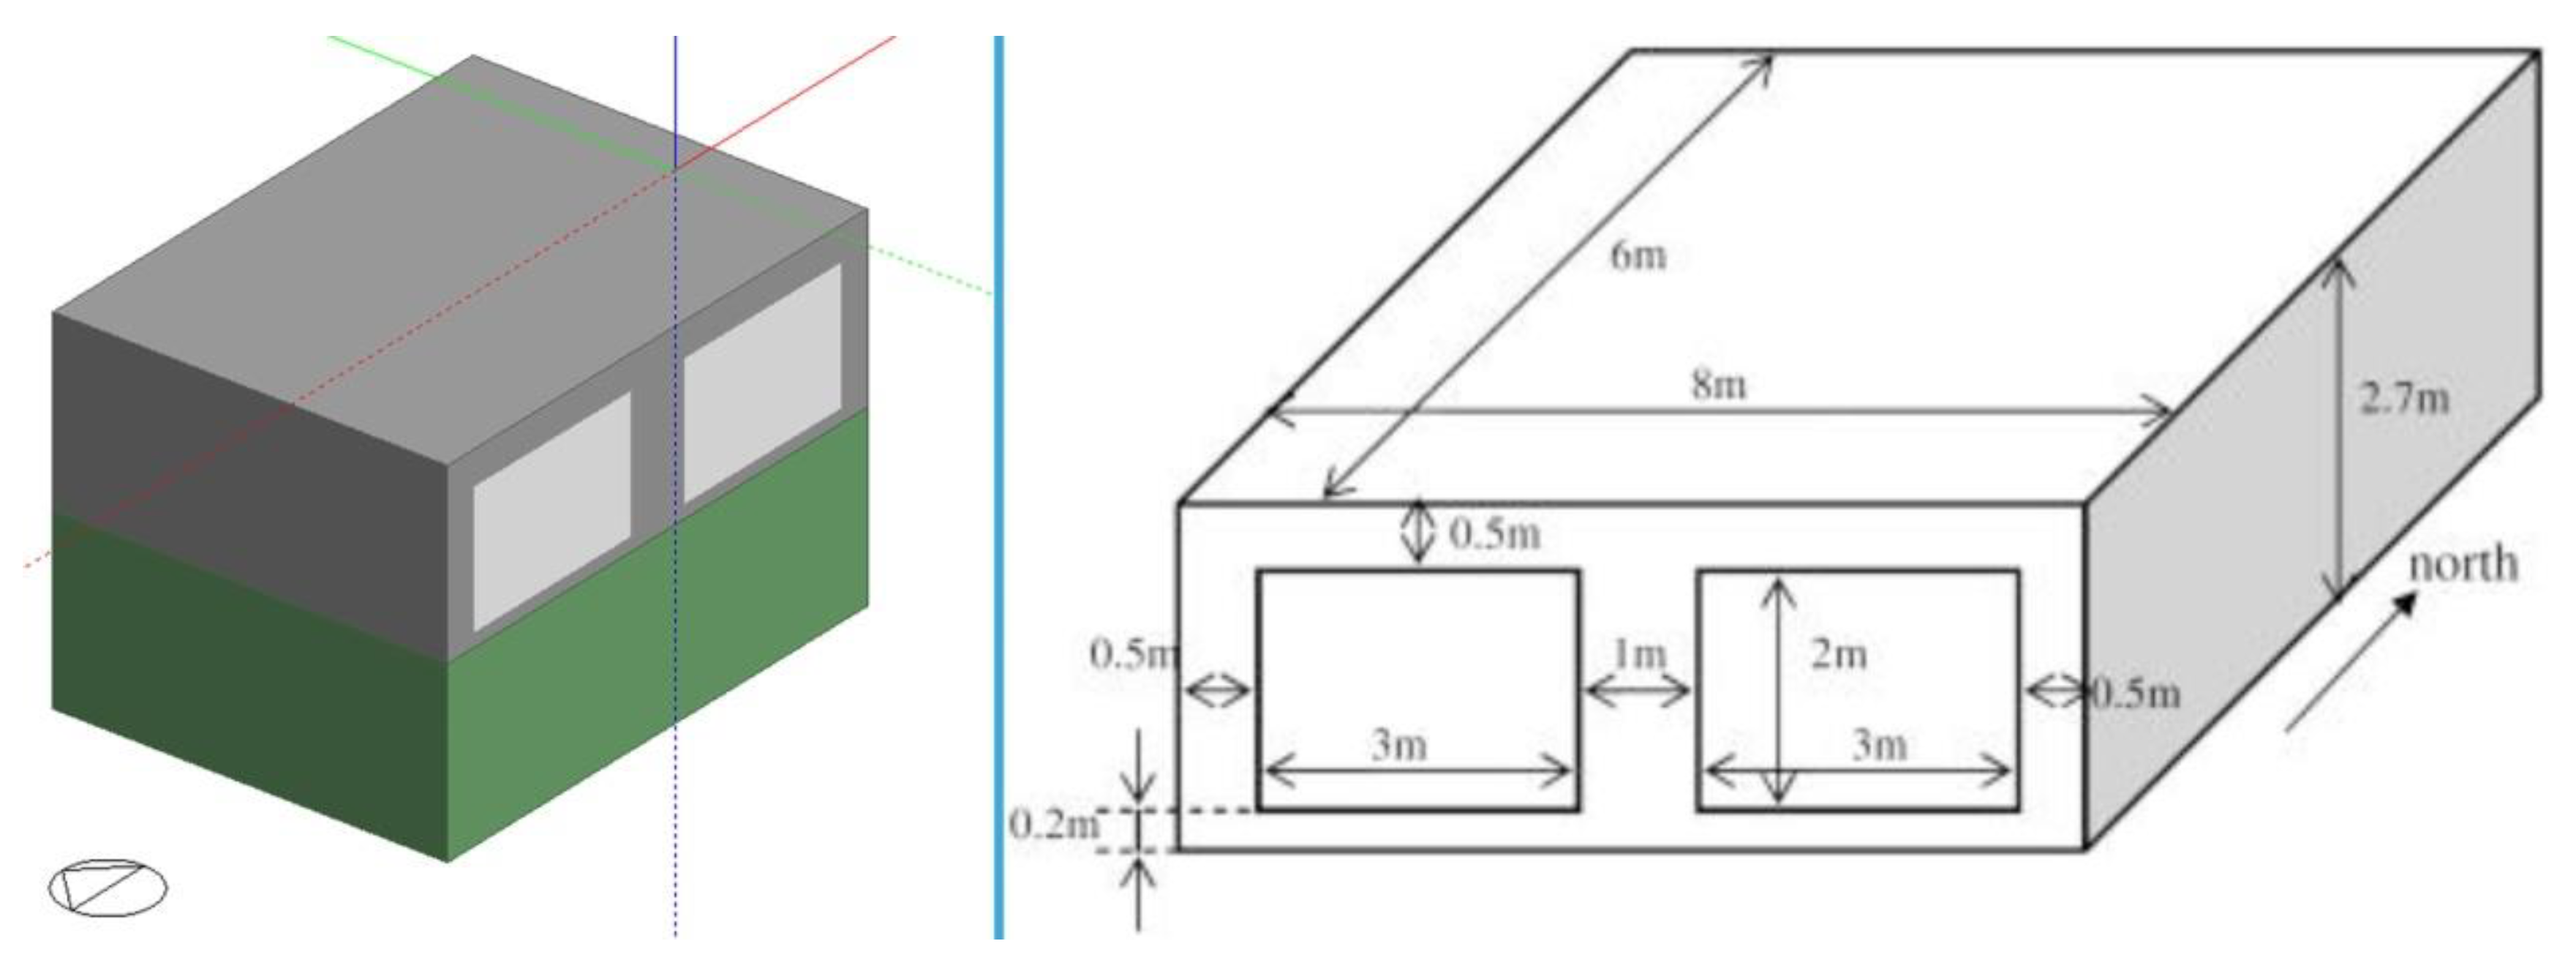
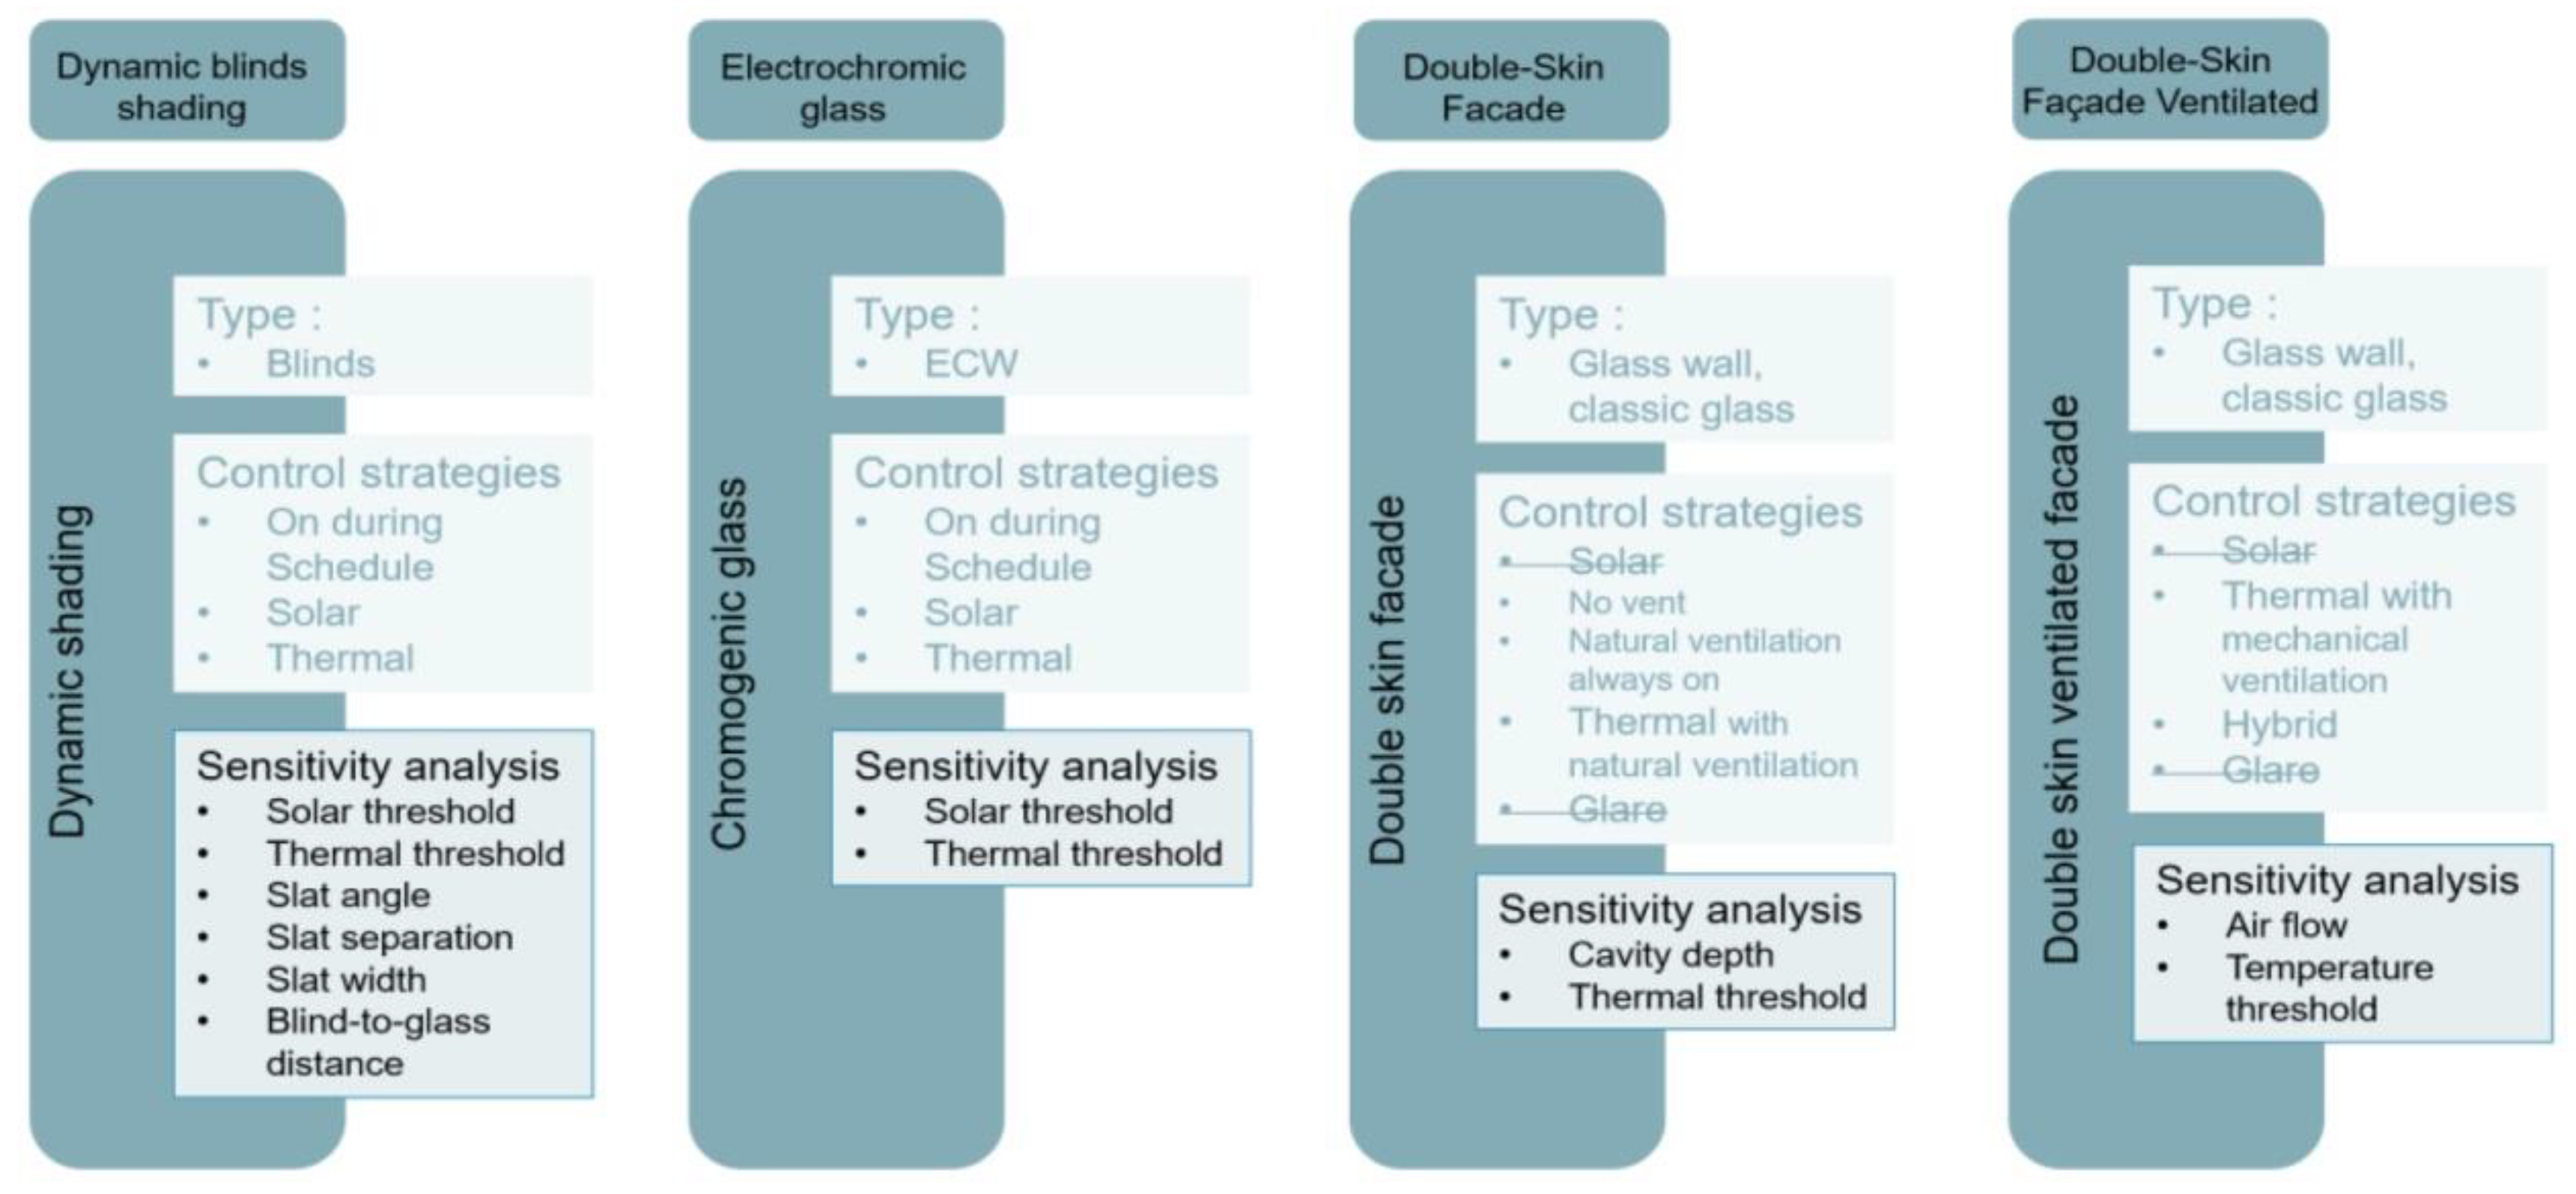
Therefore, the objective of this study is to compare the energy saving potential and overheating risk of four adaptive façade technologies in office buildings. The study scope is limited to benchmarking the performance of windows that can apply one of the four adaptive façade technologies (excluding adaptive opaque façades [16,17]); namely, dynamic shading devices, electrochromic glazing, and BIPV double-skin façade, and active ventilative façade (cavity façade) were chosen. At first, a base case, established on the BESTEST case 600, was modeled with DesignBuilder software v7.0.1.006. Then the different smart technologies and their control strategies were implemented and simulated. Different impact criteria were analyzed: energy savings and overheating risk. All simulations were performed annually and for the location of Uccle Weather Station, in Belgium’s Brussels-capital region. The following research questions guide the research article:
  • What is the influence of the adaptive façade technology choice on energy use and thermal comfort in an office building?
  • To what extent can control strategies improve comfort and reduce annual energy use for the four adaptive façade technologies?
The findings indicate that dynamic shading is the most effective technology, followed by electrochromic glazing. BIPV double-skin façade and active ventilative façade (cavity façade) are not recommended for temperature climates. Hopefully, this work can support the design decision-making of façade engineers and architects regarding the choice of adaptive façade technology. The paper contributes to the larger body of knowledge on smart and dynamic building envelopes. The study findings are considered one of the first studies comparing the different adaptive façades families and benchmarking their performance.

2. Literature Review

For the last 30 years, new building envelope materials and façade components have been more and more numerous. As a mediator between the exterior and interior, there are many functions of a façade that affect the performance of a building [18]. These innovative building façades can adapt themselves depending on the external climatic conditions and dynamic occupant requirements and ensure step-change progress of the energy performance. The COST Action TU 1403 is one of the earliest international projects that aimed to provide a general framework, standardized methods, and tools to evaluate, in a quantitative way, the performance of adaptive façade. Based on several framework and review studies [2,19,20,21], four main families can be considered dynamic building envelopes, as shown in Figure 1:
  • Automated shading devices
  • Chromogenic glazing
  • Solar active façades
  • Active ventilative façades
The following section presents the products of the four adaptive façade technologies. The short review provides insights into the state of the art of the four families of technologies and builds upon previous studies [5,22].

2.1. Automated Shading Devices

Movable shading devices can be static or dynamically controlled depending on the strategies chosen. Several studies showed that such shadings could significantly improve energy use [6,23,24] as well as the overheating risk [9] and visual comfort [25,26,27].
De Luca, Voll, and Thalfeldt analyzed the performance of different types of shading systems, fixed and dynamic, and their influence on the energy use and cooling loads for an office building located in Tallinn, Estonia [23]. Findings show that solar shading is an efficient way to control the energy use of office buildings, though with different efficacy by the static systems depending on orientation, window, and shading type. It shows that dynamic blind systems have more uniform performance and usually outperform static shading.
Other examples of notable research on solar shading include the work of Skarning et al. (2017), who mapped and compared energy, daylighting, and overheating risk for various combinations of window size and glazing properties with and without dynamic shading [9]. Vraa Nielsen investigated three types of façades (without solar shading, fixed solar shading, and dynamic solar shading) simulated with various window heights and orientations [6]. They demonstrated that the use of dynamic solar shading dramatically improved the amount of daylight available compared to fixed solar shading, emphasizing the need for dynamic and integrated simulations early in the design process to facilitate informed design decisions about the façade. Kyu Yi, Yin, and Tang (2018) showed that shading devices could significantly improve visual comfort [25]. Indeed, this paper develops a method to evaluate a new daylight control system that includes an analysis of a new dynamically tunable material that changes its phase based on ambient environmental conditions. Mostafa et al. (2016) reported the experimental results of thermal performance of residential buildings coupled with a smart kinetic shading system [24]. The results showed that this system could lead to improved shading and decreased the internal temperature of the building by about 2–3 °C. Consequently, the energy saved improved by 18–20% compared to the standard building without a shading system; the improvement in apartments with regards indoor environment quality and energy use will reflect directly on the building performance.

2.2. Chromogenic Glazing

Switchable windows can change their optical properties and thus modulate interior spaces’ solar gains or daylight by reflecting or absorbing them [3]. Several studies showed that they could significantly improve energy use, overheating risk, and visual comfort. First, Tällberg et al. (2019) reviewed the performance of smart windows with a focus on simulation studies of thermochromic, photochromic, and electrochromic technologies [7]. This study provided valuable insights by combining technology reviews with building performance simulation for a theoretical reference shoebox model. The most relevant limitation of this study is the assumptions made for the control strategies of smart window glazing. In another paper, a representative office building zone with an electrochromic (EC) glazed façade was simulated in TRNSYS and Radiance/Daysim for a large number of different combinations of design parameters (i.e., location, façade orientation, window control, window-to-wall ratio, internal gains, thermal mass, and envelope airtightness) [28]. In 2018, Casini reviewed active dynamic glazing for buildings [20]. The study analyzed electrochromic glazing technology as an alternative to shading systems and investigated their performance concerning solar and lighting control concerning the glazing color. The study focused on nanocrystal glass, liquid infill windows, gasochromic windows, elastomer-deformation tunable windows, and electrokinetic pixels windows. Finally, Feng et al. (2016) reviewed the configuration and optical and thermal properties of WO3-based gasochromic (GC) smart windows [29]. Subsequently, using the eQUEST building simulation program, the effect of the GC smart window on the energy use for a commercial office building was calculated and compared with various glazing systems currently available on the market, including the SAGE electrochromic (EC) smart window.
Switchable windows can change their optical properties and thus modulate interior spaces’ solar gains or daylight by reflecting or absorbing them [3]. Several studies showed that they could significantly improve energy use, overheating risk, and visual comfort. First, Tällberg et al. (2019) reviewed the performance of smart windows with a focus on simulation studies of thermochromic, photochromic, and electrochromic technologies [7]. This study provided valuable insights by combining technology reviews with building performance simulation for a theoretical reference shoebox model. The most relevant limitation of this study is the assumptions made for the control strategies of smart window glazing. In another paper, a representative office building zone with an electrochromic (EC) glazed façade was simulated in TRNSYS and Radiance/Daysim for a large number of different combinations of design parameters (i.e., location, façade orientation, window control, window-to-wall ratio, internal gains, thermal mass, and envelope airtightness) [28]. In 2018, Casini reviewed active dynamic glazing for buildings [20]. The study analyzed electrochromic glazing technology as an alternative to shading systems and investigated their performance concerning solar and lighting control concerning the glazing color. The study focused on nanocrystal glass, liquid infill windows, gasochromic windows, elastomer-deformation tunable windows, and electrokinetic pixels windows. Finally, Feng et al. (2016) reviewed the configuration and optical and thermal properties of WO3-based gasochromic (GC) smart windows [31]. Subsequently, using the eQUEST building simulation program, the effect of the GC smart window on the energy use for a commercial office building was calculated and compared with various glazing systems currently available on the market, including the SAGE electrochromic (EC) smart window.

2.3. Solar Active Façades

The third adaptive façade family represents solar active façades. As indicated by this name, solar active technologies are activated with the help of the sun. In addition, controlling the solar gain and sometimes the daylight also influences overheating risk and energy savings. Many studies have been conducted to improve the energy performances of Closed Cavity Façades compared to conventional façades [30,31,32,33,34].
Shi, Tablada, and Wang (2020) [35] simulated an office room in Singapore through the EnergyPlus tool and analyzed the influence of Closed Cavity Façades on energy demand. Their study proved a better visual comfort with this smart technology. Based on the dynamic simulation of the indoor environment by Yang et al. (2015), this research dynamically simulates the change of the blind inclinations and locations of the middle shading devices inside DSF in summer and their influences on ventilation rate, intermediate cavity, and indoor temperature. There are also other solar active technologies: green façades and green roofs. This study compares the cooling load reduction through GRs (green roof) and GWs (green walls) by varying the area of greenery covered on a single-story building and two high-rise buildings in Hong Kong by simulations using EnergyPlus [36].

2.4. Active Ventilated Façades

These adaptive technologies are based on ventilation, aiming to control the airflow inside the cavity, while automated operable windows aim to control the air entering the building. Besides controlling overheating risk, these technologies include active ventilative cooling as a major characteristic [2].
In Alberto’s work, a parametric study is carried out to systematically assess the impact on the building performance, geometry, airflow path, cavity depth, openings area, and type of glazing [30]. It was found that the most important aspect of the efficiency of a double-skin façade is the airflow path, and the most efficient geometry was the multi-story double-skin façade, presenting, on average, 30% less HVAC-related energy demands. Zomorodian et al. (2018) selected an optimal DSF for an office building in Tehran among proposed design alternatives differing in the façade spatial configuration, shadings, and cavity ventilation strategies by dynamic simulations [34]. The overall carbon emissions and the costs during the building’s life cycle are also assessed in different alternatives. According to the results, energy use is reduced from 7.9% to 14.8%. Finally, a paper written by Faizi, Yazdizad, and Rezaei (2014) presents the characteristics and classification of double-skin façades and their advantages and disadvantages in order to clarify whether or not these systems represent a valid approach to energy efficiency and sustainability in building or are just an architectural fad [37]. The results show that this system can reduce thermal energy in summer by providing good ventilation through its cavity (naturally or mechanically). It uses solar heat recovery to heat the building in winter; besides, it provides acoustic insulation in busy areas.

3. Methodology

Building performance simulation investigated the energy-saving potential and overheating risk of adaptable façades. Cutting-edge commercial products have been simulated with different control strategies similar to [7] and based on the work of Bertrand [38]. Figure 2 shows the methodological study conceptual framework that summarizes the study’s approach. The following sections explain the process and research methodology.

3.1. Building Model

3.1.1. Benchmark Model Specifications

The study’s comparative nature requires using an example reference building that allows benchmarking of the four adaptive façade technologies. According to Corgnati, Fabrizio, Filippi, and Monetti [39], an example reference building relies on experts’ assumptions and studies to compare and benchmark different design measures and solutions. Therefore, the base case 600 from BESTEST was chosen. BESTEST is a Building Energy Simulation Test project developed by ASHRAE standard 140-2020—Standard Method of Test for the Evaluation of Building Energy Analysis Computer Programs [40].
The materials specification and geometry of BESTEST case 600 correspond to a low thermal mass building with two windows positioned on the south wall. The model comprises a single thermal zone, and the window-to-wall ratio of the south façade is 55%. The floor is on the ground, and all surfaces are exposed to external weather and solar radiation. Figure 3 displays geometry specifications. This building model indicated in Figure 3 was considered as the benchmark case for the performance comparison of the other four models. Table 1 indicates the explicit materials component for each layer. The energy modeling was performed by DesignBuilder software v7.0.1.006 packages and then by EnergyPlus. The ground model was calculated according to ISO 13370 and ISO 13790 [41]. The climate location of Brussels, Belgium (50.8° N, 4.3° E) was selected, representing cold and mild temperate climates (Cfb = Temperate oceanic climate) as well as continental climates (Dfb = Warm-summer humid continental climate) according to Köppen climate classification. In 2020, Brussels had 218 Heating Degree Days (HDD) and 57 Cooling Degree Days (CDD) for a base temperature of 15.5 °C and 22 °C, respectively [42]. The weather file (BEL_BRU_Brussels.Natl.AP.064510_TMYx.2007-2021 of the Uccle (Brussels) weather station was used from the Belgian Royal Meteorological Institute in TMY3 format) in compliance with ISO 15927-4 [43]. The operative temperature was used for overheating risk evaluations at 20–25 °C based on ISO 17772 [44]. The simulation was conducted with hourly time steps to cover the 8760 h of the year.

3.1.2. Internal Gains and Setpoints

The building model represents an office with one occupant (0.0207 person/m2), equipment, and lighting. Occupancy schedules assume a presence from 8 am to 6 pm during weekdays. Equipment on the workstation emits 150 W, which means 3.13 W/m2, and is active only during the same schedule. Lighting is turned on from 8 a.m. to 6 p.m. with the default setting of 5 W/m2-100 lux as power density. Lighting control is active and switches off the lighting when daylight is higher than 500 lux. The 500 lux threshold is considered optimal for improving workers’ productivity [45]. Continuous lighting control is activated, from 0 to 500 lux. A linear algorithm gradually interpolates lighting power to increase when natural daylighting decreases. Overheating risk thresholds are based on the CEN 16798 PMV/PPD model of category II. Setpoint temperatures for the room are set to 21 °C for heating and 25 °C for cooling and are kept for the study cases.

3.1.3. Energy Performance and PV Production

Since the scope of the analysis was to compare the energy performances of the different façade technologies, the results included only heating and cooling energy use, together with the electrical energy converted by the PV system for the BIPV façade. The BESTEST case assumes that the office is heated with natural gas as fuel and cooled with electricity. The Coefficient of Performance (COP) equals 0.5 and 4.5, respectively, for the heating and cooling systems. The heating and cooling systems work continuously throughout the day. Humidification/dehumidification does not occur, and domestic hot water heating is excluded in the model. Losses due to infiltration or thermal bridges or other system losses are not considered to ease the comparison of each technology.

3.2. Façade Technologies Modeling

Modeling dynamic and adaptive façade technologies is a complex task that requires different building energy model software. Therefore, several custom-made modeling workflows and scripts were used to represent the optical properties and control mechanisms under different boundary conditions. Various layers of each façade technology of the windows were modeled in detail concerning the optical and thermal parameters. The following subsections provide further explanations for the modeling assumptions and limitations of the four adaptive façade technologies.

3.2.1. Technology 1: Dynamic Shading

Dynamic shading technology controls or automates external and/or internal solar shading devices. In this study, automated blinds with low reflectivity were chosen as shading devices. Different parameters influence blinds as slat angle or slat thickness. Table 2 indicates the default input data of the dynamic shading chosen. Appropriate activation thresholds of the external blind for energy-saving were based on the review of similar studies [46,47]. A custom-made algorithm was created for the shading control using EMS, a high-level control method available in EnergyPlus influenced by the study of Karlsen [48]. Sensors were placed, and the generated simulation data was used to direct various control actions.

3.2.2. Technology 2: Electrochromic Window

The dark state of electrochromic glazing was modeled, taking into account the glazing’s wavelength and optical properties, including the refractive index of the materials contained in the functional layer [49]. Table 3 lists the glazing switching thresholds from clear to dark. The optical properties of both states are programmed based on manufacturers’ data sheets [7]. Changing the properties of the pre-defined electrochromic switchable’s subtype makes it possible to model the dark state of electrochromic glazing. The clear state can be modeled by modifying the optical properties of the window’s glazing type.
The optical properties of electrochromic glazing come from an existing study [7] which took properties from real manufacturers. Thus, these were kept.

3.2.3. Technology 3: BIPV Double-Skin Façade

The non-ventilated BIPV-DSF model in EnergyPlus was integrated onto the base case building model. The principle of modeling a double-skin is based on adding an internal partition or cavity into the base model. A large window covering almost the entire exterior wall surface is modeled. Some assumptions made for the BIPV double-skin façade model are listed below and in Table 4, based on Yang et al. (2020) [33]:
  • The base model assumes no air exchange between the cavity zone and the occupied space. Thus, the airflow path is considered Outdoor Air Curtain (OAC). No hot air was extracted from the air cavity, which was a barrier to heat loss in the cold seasons [30].
  • Cavity depth was set to 0.6 m as the optimal range of cavity depth in the sense of energy use [30,50].
  • Semi-transparent PV glazing with comparable VLT was selected for the study. The selected VLT values of the PV glazing were 30% which was based on previous studies [33,50].
  • Each of the two skins had an opaque portion (upper and lower) which represented, in reality, the ventilation louver in the closed position.

3.2.4. Technology 4: Active Ventilative Façade

A ventilated closed cavity façade was modeled in EnergyPlus. A closed cavity façade features a vented active façade or an air-exhaust façade with an automated interior solar shade similar to the active ventilative façade technology implemented in Germany’s Festo Building Esslingen site [52]. A ventilation channel through which waste air is exhausted is between the interior screen and the exterior glass. The cavity is also fed through the ceiling plenums, where exhaust air from the offices is expelled. Heat extraction through mechanical ventilation is programmed during winter and summer. The automated sun-shading generates a variable g-value, enabling summer heat protection and lowering the indoor temperature and cooling loads.
Another example can be found in the Antwerp Court House (2006). The curtain wall is a double-skin façade with an integrated ventilation system for nighttime cooling. Each office also has access to window ventilation during the daytime.

3.3. Control Strategies

Control strategies are the backbone of adaptive façade systems. They comprise different parameters that interact with the indoor and outdoor conditions, resulting in high complexity levels. Therefore, their programing depends strongly on the simulation software and requires additional high-level methods of modeling capabilities [53,54]. The advantage of using EnergyPlus is that the software has modeling objects that model dynamic shading, switchable glazing, and closed cavity. For each façade technology mode, numerous pre-defined control strategies were tested, facilitating the comparative analysis.
The four tested façade technologies embed automated controls for the occupants’ visual and thermal comfort. The control parameters used in this study include:
  • Occupancy schedule = 8:00–18:00 during working days
  • Vertical solar radiation sensor > 150 W/m2
  • Operative temperature OT > 25 °C
  • Glare > Index 22 and 150 W/m2
The control strategies were time-scheduled to operate the different technologies. Thresholds limits listed above were determined according to ISO 52016-3 [43] standard and other reference studies [7,33,48,55,56]. Furthermore, according to a study made in Germany in 2003, individuals activated their blinds to avoid incoming solar gains when they reached 450 W/m2 [57]. The operative temperature threshold of 25 °C was chosen for activating shading. The glare index of 22 was activated in EnergyPlus. Depending on the control strategy, the technology was activated when exceeding the threshold limits to decrease heat gain and lighting under this threshold. Blinds and shades cover all the windows except its frame.
On the contrary, when the shading device is ‘Off’, it is assumed to cover none of the windows. For switchable glazing, ‘On’ means that the glazing is in the fully switched dark or opaque state, while ‘Off’ means that it is in its clear state [49]. The detailed parameterization of the control strategies is described below.

3.3.1. Automated Shading: Dynamic Shading

  • DS 0—Dynamic shading operates based on a schedule
  • DS 1—solar = Dynamic shading operates based on solar control
  • DS 2—OT = Dynamic shading operates based on operative temperature
  • DS 3—Glare = Dynamic shading operates based on glare control

3.3.2. Chromogenic Glazing: Electrochromic Window

  • ECW 0—Electrochromic glazing operates based on a schedule
  • ECW 1—solar = Electrochromic glazing operates based on solar control
  • ECW 2—OT = Electrochromic glazing operates based on operative temperature
  • ECW 3—Glare = Electrochromic glazing operates based on glare control

3.3.3. Solar Active Façade: BIPV Double-Skin Façade

  • DSF 0—BIPV double-skin façade operates based on a schedule
  • DSF 1—solar = BIPV double-skin façade operates based on solar control
  • DSF 2—OT = BIPV double-skin façade operates based on operative temperature

3.3.4. Active Ventilative Façade: Ventilated Closed Cavity Façade

  • DSFV1-f25 = Ventilated closed cavity operates based on a schedule
  • DSFV2-f25 = Ventilated closed cavity operates based on solar control
  • ECW 2—OT = Ventilated closed cavity operates based on operative temperature
It is assumed that the only difference between double-skin façades (DSF) and double-skin ventilated façades (DSFV) is the ventilation mode. Thus, the parameters that will be studied are the airflow and the temperature threshold. Since this paper aims to investigate energy-saving potential and overheating risk, the control modes according to COST Action TU 1403 [58], these control strategies are time-scheduled control for the first one and hard-coded extrinsic control for the others. Thresholds are determined regarding standards and other studies [48,59,60]. The results correspond to the following control strategies:
  • Occupancy schedule means that the technologies are always on during occupied hours.
  • Solar radiance
  • Operative temperature: This last option is modeled by applying the control type inside air temperature, and then, when simulating, temperature control is set on 2–Operative temperature
  • Glare
Furthermore, a study made in Germany in 2003 investigated the moment when individuals tended to use electric lighting. They all activated their blinds to avoid incoming solar gains when they reached 450 W/m2 [57].
Finally, based on the standard CEN 16798, the optimal indoor temperature ranged between 21 and 25.5 °C [61]. However, without clear data for the operative temperature, the threshold, 25 °C, was used. No threshold was needed for glare control. Table 5 indicates the threshold for each control strategy. The control names are based on the control strategy labeling system of DesignBuilder.
Planning a schedule for using these smart envelopes would be a solution to optimize their use (Favoino et al., 2018) [58]. Therefore, dynamic envelopes could be switched on or activated during the schedule by taking into account control strategies, as shown in Figure 4.

3.4. Sensitivity Analysis

A sensitivity analysis was conducted to identify the most influential parameters that can lead to energy demand reduction exceeding 10% compared to the base case. The sensitivity analysis was performed only to evaluate the variance influence on energy use and overheating risk. Figure 5 presents the sensitivity analysis parameters chosen for the different cases and resume control strategies available and simulated for each case.
The Morris method was used to conduct a global sensitivity analysis where variables vary over the entire domain [62]. The Morris method is an efficient screening method that requires low computing costs with many inputs. The Morris method is based on repetitions of a one-at-a-time (OAT) design with a sequential variation of the inputs. The variation in the model output due to the change of input parameter is called the elementary effect [62]. The EE of a model y = y(x1, …, xk) with input parameters xi is defined as below:
EEi = y ( x 1 ,   x 2 ,   ,   xi 1 ,   xi   +   Δ ,   xi + 1 ,   ,   xk )   y ( x 1 ,   x 2 ,   ,   xk )   Δ
In this study, we adopted r = 5 considering the computation cost so that there are six repetitions of elementary effect calculated for each input variable (k = 12). The total number of simulations was r(k + 1) = 65.

4. Results

The results of the base case simulation and the four façade technologies are presented in this section, including the post-processing and visualization of the energy use and overheating risk.

4.1. Comparative Analysis

Figure 6 shows each case’s relative thermal energy performance and their control strategies by taking into account the sensitivity analysis. Dynamic shading with schedule control (DS 0) indicates the best thermal energy performance with 68.7% compared to the base case. The solar control strategy (ECW 1) reveals the most efficient energy performance with 72.3% compared to the base case for the electrochromic cases. Finally, the double-skin façade helps to decrease the energy demand but with a more negligible impact than electrochromic and dynamic shading cases. However, the leading cases are BIPV double-skin façade with schedule control (DSF 1) and active ventilative closed cavity façade (DSFV 2), 87.2% and 84.2% of the energy use compared to the base case, respectively. The PV electrical production is considered in the net energy saving for the BIPV-DSF case. This comes from Closed Cavity Façades, which mainly influence the heating loads lower than the cooling energy loads. On the contrary, the dynamic shading and electrochromic glazing technologies influence mainly the cooling loads.
The overheating risk is shown for all cases and their control strategies in Figure 7. Contrary to the energy performance, the double-skin façade cases improve the most overheating risk performance with an overheating risk between 88.6 and 88.4% compared to the base case. The electrochromic and dynamic cases have poor impacts on overheating risk, with an improvement of less than 4%. However, the solar control strategy damages this overheating risk for both dynamic shading and electrochromic glazing with a percentage of 107.0% and 103.1% compared to the base case.

4.2. Dynamic Shading

4.2.1. Energy Loads

The first three control strategies are almost the same heating demand throughout the year as the base case. The difference is more visible in the case of cooling energy loads. The behavior of the dynamic cases for cooling energy loads is similar to the electrochromic cases’ behavior, with the best results for schedule control (DS 0) closely followed by the Operative temperature control (DS 2). Once again, dynamic shading with glare control (DS 3) consumes the same amount of cooling energy as the base case. Thus, this control strategy will not be studied deeper with the surface temperatures and solar radiation.
As for electrochromic glazing, the more technology can save cooling energy loads, the higher the surface temperatures and the smaller the gaps. The difference between the surface temperatures is lower in each case compared to the base case. For example, during July, the inner and outer surface difference was 3°C for the base case and 1°C for the DS 2 case. Moreover, dynamic shading devices drastically reduce the transmitted solar radiation shown in the electrochromic case. The transmitted solar radiations are practically equal for dynamic shading with schedule control (DS 0) and operative temperature control (DS 2). Dynamic shading with solar control (DS 1) has higher solar radiation transferred to the room and has worse energy use performance.
Finally, Table 6 indicates results related to the energy loads. Dynamic shading with schedule control (DS 0) and operative temperature control (DS 2) has the best performance. As for electrochromic glazing, glare control does not change the energy use. This table shows that dynamic shading helps avoid overheating the room.

4.2.2. Overheating Risk

Table 7 presents the discomfort hours for dynamic shading cases. These technologies do not have a significant impact on overheating risk. Moreover, as for the energy loads analysis, DS 0 and DS 2 have the best performance related to overheating risk with a minimal difference. Discomfort hours with summer clothing slightly increase for all control strategies but even more for schedule control (DS 0). Discomfort hours with winter clothing decrease slightly.

4.3. Electrochromic Glass

4.3.1. Energy Loads

The simulations give almost the same heating energy load results as the base case. Electrochromic glazing with glare control (ECW 3) seems to have similar heating energy loads to the base case. Indeed, the annual heating demand is 3804 kWh for both. Thus, EW3 will not be studied further.
Cooling energy loads are significantly lower for the three first cases of electrochromic glazing with an annual decrease of 45.5%, 50.2%, and 44.7% for schedule control, solar control, and operative temperature control, respectively. As for heating energy loads, the glare control strategy does not change the cooling energy loads from the base case.
By comparing the solar radiation absorbed by the glazing, the implementation of electrochromic glazing decreases significantly the solar radiation transmitted to the room. Figure 8 shows a more linear behavior for electrochromic cases and even more when cooling energy loads are smaller. The electrochromic case with schedule control (ECW 0) closely followed by operative temperature control (ECW 2) has the best performance regarding energy and thus has smaller transferred solar radiation.
Table 8 indicates the energy simulation results for the base case and electrochromic cases. The percentage of energy compared to the base case is calculated. This percentage is always calculated as the following Equation:
{ Value   of   the   case } { Value   of   base   case }   ·   100 = i m p r o v e m e n t   c o m p a r e d   t o   b a s e   c a s e   i n   %
This table shows that electrochromic glazing remarkably reduces the annual and significantly cooling energy loads by avoiding overheating.

4.3.2. Overheating Risk

Table 9 displays overheating risk performance for electrochromic cases. The first control strategy (ECW 0) brings better overheating risk by comparing the results with the base case. Nevertheless, the difference is minimal and does not exceed 4%. Electrochromic glazing with solar control (ECW 1) brings the worst overheating risk with a percentage of 107% compared to the base case. Furthermore, as for the energy loads, electrochromic glazing with glare control (ECW 3) does not change the results.

4.4. BIPV Double-Skin Façade

4.4.1. Energy Loads

The BIPV double-skin façade decreases the heating energy demand, but the control strategies seem to influence this demand negatively. Moreover, contrary to electrochromic and dynamic shading cases, a simple or naturally ventilated BIPV double-skin façade has a small influence on the cooling energy loads. Table 10 indicates the results related to the energy loads. A BIPV double-skin façade helps to improve a significant way energy performance. The improvement is more significant in the case with control strategies. BIPV double-skin façade with schedule control (DSF 1) seems to have the best results related to energy use. A BIPV double-skin façade without any ventilation (DSF 0) helps decrease the heating energy loads, but the cooling energy loads are higher by 108% compared to the base case.

4.4.2. Overheating Risk

Table 11 reports the discomfort hours for the BIPV double-skin façade cases. A BIPV double-skin façade significantly improves overheating risk. A naturally ventilated BIPV double-skin façade with operative control (DSF 2) has the best performance. Closed Cavity Façades mostly reduce the discomfort hours with summer clothes and with summer and winter clothes which means that they mostly improve the overheating risk in summer.

4.5. Active Ventilated Closed Cavity Façade

4.5.1. Energy Loads

The heating energy loads for the different double-skin façade cases are lower for both cases and almost equal, as shown in Table 12. Legend corresponds to:
  • DSFV 1—Only mech. = Mechanically ventilated closed cavity façade with operative temperature control
  • DSFV 2—hybrid = Naturally and mechanically (=hybrid) ventilated closed cavity façade with operative temperature control
Moreover, mechanical and hybrid ventilation does not impact the cooling energy loads. Finally, a closed cavity façade helps to improve the energy performance, and natural ventilation increases even more, the performances. There is no difference between a naturally or mechanically ventilated closed cavity façade. However, hybrid ventilation shows a better performance in terms of energy-saving with 86.1% of the energy loads compared to the base case. The surface temperatures inside the cavity exhibit higher values than the inside surface. The cavity can act as a buffer zone that will store heat.

4.5.2. Overheating Risk

Double-skin façade helps to improve overheating risk performance. Table 13 gathers the discomfort hours of closed cavity façade with mechanical and hybrid ventilation. It shows that the difference between these two ventilation modes does not affect the results.

4.6. Sensitivity Analysis

The sensitivity of control strategies’ thresholds was investigated for each case.

4.6.1. Dynamic Shading

The dynamic shading with schedule control (DS 0) has the best performance regarding energy loads, but dynamic shading with operative temperature control (DS 2) has the best performance related to overheating risk. However, the thresholds and slats properties can vary and change the results.

DS 1—Solar Threshold Variation

Table 14 helps determine the most efficient solar threshold, which is 300 W/m2-K. This value seems to be the best compromise between energy use and overheating risk.

DS 2—Operative Temperature Threshold Variation

The differences in the sensitivity analysis results of the operative temperature threshold variation of the dynamic shading case are minimal and almost continuous for overheating risk and energy use. For an operative temperature threshold of 18 °C, the annual loads are 6242 kWh and the total hours of discomfort are 4139 h. For an operative temperature threshold of 26 °C, the annual loads are 6386 kWh and the total hours of discomfort are 4185 h.
The difference between the chosen thermal thresholds is less than 2% for energy demand and overheating risk. Thus, it is assumed that the dynamic shading case is not sensitive to this variation.

DS 2—Slat Angle Variation

The slat angle does not significantly impact energy use and overheating risk. Concerning the base case, the annual loads were 9091 kWh and the total hours of discomfort were 4207. For a slat angle of 15°, the annual loads were 6309 kWh, and for a slat angle of 75°, it was 6298 kWh. The total hours of discomfort were 4112 and 4101, respectively, for a slat angle of 15° and 75°. Thus, despite the small differences, the total loads reduction and overheating risk reduction are higher for an angle of 75° (total loads reduction of 69.3% and overheating risk reduction of 97.6% compared to base case).

DS 2—Slat Separation Variation

The slat separation does not have a significant influence on the impact criteria. Indeed, for the base case, the annual loads were 9091 kWh. When the slat separation was 0.5 cm, the annual loads were 6325 kWh, and when it was 5 cm, the annual loads were 6638 kWh. Thus, the variation influences overheating risk and energy use by less than 1% until a slat separation of 5 cm. However, the cooling loads increase when the salt separation is high, as shown in Figure 9. Thus, the settings of the reference case were kept, i.e., a slat separation of 1875 cm.

DS 2—Slat Width Variation

The width of the slat can vary. This variation influences the energy loads and especially the cooling loads. If the slats are too thin, the cooling energy loads increase significantly. By changing the slat width from 0.5 cm to 5 cm, the annual loads decreased by more than 15%, but the overheating risk varied by less than 2%. Indeed, with a slat width of 0.5 cm, the annual loads were 7689 KWh and the total hours of discomfort were 4185 h. Moreover, when the slat width was 5 cm, the annual loads were 6322 KWh and the total hours of discomfort were 4104 h. The best results concerning the total reduction load were obtained with a slat width of 2.5 cm (69.4%), and the best results concerning overheating risk reduction were obtained with a slat width of 5 cm (97.6%).

DS 2—Slat Blind-to-Glass Distance Variation

Finally, the last sensitivity analysis was made for the dynamic shading case concerning with blind-to-glass distance of the slat. There were no significant influences on this parameter. For a distance of 0.02 cm, the total loads’ reduction and the overheating risk reduction compared to the base case were 70.3% and 97.6%. For a distance of 0.2 cm, the total loads’ reduction and the overheating risk reduction compared to the base case were 68.9% and 98.2%.

4.6.2. Electrochromic Glass

Regarding the electrochromic glazing cases, it can be concluded that ECW with schedule control (ECW 0) has the best performance related to energy loads and overheating risk. However, the threshold of the control strategies could be varied.

ECW 1—Solar Threshold Variation

As shown in Table 15, the solar threshold has an essential impact on the energy demand and a small impact on overheating risk. By applying a solar threshold of 150 W/m2-K, the energy loads decrease, and by comparing it with the results obtained in Table 6, ECW 1 could have better results than ECW 0. The discomfort hours increase by more than 10%. According to this table, the reference case is the best compromise.

ECW 2—Operative Temperature Threshold Variation

The thermal threshold does not seriously impact the energy use except for the thermal threshold of 26 °C, as shown in Table 16. However, the indoor temperature is assumed to be appreciated between 21 and 25.5 °C [63]. Thus, 26 °C seems to be a too high threshold, even if it is the operative temperature and not the indoor temperature. Applying a thermal threshold of 20 °C is the best energy use and overheating risk option. Nevertheless, it can be observed that the overheating risk variation was less than 3%, and the energy use difference was less than 1% between 18 and 24 °C compared to the reference case.

4.6.3. BIPV Double-Skin Façade

According to the results given for the BPIV double-skin façade, the façade with schedule control (DSF 1) had the best performance related to energy loads, and the BPIV double-skin façade with operative temperature control (DSF 2) had the best performance related to overheating risk. It is assumed that the schedule could not be varied since the analysis was made for office buildings.

DSF2—Cavity Depth Variation

The larger the cavity is, the smaller the energy loads, especially the cooling loads. Overheating risk is poorly influenced, and energy use can decrease by 14.8% from a variation of 1 m to 0.25 m of the cavity depth. If the cavity is larger, the annual loads will decrease more. Indeed, with a depth of 1 m, the total loads’ reduction is 88.4%, and the overheating risk reduction is 86.6%. Moreover, with a depth of 0.25 m, the total loads’ reduction is 103.2%, and the overheating risk reduction is 86%.

DSF2—Operative Temperature Threshold

The thermal threshold of natural ventilation does not impact overheating risk or energy demand. There is an increase of less than 0.5% for energy demand and overheating risk from 18 to 26 °C (8022 kWh and 8042 kWh of annual loads and 3649 h and 3645 h discomfort).

4.6.4. Active Ventilated Closed Cavity Façade

The overheating risk is improved when applying mechanical (DSFV 1) or hybrid ventilation, but the difference between the two cases can be neglected. However, these results can be linked to some parameters. Thus, the parameters studied are the mechanical airflow and the thermal threshold.

DSFV 1—Mechanical Airflow

The energy demand and especially cooling loads decrease by applying a higher airflow rate inside the cavity. This energy demand can vary from 7.2% for an airflow rate between 3 and 25 ac/h. The overheating risk is not influenced by airflow rate since the difference is less than 0.2% between 3 and 25 ac/h.

DSFV 1—Operative Temperature Threshold

This case is not sensitive to the variation of the operative temperature control thresholds. The percentage of energy use and overheating risk presents a poor reduction. For example, between 18 °C and 26 °C, the annual loads vary from 8023 kWh to 8043 kWh, i.e., a total load reduction of 88.3% and 88.5%, respectively, compared to the base case.

DSFV 2—Mechanical Airflow of Hybrid Ventilation

Contrary to the mechanical ventilation case, the influence is smaller with an energy demand that varies from 5.1% between 3 and 25 ac/h against 7.2% for the mechanical ventilation. Changing the airflow rate does not induce a difference related to the discomfort hours. The performance is improved for a high airflow rate as in the first case.

DSFV 2—Operative Temperature Threshold

Finally, the last sensitivity analysis is made on the operative temperature threshold variation but for the double-skin façade with hybrid ventilation. The relative energy use varies from 5.1% between 3 and 25 ac/h while overheating risk does not change.

5. Discussion

The findings of this study confirm the saving potential of dynamic shading and electrochromic glazing in temperate climates. Among the four compared façade technologies for an office building in Brussels, controlled external blinds and electrochromic glazing had a similar performance. The choice of the control strategy is strongly influential. The following sections summarize the main study findings and provide practical recommendations for façade designers.

5.1. Summary of the Main Findings and Recommendations

The main findings highlighted by the study are:
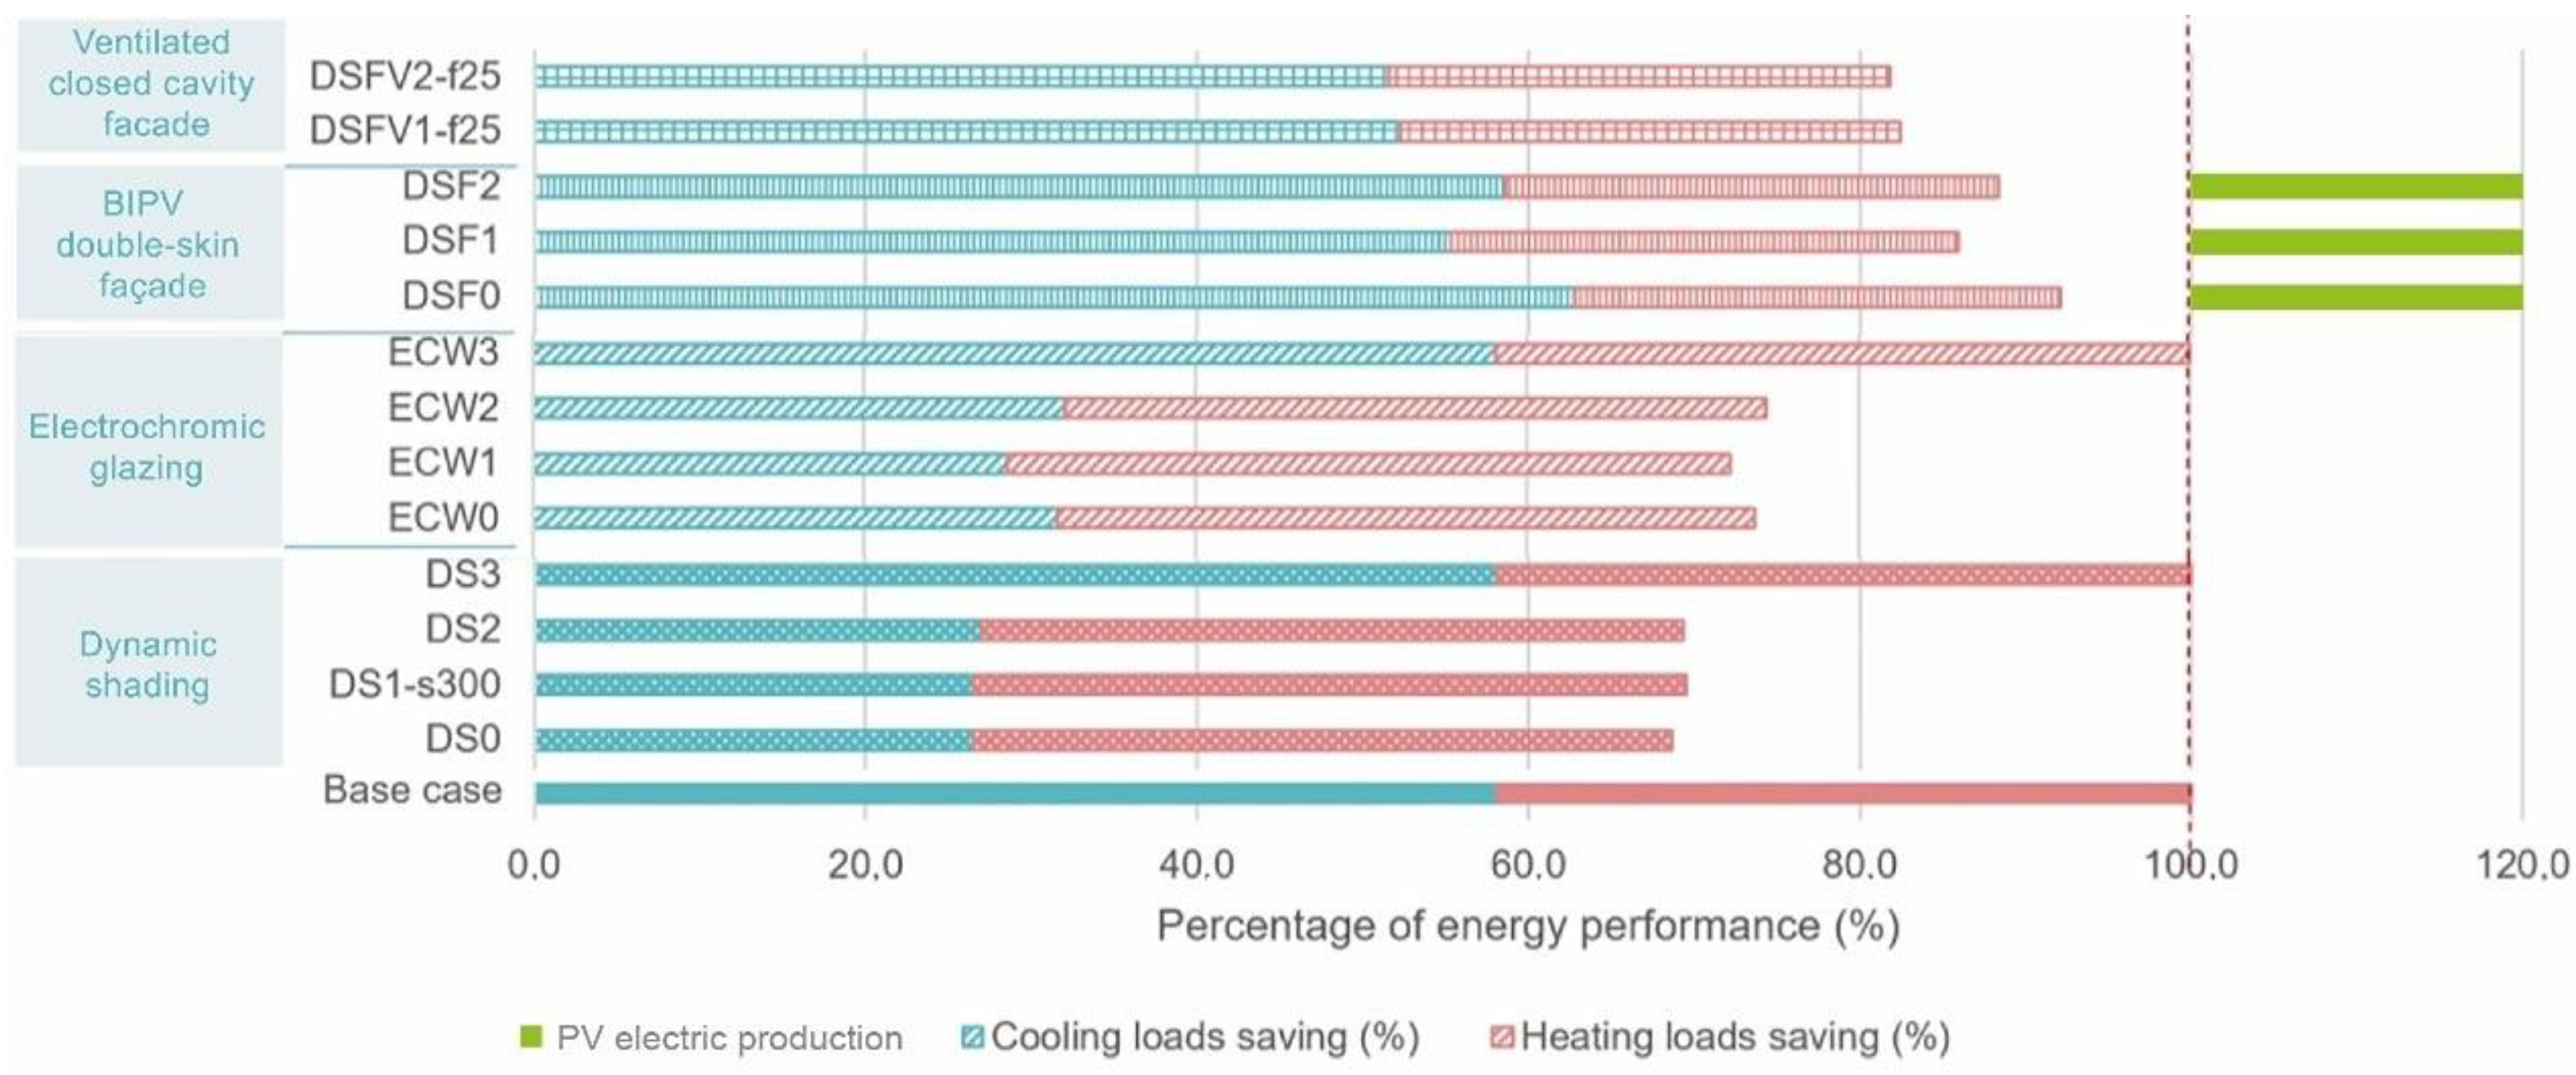
  • Dynamic shading and electrochromic glazing have the best energy performance, reducing the total annual loads between 26.3% and 31.3%. Both façade technologies reduce the cooling energy demand by 44.7% and 54.4%.
  • Dynamic external blinds combined with the scheduled control strategy (DS 0—Dynamic shading operates based on a schedule) are the most effective façade technology that reduces energy use and overheating risk.
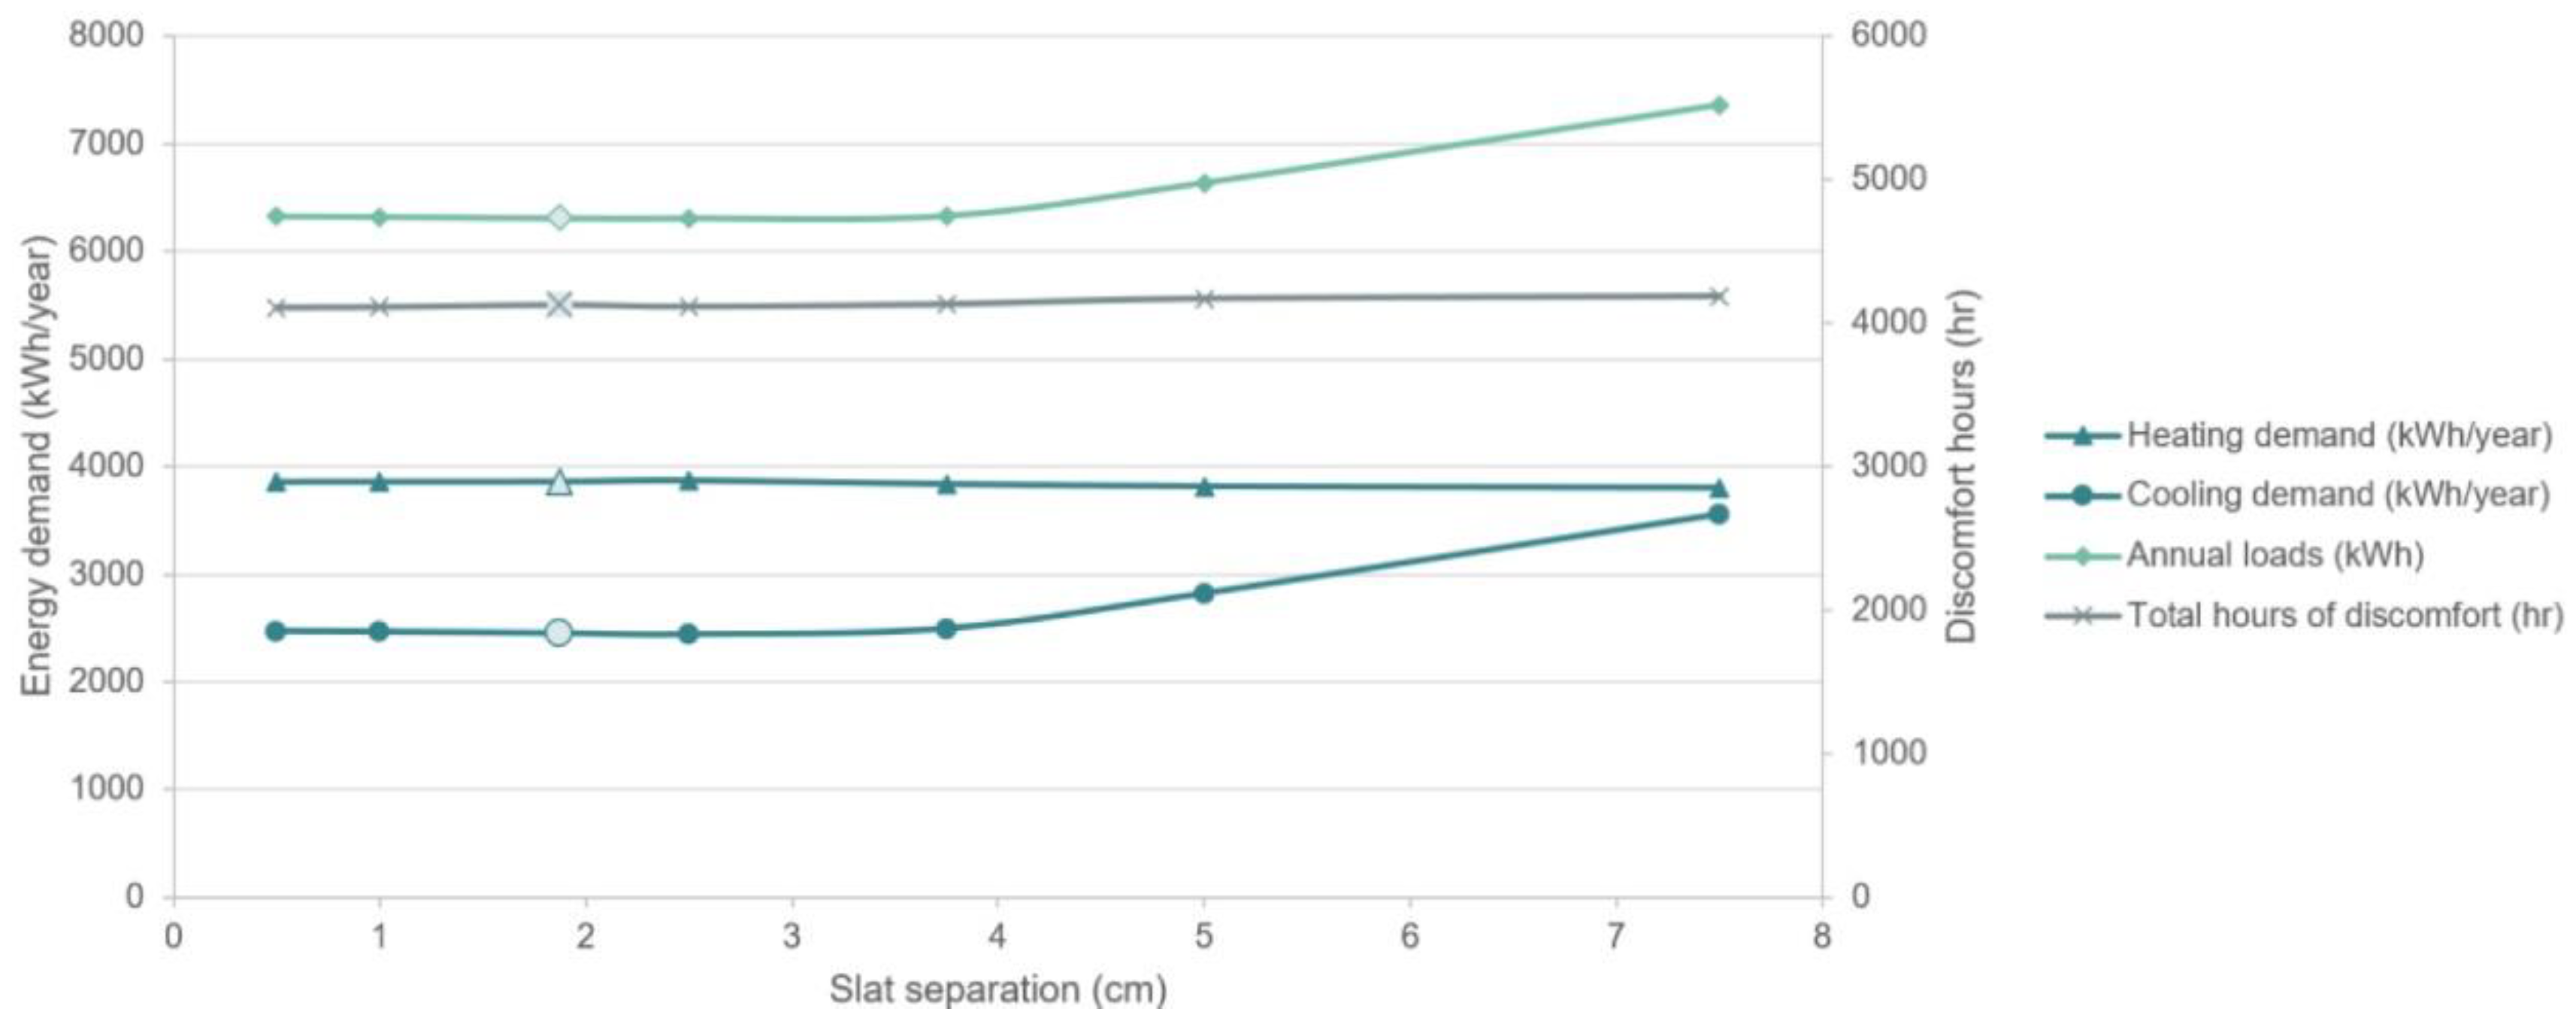
  • The slat separation and the slat width are the most influential properties of external blinds that improve the energy performance of dynamic shading. A slat separation larger than 3.75 cm significantly increases the cooling loads with more than 20% augmentation from 3.75 to 7.5 cm. A slat width below 1.25 cm increases the cooling demand by more than 26%, from 0.5 to 1.25 cm.
  • Electrochromic glazing with solar control (ECW 1—solar = Electrochromic glazing operates based on solar control) is the most effective façade technology that reduces energy use and overheating risk.
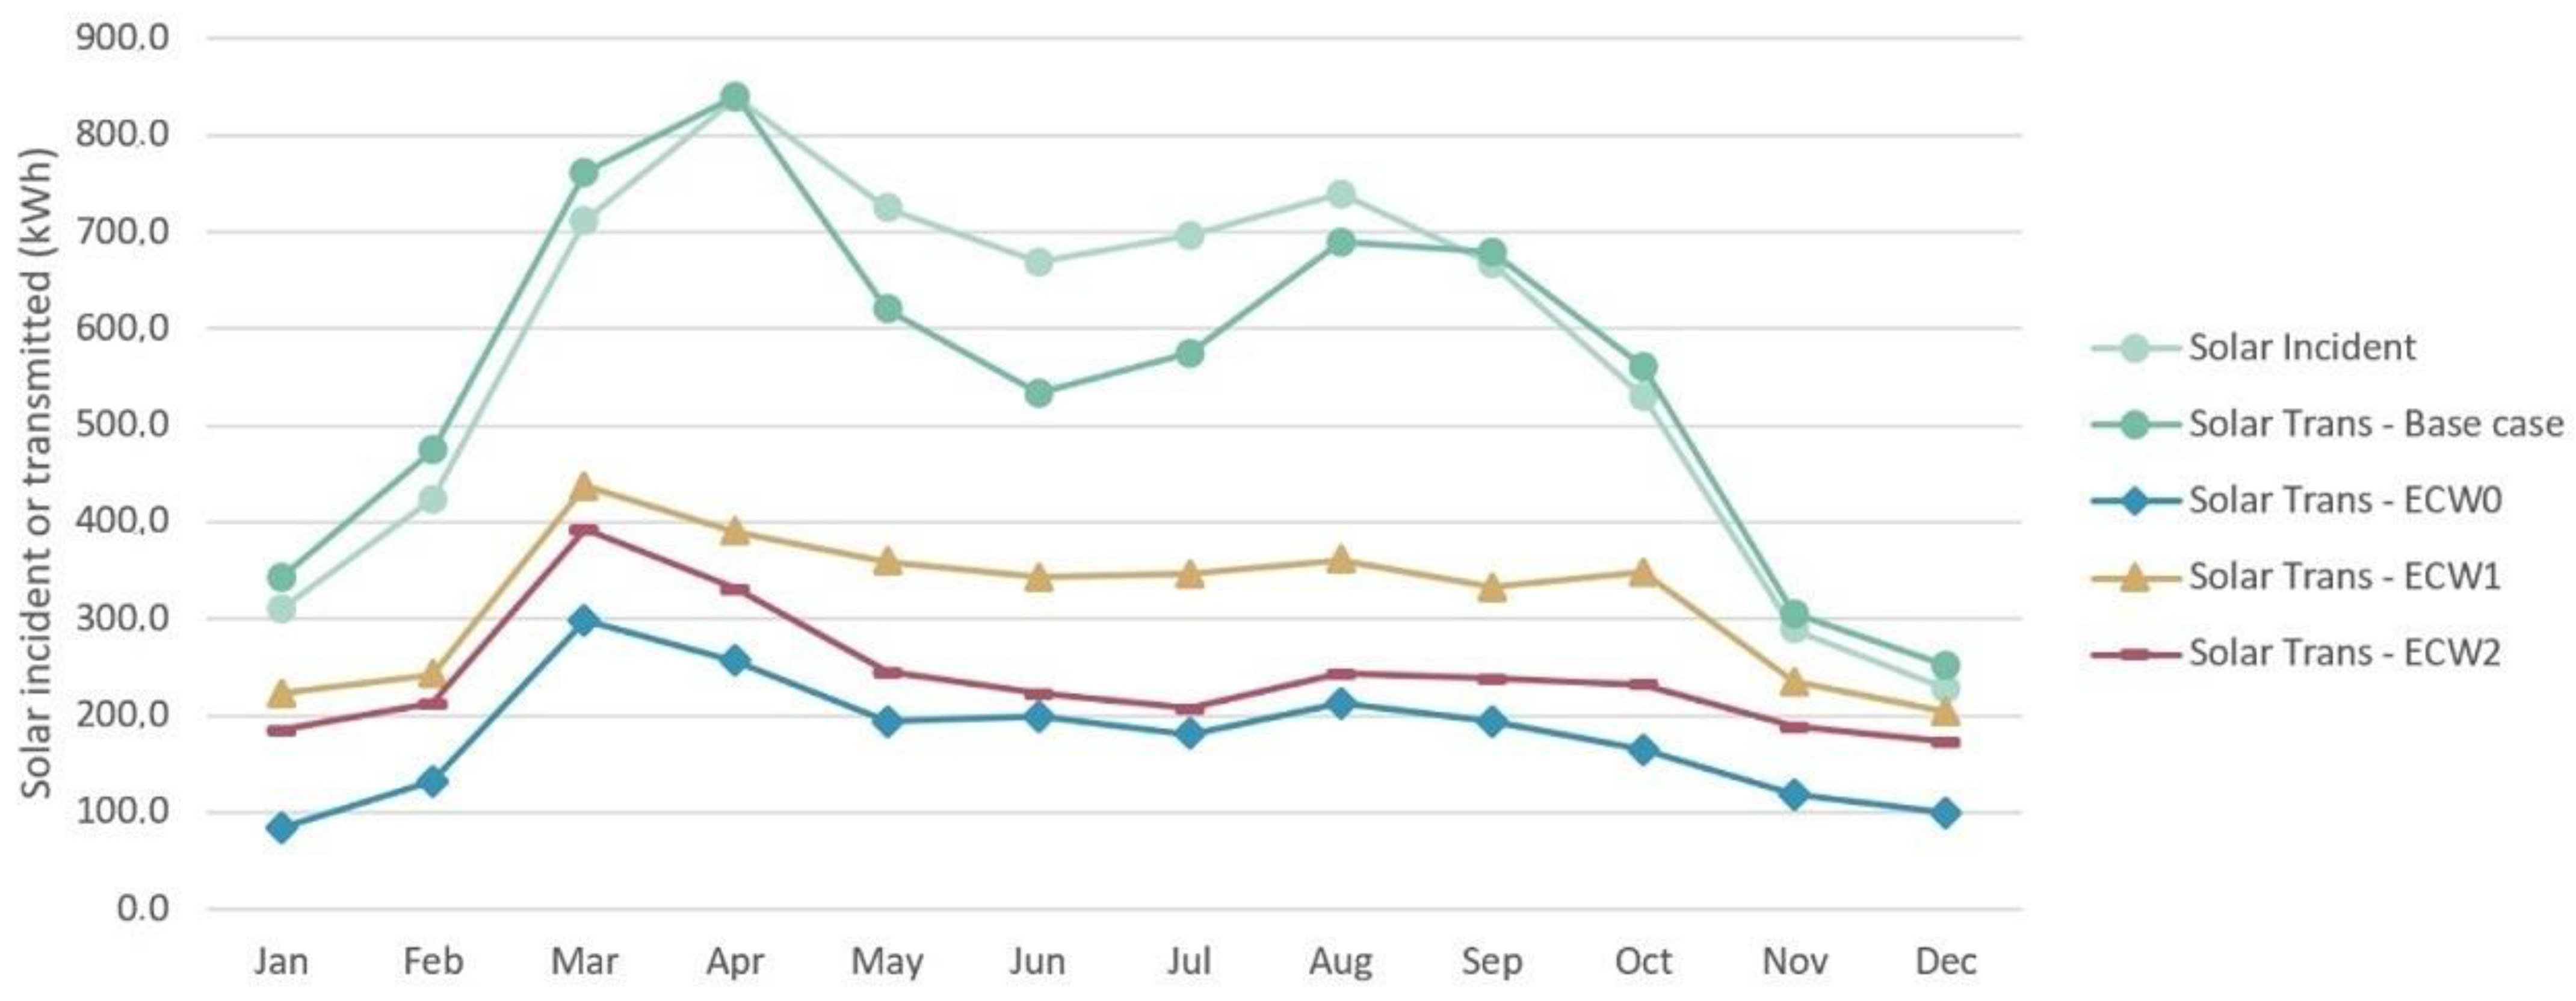
  • The sensitivity analysis for electrochromic glazing pointed out that the most influential parameter is the control threshold of solar radiation, which mainly reduces the cooling energy loads.
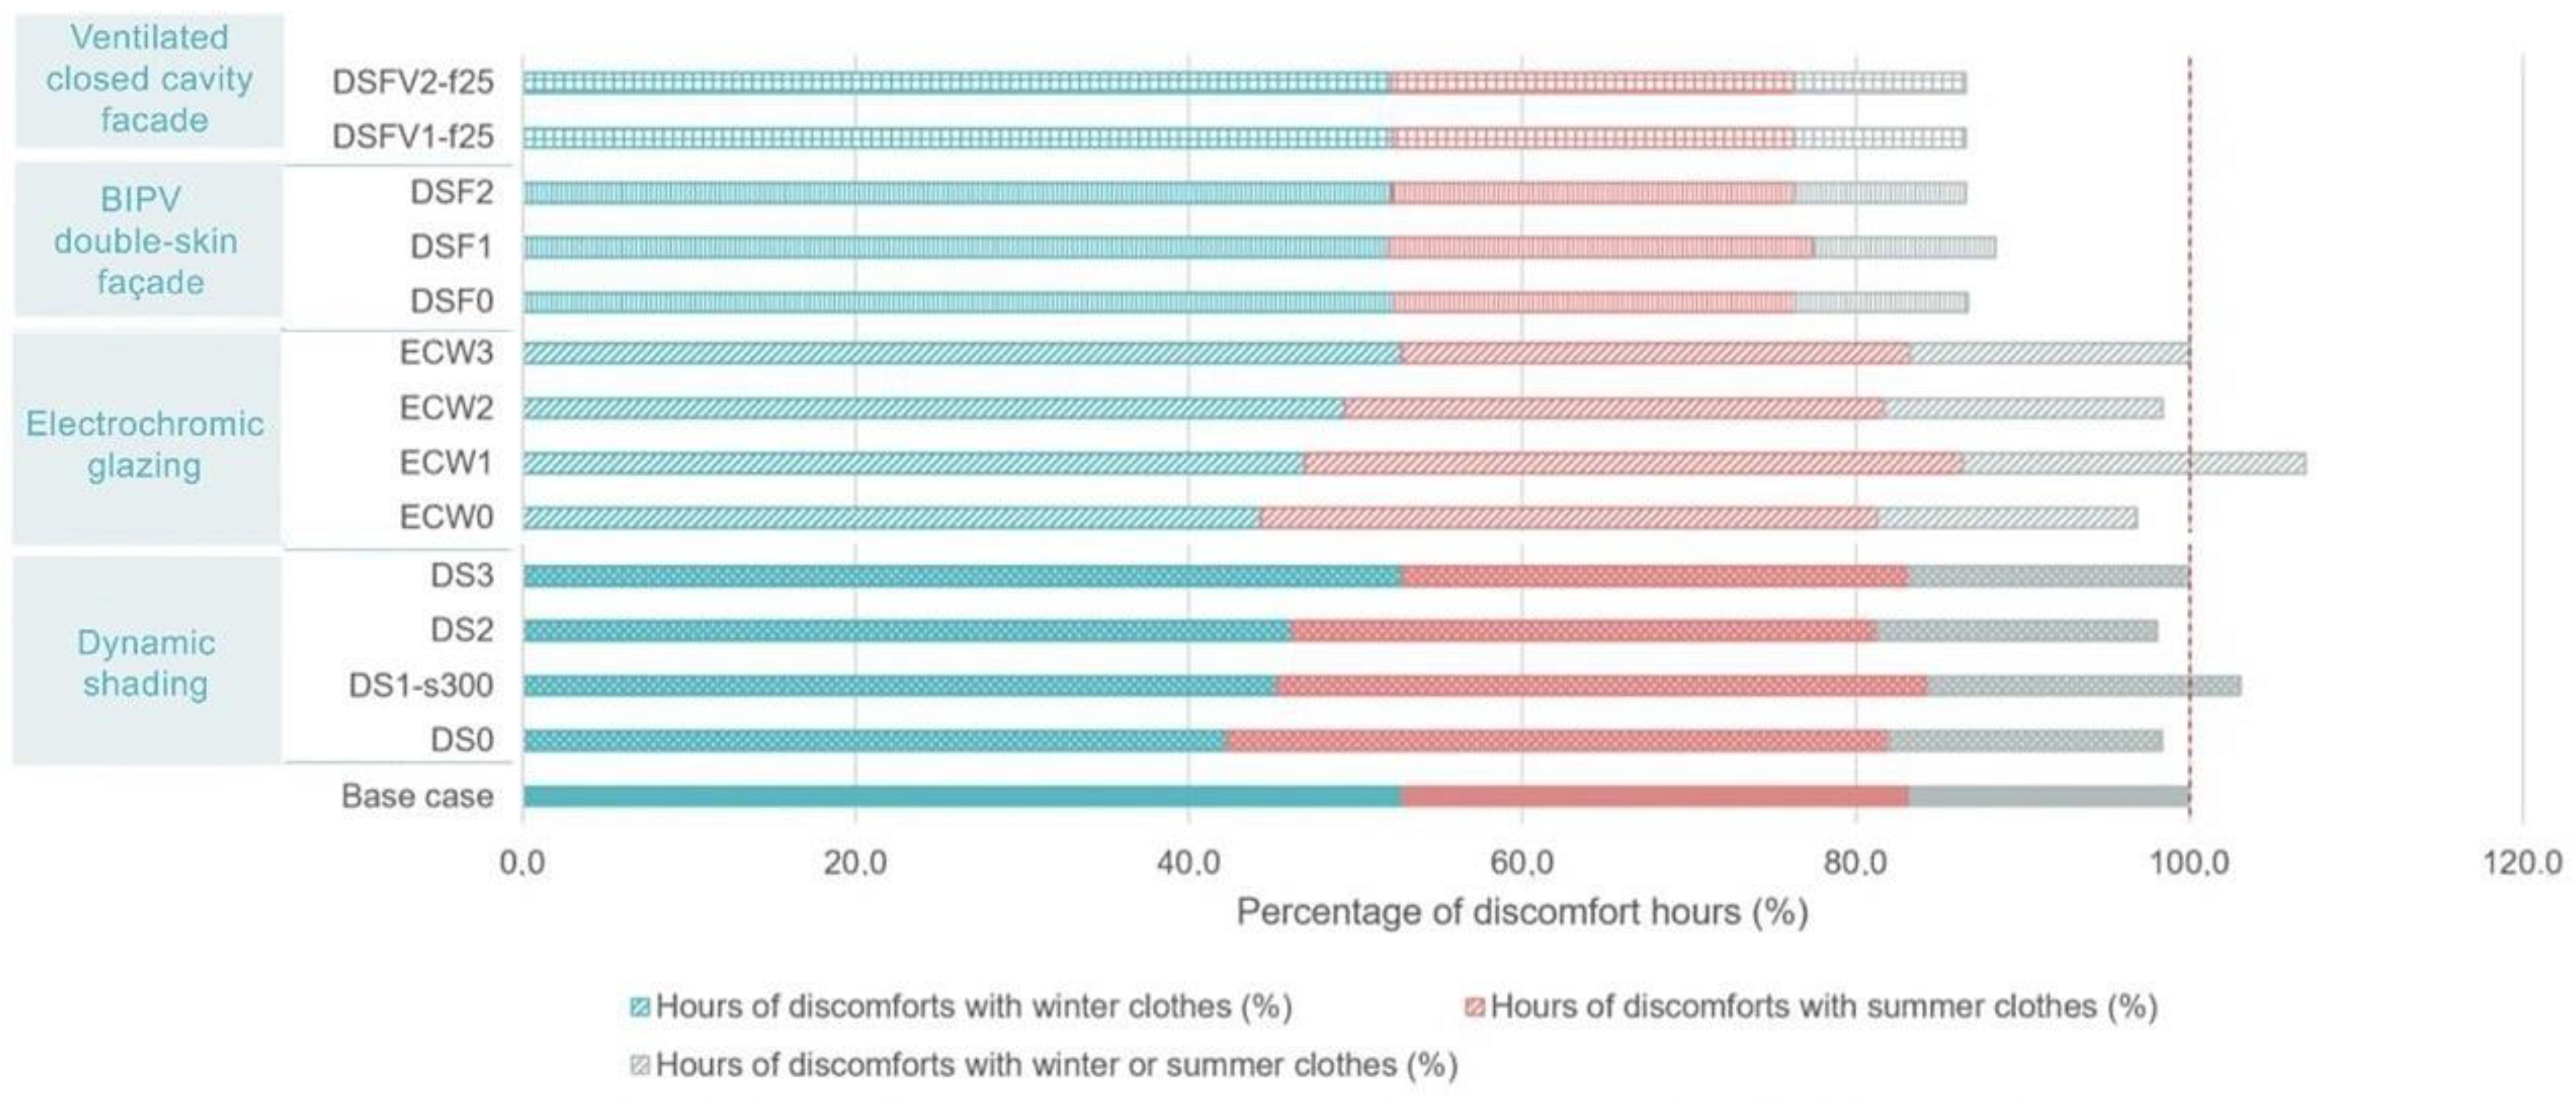
  • Both double-skin façade technologies (BIPV double-skin façade and active ventilated closed cavity façade) significantly reduce energy use and overheating risk by 18.8% and 13.4%, respectively. Closed cavity façade technologies mostly affect the heating loads with a decrease of 28% per year.
  • BIPV double-skin façade that operates based on solar control reduced the heating energy load by 13%. The semi-transparent BIPV- double-skin façade produced annual solar electricity that almost met heating energy use. The sensitivity analysis indicates that BIPV-DSF solar conversion performance is highly affected by the PV panel’s air cavity temperature and transparency.
  • For the ventilated closed cavity façade, the most influential parameters are the cavity depth and the airflow rate based on the sensitivity analysis results. Both parameters affect the energy demand and especially the cooling loads. Thus from 0.25 to 1.00 m for the cavity depth and from 3 to 25 ac/h, the cooling demand decreases by 14.8%, and 5.1%, respectively.
Even though the study results are initial and should only be interpreted in the context of cooling-dominated office buildings located in temperate climates, it presents practical recommendations for façade designers. Dynamic shading and electrochromic windows are the best adaptive façade systems to reduce cooling loads and decrease overheating risk. In an office building with a window to wall ratio of 55% and high internal loads, it is crucial to reduce solar heat gains at the source through external dynamic blinds and switchable electrochromic glazing. This study’s recommendations align with the work published earlier by Karlsen et al. [48] and Tällberg et al. [7].
Overall, the Closed Cavity Façades improved the energy performance but were not as effective as electrochromic glazing and dynamic shading devices. Compared to the base case, the reduction was between 7.9% and 18.2%. However, this technology mostly impacts the heating energy loads, decreasing it between 30% and 26.7%. Nevertheless, the cooling loads also decrease by more than 10% and improve the energy performance in the ventilated closed cavity façade. Thus, the active ventilation mode has an important effect on the energy demand, especially cooling demand in mild climates. Therefore, other combinations for closed cavity façades should be tested, including BIPV double-skin façades and ventilated closed cavity façades. Combining automatic blinds systems and active ventilation within the assembly components of closed cavity façades is recommended. It will allow occupants to interact with the façade [64]. However, closed cavity façades remain complex regarding their design, operation, and maintenance.
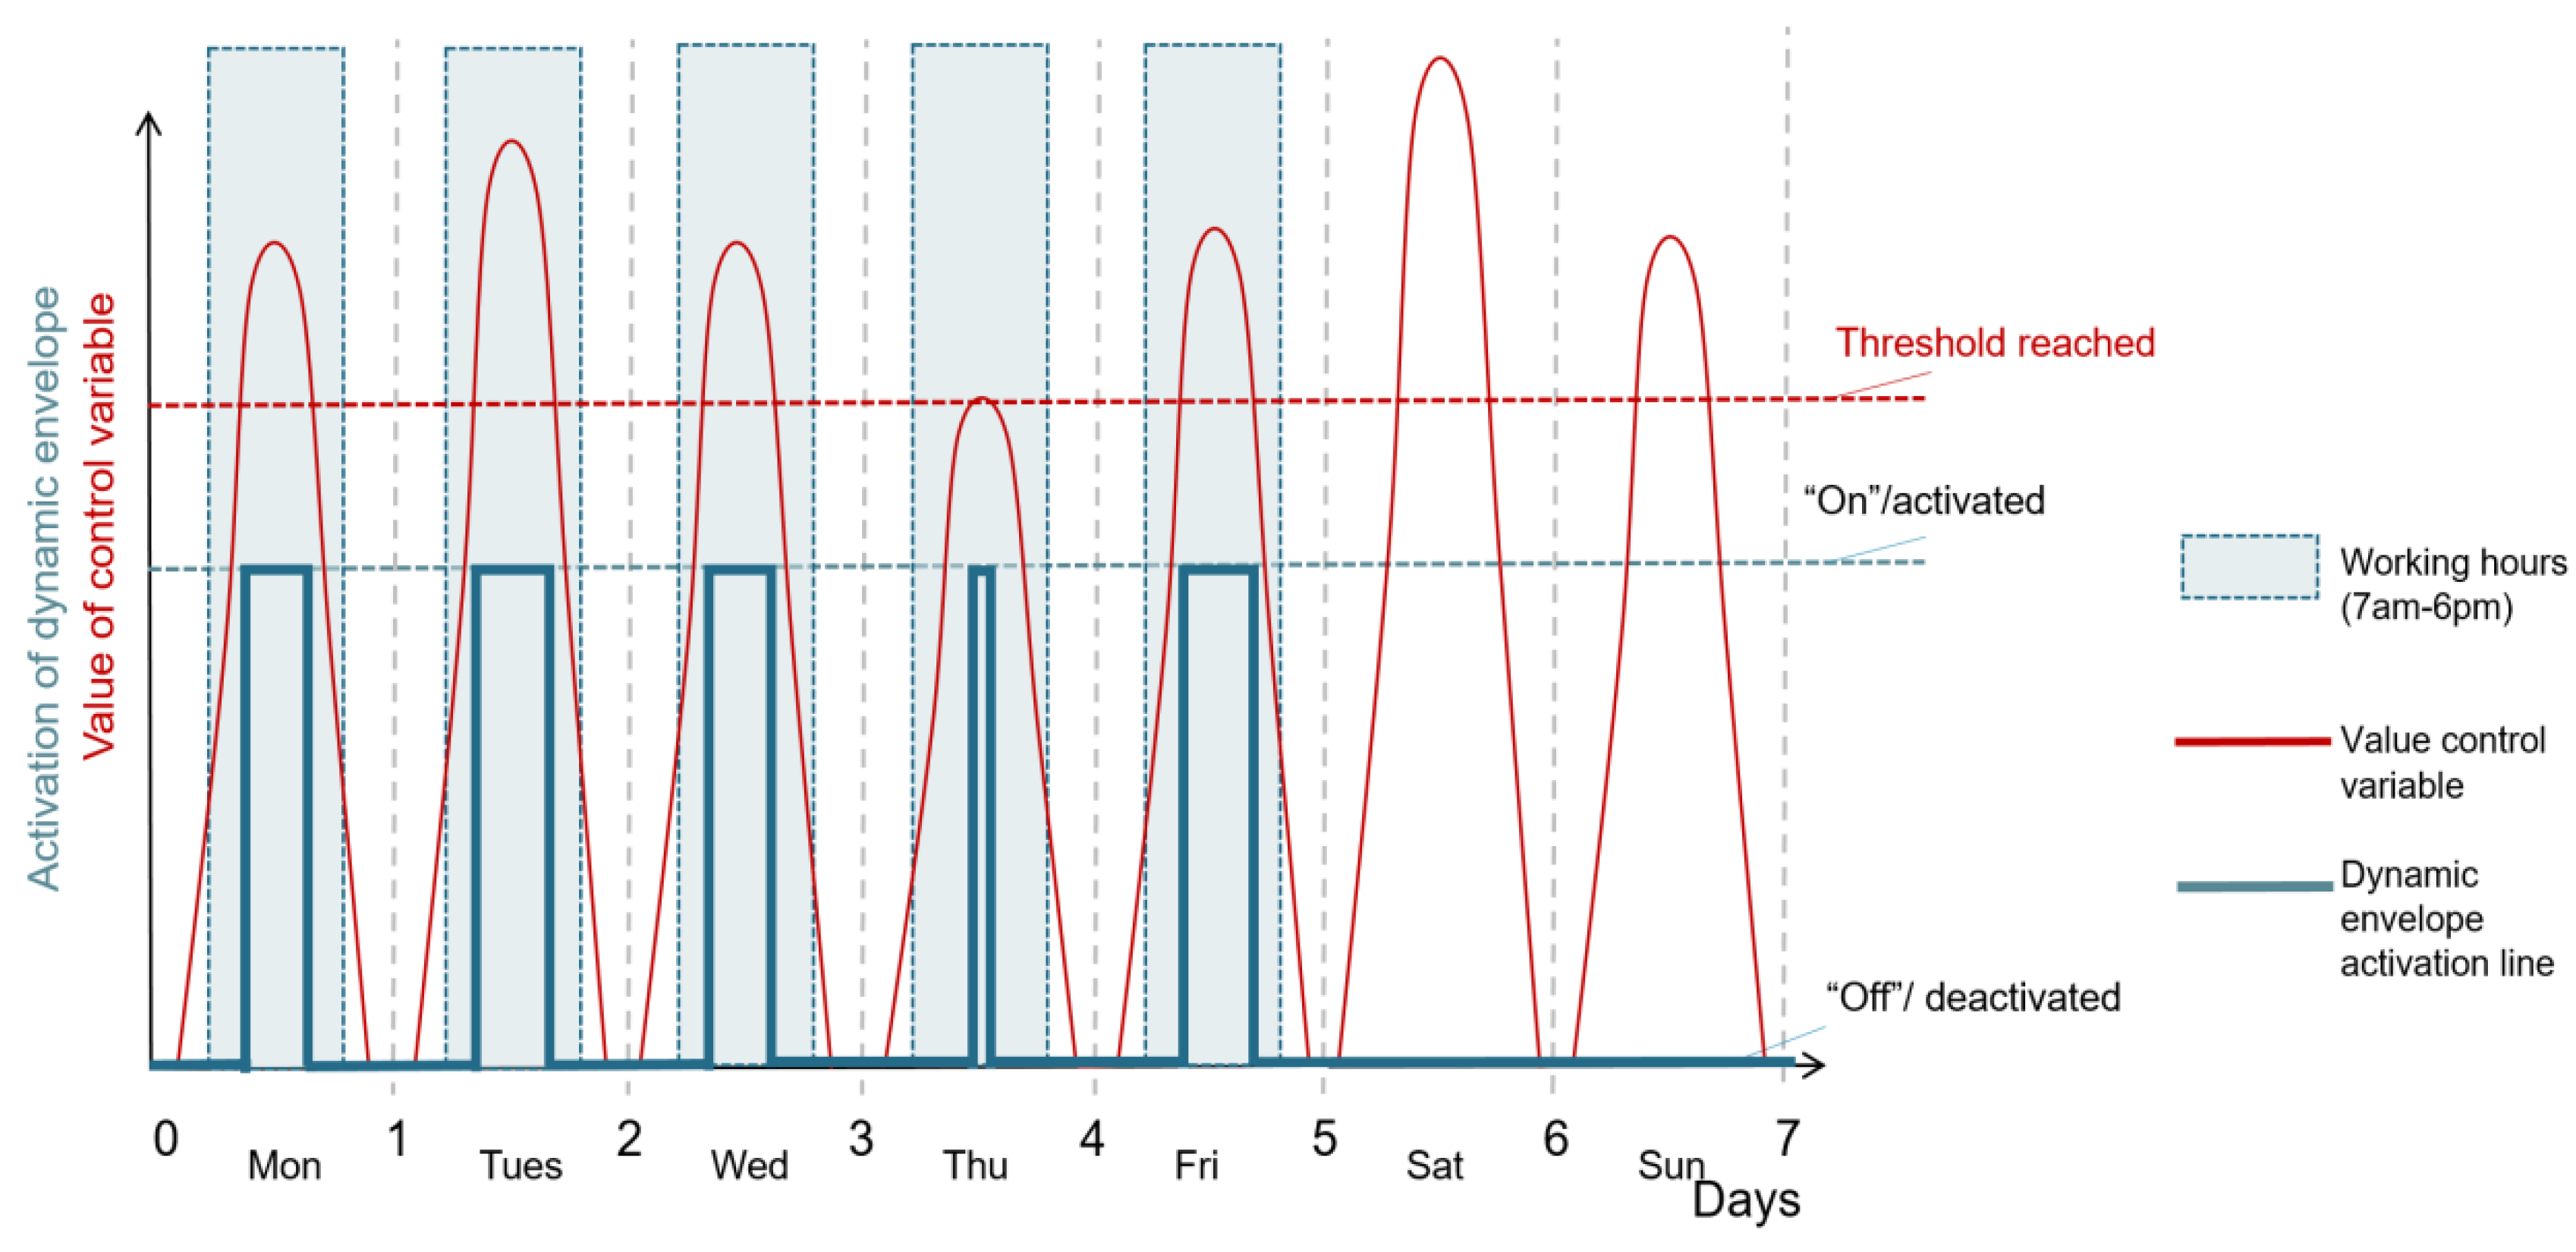
In the context of global climate change, summers will be warmer. Therefore, a control strategy should be coupled to the operative temperature control to avoid the overheating risk is necessary [65]. Overall, solar control-based and occupancy-based strategies performed the best when comparing the four technologies. For automatic blinds, the sensitivity analysis proved that the solar radiation threshold (150 W/m2 is the threshold used in this study to activate the blinds) is the most influential parameter that can reduce the cooling energy load and overall energy use. A higher solar threshold induces low cooling energy loads. However, a too-small threshold causes too low cooling demand at the expense of higher heating demand. Furthermore, a too large vertical spacing between slats or a too-small width of slats would let more sun pass through the window because the slatted cover would be too poor.

5.2. Strength and Limitations

The current study helps set a benchmark for comparing the energy performance and overheating risk of adaptive façade systems. It provides an overall view of the possible improvement brought by four advanced façade technologies. The study findings offer informed decision-making for adaptive façades design in cutting down cooling and heating energy loads while decreasing the overheating risk for building occupants. The study’s contribution lies in the comparative approach and not the absolute values of the technologies evaluation results. The comparison offers a chance to contrast the four technologies and objectively quantify their performance to facilitate their choice. The studied technologies are available in the market and becoming cost-effective. Building owners, façade designers, and architects are challenged by long-term carbon neutrality and well-being requirements, implying suitable and smart façade solutions. The study raises the awareness of decision-makers and helps deploy innovative adaptive façades technologies and their control strategies.
Moreover, the study methodology profited from advanced computation modeling features found in EnergyPlus and the high-level control methods of the Energy Management System (EMS). The buildings’ performance simulations benefited from the validated BESTEST 600 model to compare four façade technologies with different control strategies, which would have been very cumbersome and tedious if performed in a laboratory or field setting. The paper’s focus is directly related to energy use and overheating risk in buildings with adaptive façades. Therefore, the study’s main contribution is that its workflow can be transferred to other climates outside temperate climates. More importantly, the study can be reproduced and applied to real case studies to study the effect of adaptive façades for the four building orientations.
On the other hand, the study has some limitations. Visual comfort was not investigated, and thus the influence of the four adaptive façades on lighting energy loads and daylight quality is missing. At the same time, EnergyPlus is not the best software to evaluate visual comfort. Moreover, the control strategies applied in this study were limited by the programming capacity to represent the four technologies and their control strategies in the EMS of EnergyPlus. These control logics’ (non)availability determines what can be modeled in the simulation tool [58]. Therefore, the modeling results were initially compared using LBNL Windows and ES-SO ESBO. However, EnergyPlus remains one of the fittest-to-purpose building simulation tools. Finally, the study would have benefited from expanding its scope to include sustainability criteria such as the embodied carbon of the different adaptive façades technologies.

5.3. Implication on Practice and Research

Smart building technologies such as adaptive façades are identified as high potential solutions for future buildings and tend to become more and more popular [2]. The European Energy Performance of Buildings Directive (EPBD) recast of 2021 promotes the smartness of buildings through dynamic building envelopes. The introduction of the new indicator called the Smart Readiness Indicator (SRI) aims to accommodate smart-ready services, including adaptive façades. Thus, smart façade technologies are expected to become a part of best practices with the European goals towards carbon neutrality of the building sector by 2050.
Therefore, future work should focus on wide parametric analysis that evaluates visual comfort and addresses adaptive façades technologies’ carbon footprint. Also, the construction costs and maintenance are crucial criteria. Adaptive façades are mostly commissioned for protective performance, such as structural, air permeability, radiation properties, etc. and for energy performance [66]. However, there is a lack of information on occupant satisfaction [67] based on post-occupancy evaluations [68]. A post-occupancy evaluation is a suitable way to evaluate the performance of adaptive façades from users’ perspectives with the help of surveys.

6. Conclusions

Adaptive façades aim to improve the performance of buildings, such as by reducing energy use, environmental impacts, maintenance needs, and costs. More importantly, they prevent unwanted solar heat, generate energy, and allow occupant interactions to improve user satisfaction. In this study, four different façades families were studied:
  • dynamic shading;
  • electrochromic glazing;
  • BIPV double-skin façade;
  • active ventilative façade (closed cavity).
BESTEST case 600 model simulated office space’s energy and thermal performance in a temperate climate. Dynamic shading and electrochromic glazing have the best energy performance, reducing annual energy loads between 26.3% and 31.3%, especially cooling loads between 44.7% and 54.4%. On the other hand, Closed Cavity Façades could be more appropriate for cold climates by decreasing the total loads between 7.9% and 18.2%. Closed Cavity Façades decreased the heating energy loads between 27.9% and 30%. Dynamic shading devices and electrochromic glazing are the most promising technologies for thermal energy performance and overheating risk for office buildings in temperature climates among the four compared adaptive façades families.
Regarding overheating risk, the closed cavity façades have the best performance by significantly decreasing the summer thermal discomfort hours between 11.6% and 13.4%. Moreover, solar-based and operative temperature-based controls are the most promising control strategies for dynamic shading and electrochromic glazing cases and hybrid ventilation mode for Closed Cavity Façades cases. The results provide a valuable comparison for future studies. The results increase the awareness of project managers, clients, and other project stakeholders. They also provide scientists and façade engineers with useful information to successfully implement and parameterize adaptive façades in office buildings.

Author Contributions

Conceptualization, S.A. and S.B.; Data curation, S.B.; Formal analysis, S.B.; Investigation, S.A. and S.B.; Methodology, S.A., S.B., S.Y. and A.T.; Project administration, S.A.; Software, S.B.; Supervision, S.A.; Validation, S.A. and S.B.; Visualization, S.B.; Writing—original draft, S.A. and M.C.; Writing—review & editing, S.A., M.C., S.Y. and A.T. All authors have read and agreed to the published version of the manuscript.

Funding

This research received no external funding.

Institutional Review Board Statement

Not applicable.

Informed Consent Statement

Not applicable.

Data Availability Statement

The following supporting data can be downloaded at: https://matheo.uliege.be/handle/2268.2/9099, accessed on 28 April 2022.

Acknowledgments

The authors would like to acknowledge the School of Engineering at the University of Liege for funding this research gratefully. We would like to acknowledge the Sustainable Building Design Lab for using the MIFCOM workstation incorporating a processor of 64 cores and the valuable support during the sensitivity analysis. We also would like to acknowledge Ralf Simon from Warema company and Henk de Bleecker from Permasteelisa for providing insights on the closed cavity façades. The author would like to gratefully acknowledge ISO/DIS52016-3 committee members for providing excellent discussions that inspired our work. The author acknowledges the support of Dick van Dijk and workgroup members.

Conflicts of Interest

The authors declare no conflict of interest.

Abbreviations

AFAdaptive façade
DSDynamic shading
DS0Dynamic shading with schedule control
DS1Dynamic shading with solar control
DS2Dynamic shading with operative temperature control
DS3Dynamic shading with glare control
DSFDouble-skin façade
DSF0Double-skin façade not ventilated
DSF1Double-skin façade naturally ventilated with schedule control
DSF2Double-skin façade naturally ventilated with operative temperature control
DSFVDouble-skin façade ventilated
DSFV1Double-skin façade mechanically ventilated with operative temperature control
DSFV2Double-skin façade naturally and mechanically (hybrid) ventilated with operative temperature control
ECWElectrochromic window
ECW0Electrochromic window with schedule control
ECW1Electrochromic window with solar control
ECW2Electrochromic window with operative temperature control
ECW3Electrochromic window with glare control

References

  1. Raji, B.; Tenpierik, M.J.; Dobbelsteen, A.V.D. An assessment of energy-saving solutions for the envelope design of high-rise buildings in temperate climates: A case study in the Netherlands. Energy Build. 2016, 124, 210–221. [Google Scholar] [CrossRef]
  2. Attia, S.; Lioure, R.; Declaude, Q. Future trends and main concepts of adaptive facade systems. Energy Sci. Eng. 2020, 8, 3255–3272. [Google Scholar] [CrossRef]
  3. Sibilio, S.; Iavarone, R.; Mastantuono, S.; Mantova, M.; D’Ausilio, L. Adaptive and dynamic facade: A new challenge for the built environment. In Proceedings of the Architecture Heritage and Design World Heritage and Knowledge Representation|Restoration|Redesign|Resilience Mercanti Vie Le dei, Roma, Italy, 14–16 June 2018. [Google Scholar]
  4. Michael, M.; Overend, M. Closed cavity façade, an innovative energy saving façade. Build. Serv. Eng. Res. Technol. 2022, 18, 01436244221080030. [Google Scholar] [CrossRef]
  5. Tabadkani, A.; Roetzel, A.; Li, H.X.; Tsangrassoulis, A. Design approaches and typologies of adaptive facades: A review. Autom. Constr. 2020, 121, 103450. [Google Scholar] [CrossRef]
  6. Nielsen, M.V.; Svendsen, S.; Jensen, L.B. Quantifying the potential of automated dynamic solar shading in office buildings through integrated simulations of energy and daylight. Sol. Energy 2011, 85, 757–768. [Google Scholar] [CrossRef]
  7. Tällberg, R.; Jelle, B.P.; Loonen, R.; Gao, T.; Hamdy, M. Comparison of the energy saving potential of adaptive and controllable smart windows: A state-of-the-art review and simulation studies of thermochromic, photochromic and electrochromic technologies. Sol. Energy Mater. Sol. Cells 2019, 200, 109828. [Google Scholar] [CrossRef] [Green Version]
  8. Lai, K.; Wang, W.; Giles, H. Solar shading performance of window with constant and dynamic shading function in different climate zones. Sol. Energy 2017, 147, 113–125. [Google Scholar] [CrossRef]
  9. Skarning, G.C.J.; Hviid, C.A.; Svendsen, S. The effect of dynamic solar shading on energy, daylighting and thermal comfort in a nearly zero-energy loft room in Rome and Copenhagen. Energy Build. 2016, 135, 302–311. [Google Scholar] [CrossRef] [Green Version]
  10. Naik, N.S.; Elzeyadi, I.; Cartwright, V. Dynamic solar screens for high-performance buildings–A critical review of perforated external shading systems. Archit. Sci. Rev. 2022, 12, 1–15. [Google Scholar] [CrossRef]
  11. Favoino, F.; Overend, M.; Jin, Q. The optimal thermo-optical properties and energy saving potential of adaptive glazing technologies. Appl. Energy 2015, 156, 1–15. [Google Scholar] [CrossRef] [Green Version]
  12. Butt, A.A.; de Vries, S.B.; Loonen, R.C.; Hensen, J.L.; Stuiver, A.; Ham, J.E.v.D.; Erich, B.S. Investigating the energy saving potential of thermochromic coatings on building envelopes. Appl. Energy 2021, 291, 116788. [Google Scholar] [CrossRef]
  13. Ascione, F.; Bianco, N.; Iovane, T.; Mastellone, M.; Mauro, G.M. The evolution of building energy retrofit via double-skin and responsive façades: A review. Sol. Energy 2021, 224, 703–717. [Google Scholar] [CrossRef]
  14. Yang, S.; Cannavale, A.; Prasad, D.; Sproul, A.; Fiorito, F. Numerical simulation study of BIPV/T double-skin facade for various climate zones in Australia: Effects on indoor thermal comfort. Build. Simul. 2019, 12, 51–67. [Google Scholar] [CrossRef]
  15. Pflug, T.; Nestle, N.; Kuhn, T.E.; Siroux, M.; Maurer, C. Modeling of facade elements with switchable U-value. Energy Build. 2018, 164, 1–13. [Google Scholar] [CrossRef]
  16. Juaristi, M.; Favoino, F.; Gómez-Acebo, T.; Monge-Barrio, A. Adaptive opaque façades and their potential to reduce thermal energy use in residential buildings: A simulation-based evaluation. J. Build. Phys. 2021, 45, 17442591211045418. [Google Scholar] [CrossRef]
  17. Juaristi, M.; Gómez-Acebo, T.; Monge-Barrio, A. Qualitative analysis of promising materials and technologies for the design and evaluation of Climate Adaptive Opaque Façades. Build. Environ. 2018, 144, 482–501. [Google Scholar] [CrossRef]
  18. Böke, J.; Knaack, U.; Hemmerling, M. State-of-the-art of intelligent building envelopes in the context of intelligent technical systems. Intell. Build. Int. 2019, 11, 27–45. [Google Scholar] [CrossRef] [Green Version]
  19. Al-Masrani, S.M.; Al-Obaidi, K.M.; Zalin, N.A.; Isma, M.A. Design optimisation of solar shading systems for tropical office buildings: Challenges and future trends. Sol. Energy 2018, 170, 849–872. [Google Scholar] [CrossRef]
  20. Casini, M. Active dynamic windows for buildings: A review. Renew. Energy 2018, 119, 923–934. [Google Scholar] [CrossRef]
  21. Iuliano, G. Dynamic Glazing: On-Site Measurement and Modelling. A Case Study for an Electric Driven Window. Ph.D. Thesis, Università degli Studi della Campania “Luigi Vanvitelli”, Caserta, Italy, 2018. [Google Scholar]
  22. Romano, R.; Aelenei, L.; Aelenei, D.; Mazzuchelli, E.S. What is an adaptive façade? Analysis of Recent Terms and definitions from an international perspective. J. Facade Des. Eng. 2018, 6, 65–76. [Google Scholar]
  23. De Luca, F.; Voll, H.; Thalfeldt, M. Comparison of static and dynamic shading systems for office building energy consumption and cooling load assessment. Manag. Environ. Qual. Int. J. 2018, 29, 978–998. [Google Scholar] [CrossRef]
  24. Ahmed, M.; Abdel-Rahman, A.; Bady, M.; Mahrous, E.K. The thermal performance of residential building integrated with adaptive kinetic shading system. Int. Energy J. 2016, 16, 97–106. [Google Scholar]
  25. Yi, Y.K.; Yin, J.; Tang, Y. Developing an advanced daylight model for building energy tool to simulate dynamic shading device. Sol. Energy 2018, 163, 140–149. [Google Scholar] [CrossRef]
  26. Jayathissa, P.; Luzzatto, M.; Schmidli, J.; Hofer, J.; Nagy, Z.; Schlueter, A. Optimising building net energy demand with dynamic BIPV shading. Appl. Energy 2017, 202, 726–735. [Google Scholar] [CrossRef]
  27. Mahmoud, A.; Elghazi, Y. Parametric-based designs for kinetic facades to optimize daylight performance: Comparing rotation and translation kinetic motion for hexagonal facade patterns. Sol. Energy 2016, 126, 111–127. [Google Scholar] [CrossRef]
  28. Dussault, J.-M.; Gosselin, L. Office buildings with electrochromic windows: A sensitivity analysis of design parameters on energy performance, and thermal and visual comfort. Energy Build. 2017, 153, 50–62. [Google Scholar] [CrossRef]
  29. Feng, W.; Zou, L.; Gao, G.; Wu, G.; Shen, J.; Li, W. Gasochromic smart window: Optical and thermal properties, energy simulation and feasibility analysis. Sol. Energy Mater. Sol. Cells 2016, 144, 316–323. [Google Scholar] [CrossRef]
  30. Alberto, A.; Ramos, N.M.M.; Almeida, R. Parametric study of double-skin facades performance in mild climate countries. J. Build. Eng. 2017, 12, 87–98. [Google Scholar] [CrossRef]
  31. Anđelković, A.S.; Mujan, I.; Dakić, S. Experimental validation of a EnergyPlus model: Application of a multi-storey naturally ventilated double skin façade. Energy Build. 2016, 118, 27–36. [Google Scholar] [CrossRef]
  32. Pomponi, F.; Piroozfar, P.; Southall, R.; Ashton, P.; Farr, E.R. Energy performance of Double-Skin Façades in temperate climates: A systematic review and meta-analysis. Renew. Sustain. Energy Rev. 2016, 54, 1525–1536. [Google Scholar] [CrossRef] [Green Version]
  33. Yang, H.; Zhou, Y.; Jin, F.-Y.; Zhan, X. Thermal Environment Dynamic Simulation of Double Skin Façade with Middle Shading Device in Summer. Procedia Eng. 2016, 146, 251–256. [Google Scholar] [CrossRef] [Green Version]
  34. Zomorodian, Z.S.; Tahsildoost, M. Energy and carbon analysis of double skin façades in the hot and dry climate. J. Clean. Prod. 2018, 197, 85–96. [Google Scholar] [CrossRef]
  35. Shi, X.; Abel, T.; Wang, L. Influence of two motion types on solar transmittance and daylight performance of dynamic façades. Sol. Energy 2020, 201, 561–580. [Google Scholar] [CrossRef]
  36. Dahanayake, K.W.D.K.C.; Chow, C.L. Studying the potential of energy saving through vertical greenery systems: Using EnergyPlus simulation program. Energy Build. 2017, 138, 47–59. [Google Scholar] [CrossRef]
  37. Faizi, F.; Yazdizad, A.; Rezaei, F. Classification of Double Skin Façade and Their Function to Reduce Energy Consumption and create sustainability in Buildings. In Proceedings of the 2nd International Congress of Structure, Architecture and Urban Development, Tabriz, Iran, 16–18 November 2014. [Google Scholar]
  38. Bertrand, S. The Effects of Transparent Adaptive Façades on Energy and Comfort Performances in Office Buildings. Master’s Thesis, Liege University, Liege, Belgium, 2020. Available online: https://matheo.uliege.be/handle/2268.2/9099 (accessed on 10 February 2022).
  39. Corgnati, S.P.; Fabrizio, E.; Filippi, M.; Monetti, V. Reference buildings for cost optimal analysis: Method of definition and application. Appl. Energy 2013, 102, 983–993. [Google Scholar] [CrossRef]
  40. Standard 140-2017; Standart Method of Test for Evaluation of Building Energy Analysis Programs. ASHRAE: Atlanta, GA, USA, 2017.
  41. EN ISO 13790; Energy Performance of Buildings—Calculation of Energy Use for Space Heating and Cooling. ISO: Geneva, Switzerland, 2008.
  42. Eurostat. Cooling and Heating Degree Days by NUTS 2 Regions-Annual Data, European Commission, Brussels, Belgium, 2021. Available online: https://ec.europa.eu/eurostat/databrowser/view/NRG_CHDDR2_A__custom_2681179/default/table?lang=en (accessed on 10 May 2022).
  43. ISO/DIS 52016-3; Energy Performance of Buildings—Energy Needs for Heating and Cooling, Internal Temperatures and Sensible and Latent Heat Loads—Part 3: Calculation Procedures Regarding Adaptive Building Envelope Elements (Under Development). ISO: Geneva, Switzerland, 2022. Available online: https://www.iso.org/standard/75395.html (accessed on 15 November 2021).
  44. ISO 17772-1; Energy Performance of Buildings-Indoor Environmental Quality. Part 1: Indoor Environmental Input Parameters for the Design and Assessment of Energy Performance in Buildings. ISO: Geneva, Switzerland, 2017.
  45. Tabadkani, A.; Roetzel, A.; Li, H.X.; Tsangrassoulis, A. A review of automatic control strategies based on simulations for adaptive facades. Build. Environ. 2020, 175, 106801. [Google Scholar] [CrossRef]
  46. Yun, G.; Park, D.Y.; Kim, K.S. Appropriate activation threshold of the external blind for visual comfort and lighting energy saving in different climate conditions. Build. Environ. 2017, 113, 247–266. [Google Scholar] [CrossRef]
  47. de Vries, S.B. A Computational Framework for Analysis and Optimisation of Automated Solar Shading Systems: Within High Performance Building Facades; TU-Eindhoven: Eindhoven, The Netherlands, 2022. [Google Scholar]
  48. Karlsen, L.; Heiselberg, P.; Bryn, I.; Johra, H. Solar shading control strategy for office buildings in cold climate. Energy Build. 2016, 118, 316–328. [Google Scholar] [CrossRef]
  49. DesignBuilder Help-Introducing DesignBuilder. Available online: https://designbuilder.co.uk/helpv3.4/ (accessed on 16 November 2020).
  50. Peng, J.; Curcija, D.C.; Lu, L.; Selkowitz, S.E.; Yang, H.; Zhang, W. Numerical investigation of the energy saving potential of a semi-transparent photovoltaic double-skin facade in a cool-summer Mediterranean climate. Appl. Energy 2016, 165, 345–356. [Google Scholar] [CrossRef]
  51. Cannavale, A.; Hörantner, M.; Eperon, G.E.; Snaith, H.J.; Fiorito, F.; Ayr, U.; Martellotta, F. Building integration of semi-transparent perovskite-based solar cells: Energy performance and visual comfort assessment. Appl. Energy 2017, 194, 94–107. [Google Scholar] [CrossRef]
  52. Denz, P.R.; Priedemann, W.; Anders, L. ACT Façade–Interior sun shading for energy efficient fully glazed façades. In Proceedings of the FAÇADE 2018-Final Conference of COST TU1403 “Adaptive Facades Network”, Lucerne, Switzerland, 30 November 2018. [Google Scholar]
  53. Loonen, R. Approaches for Computational Performance Optimization of Innovative Adaptive Façade Concepts; Technische Universiteit Eindhoven: Eindhoven, The Netherlands, 2018. [Google Scholar]
  54. Loonen, R.C.; Favoino, F.; Hensen, J.L.; Overend, M. Review of current status, requirements and opportunities for building performance simulation of adaptive facades. J. Build. Perform. Simul. 2017, 10, 205–223. [Google Scholar] [CrossRef] [Green Version]
  55. Alsailani, M. Development of Control Strategies for Advanced Solar Shading Systems: Part; TU-Eindhoven: Eindhoven, The Netherlands, 2019. [Google Scholar]
  56. Gehbauer, C.; Blum, D.H.; Wang, T.; Lee, E.S. An assessment of the load modifying potential of model predictive controlled dynamic facades within the California context. Energy Build. 2020, 210, 109762. [Google Scholar] [CrossRef]
  57. Reinhart, C.; Voss, K. Monitoring manual control of electric lighting and blinds. Light. Res. Technol. 2003, 35, 243–258. [Google Scholar] [CrossRef] [Green Version]
  58. Favoino, F.; Loonen, R.; Doya, M.; Goia, F.; Bedon, C.; Babich, F. Building Performance Simulation and Characterisation of Adaptive Facades-Adaptive Facades Network; TU Delft Open: Delft, The Netherlands, 2018. [Google Scholar]
  59. Scorpio, M.; Ciampi, G.; Rosato, A.; Maffei, L.; Masullo, M.; Almeida, M.; Sibilio, S. Electric-driven windows for historical buildings retrofit: Energy and visual sensitivity analysis for different control logics. J. Build. Eng. 2020, 31, 101398. [Google Scholar] [CrossRef]
  60. Isaia, F.; Fiorentini, M.; Serra, V.; Capozzoli, A. Enhancing energy efficiency and comfort in buildings through model predictive control for dynamic façades with electrochromic glazing. J. Build. Eng. 2021, 43, 102535. [Google Scholar] [CrossRef]
  61. EN 16798-1; Energy Performance of Buildings—Ventilation for buildings—Part 1: Indoor Environmental Input Pa-Rameters for Design and Assessment of Energy Performance of Buildings Addressing Indoor Air Quality, Thermal Environment, Lighting and Acoustics-Module M1-6.(16798-1). CEN: Brussels, Belgium, 2019.
  62. Morris, M.D. Factorial Sampling Plans for Preliminary Computational Experiments. Technometrics 1991, 33, 161. [Google Scholar] [CrossRef]
  63. Norme NBN EN 15251:2007: Critères d’Ambiance Intérieure-Energie Plus Le Site’. Available online: https://energieplus-lesite.be/reglementations/confort44/norme-nbn-en-15251-2007-criteres-d-ambiance-interieure/ (accessed on 16 November 2021).
  64. Attia, S.; Cools, S.G.M. Development and validation of a survey for well-being and interaction assessment by oc-cupants in office buildings with adaptive façades. Build. Environ. 2019, 157, 268–276. [Google Scholar] [CrossRef]
  65. de Vries, S.B.; Loonen, R.C.G.M.; Hensen, J.L.M. Simulation-aided development of automated solar shading control strategies using performance mapping and statistical classification. J. Build. Perform. Simul. 2021, 14, 770–792. [Google Scholar] [CrossRef]
  66. Attia, S.; Bilir, S.; Safy, T.; Struck, C.; Loonen, R.; Goia, F. Current trends and future challenges in the performance assessment of adaptive façade systems. Energy Build. 2018, 179, 165–182. [Google Scholar] [CrossRef] [Green Version]
  67. Roetzel, A.; Tsangrassoulis, A.; Dietrich, U. Impact of building design and occupancy on office comfort and energy per-formance in different climates. Build. Environ. 2014, 71, 165–175. [Google Scholar] [CrossRef]
  68. Attia, S.; Navarro, A.L.; Juaristi, M.; Monge-Barrio, A.; Gosztonyi, S.; Al-Doughmi, Z. Post-occupancy evaluation for adaptive façades. J. Facade Des. Eng. 2018, 6, 1–9. [Google Scholar]
Figure 1. Main existing dynamic transparent building envelopes.
Sustainability 14 06106 g001
Figure 2. Study conceptual framework.
Sustainability 14 06106 g002
Figure 3. BESTEST case 600 geometry—ASHRAE (2017). ASHRAE standard 140-2017—a standard method of test for the evaluation of building energy analysis programs.
Sustainability 14 06106 g003
Figure 4. Dynamic envelope operating schema according to the schedule and control strategy.
Sustainability 14 06106 g004
Figure 5. Sensitivity analysis chosen for the different cases based on OT threshold.
Sustainability 14 06106 g005
Figure 6. Thermal energy performance—percentage for the energy use in all cases.
Sustainability 14 06106 g006
Figure 7. Overheating risk performance—percentage for thermal use of all cases.
Sustainability 14 06106 g007
Figure 8. Monthly solar radiation on the window—Base case and electrochromic cases—Window level.
Sustainability 14 06106 g008
Figure 9. Sensitivity analysis—DS2—slat separation.
Sustainability 14 06106 g009
Table 1. Materials specifications Low mass building—BESTEST case 600.
CompositionLayerThickness (m)Conductivity (W/m-K)U-Value (W/m2-K)Resistance (m2K/W)Specific Heat (J/kg-K)Density (kg/m³)
External wall (outside to inside)Exterior surface coefficient--29.30.00--
Wood Siding0.0090.1415.60.06900530.0
Fiberglass quilt0.0660.040.61.6584012.0
PlasterBoard0.0120.1613.30.08840950.0
Interior surface coefficient--8.290.12--
Total air-air 0.516 *1.94
Roof (outside to inside)Exterior surface coefficient--29.30.03--
Roof deck0.0190.147.3680.14900530.0
Fiberglass quilt0.11180.040.3582.7984012.0
PlasterBoard0.010.1616.00.06840950.0
Interior surface coefficient--8.290.12--
Total air-air 0.321 *3.15
Floor (outside to inside)Exterior surface coefficient--29.30.00--
Insulation1.0030.040.025.08-0.00001
Timber flooring0.0250.145.60.181200650.0
Interior surface coefficient--8.290.12--
Total air-air 0.03925.37
Building componentArea (m2)U-value (W/m2-K)U*A (W/K)
Walls620.516 *31.99
Roof480.321 *15.41
Floor480.391.87
Window12N/A **N/A **
Total170N/A **N/A **
Volume (m³)Window-to-wall ratioWindow-to-env. ratioEnv.rea per volume
12855%7%1.33 m2/m3
* The total air-air U-value does not match the one given by the input report of DesignBuilder. This is probably because the software considers the ground properties in the U-value calculations. ** It is considered that the window properties will vary in each case; thus, the values will change.
Table 2. Blinds with low reflectivity default properties in EnergyPlus.
Slat Properties
Blind-to-glass distance (m)0.05
Slat width (m)0.025
Slat separation (m)0.01875
Slat thickness (m)0.001
Slat conductivity (W/m-K)0.9
Slat angle (°)45
Slat solar properties
Slat solar transmittance 0
Slat visible properties
Slat visible transmittance 0
Table 3. Optical properties of the base case and ECW case.
EnvelopeStateg_ValueT_solT_visU-Value
(W/m2-K)
Reference
Base case 0.7470.8982.87Design Builder BESTEST CASE 600 default settings
ECWClearest state (Window glazing)0.460.30.41.59[44], (p. 177)
Darkest state
(EC pane)
0.090.010.023
Table 4. Properties of the semi-transparent PV glazing.
PV TypePerovskite PVAmorphous Silicon PV (a-Si)
Source[51]Onyx Solar Energy SL
U-value (W/m2 K)5.595.14
Visible Light Transmittance37.5%27.0%
Solar Transmittance 33.2%18.6%
Solar Reflectance (front)3.5%9.0%
Solar Reflectance (black)3.5%28.5%
Visible Light Reflectance (front)4.0%7.1%
Visible Light Reflectance (black)4.0%34.3%
Emissivity0.890.84
PV efficiency (under STC), η (%)6.642.84
Table 5. Control types and thresholds in the study.
Control NameControl TypeThreshold
3On during schedule-
4Solar irradiance (vertical façade)450 W/m2
7Operative temperature25 °C
5Glare Index22
Table 6. Energy results—Base case and dynamic shading cases.
CaseBaseDynamic Shading
Name DS0DS1DS2DS3
Control strategy-ScheduleSolarOperative temp.Glare
Threshold--450 W/m2-K24 °C22
EnergyHeating demand (kWh/year)38043834384038583804
Heating loads saving (%)100.0100.8100.9101.4100.0
Cooling demand (kWh/year)52872409288624505287
Cooling loads saving (%)100.045.654.646.3100.0
Annual loads (kWh)90916243672663089091
Total energy reduction (%)100.068.774.069.4100.0
Table 7. Hours of discomfort—Base case and dynamic shading case.
CaseControl StrategyThresholdHours of Discomforts with Winter Clothes (h)Hours of Discomforts with Summer Clothes (h)Hours of Discomforts with Winter or Summer Clothes (h)Total Hours of Discomfort (h)Improvement of Overheating Risk (%)
Base--222112827044207100.0
Dynamic shadingOn during schedule-17801667692413998.4
Solar450 W/m2-K202914617224212100.1
Operative temp.24 °C19441477706412798.1
Glare22222112827044207100.0
Table 8. Energy results—Base case and electrochromic cases.
CaseBaseElectrochromic Glazing
Name ECW0ECW1ECW2ECW3
Control strategy-ScheduleSolarOperative temp.Glare
Threshold- 450 W/m2-K24 °C22
EnergyHeating demand (kWh/year)38043824396938453804
Heating loads reduction (%)100.0100.5104.3101.1100.0
Cooling demand (kWh/year)52872880260129225287
Cooling loads reduction (%)100.054.549.255.3100.0
Annual loads (kWh)90916704657067679091
Total energy reduction (%)100.073.772.374.49091.0
Table 9. Hours of discomfort—Base case and electrochromic cases.
CaseControl StrategyThresholdHours of Discomforts with Winter Clothes (h)Hours of Discomforts with Summer Clothes (h)Hours of Discomforts with Winter or Summer Clothes (h)Total Hours of Discomfort (h)Improvement of Overheating Risk (%)
Base--222112827044207100.0
On during schedule-18641555655407496.8
ElectrochromicSolar450 W/m2-K197416648624500107.0
Operative temp.24 °C20781360702414098,4
Glare22222112827044207100.0
Table 10. Energy results—Base case and double-skin façade case.
CaseBaseBIPV Double-Skin Façade
Name DSF0DSF1DSF2
Control strategy--ScheduleOperative temp.
Threshold---24 °C
EnergyHeating demand (kWh/year)3804266327882704
Heating loads saving (%)100.070.073.371.1
Cooling demand (kWh/year)5287571050265329
Cooling loads saving (%)100.0108.095.1100.8
Annual loads (kWh)9091837378148033
Total energy reduction (%)100.092.186.088.4
Table 11. Hours of discomfort—Base case and BIPV double-skin façade case.
CaseControl StrategyThresholdHours of Discomforts with Winter Clothes (h)Hours of Discomforts with Summer Clothes (h)Hours of Discomforts with Winter or Summer Clothes (h)Total Hours of Discomfort (h)Improving of Overheating Risk (%)
Base--222112827044207100.0
BIPV double-skin façade--22021014432364886.7
On during schedule(10 ac/h)21881071458371788.4
Operative temp.24 °C; 10 ac/h21971015432364486.6
Table 12. Energy results—Base case and ventilated closed cavity façade cases.
CaseBaseClosed Cavity Façade
Name DSFV1DSFV2
Control strategy-Mech.—OTHybrid—OT
Threshold-24 °C24 °C
EnergyHeating demand (kWh/year)380427052723
Heating loads saving (%)100.071.171.6
Cooling demand (kWh/year)528753295100
Cooling loads saving (%)100.0100.896.5
Annual loads (kWh)909180347823
Total energy reduction (%)100.088.486.1
Table 13. Hours of discomfort—Base case and ventilated closed cavity façade case.
CaseControl StrategyThresholdHours of Discomforts with Winter Clothes (h)Hours of Discomforts with Summer Clothes (h)Hours of Discomforts with Winter or Summer Clothes (h)Total Hours of Discomfort (h)Improving of Overheating Risk (%)
Base--222112827044207100.0
Double-skin ventilated façadeOperative temp.24 °C21961014431364186.5
Operative temp.24 °C21961014432364286.6
Table 14. Sensitivity analysis—DS 1—solar threshold variation improvement.
DiminutiveCaseFixed ParameterParameter VariedAnnual Loads (kWh)Total Loads Reduction %Total Hours of Discomfort (h)Overheating Risk Reduction %
Sensitivity analysis: dynamic shading—Solar threshold
Base caseBase 9091100.04207100.0
DS1-s150Dynamic shadingSlat properties150 W/m2-K629469.24502107.0
DS1-s300300 W/m2-K632269.54337103.1
DS1450 W/m2-K672674.04212100.1
DS1-s600600 W/m2-K785886.44214100.2
DS1-s750750 W/m2-K890197.94210100.1
Table 15. Sensitivity analysis—ECW 1—solar threshold variation improvement.
DiminutiveCaseFixed ParameterParameter VariedAnnual Loads (kWh)Total Loads Reduction %Total Hours of Discomfort (h)Overheating Risk %
Sensitivity analysis: electrochromic—Solar threshold
Base caseBase 9091100.04207100.0
ECW1-s150ElectrochromicOptical properties150 W/m2-K648971.44740112.7
ECW1-s300300 W/m2-K648071.34611109.6
ECW1450 W/m2-K657072.34500107.0
ECW1-s600600 W/m2-K687275.64475106.4
ECW1-s750750 W/m2-K721379.34493106.8
Table 16. Sensitivity analysis—ECW 2—thermal threshold variation improvement.
DiminutiveCaseFixed ParameterParameter VariedAnnual Loads (kWh)Total Loads Reduction %Total Hours of Discomfort (h)Overheating Risk %
Sensitivity analysis: electrochromic—Temperature threshold
Base caseBase 9091100.04207100.0
ECW2-t18ElectrochromicOptical properties18 °C670573.8407496.8
ECW2-t2020 °C670473.7407096.7
ECW2-t2222 °C674174.2416499.0
ECW224 °C676774.4414098.4
ECW2-t2626 °C715778.7417799.3
Publisher’s Note: MDPI stays neutral with regard to jurisdictional claims in published maps and institutional affiliations.

