
Sodium-Ion Batteries with Ti1Al1TiC1.85 MXene as Negative Electrode: Life Cycle Assessment and Life Critical Resource Use Analysis


Abstract
:1. Introduction
2. Materials and Methods
2.1. Life Cycle Assessment
2.1.1. Goal and Scope
2.1.2. Life Cycle Inventory (LCI)
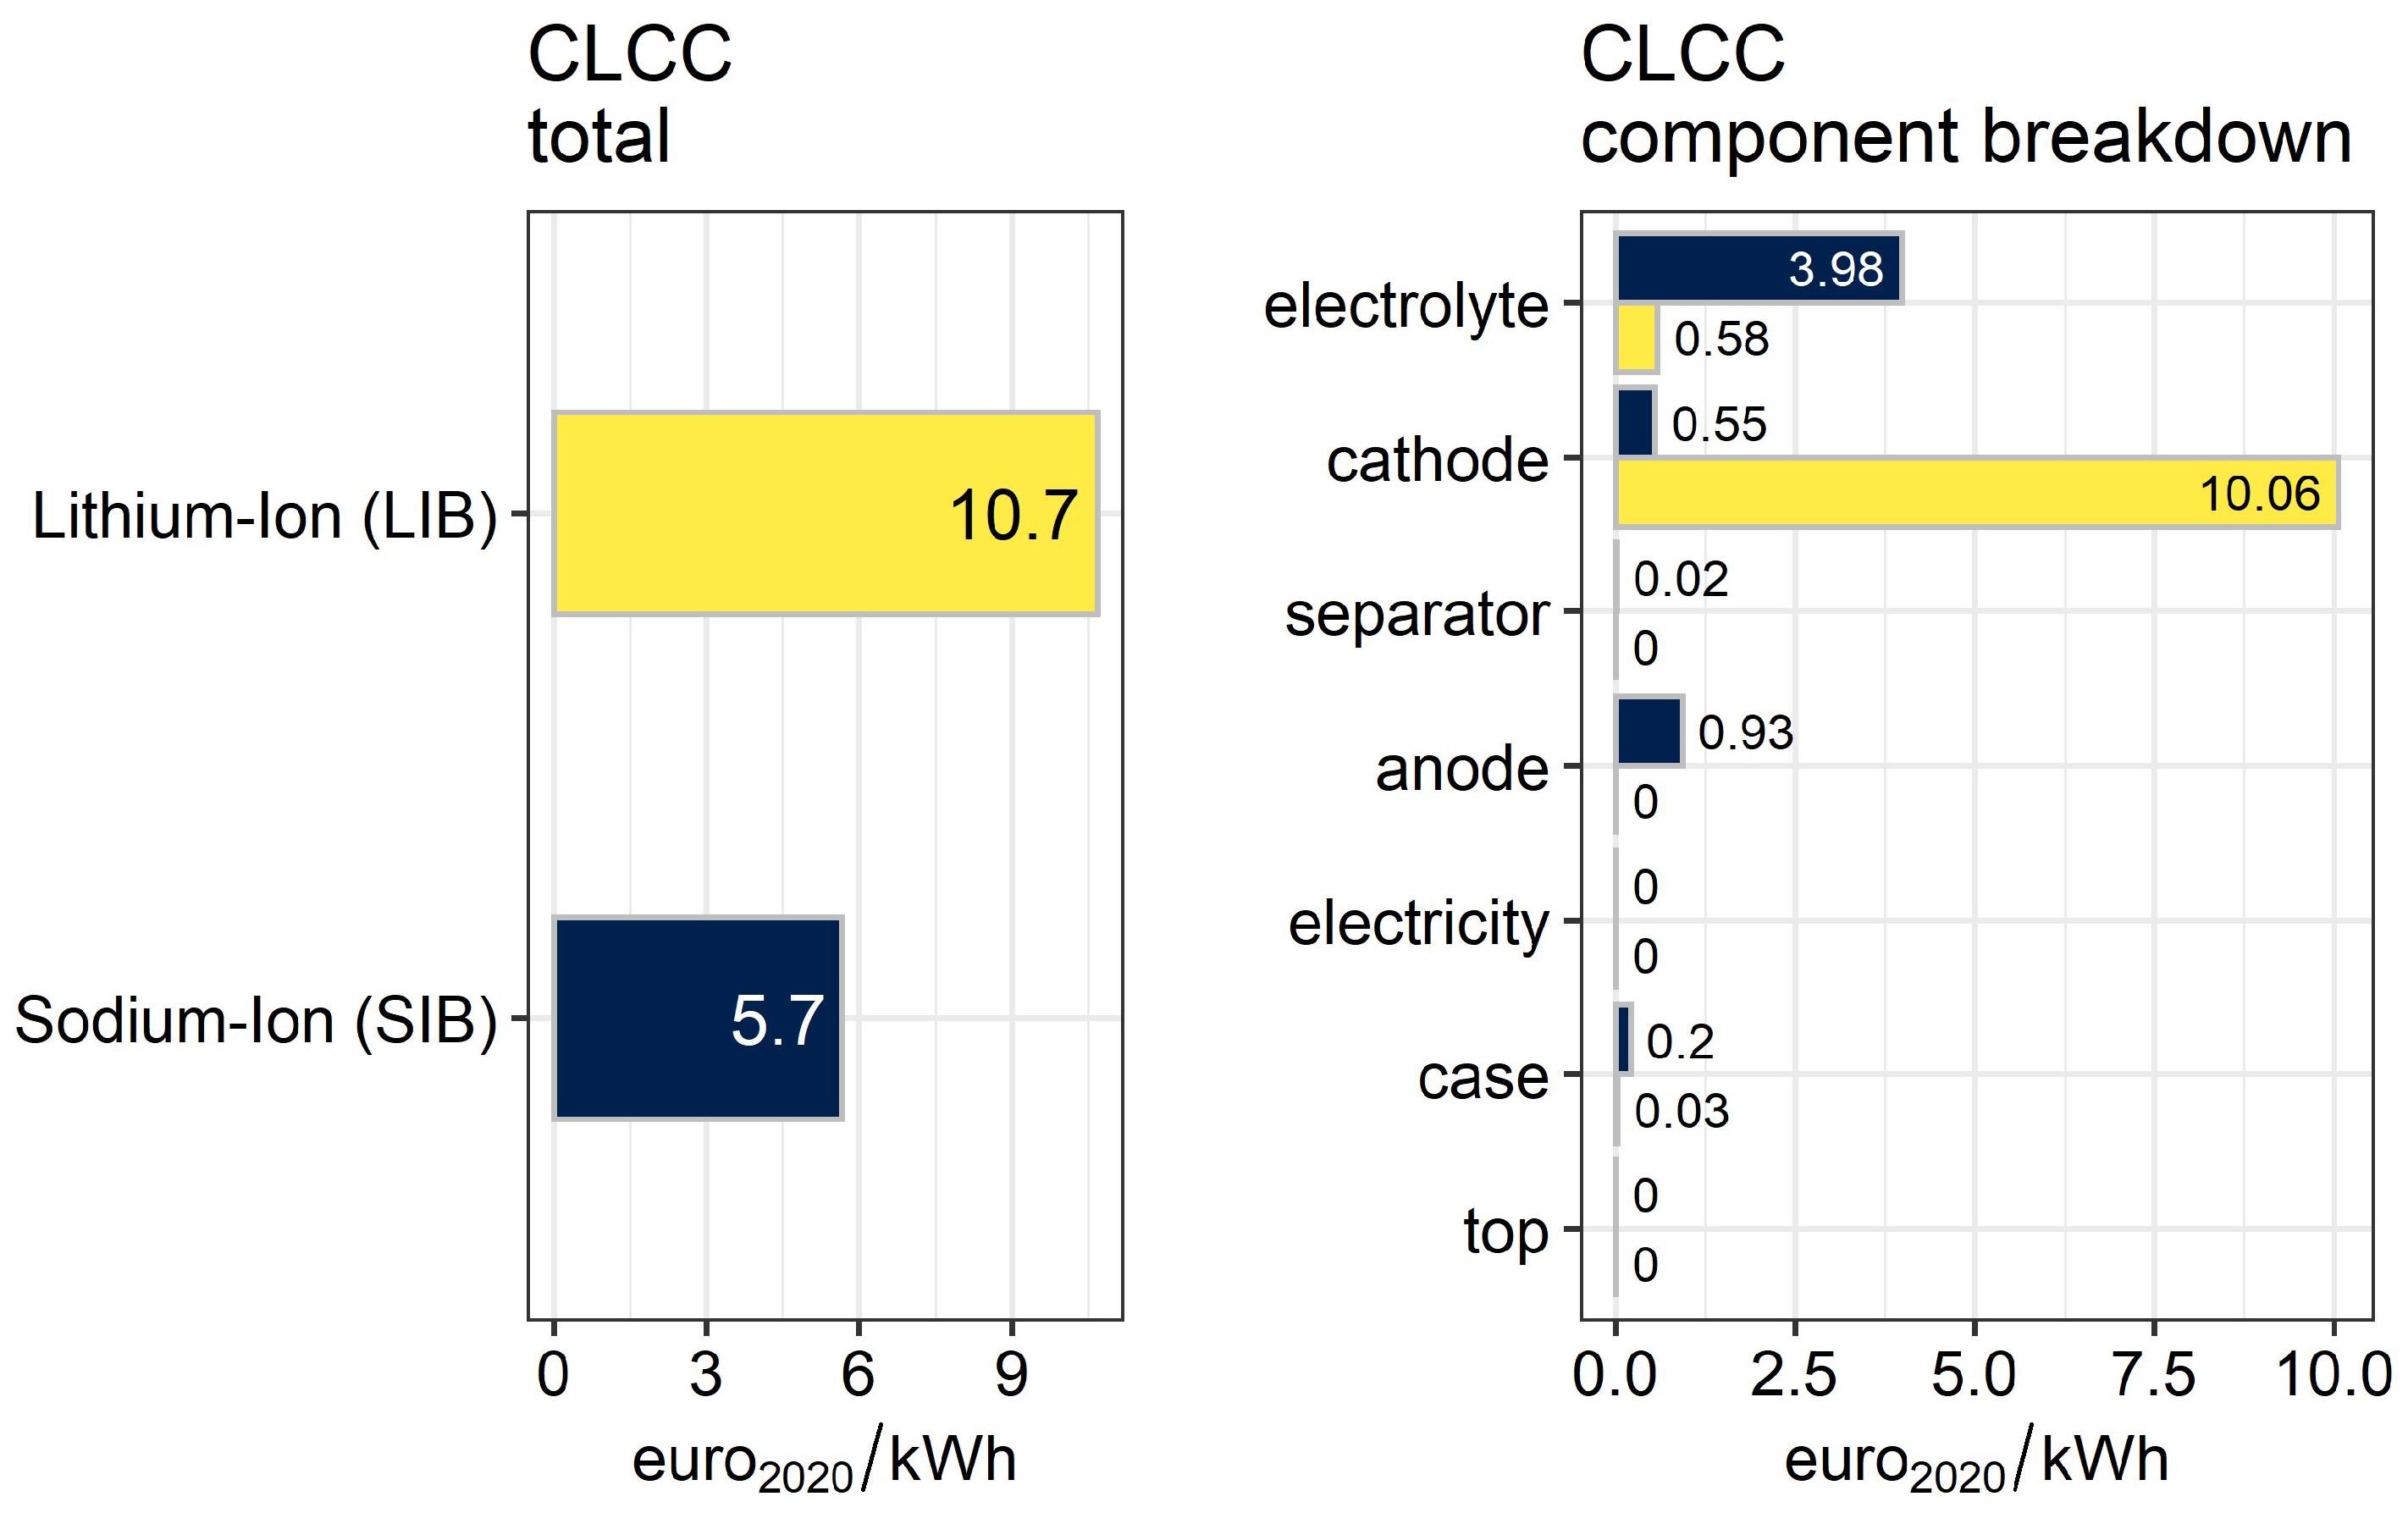
2.2. Commodity Life Cycle Cost Indicator (C-LCC)
3. Results and Discussion
3.1. Life Cycle Impact Assessment (LCIA) of Na-Ion Battery at Laboratory Scale
3.2. Comparison of Na-Ion Coin Battery (Laboratory) with Li-Ion Coin Battery (Industrial)
- For anode and cathode: the same ratio active material/binder + carbon black as industrial Li-ion cells (97% active material, 3% binder + carbon black [21]).
- The same amount of electrolyte as in [13].
- The same separator (and separator thickness) as in [13].
- The same energy consumption of the Li-ion NMC cells plus an increase of 10% (both Na-ion electrodes must be produced in the absence of water and oxygen, therefore a dry room is required (maximum 1 ppm water and 2 ppm oxygen) [20].
- Ratio (mass) of cathodic active material/anodic active material = 3 [20].
- Use of substances in the same proportion as Li-ion batteries, or stoichiometric quantity, to simulate industrial use (where the chemicals use is optimized) with an excess of 10%.
- The cathode active material weight is equal to the industrial Li cathode active material weight.
3.3. Commodity Life Cycle Cost Indicator
4. Conclusions
Supplementary Materials
Author Contributions
Funding
Acknowledgments
Conflicts of Interest
References
- Gallo, A.B.; Simões-Moreira, J.R.; Costa, H.K.M.; Santos, M.M.; Dos Santos, E.M. Energy storage in the energy transition context: A technology review. Renew. Sustain. Energy Rev. 2016, 65, 800–822. [Google Scholar] [CrossRef]
- Kittner, N.; Lill, F.; Kammen, D.M. Energy storage deployment and innovation for the clean energy transition. Nat. Energy 2017, 2, 17125. [Google Scholar] [CrossRef]
- Liu, T.; Zhang, Y.; Jiang, Z.; Zeng, X.; Ji, J.; Li, Z.; Gao, X.; Sun, M.; Lin, Z.; Ling, M.; et al. Exploring competitive features of stationary sodium ion batteries for electrochemical energy storage. Energy Environ. Sci. 2019, 12, 1512–1533. [Google Scholar] [CrossRef]
- Da Silva Lima, L.; Quartier, M.; Buchmayr, A.; Sanjuan-Delmás, D.; Laget, H.; Corbisier, D.; Mertens, J.; Dewulf, J. Life cycle assessment of lithium-ion batteries and vanadium redox flow batteries-based renewable energy storage systems. Sustain. Energy Technol. Assess. 2021, 46, 101286. [Google Scholar] [CrossRef]
- Mela, G.; Carvalho, M.L.; Temporelli, A.; Girardi, P. The Commodity Life Cycle Costing Indicator. An Economic Measure of Natural Resource Use in the Life Cycle. Sustainability 2021, 13, 4870. [Google Scholar] [CrossRef]
- ISO 14040:2006; Environmental Management—Life Cycle Assessment—Principles and Framework. ISO—The International Organization for Standardization: Geneva, Switzerland, 2006.
- ISO 14044:2006; Environmental Management—Life Cycle Assessment—Requirements and Guidelines. ISO—The International Organization for Standardization: Geneva, Switzerland, 2006.
- Gentile, A.; Ferrara, C.; Tosoni, S.; Balordi, M.; Marchionna, S.; Cernuschi, F.; Kim, M.H.; Lee, H.W.; Ruffo, R. Enhanced Functional Properties of Ti3C2Tx MXenes as Negative Electrodes in Sodium-Ion Batteries by Chemical Tuning. Small Methods 2020, 4, 2000314. [Google Scholar] [CrossRef]
- Ahmed, B.; Ghazaly, A.E.; Rosen, J. i-MXenes for energy storage and catalysis. Adv. Funct. Mater. 2020, 30, 2000894. [Google Scholar] [CrossRef]
- Ferrara, C.; Gentile, A.; Marchionna, S.; Quinzeni, I.; Fracchia, M.; Ghigna, P.; Pollastri, S.; Ritter, C.; Vanacore, G.M.; Ruffo, R. The Missing Piece: The Structure of the Ti3C2Tx MXene and Its Behavior as Negative Electrode in Sodium Ion Batteries. Nano Lett. 2021, 21, 8290–8297. [Google Scholar] [CrossRef]
- Ferrara, C.; Gentile, A.; Marchionna, S.; Ruffo, R. Ti3C2Tx MXene compounds for electrochemical energy storage. Curr. Opin. Electrochem. 2021, 29, 100764. [Google Scholar] [CrossRef]
- Temporelli, A.; Carvalho, M.L.; Girardi, P. Life cycle assessment of electric vehicle batteries: An overview of recent literature. Energies 2020, 13, 2864. [Google Scholar] [CrossRef]
- Peters, J.; Buchholz, D.; Passerini, S.; Weil, M. Life cycle assessment of sodium-ion batteries. Energy Environ. Sci. 2016, 9, 1744–1751. [Google Scholar] [CrossRef] [Green Version]
- Peters, J.F.; Abdelbaky, M.; Baumann, M.; Weil, M. A review of hard carbon anode materials for sodium-ion batteries and their environmental assessment. Matériaux Tech. 2019, 107, 503. [Google Scholar] [CrossRef]
- Peters, J.F.; Peña Cruz, A.; Weil, M. Exploring the Economic Potential of Sodium-Ion Batteries. Batteries 2019, 5, 10. [Google Scholar] [CrossRef] [Green Version]
- Vaalma, C.; Buchholz, D.; Weil, M.; Passerini, S. A cost and resource analysis of sodium-ion batteries. Nat. Rev. Mater. 2018, 3, 18013. [Google Scholar] [CrossRef]
- Benveniste Pérez, G.; Canals Casals, L.; Corchero García, C.; Amante García, B. Life Cycle Assessment of Li-Sulphur Batteries for Electric Vehicles. In Proceedings of the 32nd Electric Vehicle Symposium (EVS32), Lyon, France, 19–22 May 2019. [Google Scholar]
- Manfredi, S.; Allacker, K.; Pelletier, N.; Schau, E.; Chomkhamsri, K.; Pant, R.; Pennington, D. Comparing the European Commission product environmental footprint method with other environmental accounting methods. Int. J. Life Cycle Assess. 2015, 20, 389–404. [Google Scholar] [CrossRef]
- Lèbre, É.; Stringer, M.; Svobodova, K.; Owen, J.R.; Kemp, D.; Côte, C.; Arratia-Solar, A.; Valenta, R.K. The social and environmental complexities of extracting energy transition metals. Nat. Commun. 2020, 11, 4823. [Google Scholar] [CrossRef]
- Marchionna, S.; Balordi, M.; Quinzeni, I.; Gentile, A. Messa a Punto di MXeni Drogati o di Diversa Composizione/Funzionalizzazione; RSE: Milano, Italy, 2020. [Google Scholar]
- Carvalho, M.L.; Temporelli, A.; Girardi, P. Life Cycle Assessment of Stationary Storage Systems within the Italian Electric Network. Energies 2021, 14, 2047. [Google Scholar] [CrossRef]
- Pré Sustainability. The ReCiPe Method. 2021. Available online: https://pre-sustainability.com/articles/recipe/ (accessed on 2 January 2021).
- Vogtländer, J.; Peck, D.; Kurowicka, D. The Eco-Costs of Material Scarcity, a Resource Indicator for LCA, Derived from a Statistical Analysis on Excessive Price Peaks. Sustainability 2019, 11, 2446. [Google Scholar] [CrossRef] [Green Version]
- Klinglmair, M.; Sala, S.; Brandão, M. Assessing resource depletion in LCA: A review of methods and methodological issues. Int. J. Life Cycle Assess. 2014, 19, 580–592. [Google Scholar] [CrossRef]
- Mancini, L.; De Camillis, C.; Pennington, D. Pennington, Security of Supply and Scarcity of Raw Materials: Towards a Methodological Framework for Sustainability Assessment; Publications Office of the European Union: Luxembourg, 2013. [Google Scholar]
- European Commission. Critical Raw Materials. 2021. Available online: https://ec.europa.eu/growth/sectors/raw-materials/specific-interest/critical_en (accessed on 2 January 2021).
- Joint Research Centre—Institute for Environment and Sustainability. ILCD Handbook—International Reference Life Cycle Data System; European Commission: Brussels, Belgium, 2010. [Google Scholar]
- International Monetary Fund. Primary Commodity Prices. 2021. Available online: https://www.imf.org/en/Research/commodity-prices (accessed on 2 November 2021).
- Eurostat. Home—Eurostat. 2021. Available online: https://ec.europa.eu/eurostat/web/main/home (accessed on 31 March 2021).
- United Nations. UN Comtrade Database. 2020. Available online: https://comtrade.un.org/ (accessed on 2 March 2021).
- Eurostat. Comext Database. 2021. Available online: http://epp.eurostat.ec.europa.eu/newxtweb/ (accessed on 11 February 2021).
- United States International Trade Commission (USITC). Foreign Trade. 2021. Available online: https://dataweb.usitc.gov/ (accessed on 1 March 2021).
- Buyle, M.; Audenaert, A.; Billen, P.; Boonen, K.; Van Passel, S. The Future of Ex-Ante LCA? Lessons Learned and Practical Recommendations. Sustainability 2019, 11, 5456. [Google Scholar] [CrossRef] [Green Version]
- Cucurachi, S.; van der Giesen, C.; Guinée, J. Ex-ante LCA of emerging technologies. Procedia CIRP 2018, 69, 463–468. [Google Scholar] [CrossRef]
- Van der Giesen, C.; Cucurachi, S.; Guinée, J.; Kramer, G.J.; Tukker, A. A critical view on the current application of LCA for new technologies and recommendations for improved practice. J. Clean. Prod. 2020, 259, 120904. [Google Scholar] [CrossRef]
- Gargiulo, A.; Carvalho, M.L.; Girardi, P. Life Cycle Assessment of Italian Electricity Scenarios to 2030. Energies 2020, 13, 3852. [Google Scholar] [CrossRef]
- Jungbluth, N. Life Cycle Inventory of Sodium Acetate and Expanded Graphite; ESU-Servives Ltd.: Schaffhausen, Switzerland, 2008. [Google Scholar]
- Dai, Q. Life Cycle Assessment of Natural Gas Utilization in Light-Duty Passenger Vehicles; Civil and Environmental Engineering Ann Arbor, University of Michigan: Ann Arbor, MI, USA, 2014. [Google Scholar]
- Majeau-Bettez, G.; Hawkins, T.R.; Strømman, A.H. Life cycle environmental assessment of lithium-ion and nickel metal hydride batteries for plug-in hybrid and battery electric vehicles. Environ. Sci. Technol. 2011, 45, 4548–4554. [Google Scholar] [CrossRef] [PubMed]
- Ellingsen, L.A.W.; Majeau-Bettez, G.; Singh, B.; Srivastava, A.K.; Valøen, L.O.; Strømman, A.H. Life Cycle Assessment of a Lithium-Ion Battery Vehicle Pack. J. Ind. Ecol. 2014, 18, 113–124. [Google Scholar] [CrossRef] [Green Version]


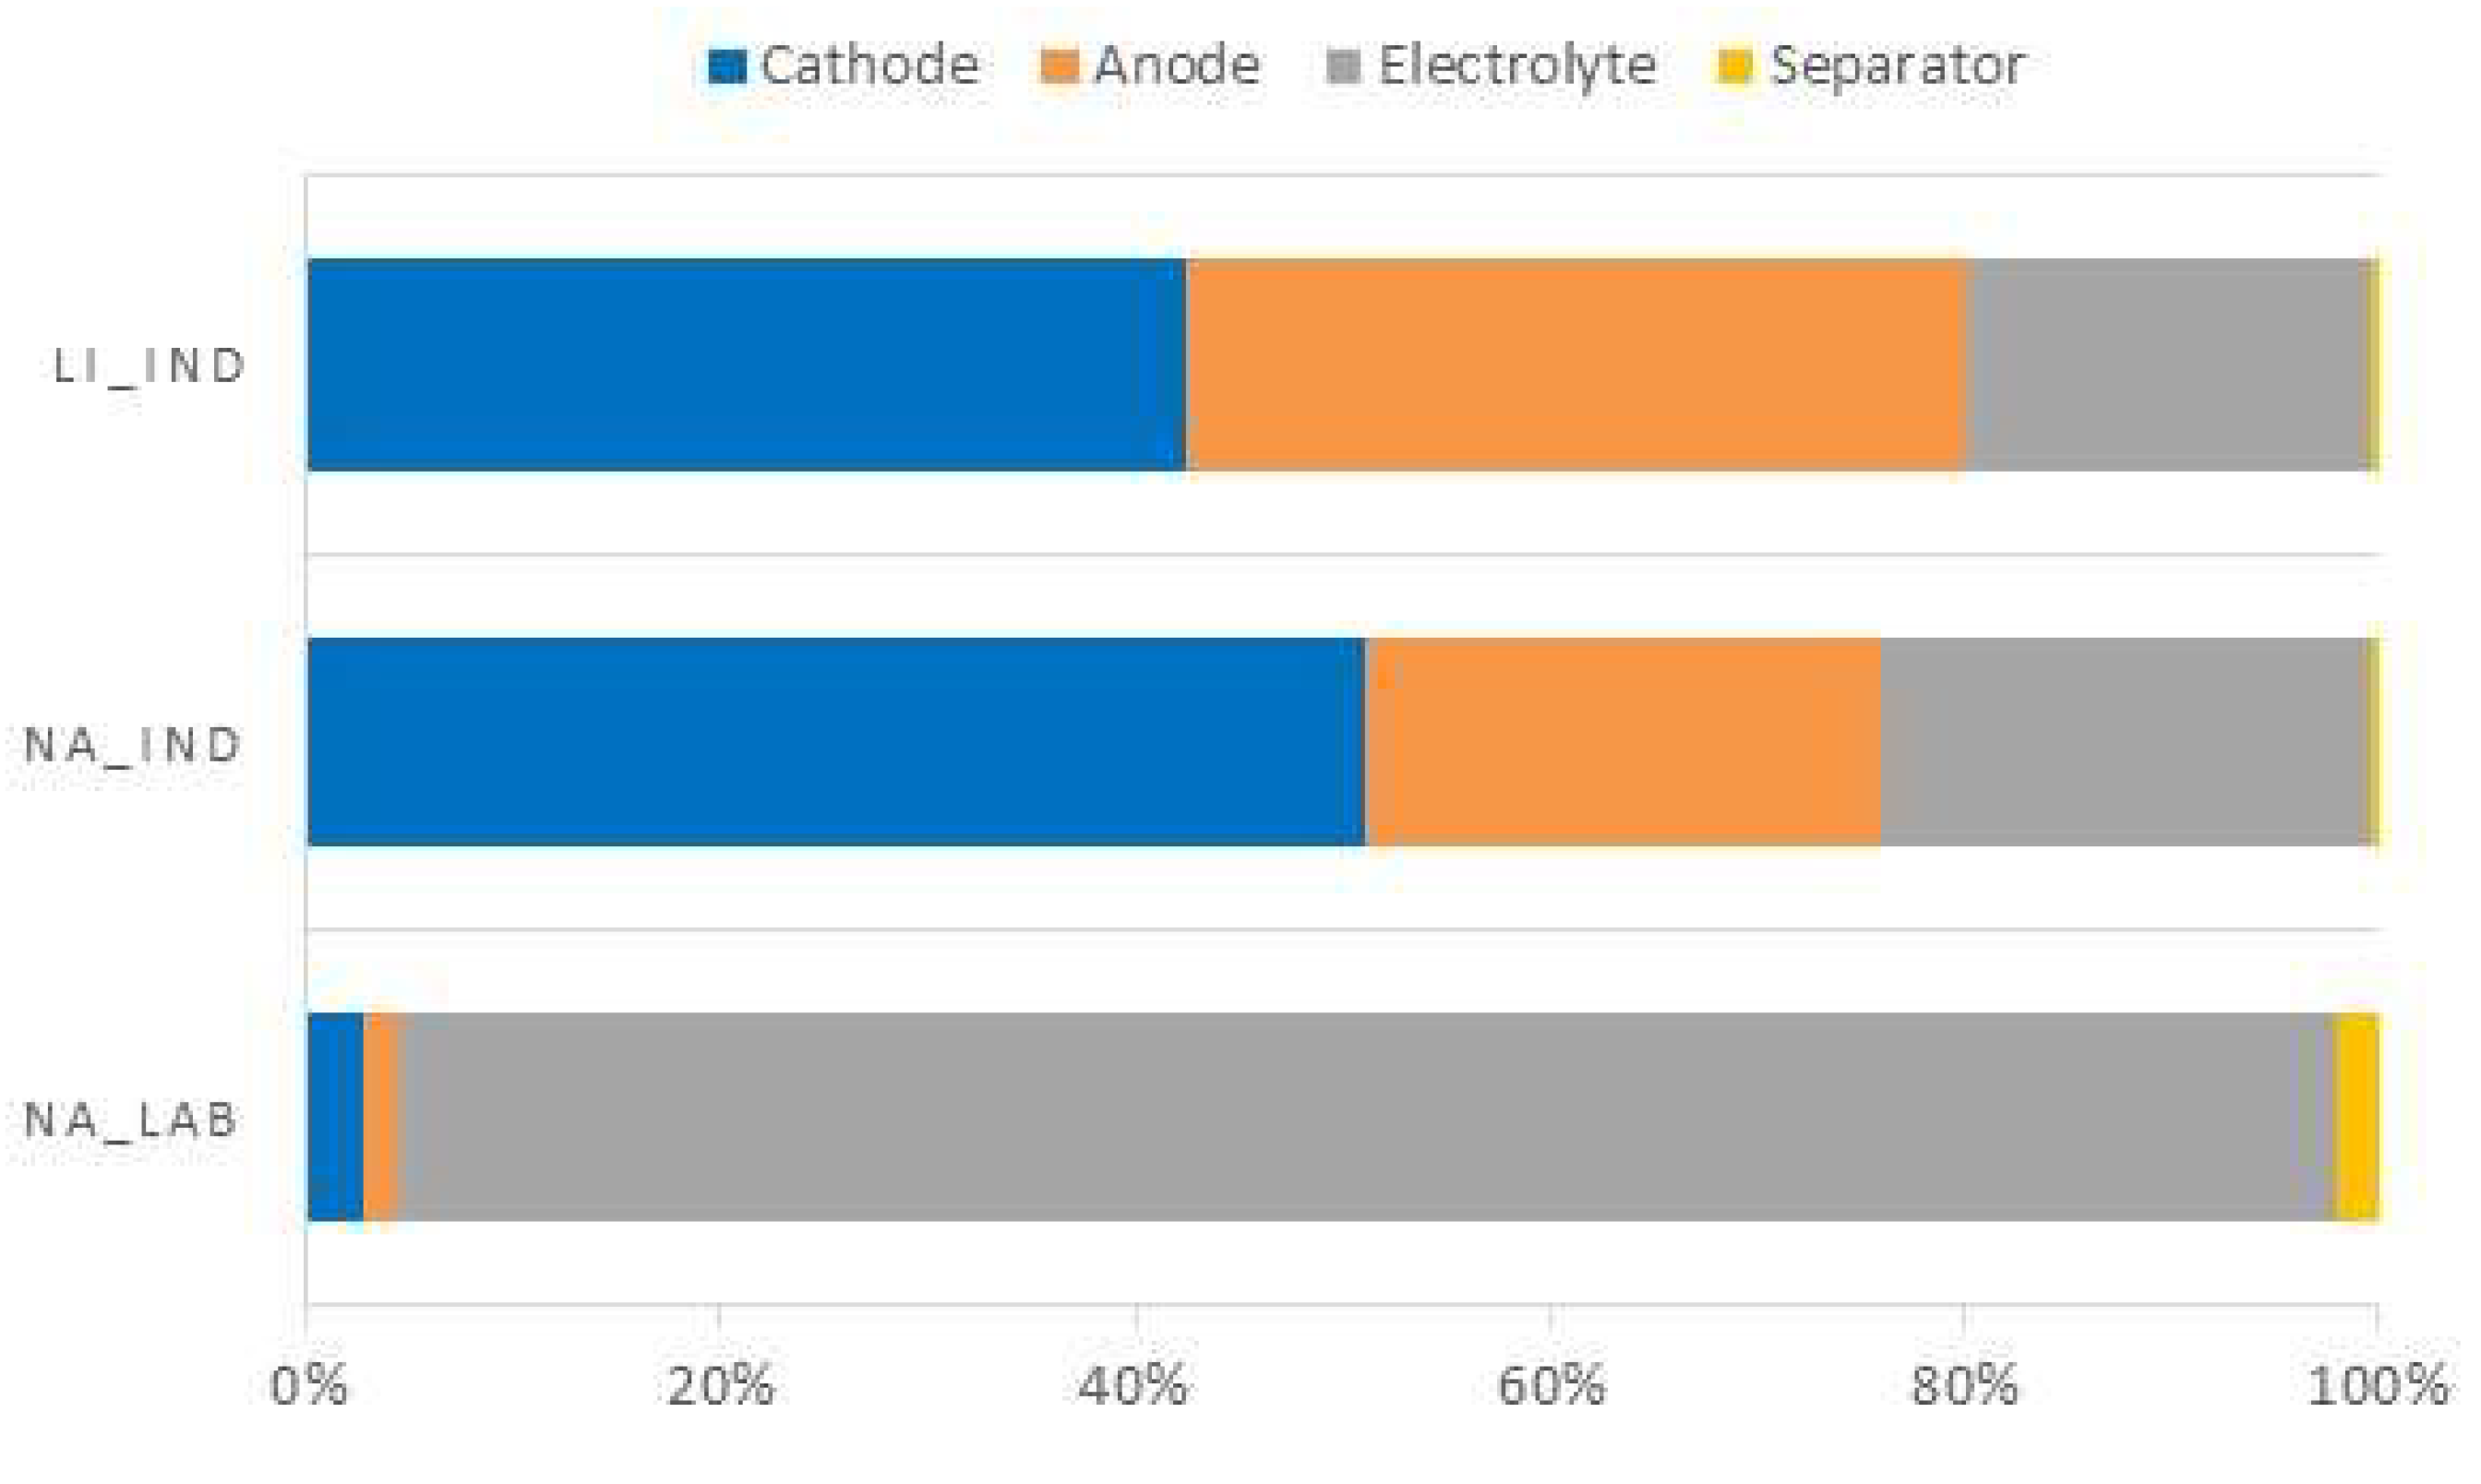
| Battery | Cathode | Anode | Cell Voltage | Nominal Capacity | Weight | Battery Energy Density |
|---|---|---|---|---|---|---|
| V | mAhgMxene−1—Na Ah-Li | g | kWh kg−1 | |||
| Na_Lab | Na0.44MnO2 | Mxene_Ti1Al1TiC1.85 | 2.0 | 110 | 7.18 | 1.26 × 10⁻⁴ |
| Na_Ind | Na0.44MnO2 | Mxene_Ti1Al1TiC1.85 | 2.0 | 110 | 6.00 | 4.29 × 10⁻⁴ |
| Li_Ind | LiNi0.5Mn0.3C0.2O2 | Graphite | 3.6 | 20 | 6.02 | 3.37 × 10⁻³ |
| Na | Li | |||||
|---|---|---|---|---|---|---|
| 1 Coin | Laboratory | % | Industrial | % | Industrial | % |
| Cathode | 0.0355 | 0.49% | 0.0468 | 0.78% | 0.0468 | 0.78% |
| Active material | 0.0172 | 0.24% | 0.0351 | 0.58% | 0.0344 | 0.57% |
| Binder + carbon black | 0.0043 | 0.06% | 0.0011 | 0.02% | 0.0018 | 0.03% |
| Al | 0.014 | 0.20% | 0.0106 | 0.18% | 0.0106 | 0.18% |
| Anode | 0.0191 | 0.27% | 0.0227 | 0.38% | 0.0414 | 0.69% |
| Active material | 0.0041 | 0.06% | 0.0117 | 0.19% | 0.0223 | 0.37% |
| Binder + carbon black | 0.001 | 0.01% | 0.0004 | 0.01% | 0.0009 | 0.01% |
| Al (Na) or Cu (Li) | 0.014 | 0.20% | 0.0106 | 0.18% | 0.0182 | 0.30% |
| Electrolyte | 1.1845 | 16.51% | 0.0217 | 0.36% | 0.0217 | 0.36% |
| Separator | 0.0268 | 0.37% | 0.0004 | 0.01% | 0.0004 | 0.01% |
| Coin (case) | 5.91 | 82.36% | 5.91 | 98.47% | 5.91 | 98.17% |
| Total weight | 7.1758 | 100% | 6.0016 | 100% | 6.0204 | 100% |
| Weight excluding case | 1.2658 | - | 0.0916 | - | 0.1104 | - |
| Na_Lab | Na_Ind | Li_Ind | ||
|---|---|---|---|---|
| Cathode | Active material | Primary data | Active material weight is the same as in the Li_Ind | Disk weight: primary data |
| 97% active material | Active material balance as Li-ion batteries reported by [21] | |||
| Binder + carbon black | 3% binder + carbon black | Binder + carbon black, balance as Li-ion batteries reported by [21] | ||
| NMP weight is the same as in the Li_Ind | ||||
| Al | Al thickness is the same as in the Li_Ind | Al thickness calculated assuming the same ratio Al thickness weight/cathode weight as Li-ion batteries reported by [21] | ||
| Anode | Active material | Primary data | Ratio cathodic active material/anode active material = 3 | Disk weight: primary data |
| 97% active material | Active material balance as Li-ion batteries reported by [21] | |||
| HF weight = stochiometric weight + 10% | ||||
| Binder + carbon black | 3% binder + carbon black | Binder + carbon black, balance as Li-ion batteries reported by [21] | ||
| NMP weight is the same as in the Li_Ind | ||||
| Al (Na) | Al thickness is the same as in the Li_Ind | Cu disk thickness from primary data | ||
| Cu (Li) | ||||
| Electrolyte | Primary data | The same weight as in the Li_Ind | Weight considering the same ratio electrolyte/cell Weight of the Li-ion batteries reported by [21] | |
| Separator | Primary data | The same weight as in the Li_Ind | Weight considering the same ratio separtor/cell Weight of the Li-ion batteries reported by [21] | |
| Industrial separator type as the one reported by [13] | ||||
| Coin (case) | Primary data | |||
| Energy consumption | Monitoring | As Li-ion cell production reported by [21] + 10% for dry room process | As Li-ion cell production reported by [21] | |
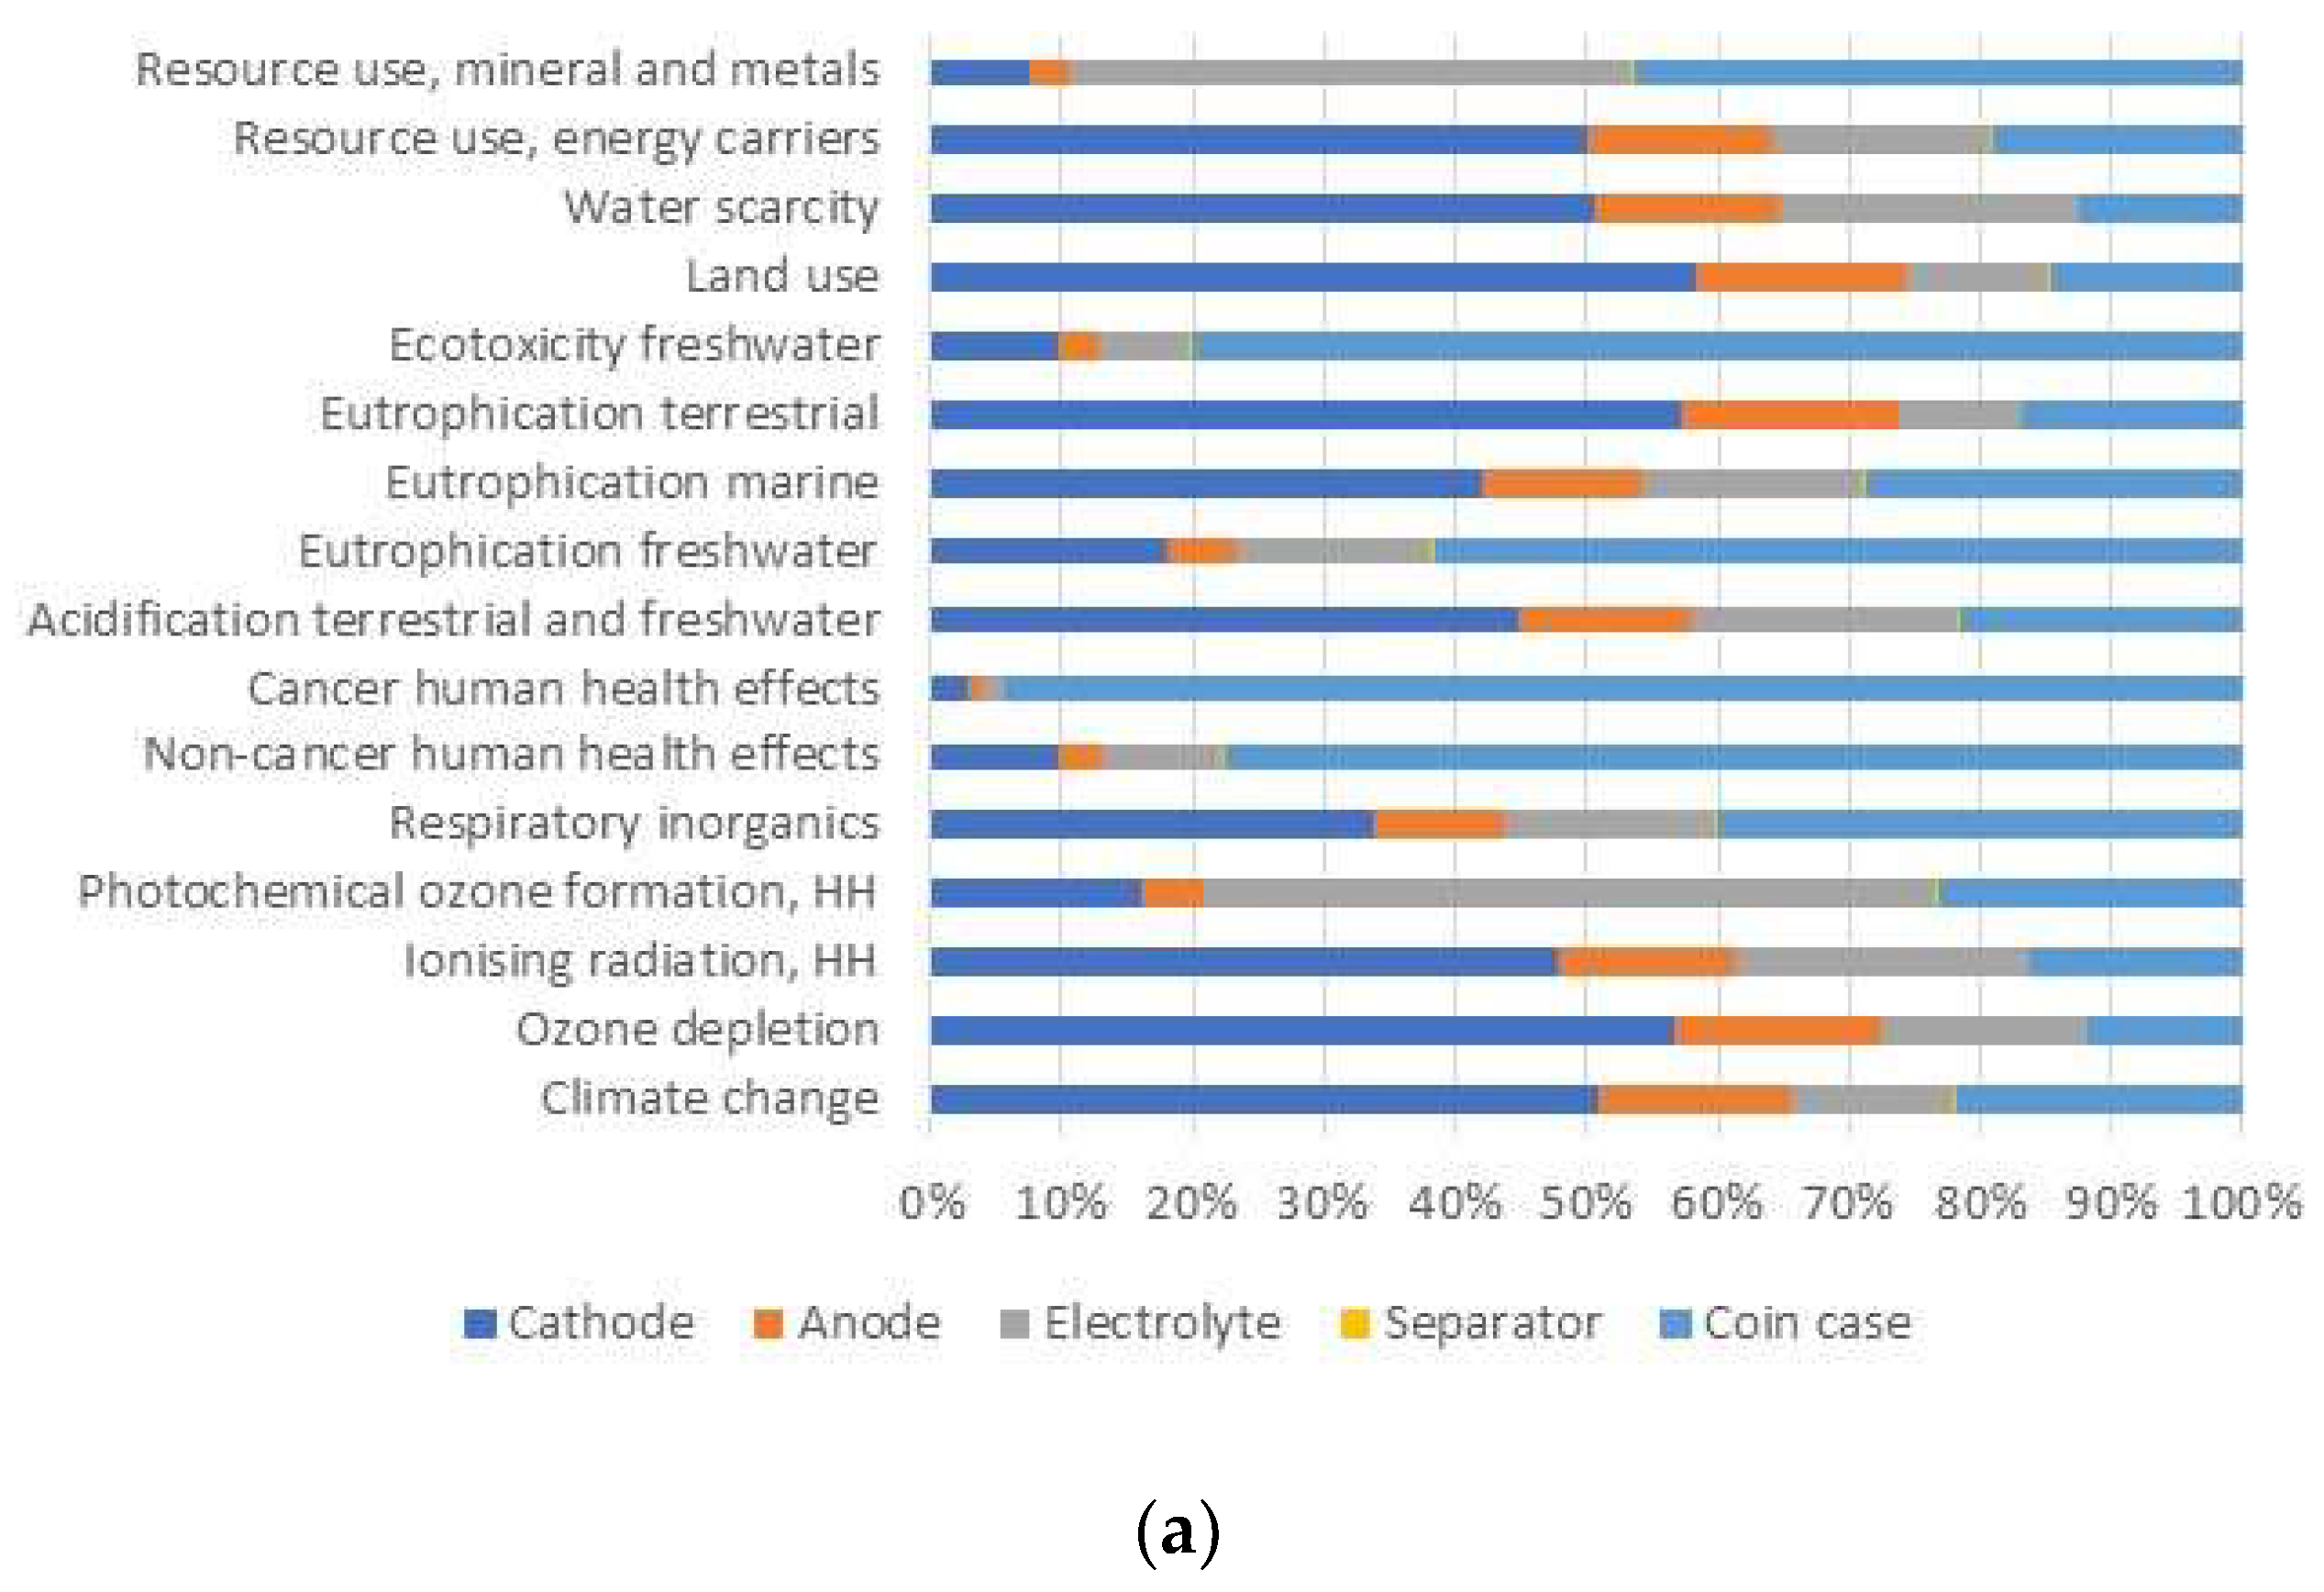
| Impact Categories | Units | Total |
|---|---|---|
| Climate change | kg CO2 eq | 5.56 × 10⁴ |
| Ozone depletion | kg CFC11 eq | 5.69 × 10⁻³ |
| Ionizing radiation, HH | kBq U-235 eq | 1.67 × 10³ |
| Photochemical ozone formation, HH | kg NMVOC eq | 2.25 × 10² |
| Respiratory inorganics | disease inc. | 2.56 × 10⁻³ |
| Non-cancer human health effects | CTUh | 1.07 × 10⁻² |
| Cancer human health effects | CTUh | 3.87 × 10⁻³ |
| Acidification terrestrial and freshwater | mol H+ eq | 3.14 × 10² |
| Eutrophication freshwater | kg P eq | 4.53 |
| Eutrophication marine | kg N eq | 3.86 × 10 |
| Eutrophication terrestrial | mol N eq | 7.71 × 10² |
| Ecotoxicity freshwater | CTUe | 5.37 × 10⁴ |
| Land use | Pt | 4.84 × 10⁵ |
| Water scarcity | m3 depriv. | 2.17 × 10⁴ |
| Resource use, energy carriers | MJ | 6.92 × 10⁵ |
| Resource use, mineral and metals | kg Sb eq | 3.05 × 10⁻¹ |
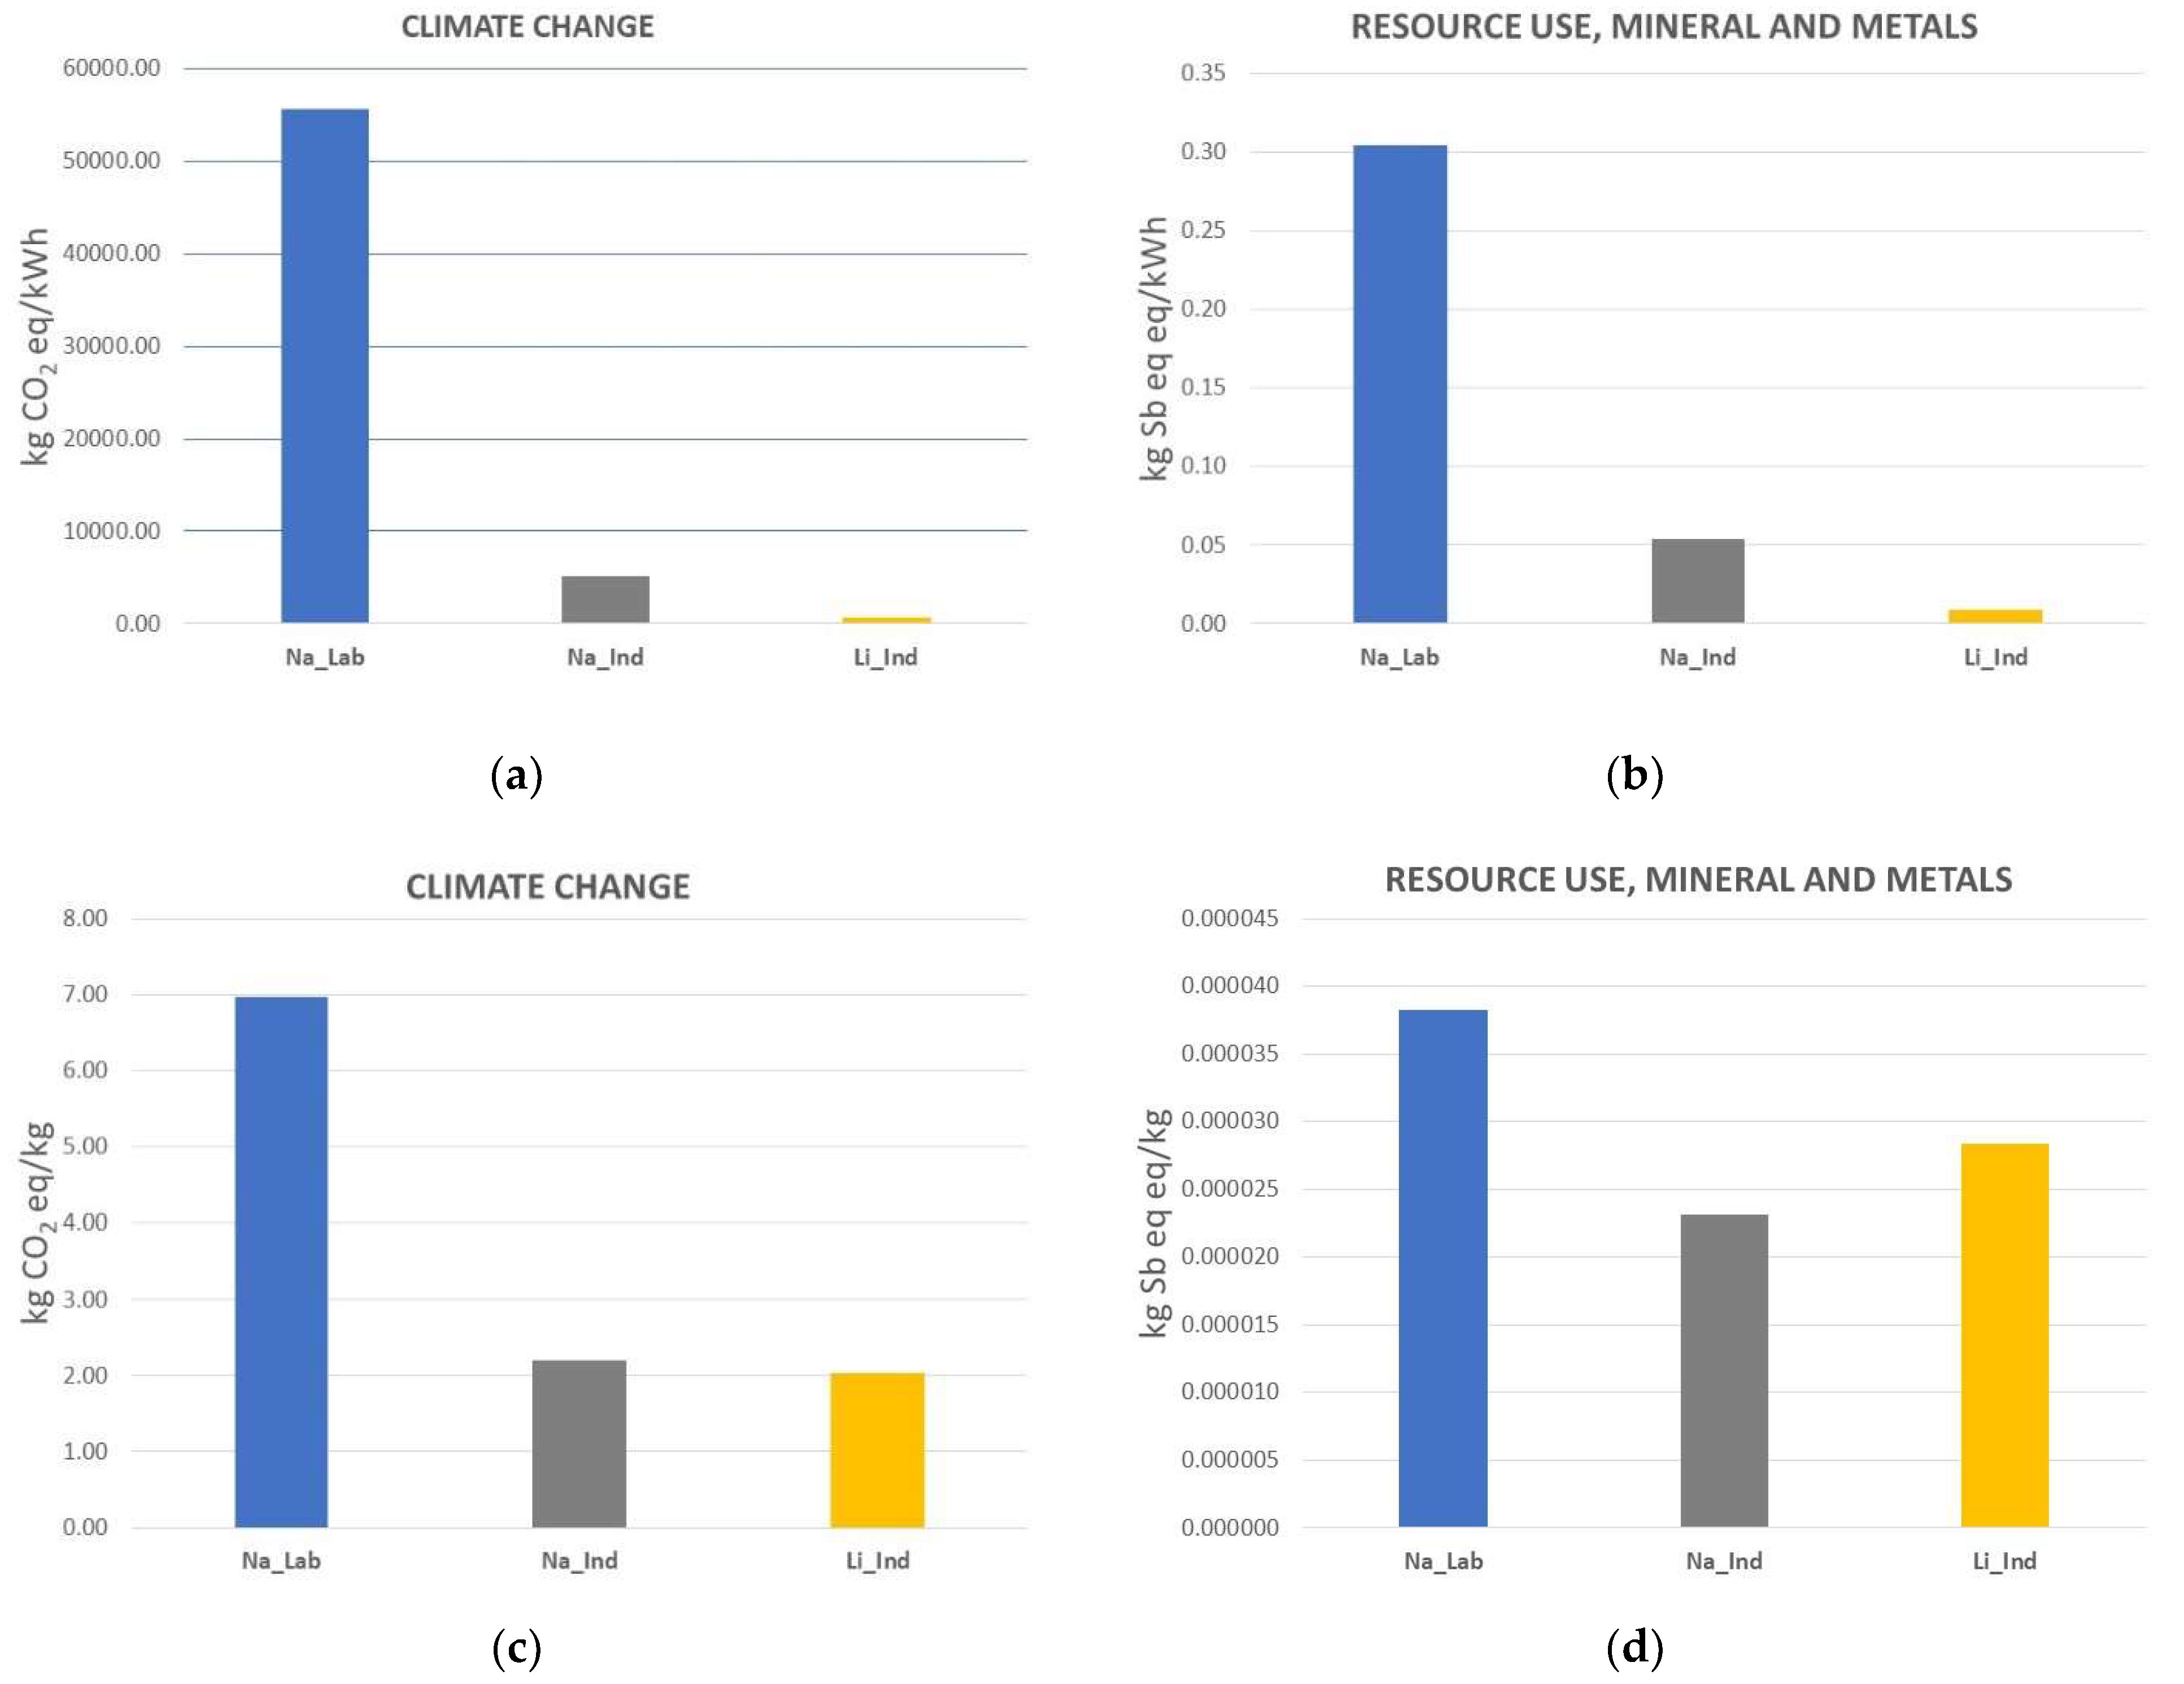
| Impact Categories | Units | Na_Lab | Na_Ind | Li_Ind |
|---|---|---|---|---|
| Climate change | kg CO2 eq | 5.56 × 10⁴ | 5.15 × 10³ | 6.15 × 10² |
| Ozone depletion | kg CFC11 eq | 5.69 × 10⁻³ | 3.38 × 10⁻⁴ | 4.59 × 10⁻⁵ |
| Ionizing radiation, HH | kBq U-235 eq | 1.67 × 10³ | 1.25 × 10² | 1.70 × 10 |
| Photochemical ozone formation, HH | kg NMVOC eq | 2.25 × 10² | 2.18 × 10 | 2.69 |
| Respiratory inorganics | disease inc. | 2.56 × 10⁻³ | 4.18 × 10⁻⁴ | 5.09 × 10⁻⁵ |
| Non-cancer human health effects | CTUh | 1.07 × 10⁻² | 2.99 × 10⁻³ | 3.86 × 10⁻⁴ |
| Cancer human health effects | CTUh | 3.87 × 10⁻³ | 1.30 × 10⁻³ | 1.64 × 10⁻⁴ |
| Acidification terrestrial and freshwater | mol H+ eq | 3.14 × 10² | 3.10 × 10 | 4.69 |
| Eutrophication freshwater | kg P eq | 4.53 | 1.04 | 1.49 × 10⁻¹ |
| Eutrophication marine | kg N eq | 3.86 × 10 | 5.09 | 5.94 × 10⁻¹ |
| Eutrophication terrestrial | mol N eq | 7.71 × 10² | 5.52 × 10 | 7.03 × 10 |
| Ecotoxicity freshwater | CTUe | 5.37 × 10⁴ | 1.60 × 10⁴ | 2.57 × 10³ |
| Land use | Pt | 4.84 × 10⁵ | 3.83 × 10⁴ | 3.92 × 10³ |
| Water scarcity | m3 depriv. | 2.17 × 10⁴ | 1.58 × 10³ | 1.53 × 10² |
| Resource use, energy carriers | MJ | 6.92 × 10⁵ | 5.71 × 10⁴ | 7.30 × 10³ |
| Resource use, mineral and metals | kg Sb eq | 3.05 × 10⁻¹ | 5.39 × 10⁻² | 8.54 × 10⁻³ |
Publisher’s Note: MDPI stays neutral with regard to jurisdictional claims in published maps and institutional affiliations. |
© 2022 by the authors. Licensee MDPI, Basel, Switzerland. This article is an open access article distributed under the terms and conditions of the Creative Commons Attribution (CC BY) license (https://creativecommons.org/licenses/by/4.0/).
Share and Cite
Carvalho, M.L.; Mela, G.; Temporelli, A.; Brivio, E.; Girardi, P. Sodium-Ion Batteries with Ti1Al1TiC1.85 MXene as Negative Electrode: Life Cycle Assessment and Life Critical Resource Use Analysis. Sustainability 2022, 14, 5976. https://doi.org/10.3390/su14105976
Carvalho ML, Mela G, Temporelli A, Brivio E, Girardi P. Sodium-Ion Batteries with Ti1Al1TiC1.85 MXene as Negative Electrode: Life Cycle Assessment and Life Critical Resource Use Analysis. Sustainability. 2022; 14(10):5976. https://doi.org/10.3390/su14105976
Chicago/Turabian StyleCarvalho, Maria Leonor, Giulio Mela, Andrea Temporelli, Elisabetta Brivio, and Pierpaolo Girardi. 2022. "Sodium-Ion Batteries with Ti1Al1TiC1.85 MXene as Negative Electrode: Life Cycle Assessment and Life Critical Resource Use Analysis" Sustainability 14, no. 10: 5976. https://doi.org/10.3390/su14105976